Article

Pasture Productivity Assessment under Mob Grazing and Fertility Management Using Satellite and UAS Imagery

by
Worasit Sangjan
1,
Lynne A. Carpenter-Boggs
2,
Tipton D. Hudson
3 and
Sindhuja Sankaran
1,*
1
Department of Biological Systems Engineering, Washington State University, Pullman, WA 99164, USA
2
Department of Crop and Soil Sciences, Washington State University, Pullman, WA 99164, USA
3
Department of Animal Science, Washington State University Extension, Kittitas County, Ellensburg, WA 98926, USA
*
Author to whom correspondence should be addressed.
Drones 2022, 6(9), 232; https://doi.org/10.3390/drones6090232
Submission received: 26 July 2022 / Revised: 27 August 2022 / Accepted: 28 August 2022 / Published: 2 September 2022
(This article belongs to the Special Issue Feature Papers of Drones)

Abstract

:
Pasture management approaches can determine the productivity, sustainability, and ecological balance of livestock production. Sensing techniques potentially provide methods to assess the performance of different grazing practices that are more labor and time efficient than traditional methods (e.g., soil and crop sampling). This study utilized high-resolution satellite and unmanned aerial system (UAS) imagery to evaluate vegetation characteristics of a pasture field location with two grazing densities (low and high, applied in the years 2015–2019) and four fertility treatments (control, manure, mineral, and compost tea, applied annually in the years 2015–2019). The pasture productivity was assessed through satellite imagery annually from the years 2017 to 2019. The relation and variation within and between the years were evaluated using vegetation indices extracted from satellite and UAS imagery. The data from the two sensing systems (satellite and UAS) demonstrated that grazing density showed a significant effect (p < 0.05) on pasture crop status in 2019. Furthermore, the mean vegetation index data extracted from satellite and UAS imagery (2019) had a high correlation (r ≥ 0.78, p < 0.001). These results show the potential of utilizing satellite and UAS imagery for crop productivity assessment applications in small to medium pasture research and management.

1. Introduction

Pasture management is vital to ensure adequate forage quantity and quality in support of domestic animal production. In addition, several countries have utilized the integration of livestock into cropping systems to contribute to the ecological sustainability of agriculture [1,2,3,4]. Domestic livestock is grown in pastures, grasslands, and natural areas; well-managed grazing results in reducing soil erosion from tillage and heavy grazing, improving soil fertility through the application of manure, maintaining ruminants’ natural digestive systems, and converting otherwise unusable plant material into more nutritious animal products, such as meat and milk [5,6,7].
Livestock grazing over a large area requires dynamic decision-making to appropriately allocate pasture forage for animals; this must consider pasture growth’s spatial and temporal variation associated mainly with the weather, soil nutrients, and grazing management [8,9]. Systematic monitoring of plant community and soil health to inform this decision-making in larger grazed areas can be time-consuming and labor-intensive. Moreover, destructive sampling can limit the amount of vegetation available as animal feed. Thus, novel methods and techniques to gather information on the forage quality of paddocks using less labor could improve the management of large swaths of land [10,11].
Remote sensing technologies offer distinctive advantages, providing high spatial and temporal resolutions; these techniques are inexpensive, time-effective, non-destructive, and applicable in areas inaccessible to humans [12,13,14,15]. Satellite and unmanned aerial system (UAS) are the typical platforms used for acquiring remotely-sensed imagery [16,17]. Applications include grassland vegetation mapping and phenomena detection related to crop-livestock research/management, such as yield and biomass at large spatial scales, to optimize process/output efficiency [18,19].
Satellite imagery has been commonly utilized to observe large pastures, such as advanced very high-resolution radiometer–AVHRR [20,21], moderate resolution imaging spectroradiometer–MODIS [22,23], the Landsat fleet [24,25], and Sentinel-2 [26,27]. In addition, synthetic aperture radar (SAR) sensors have also been applied from TerraSAR-X [28,29] and Sentinel-1 sources [30,31]. UAS-mounted cameras/sensors can offer high-resolution spectral data, providing more details to describe the plant/crop status in the field. Nevertheless, the issue of coverage area and the efficiency of resource utilization (personnel, travel) for continuous monitoring restrict the wide usage of UAS applications in rangeland systems [32,33]. In the same way, although the satellite platform can provide medium to high temporal resolution (~1–15 days), the spatial resolution is inadequate to delineate forage performances of small to medium pasture parcels (<1 ha) [34,35]. This research, therefore, aims to expand our understanding of the inter-relationships between these two remote sensing data for productivity evaluation in small to medium-sized pasture paddocks.
In this study, the primary objective was to utilize remotely sensed indices derived from satellite and UAS imagery to assess the biophysical connections/transitions of diverse grazing density and fertility management on a sustainably managed ranch pasture. The specific goals were to (1) examine the effects of two strategies of planned grazing management differing by the density and timing, and four soil fertility treatments on pasture productivity through replicated research, applying related remotely sensed data to investigate the sensitivity/quality of the two sensing platforms for estimating pasture biophysical changes; and (2) to evaluate relationships between digital traits extracted from satellite and UAS data to determine the applicability of different remote sensing platforms in small to medium-sized pasture paddocks for pasture characterization, research, and management.

2. Materials and Methods
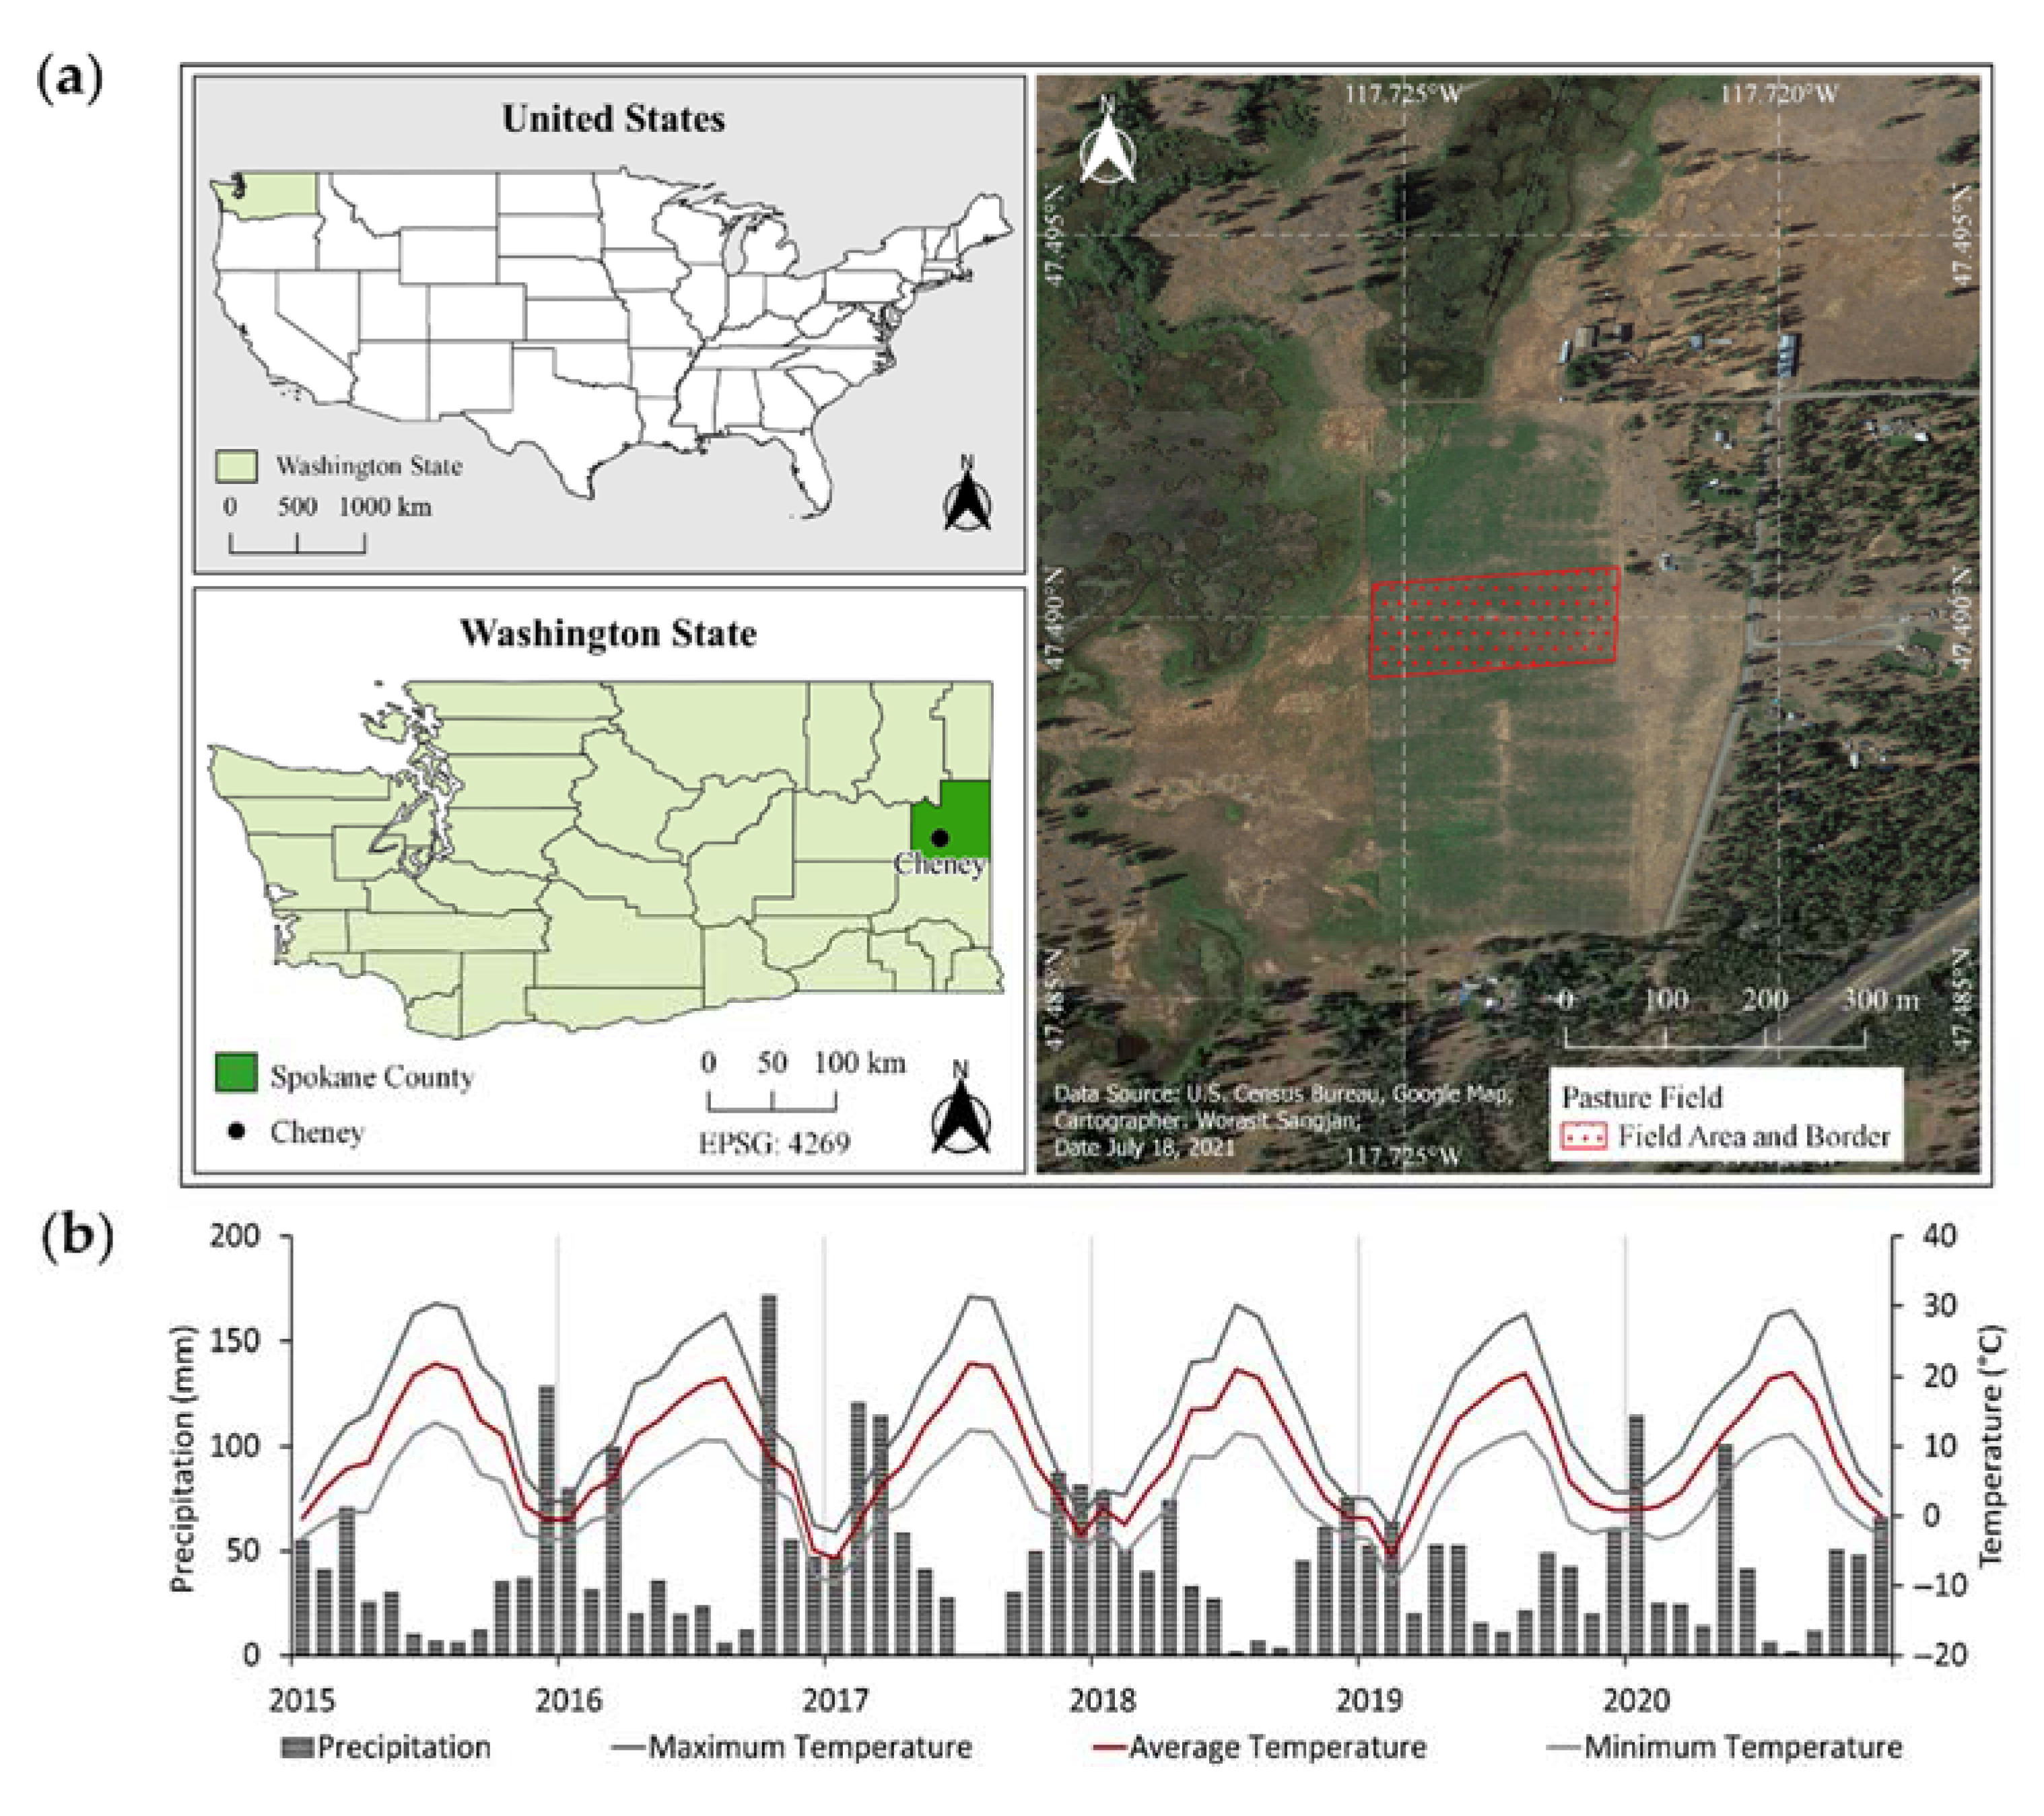
2.1. Study Area

The study was established in 2015 in an existing irrigated pasture on a commercial ranch in Cheney, Washington (Figure 1a). The location of the study area (GPS: 47°29′25.2″ N, 117°43′26.6″ W) was on the edge of the semi-arid region leading up to the Selkirk Mountains foothills, and the soil type was gravelly silt loam, with a significant phosphorus deficit. The area has a Mediterranean climate with Köppen’s climatic type of Csb; the summers (mid-June to mid-September) are short and warm with an average maximum temperature of 29–30 °C in July, and winters (mid-November to the end of February) are cold with an average minimum temperature of −4.50 °C in December. The wet season is from late October to early June (maximum precipitation in December at about 83.80 mm average and minimum in July at about 12.70 mm average). The weather data during the research period (2015–2020) was acquired from the National Oceanic and Atmospheric Administration (NOAA)–National Centers for Environmental Information (NECI) of the U.S. Department of Commerce (https://www.ncdc.noaa.gov/cag/; accessed on 20 July 2021) is presented in Figure 1b.
Plant species composition in the study area was evaluated in June 2015 before grazing, which was clearly driven by soil type and moisture. Cheatgrass and drought-tolerant annual forbs dominated with remnant perennial grasses in the drier soil on the eastern side. More mesic soil was found towards the west side (near a wetland) of the study area, where perennial grass and mesic pasture forbs dominated. Dominant species by weight were primarily western wheatgrass, tumble mustard, cheatgrass, and alfalfa.

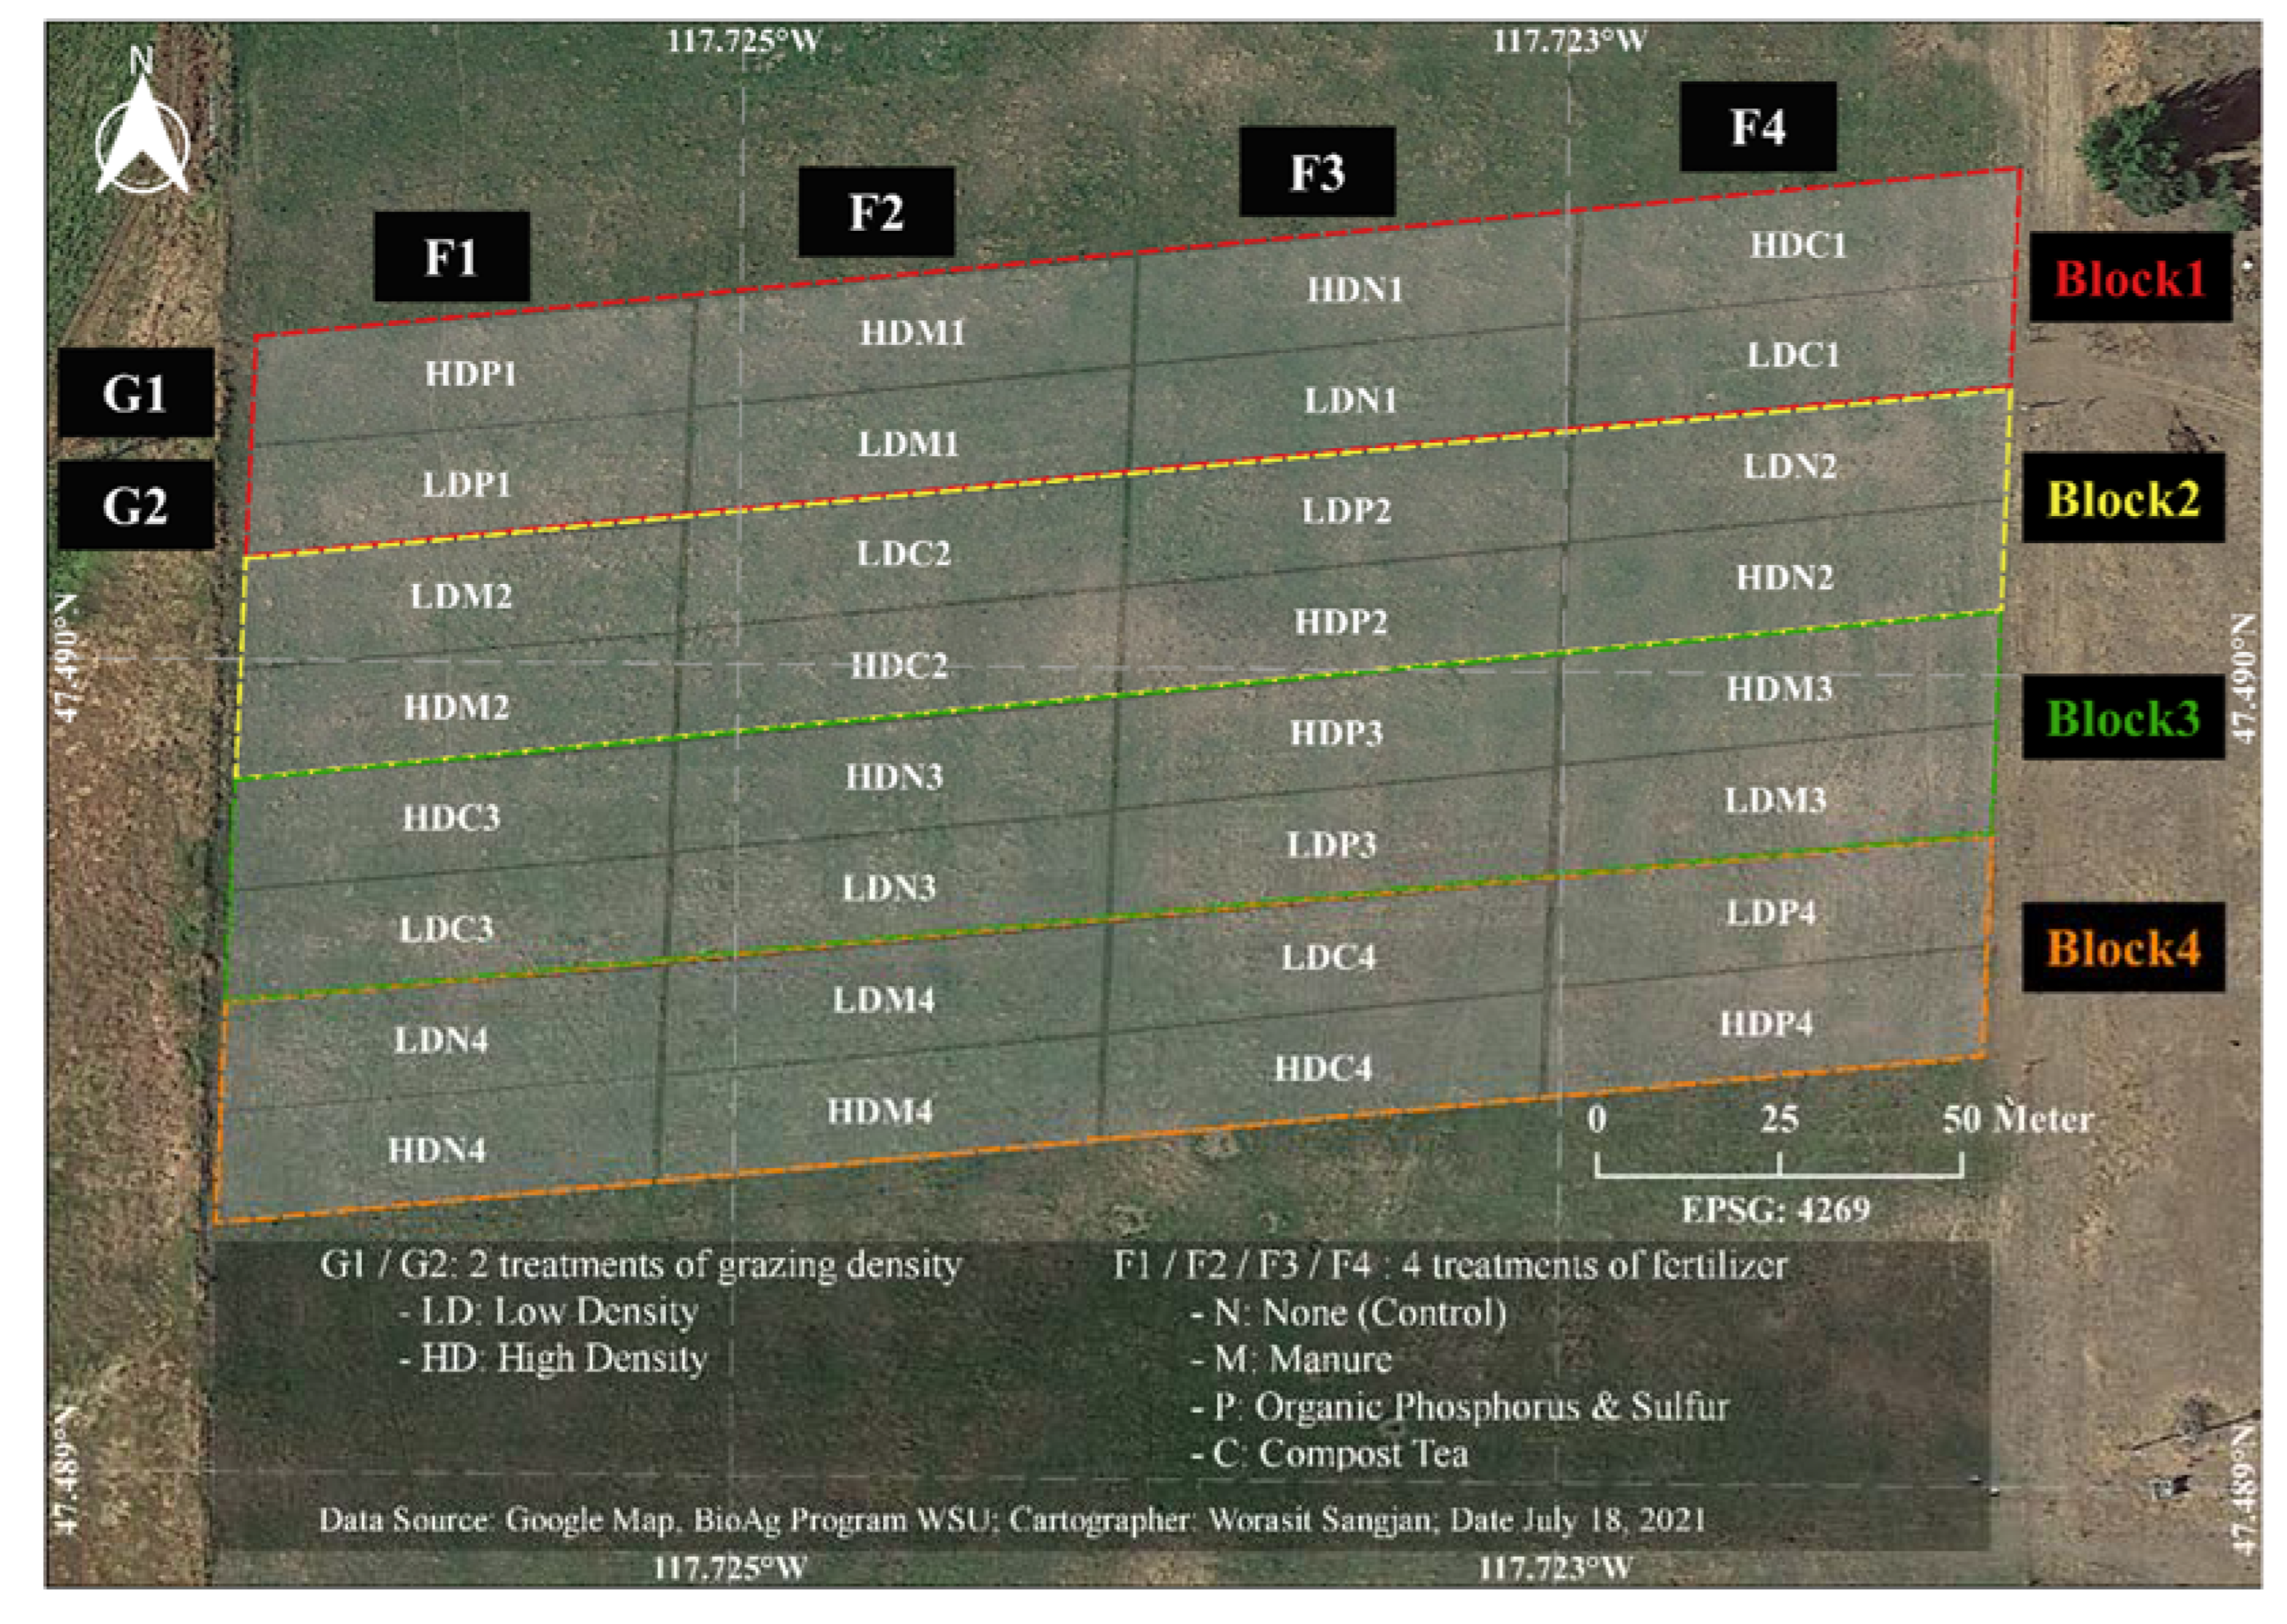
2.2. Experimental Design and Grazing Methodology

The study area’s experimental design was a strip plot consisting of four replicates (four blocks) and eight treatments over 3.24 ha (Figure 2). Cattle grazing was managed using planned rotational grazing at two different stocking densities: (1) low density (LD); and (2) high density (HD), using an approach referred to as “mob grazing” at high stocking densities of livestock for a short period of time (hours or days). At both livestock densities, cattle were moved into a grazing area with the aid of electrical fences, allowed to graze and trample aboveground forage biomass, and removed. The land was then left ungrazed until the following year [36,37]. These two strategies were overlaid with four soil fertility management to address pre-existing phosphorus and sulfur fertility limitations in this irrigated pasture: control (no fertility supplement), one year aged manure (2800 kg dry manure ha−1, supplying 55 kg ha−1 N, 22.40 kg ha−1 P2O5, 80 kg ha−1 K2O, 8 kg ha−1 S), organic registered phosphorus and sulfur fertilizers (22.40 kg ha−1 S as gypsum and 22.40 kg ha−1 P2O5 as bonemeal), and non-aerated compost tea (supplying 5 kg ha−1 N, 2 kg ha−1 P2O5, 7 kg ha−1 K2O). Fertility treatments were applied annually.
The HD grazing was applied once in June or July each year from 2015 to 2019 when the fields were predominantly covered by forage. Each 0.40 ha HD paddock was separated by electric fencing. Grazing duration in HD was in accordance with mob grazing methodology, using a target utilization level as a trigger of timing to move animals to the next strip [38]. The LD grazing represented a seasonal-sustainable grazing rate from June to September each year. Thus, LD removed approximately 40% of available forage, and HD targeted 80–90% forage removal and trampling at each grazing event, monitored by an experienced rancher’s visual estimation.
Throughout the study, cattle (400–500 kg mature body weight) were used as forage “harvesters” to a targeted level of forage removal for each grazing density in each paddock. The rancher used 100 to 119 animal units (454 kg equivalent live weight (LW) per animal unit) of cattle in HD. All cattle were applied on one 0.40 ha HD paddock at a time for a stock density of 113,000 to 135,000 kg LW ha−1 for 12 h. After all HD paddocks were grazed, two cow-calf pairs or 2.40 animal units grazed all LD paddocks together (1.60 ha), a stock density of approximately 700 kg LW ha−1, for 100 days.

2.3. Image Acquisition

2.3.1. Satellite Imagery

Two remote sensing platforms, satellite, and UAS, were utilized to acquire raw data. Satellite imagery was the PlanetScope Analytic Ortho Scene (Level 3B) provided by Planet Labs Inc. (San Francisco, CA, USA). PlanetScope Dove satellite comprises over 180 CubeSats 3U form factor (10 × 10 × 30 cm) on the constellation having the capability to image all of the Earth’s land surface each day. The ground sampling distance of PlanetScope imagery is 3.70 m at a reference altitude of 475 km, and pixel size is 3 m after the orthorectified process. Ortho scenes are radiometrically-, sensor-, and geometrically-corrected, including atmospherically corrected using the 6S radiative transfer model with ancillary data from the MODIS for surface reflectance 4-band imageries that were utilized in the study (https://www.planet.com/products/planet-imagery/; accessed on 20 July 2021). Images from 2017 to 2019 of cloud-free PlanetScope scenes were acquired on dates before the grazing period and downloaded through the Planet’s Education Research Program (https://api.planet.com; accessed on 20 June 2020). The information about its specific attributes and raw image acquisition date are shown in Table 1.

2.3.2. UAS Imagery

High-resolution UAS imageries were acquired from two quadcopters. DJI-Phantom 4 Pro with an onboard visible camera (DJI Inc., Los Angeles., CA, USA), as described in Table 1, was utilized to collect raw RGB images. Pix4Dcapture (Pix4D S.A., Lausanne, Switzerland) was used for mission planning, such that the images were captured by setting a flight pattern as a single grid with 80% front and 70% side overlap and speed at about 2.50 m s−1. In order to receive good image accuracies, UAS flight altitude was set at 25 m, and images were captured with two missions. The high-resolution RGB imagery was utilized to accurately geolocate/georeference each pasture plot of the multispectral imagery from satellite and UAS sources.
ATI-AgBotTM (Aerial Technology International, Oregon City, OR, USA) mounted with a RedEdge camera (Table 1) (Micasense Inc., Seattle, WA, USA) was employed to capture multispectral images. Similar mission planning with 3 m s−1 UAS speed and 50 m flight altitude using Mission Planner software (http://ardupilot.org/planner; accessed on 20 July 2021) was established. Before each flight, 80 × 50 cm boards that could be seen in the resulting UAS orthomosaic images were placed at each ground control point position to assist in georeferencing process. In addition, a 30 × 30 cm white reference panel having 99% reflectance from RGB to NIR spectral range (Spectralon® Diffuse Reflectance Targets, SRS-99-120, Labsphere Inc., North Sutton, NH, USA) was also placed in the field during image acquisition of both UAS missions for radiometric correction.

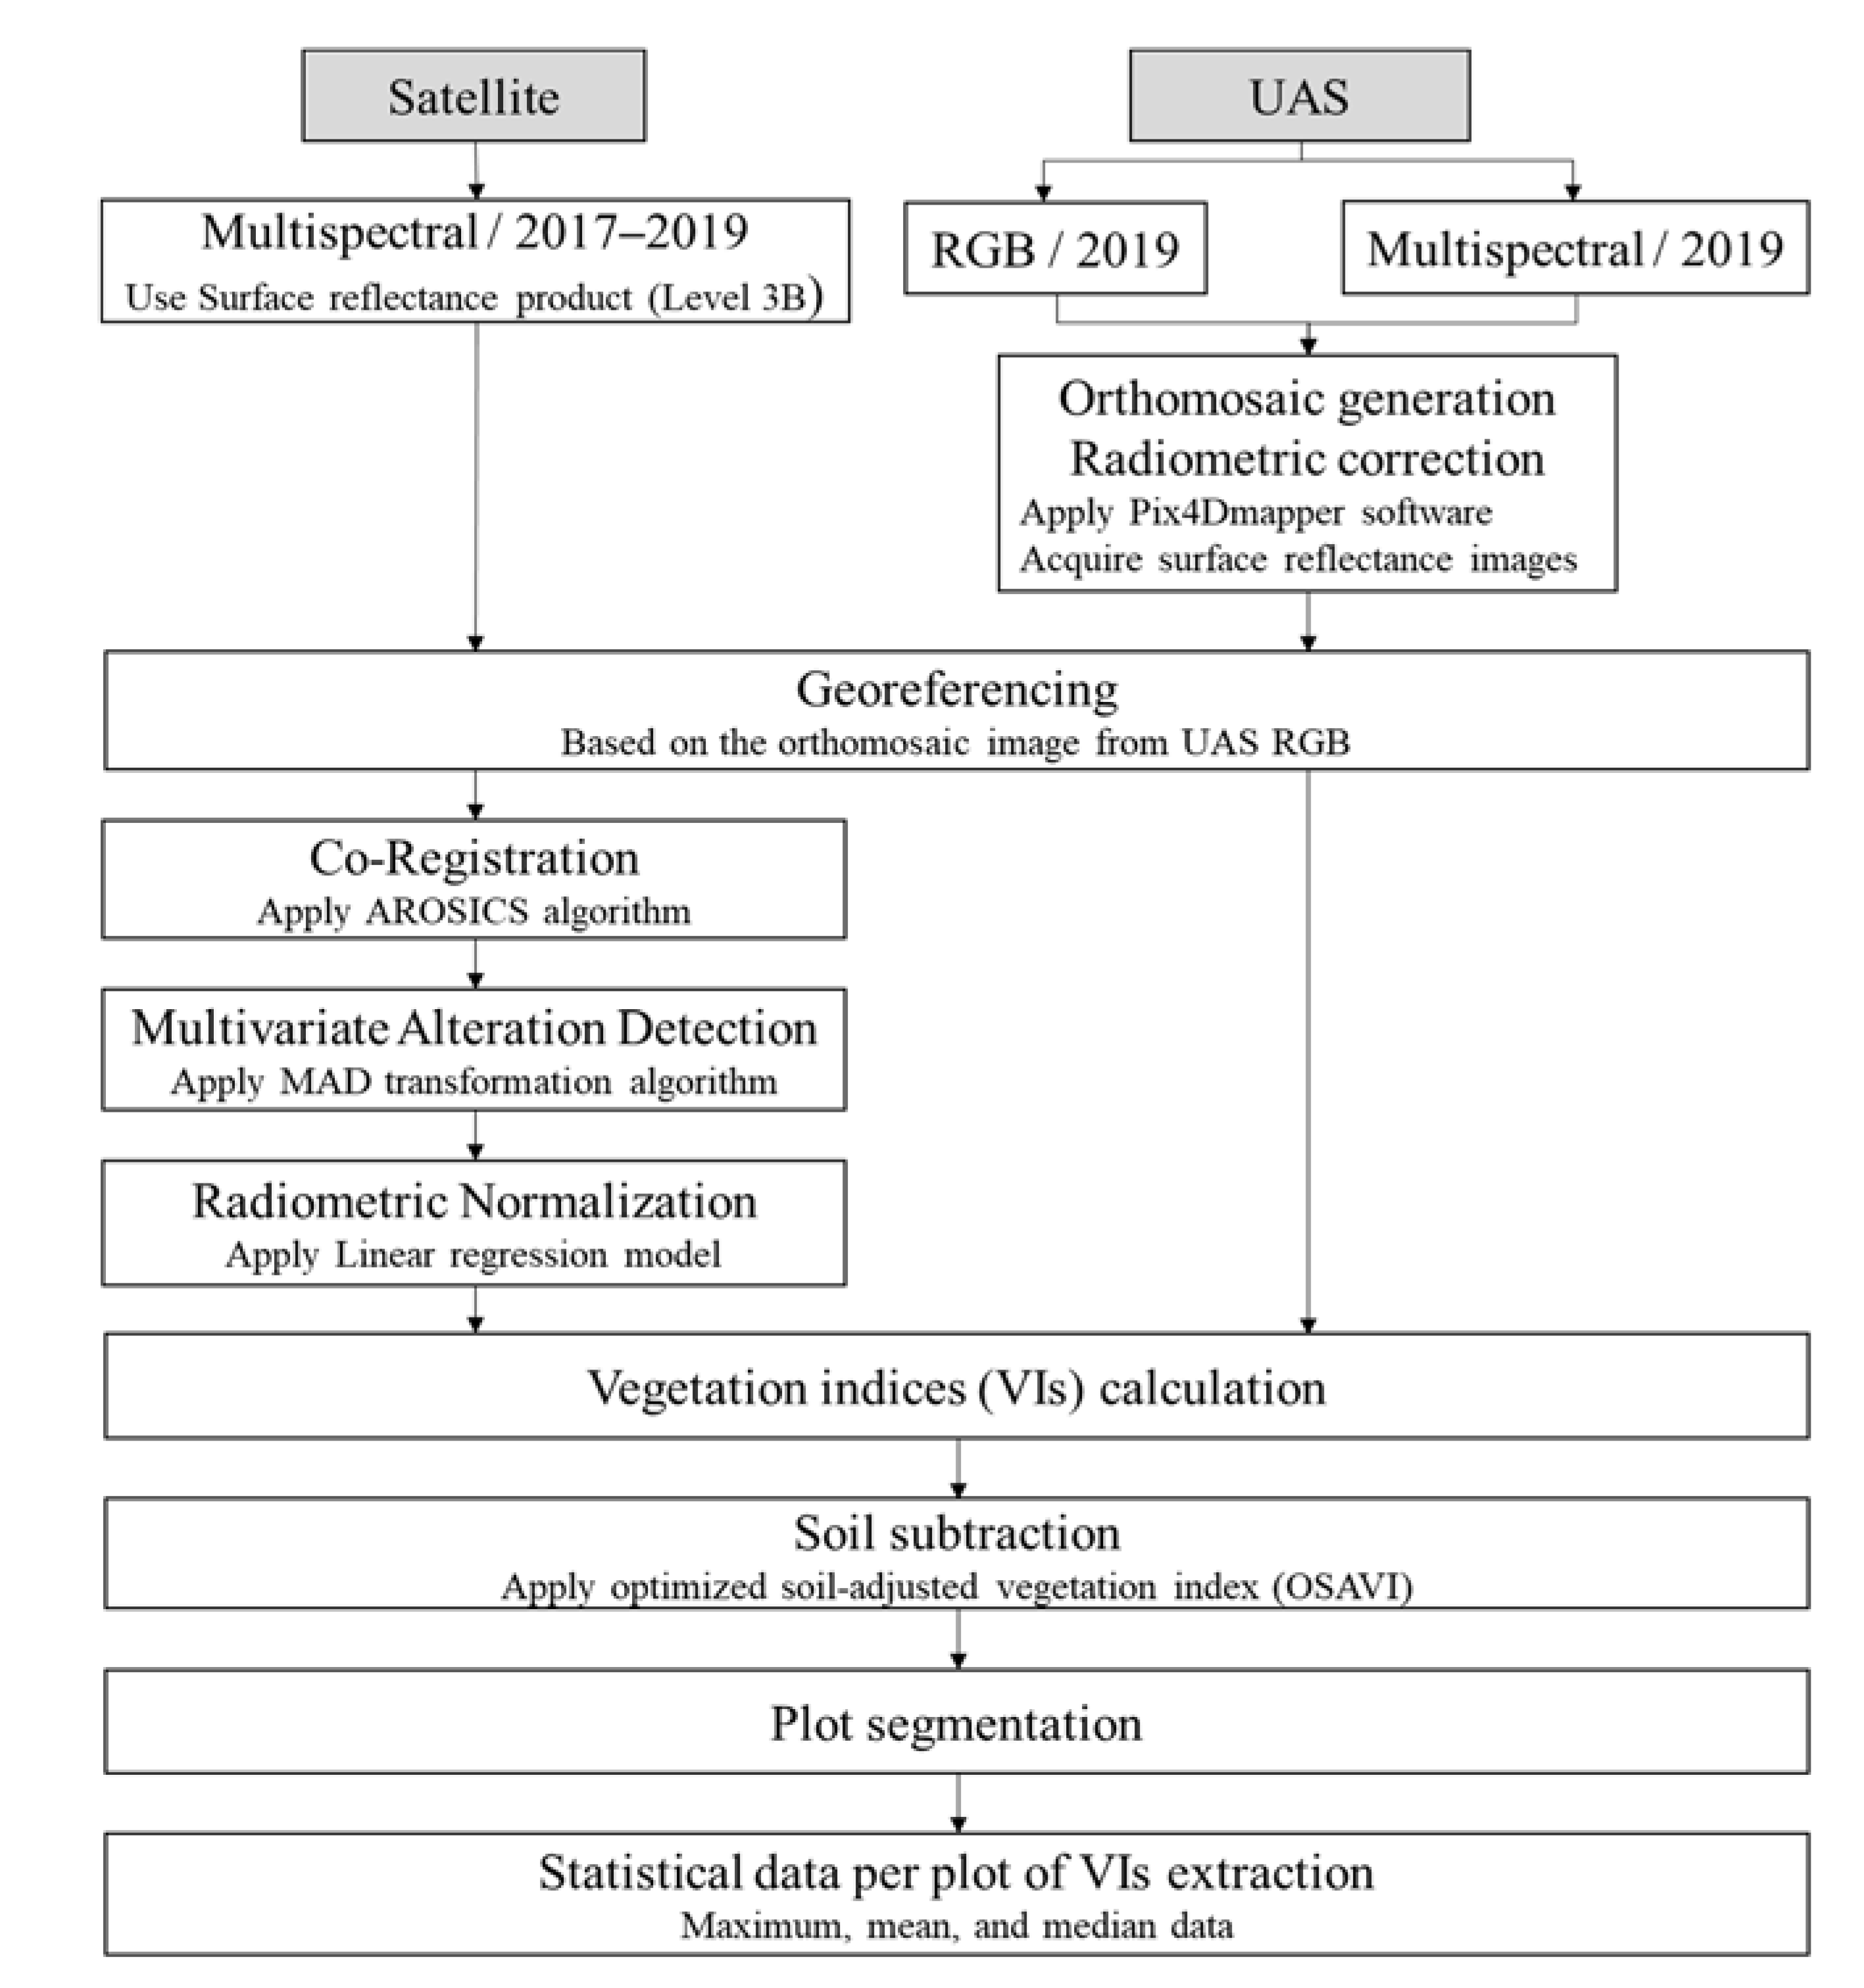
2.4. Image Pre-Processing

2.4.1. Pre-Processing on Satellite Imagery

Figure 3 summarizes the satellite imagery pre-processing steps performed utilizing an open-source Python 3 (Python Core Team, 2015) program to fully spatially align and precisely evaluate the pixels or areas transforming through time, as provided in [39]. In this process, AROSICS, the open-source image co-registration software for multi-sensor satellite imagery that uses the Fourier shift theorem to perform intensity-based registration and identify sub-pixel shifts [40], was used. All images in the time series were compared against the first image (reference image), which was the satellite image from 2019, as this image could be georeferenced with the UAS RGB image. Later, the multivariate alteration detection (MAD) algorithm [41] was employed to find invariant pixels between the target (2017 or 2018 satellite image) and the reference image (2019 satellite image) for normalizing the radiometry between the images. The MAD was selected due to its robustness against diverse atmospheric conditions and its appropriateness as a precursor to various normalization techniques.
Based on [39,41], the MAD component images at a no-change probability threshold of 95% were set to select the representing invariant features, which were the highest likelihood pixels and their spectral values. This process, combined with a linear regression approach, was used to generate a transformation between the two radiometries of the reference and target images. Moreover, 65% of invariant pixels were used to train the model, and the remaining were for testing purposes. In order to minimize the residuals and compensate for spectral values offset between the two images, both slope and intercept were automatically adjusted through the algorithm. With the linear regression model, the image appearance was preserved and not over-corrected, which simplified the image/result interpretability. Therefore, utilizing the MAD algorithm, the spatial resolution of the images in the series was maintained, and any parameters on the reference image were transformed to the images in series, but the atmospheric or cross-sensor normalization variation was compensated.

2.4.2. Pre-Processing on Satellite Imagery

Raw RGB and multispectral images from UAS platforms were pre-processed (Figure 3), applying the structure-from-motion software Pix4Dmapper (Pix4D S.A., Lausanne, Switzerland) to derive an orthomosaic image of the study area with 0.62 cm and 3.44 cm spatial resolution, respectively. In the process, the software improved the radiometric quality of the images automatically by considering the scene illumination, reference panel, and sensor specifications to create reflectance imagery. The 2019 surface reflectance images from the satellite and UAS platform were rectified to the correct location between different images using the Georeferencer tool in open-source software QGIS (QGIS.org, 2021, version 3.10.4), similar to those described in [42].

2.5. Image Processing

Vegetation indices (VIs) were constructed utilizing the algorithm created in Python 3 using the Rasterio library (https://rasterio.readthedocs.io/en/latest/#; accessed on 20 July 2021). The satellite images after normalization and multispectral surface reflectance images from UAS after georeferencing were used in this method (Figure 3). The VIs, especially those commonly used in agricultural applications with a potential to estimate pasture productivity or aboveground biomass or yield estimation, were derived (Table 2).
The OSAVI [51] was utilized to estimate a threshold to create a soil mask that was eliminated from each VI image. Then, the polygons defining each pasture study plot were digitized in a *.shp format using QGIS software as it is complex to generate the shapefile using an algorithm because the plots were not of uniform grid pattern (Figure 2). The shapefile of plot segmentation was imported to the created algorithm, and the Python libraries: NumPy (https://numpy.org/; accessed on 20 July 2021) and Rasterstats (https://pythonhosted.org/rasterstats/#; accessed on 20 July 2021) were applied to extract statistical data (maximum, mean, and median) of each VI image from each plot and to export the data in a comma-separated values file format.

2.6. Data Analysis

The effect of grazing density and fertility management on pasture productivity were assessed from all calculated VIs in each year independently and also the comparison between the year of study (2017–2019) using analysis of variance (ANOVA) in R programing language (version 3.2.5, R core Team, 2017). Agricolae (version 1.3-3, ref. [54]) in R was utilized to test the variance in strip-plot design, divided into three parts: horizontal-factor analysis (grazing density), vertical-factor analysis (fertility management), and interaction analysis. Fisher’s least significant difference (LSD) test was followed to compute the significant differences among the mean data (α = 0.05 and adjusting probability value method = Bonferroni). The tests created multiple comparisons of treatments by means of Fisher’s LSD and a grouping of treatments. The analysis method described above was applied for the two datasets—first, the original dataset, the originally extracted VI data from all treatments. Second, the normalized dataset was the original VI data normalizing based on VI data from a no fertility supplement (control) paddock in each block of the study area to minimize the influence of different meteorological conditions each year on the crop growth and development and thus the investigated VI data. Furthermore, the linear relationship of extracted VIs between satellite and UAS imagery was evaluated using Pearson’s correlation analysis.

3. Results

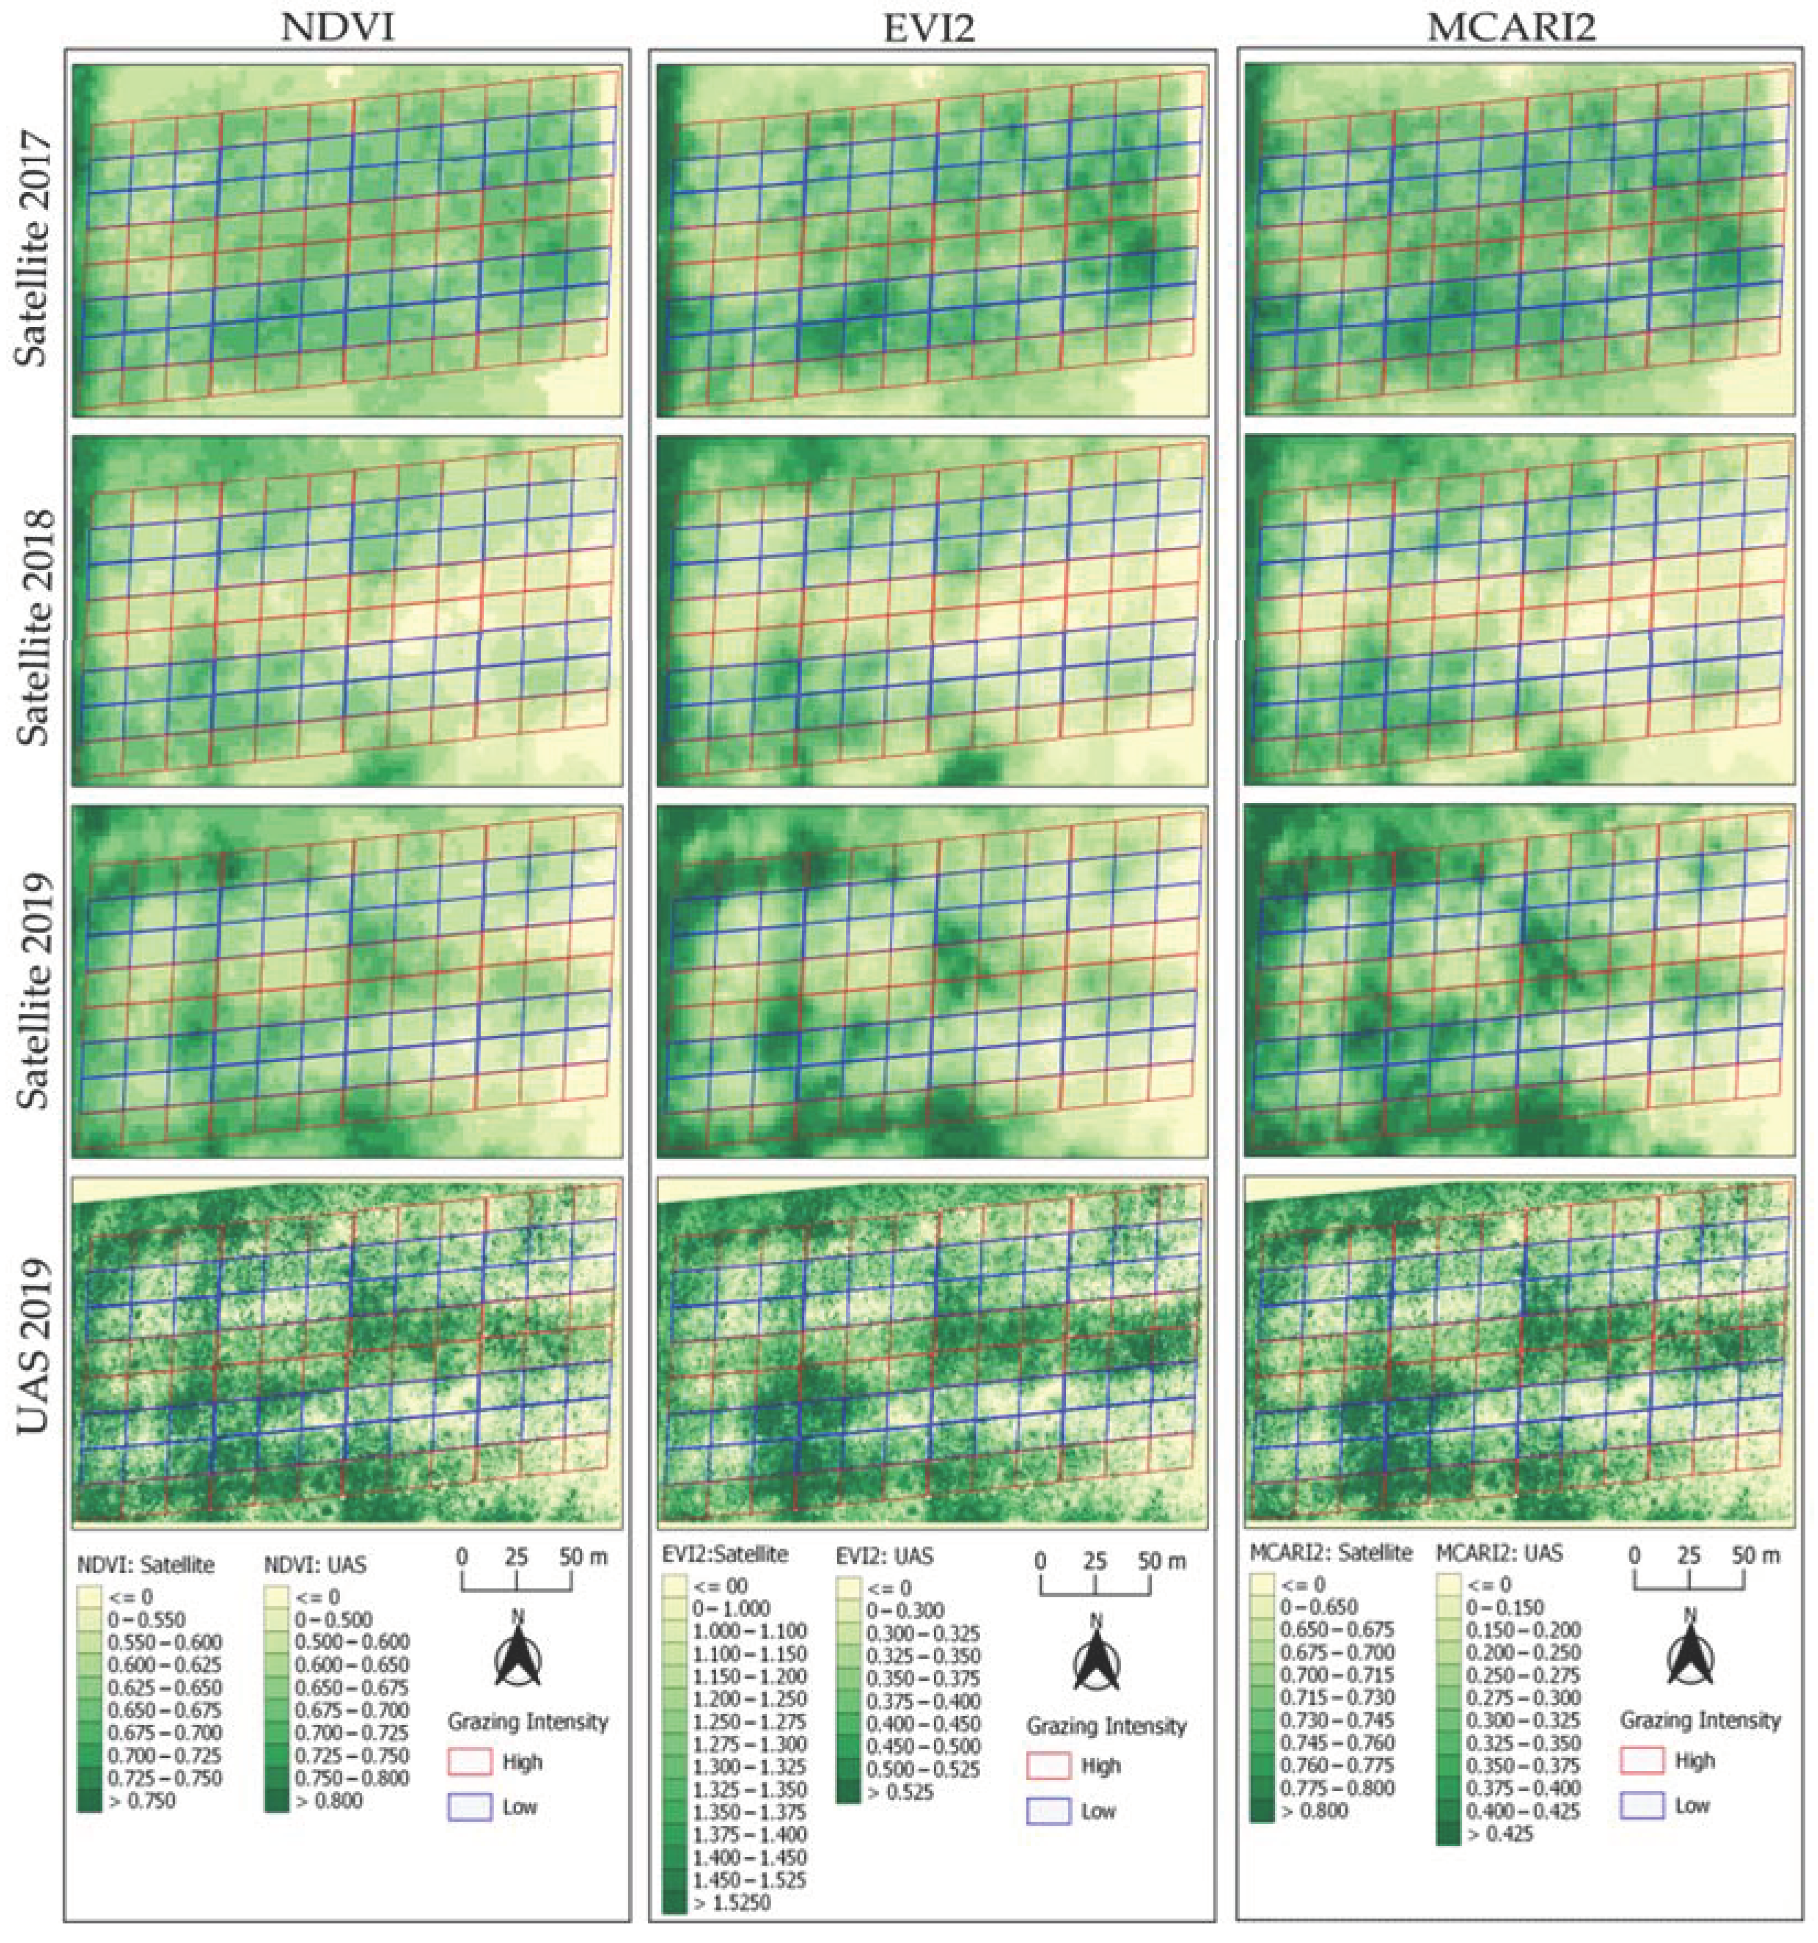
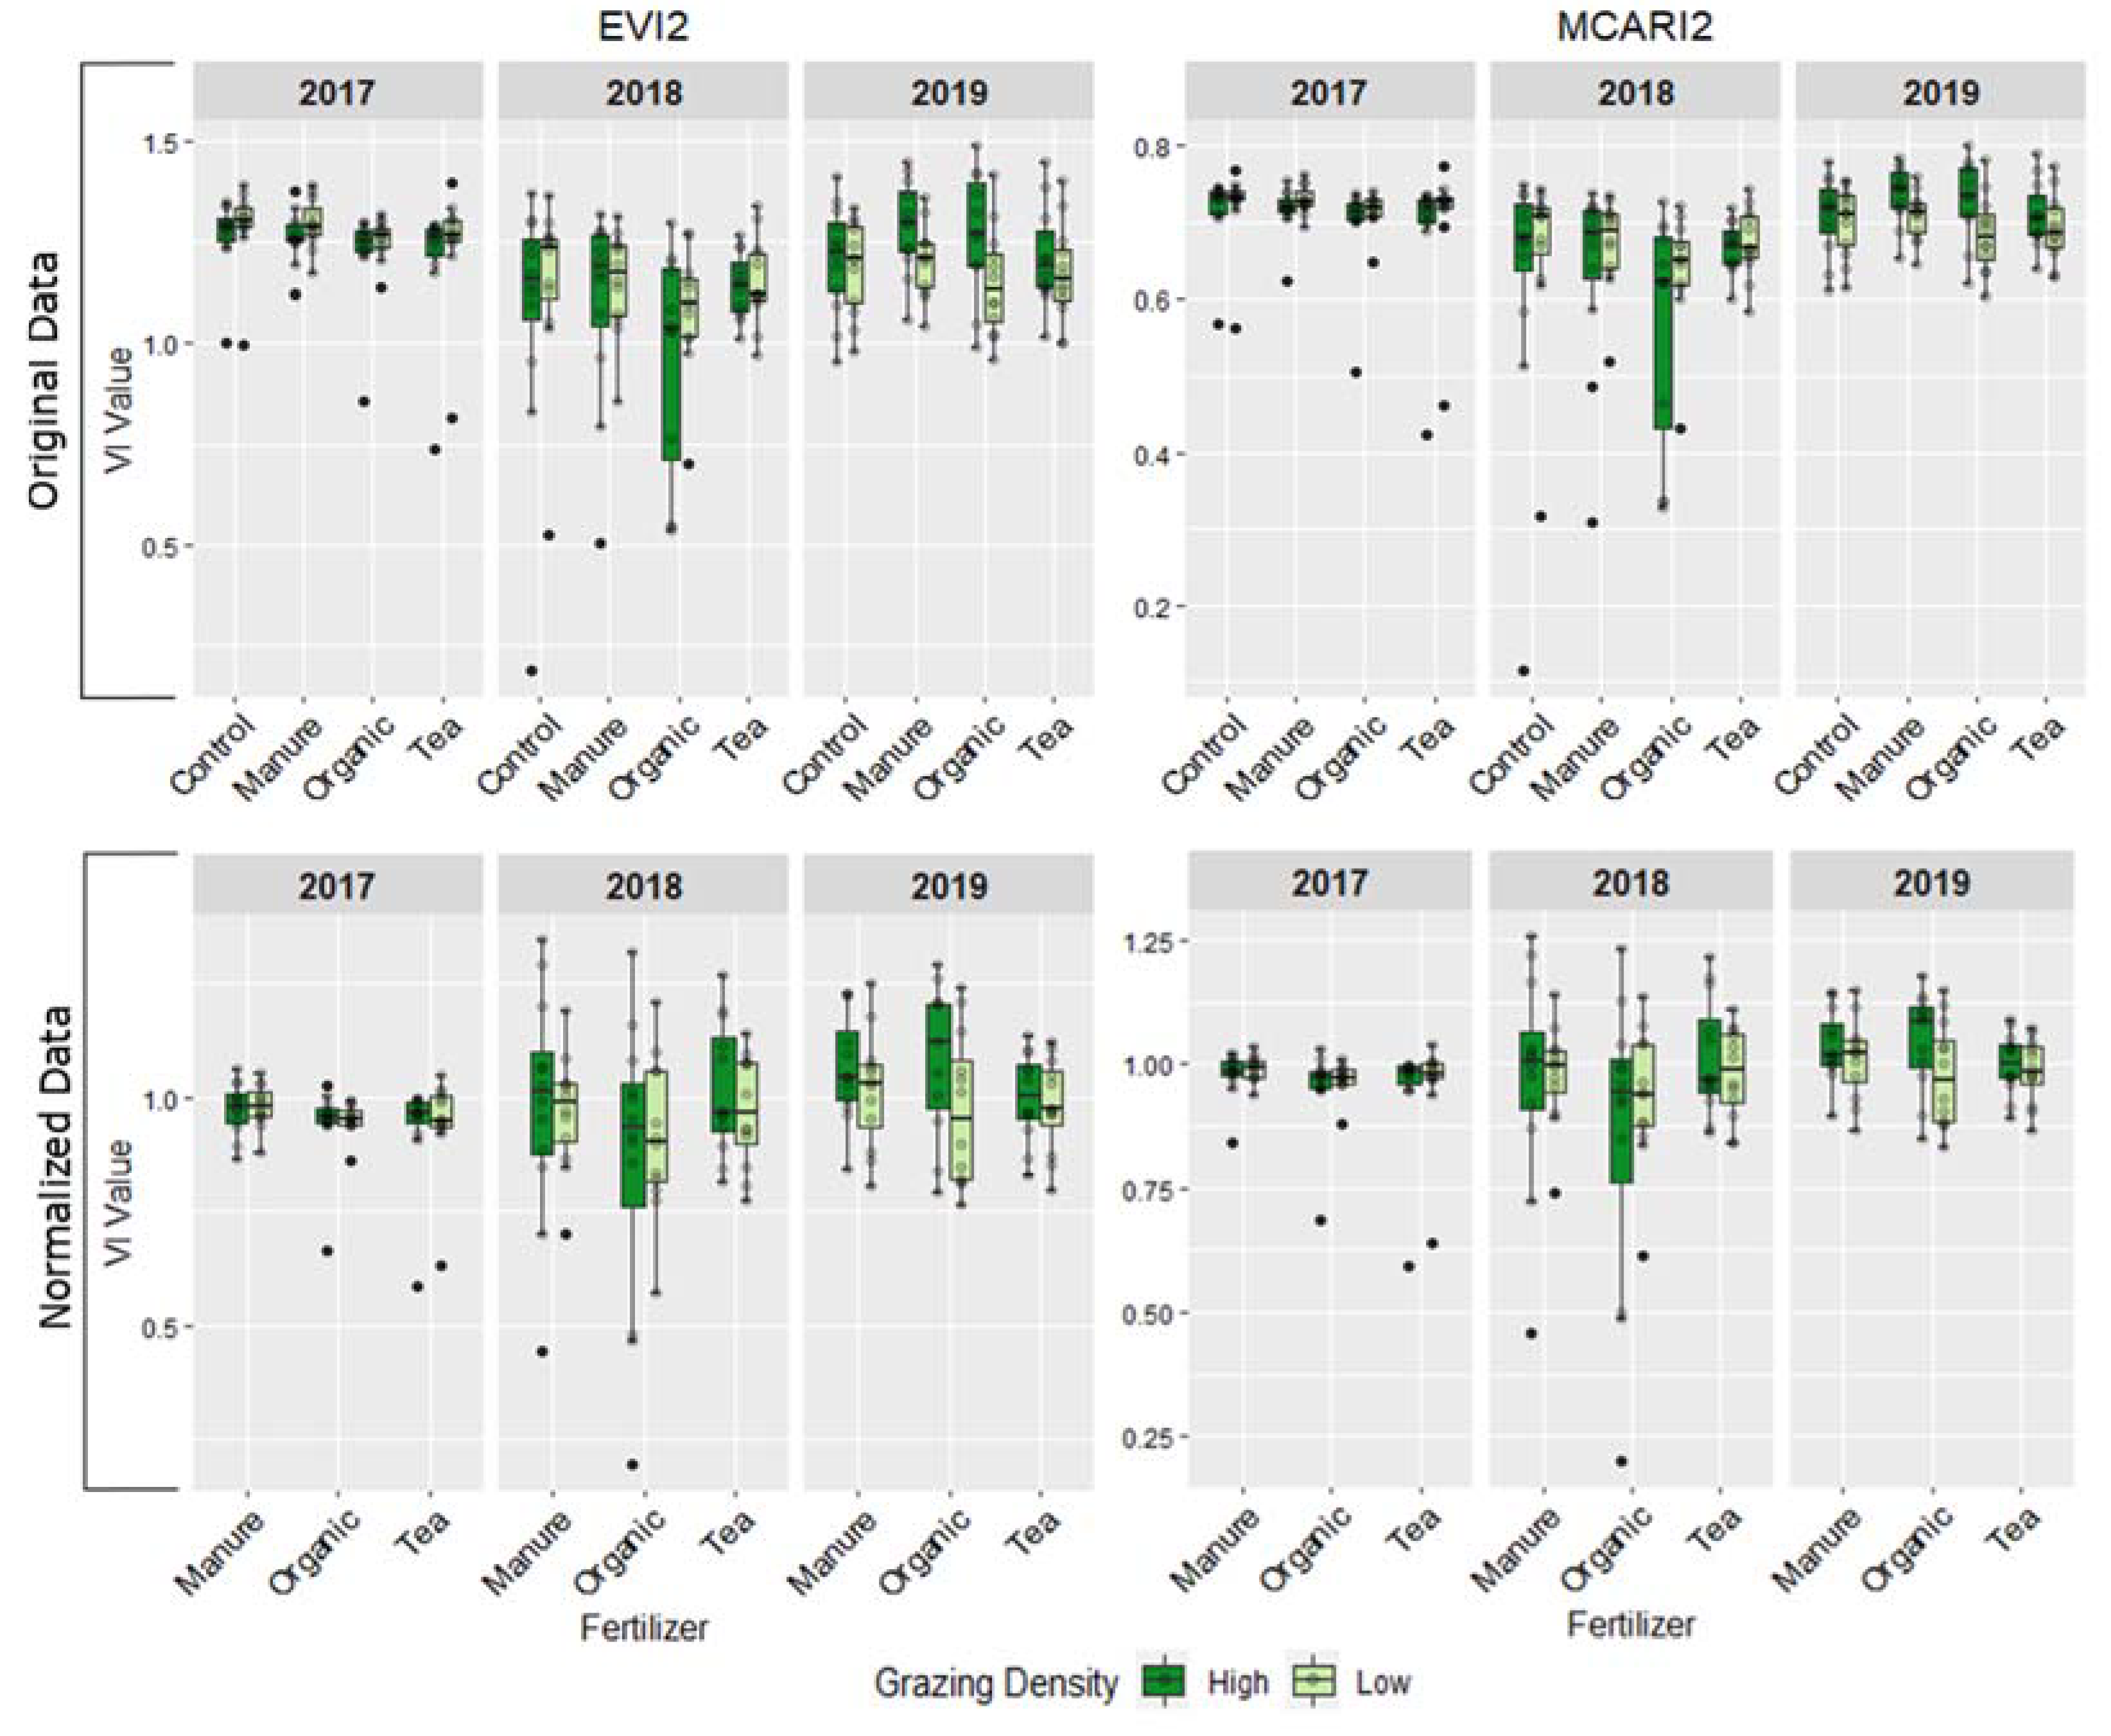
3.1. Pasture Productivity over Time

Satellite and UAS data were acquired before grazing to study the effect of applied treatments on the plots. Figure 4 displayed some of the spatial variability (satellite and UAS) of vegetation indices such as NDVI, EVI2, and MCARI2, representing the pasture productivity from the years 2017–2019. The plot segmentation layer presented the pattern of the pasture productivity in different blocks of treatments changed over the study period. Moreover, the range of VI data from satellite and UAS images was dissimilar, which could be because of the difference in spectral bands, as described in Table 1; however, the patterns of VI spatial distributions were similar.
The digital traits generated for each image demonstrated the highest data values for areas where high pasture productivity occurred as a dark green area. The crop productivity differences in the years 2017 and 2018 were low. However, in 2019, especially as observed from EVI2 and MCARI2 from satellite images, revealed a high vegetation probability of over 40–50% in the HD area. In addition, for UAS data, the VIs map also correspondingly distinguished that 40–50% of HD area had high VI values.
A comparative analysis utilizing box-and-whisker plots of the extracted mean statistic of EVI2 and MCARI2 from the satellite dataset (Figure 5) revealed the applied treatment effects, different treatment comparisons, and pasture productivity trends through the studied time period. Figure 5 demonstrated that the treatments involving 2015 and 2016 did not affect the 2017 pasture productivity data as the mean of the EVI2 and MCARI2 from different treatments (grazing density and fertility management) were consistent and showed low variability. Similar results were observed for the year 2018. Nevertheless, the mean values of EVI2 and MCARI2 from the two datasets (original and normalized) in 2019 revealed the difference in mean values between low and high grazing density. Notably, the mean VI values were most different between LD and HD, where organic phosphorus and sulfur fertilizers had been applied.

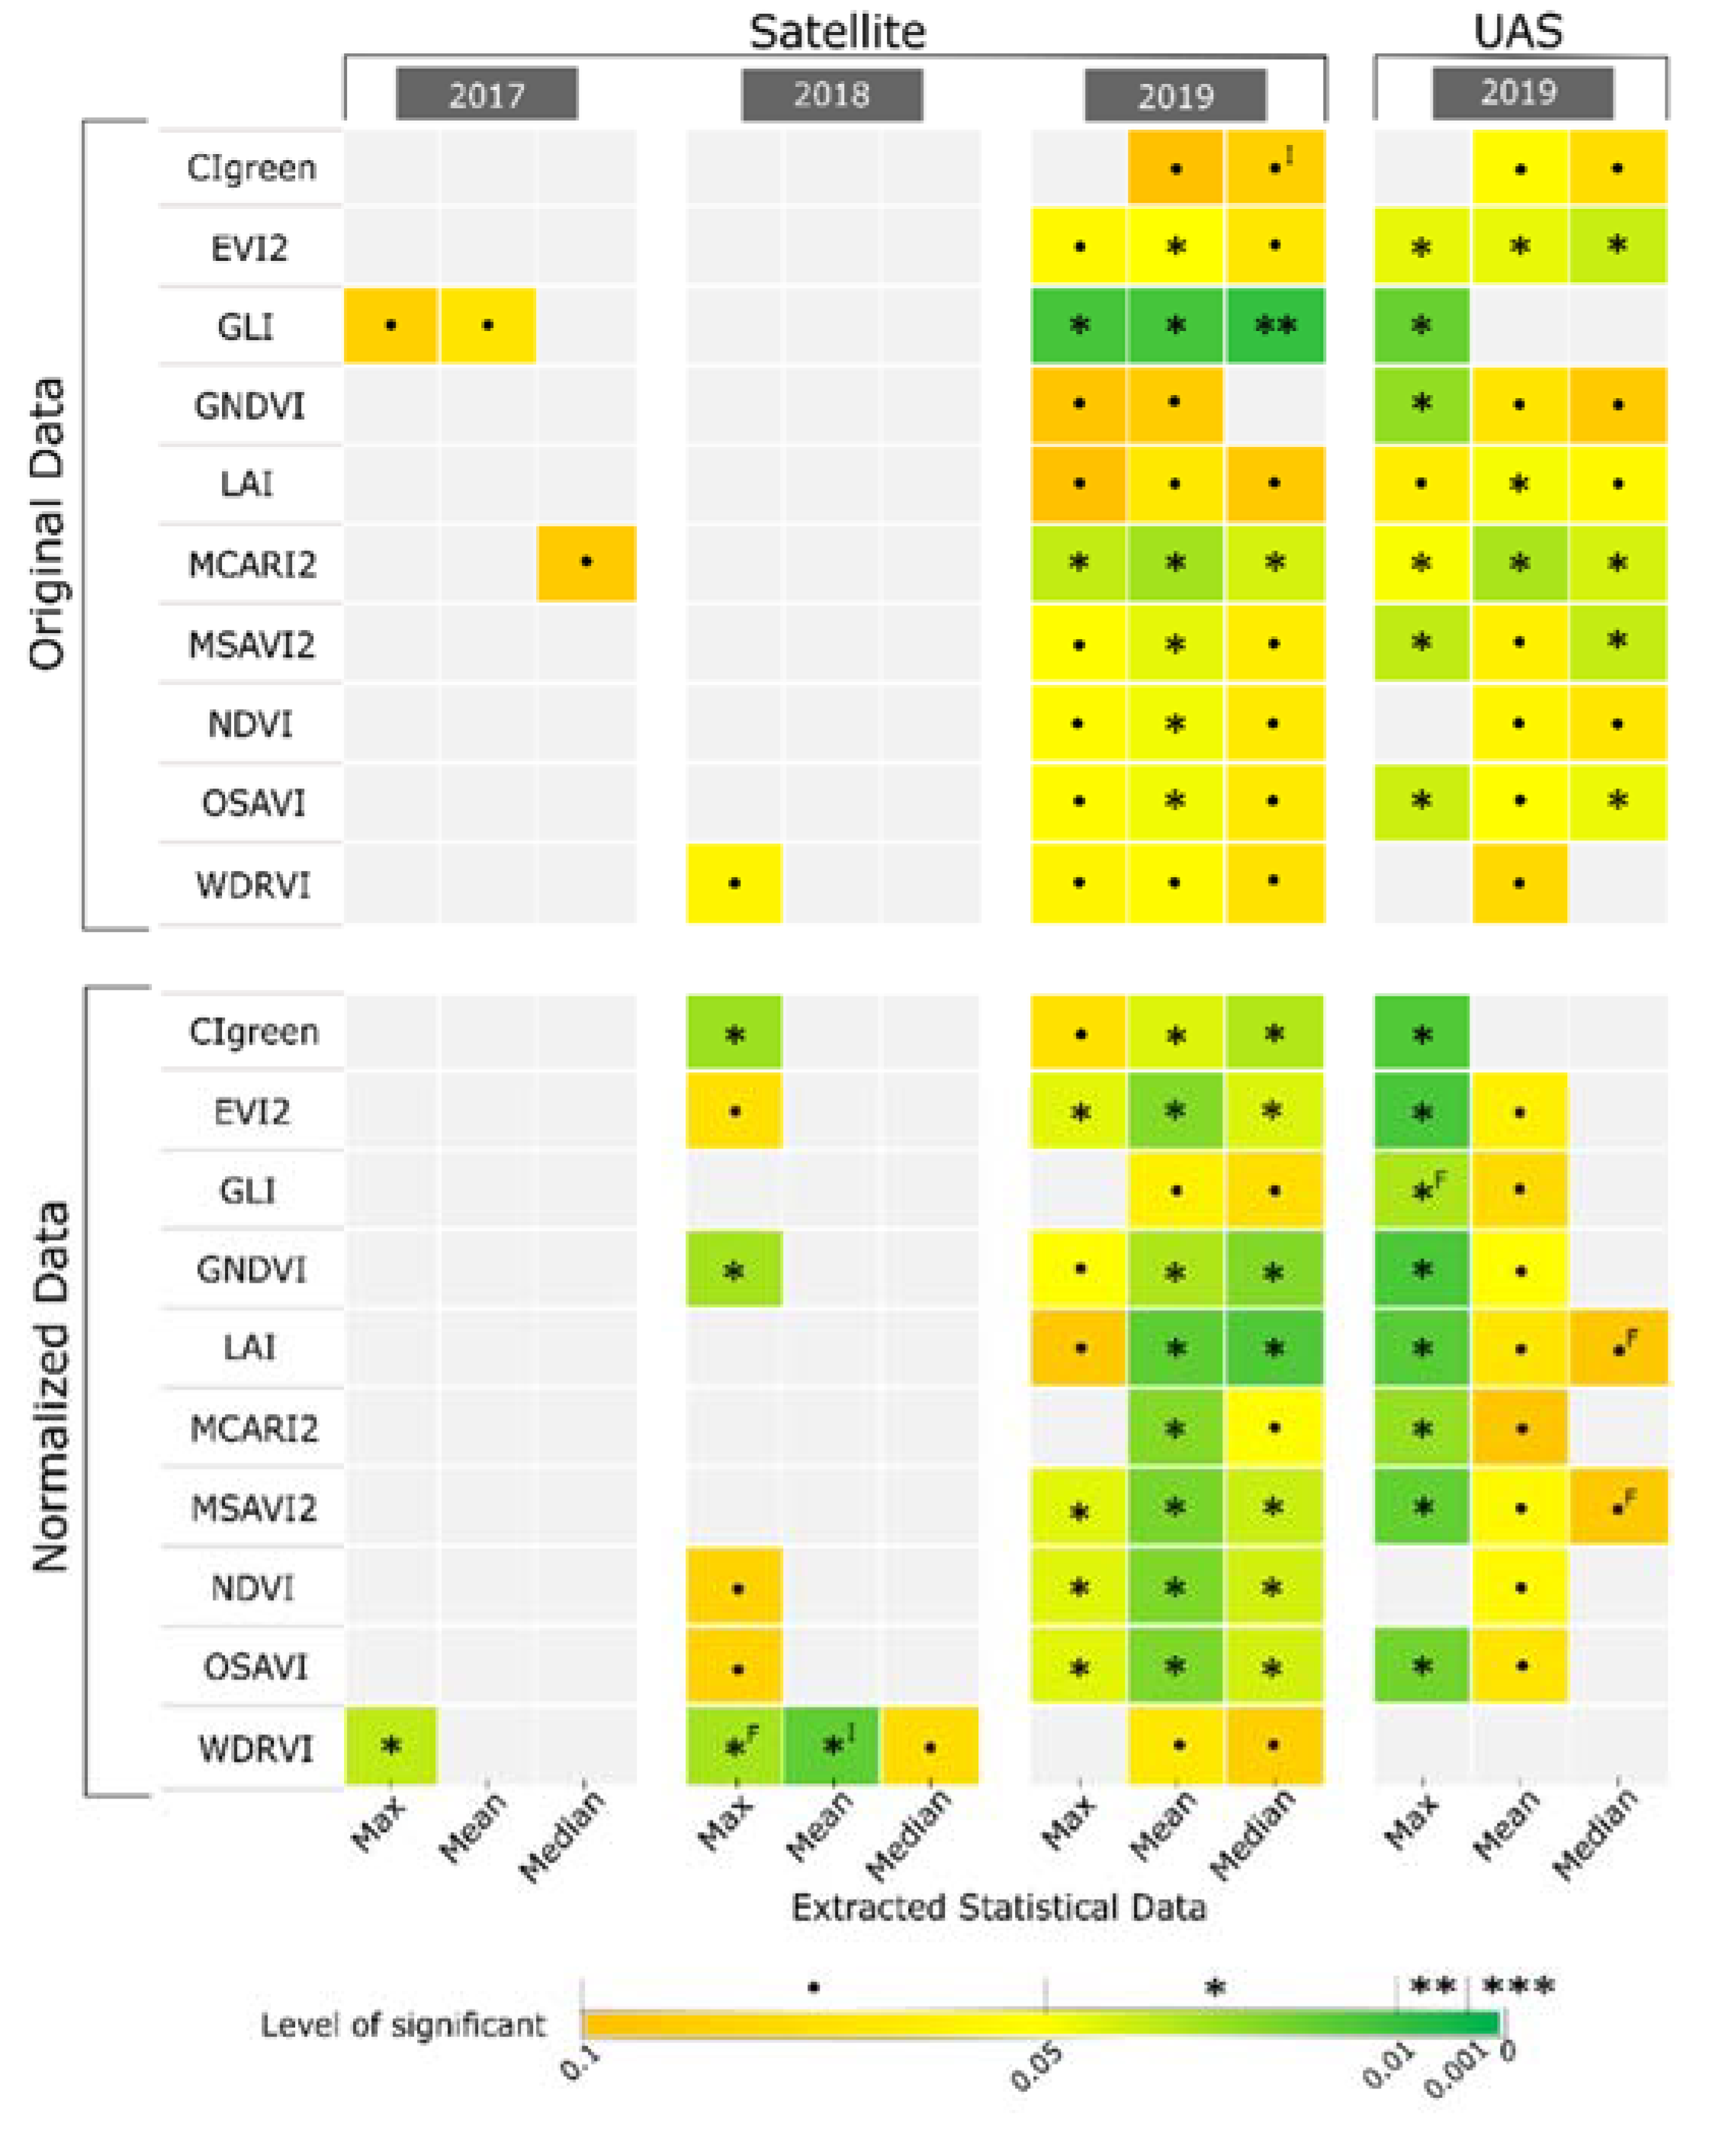
3.2. Treatment Effects

ANOVA in both the original and normalized datasets indicated that the grazing density significantly affected the digital traits (VIs) extracted from satellite and UAS imagery in 2019 (Figure 6). In contrast, fertility management and the interaction between both treatments were not significant in 2017–2019, as observed using remote sensing data. However, the extracted median of CIgreen value calculated from satellite data showed a significant interaction of both treatments’ effects (p < 0.10) in the original dataset. In the normalized dataset, especially in UAS data, the fertility management effect was found to be significant from the extracted maximum of GLI (p < 0.05) and also in the extracted median of LAI (p < 0.10) and MSAVI2 (p < 0.10).
The satellite data results revealed that the different grazing densities affected the VIs values (vegetation characteristics) after four seasons (2015–2018) of applying the treatments. Moreover, all selected VIs from both sensing platforms in 2019 from the original dataset displayed similar results, especially from the extracted mean VI data. The VIs showed the potential for observing differences/effects among treatments (at least p < 0.10), excluding GLI from UAS imagery. Correspondingly, the normalized dataset demonstrated the extracted mean and median VI values from the satellite sensing platform, including the extracted maximum (except NDVI and WDRVI) and mean VI values (except CIgreen and WDRVI) from UAS in 2019 could estimate variation in vegetative cover.
The EVI2, LAI, MCARI2, MSAVI2, and OSAVI extracted from satellite and UAS imagery (original dataset) were consistent in differentiating the grazing density effect. The normalized dataset revealed minor differences, especially using median data from UAS imagery. Nevertheless, EVI2, MSAVI2, and OSAVI showed a consistent and high impact from grazing density than other VI data (p < 0.05; excluding the extracted mean VI values from the UAS imagery had p < 0.10). EVI2 and MCARI2 data showing the effect of grazing density are shown in Figure 7. The results demonstrated that the mean of HD was significantly different from LD (both sensing platforms and datasets). This comparison indicated that implementing high grazing density could result in high canopy vigor in pasture systems, as observed from the remote sensing data.

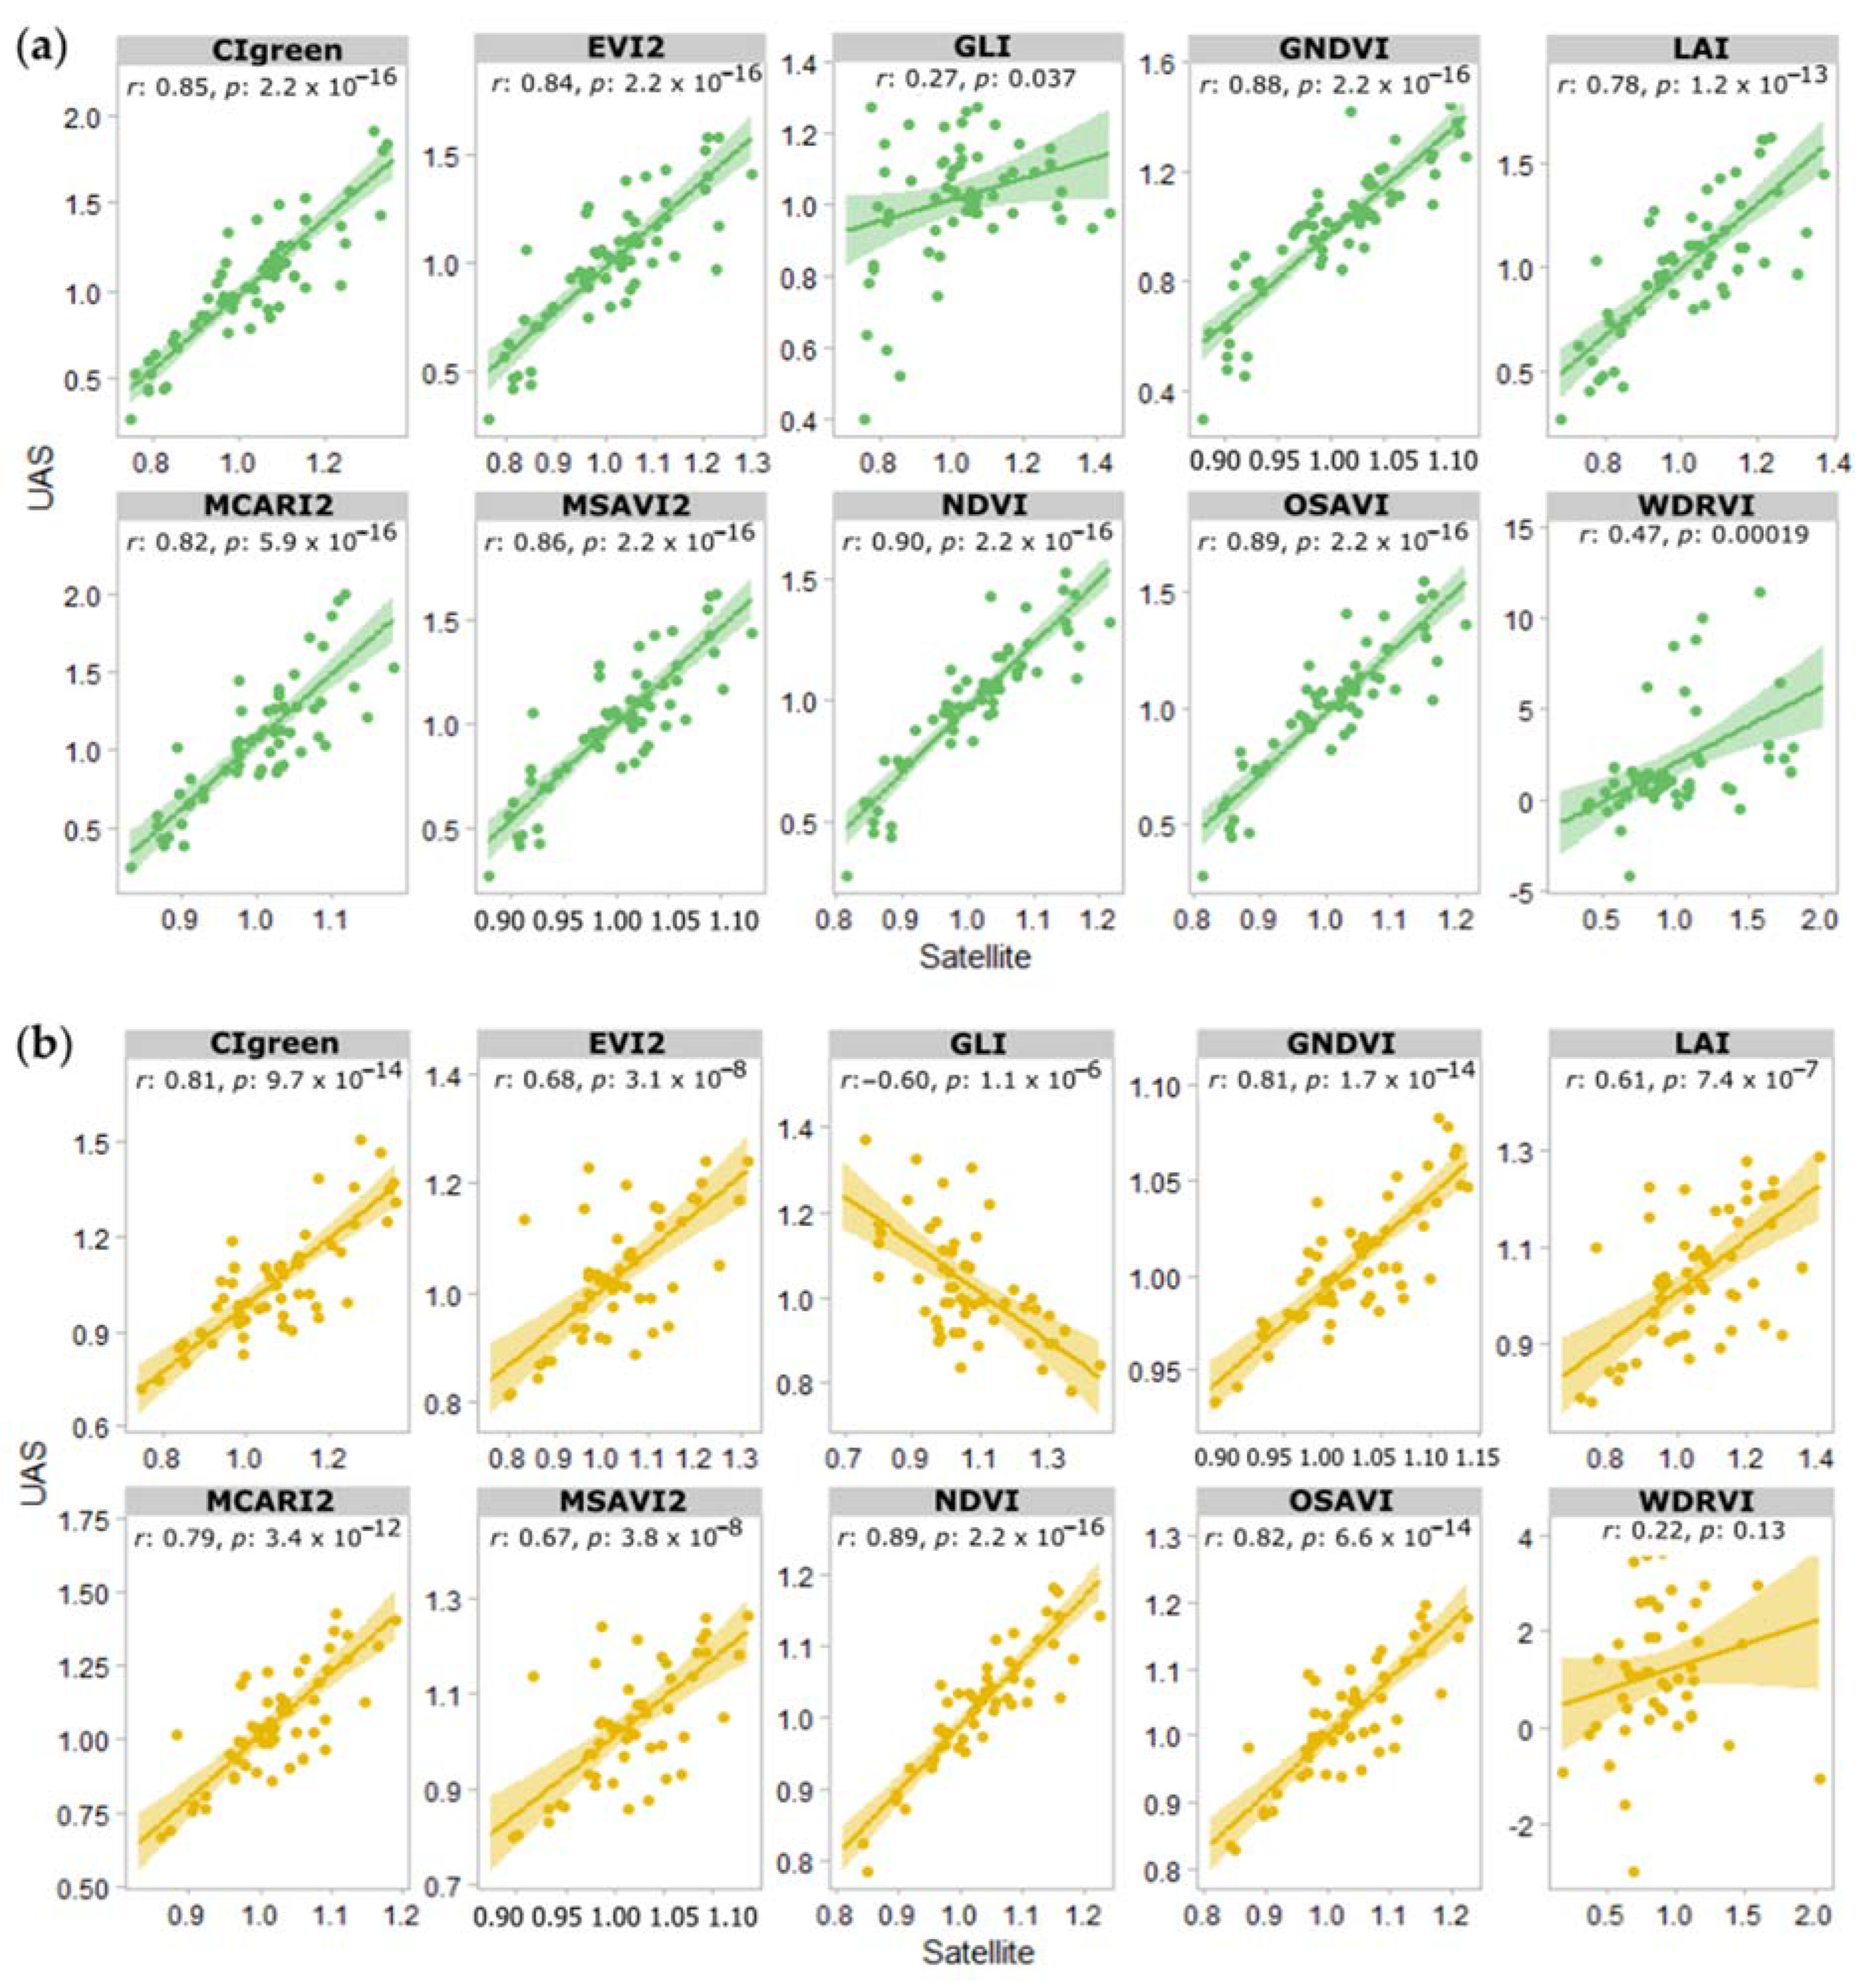
3.3. Correlation between Satellite and UAS Data

The congruence between satellite and UAS imagery for evaluating pasture productivity was investigated on the normalized dataset using mean and median VI values (Figure 8). Pearson correlation coefficients were stable and high (r ≥ 0.75, p < 0.001) between VIs extracted from the two sensing systems, especially CIgreen, MCARI2, and NDVI. Furthermore, the Pearson correlation coefficient of the extracted mean data, except GLI and WDRVI, revealed high correlations (r ≥ 0.78, p < 0.001) between the VIs from satellite and UAS imagery. Given the difference in resolution (3.40 cm for UAS and 3 m for satellite imageries), these findings are encouraging.

4. Discussion

The results from this study indicate that both the satellite and UAS imagery have the potential to assess pasture productivity (based on applied treatments and/or natural variability). The benefits of utilizing satellite imagery over UAS imagery would be the efficient utilization of resources (no equipment/training required to collect data, saved travel time) while capturing data across a larger region/area. One of the key challenges in this study was identifying the treatment areas across the imagery (especially satellite), where the higher resolution UAS imagery was useful. If satellite imagery were utilized for similar studies, ground control points or checkpoints with accurate GPS information on the boundary are recommended for the accurate positioning of the target plots and more straightforward image processing. Nevertheless, the co-registration and normalization during the pre-processing of the satellite images allowed the consolidation of data for the same location and spectral range across the different years in the study. Similar methods can also be deployed for evaluating the long-term evaluation of pasture health using historical data.
Figure 4 shows the higher spatial image resolution of UAS imagery in comparison to satellite imagery. In general, higher resolution imagery (such as UAS imagery) reduces the mixed pixels in the images (contain more pure pixels), resulting in better discrimination between vegetation and soil. Contrarily, the satellite imagery showed some spectral mixing. The mixing of vegetative and soil pixels with a high concentration of organic matter may influence and increase the vegetation index data [51,55], as observed in Figure 7.
The normalization with respect to control treatment was performed to eliminate the effect of different weather conditions across the years. Nevertheless, the results showed similar patterns as observed from the trends in the original and normalized datasets. The location of different paddocks did influence the vegetation development. The drier soil on the east side and the field entrance for the cattle on the northeast side displayed lower vegetation than the west side, which was closer to the wet area, as presented in Figure 4.
This study demonstrated that the high spatial resolution satellite imagery could be used for small to medium pasture field research/management, as the processed images are able to recognize the variation in vegetation growth or crop status. Furthermore, the product offers daily temporal coverage and a viable cost-affordable option in terms of spatial resolution (3 m pixel resolution), thereby allowing the researchers/farmers to check their crop/plant status over time. However, the satellite imagery used in this study did not have a red-edge spectrum that can be utilized to estimate leaves’ chlorophyll content over a canopy [56,57], which may be useful to assess crop stress. More recent images (SuperDove satellites) have 8 spectral bands, including red edge bands.
The two sensing platforms (satellite and UAS) required different image acquisition and processing approaches to get crop information [58,59]. The data acquisition using UAS required travel to the imaging site, planning of the flight mission, and operating the UAS to collect data. The UAS platform can provide high resolution data that can be applied to monitor specific/interested crops and cropping regions, with plausible application of precision agriculture technologies. In contrast, satellite imagery acquisition and operation are more established than the UAS, where the imaging can be tasked through prior arrangement with the satellite imagery providing company. The database of satellite images is also vast, and historical data can be acquired for several agricultural applications, including the study of variability and changes in the cropping areas and overall health, as presented in this study.
Progress in remote sensing technology from both sensors and platforms (satellite and UAS) provides considerable benefits to pasture/grassland science. The production of grassland in terms of spatial and temporal patterns has been evaluated using vegetation indices extracted from the sensing imagery [60,61,62]. In addition, vegetation indices integrated with ground-truth data have been used to develop empirical models for estimating the productivity/biomass on pastures [63,64,65,66]. The most utilized remote sensing data for pasture management for large grassland areas were from satellite sources such as Formosat-2, Lansat, MODIS, and Sentinel-1. The applications included classification, detection, and analysis of applied management practices such as mowing, grazing, or a combination of the two operations [67,68,69,70,71]. Thus, with the capability of high-resolution satellite imagery (as used in this study), pasture research/management in small to medium areas can be a suitable application.

5. Conclusions

This research paper presents the application of vegetation indices extracted from satellite and UAS imagery for assessing crop status/vigor of a small to medium pasture under different grazing density and fertility management. The major findings can be summarized below.
  • The high-resolution satellite imagery (~3 m pixel−1 in this study)—with radiometric calibration and atmospheric correction—can be used to assess overall crop productivity in small to medium-sized pasture paddocks (8–10 ha in this study). The remote sensing data showed an effect of the grazing density on crop productivity (2019), while the effects of the fertility treatments and the interaction between the two treatments were absent.
  • Satellite and UAS-based vegetation indices (mean) showed a similar trend as evaluated using 2019 data.
These results offer great benefits to farmers, ranchers, and researchers alike as pasture management can be investigated and evaluated using sensing data. These tools can be resource-efficient, allowing short and long-term assessment of crop health and productivity.

Author Contributions

Conceptualization, W.S. and S.S.; methodology, W.S. and S.S.; software, W.S. and S.S.; validation, W.S., S.S. and L.A.C.-B.; formal analysis, W.S.; investigation, W.S., S.S., L.A.C.-B. and T.D.H.; resources, S.S. and L.A.C.-B.; data curation, W.S.; writing—original draft preparation, W.S.; writing—review and editing, W.S., S.S., L.A.C.-B. and T.D.H.; visualization, W.S.; supervision, S.S., L.A.C.-B. and T.D.H.; project administration, S.S. and L.A.C.-B.; funding acquisition, S.S. and L.A.C.-B. All authors have read and agreed to the published version of the manuscript.

Funding

This research was funded by Washington State University’s Center for Sustaining Agriculture and Natural Resources BioAg Program (project ID 184) and the U.S. Department of Agriculture-National Institute of Food and Agriculture (USDA-NIFA) hatch project (accession number 1014919).

Institutional Review Board Statement

Not applicable.

Informed Consent Statement

Not applicable.

Data Availability Statement

The data presented in this study are available on request from the corresponding author.

Acknowledgments

The authors would like to sincerely thanks Maurice Robinette from Lazy R Ranch for managing the treatments in the field site. We would also like to thank Chongyuan Zhang and Milton Valencia Ortiz for their support during the UAS data collection.

Conflicts of Interest

The authors declare that the research was conducted in the absence of any commercial or financial relationships that could be construed as potential conflict of interest.

References

  1. Garrett, R.D.; Niles, M.T.; Gil, J.D.; Gaudin, A.; Chaplin-Kramer, R.; Assmann, A.; Assmann, T.S.; Brewer, K.; de Faccio Carvalho, P.C.; Cortner, O.; et al. Social and ecological analysis of commercial integrated crop livestock systems: Current knowledge and remaining uncertainty. Agric. Syst. 2017, 155, 136–146. [Google Scholar] [CrossRef]
  2. Moraine, M.; Duru, M.; Therond, O. A social-ecological framework for analyzing and designing integrated crop-livestock systems from farm to territory levels. Renew. Agric. Food Syst. 2017, 32, 43–56. [Google Scholar] [CrossRef]
  3. Poffenbarger, H.; Artz, G.; Dahlke, G.; Edwards, W.; Hanna, M.; Russell, J.; Sellers, M.; Liebman, M. An economic analysis of integrated crop-livestock systems in Iowa, USA. Agric. Syst. 2017, 157, 51–69. [Google Scholar] [CrossRef]
  4. Cortner, O.; Garrett, R.D.; Valentim, J.F.; Ferreira, J.; Niles, M.T.; Reis, J.; Gil, J. Perceptions of integrated crop-livestock systems for sustainable intensification in the Brazilian Amazon. Land Use Policy 2019, 82, 841–853. [Google Scholar] [CrossRef]
  5. Alves, B.J.; Madari, B.E.; Boddey, R.M. Integrated crop–livestock–forestry systems: Prospects for a sustainable agricultural intensification. Nutr. Cycl. Agroecosystems 2017, 108, 1–4. [Google Scholar] [CrossRef]
  6. Hanrahan, L.; McHugh, N.; Hennessy, T.; Moran, B.; Kearney, R.; Wallace, M.; Shalloo, L. Factors associated with profitability in pasture-based systems of milk production. J. Dairy Sci. 2018, 101, 5474–5485. [Google Scholar] [CrossRef]
  7. de Souza Filho, W.; de Albuquerque Nunes, P.A.; Barro, R.S.; Kunrath, T.R.; de Almeida, G.M.; Genro, T.C.M.; Bayer, C.; de Faccio Carvalho, P.C. Mitigation of enteric methane emissions through pasture management in integrated crop-livestock systems: Trade-offs between animal performance and environmental impacts. J. Clean. Prod. 2019, 213, 968–975. [Google Scholar] [CrossRef]
  8. Andersson, K.; Trotter, M.; Robson, A.; Schneider, D.; Frizell, L.; Saint, A.; Lamb, D.; Blore, C. Estimating pasture biomass with active optical sensors. Adv. Anim. Biosci. 2017, 8, 754–757. [Google Scholar] [CrossRef]
  9. Breunig, F.M.; Galvão, L.S.; Dalagnol, R.; Dauve, C.E.; Parraga, A.; Santi, A.L.; Flora, D.P.D.; Chen, S. Delineation of management zones in agricultural fields using cover–crop biomass estimates from PlanetScope data. Int. J. Appl. Earth Obs. Geoinf. 2020, 85, 102004. [Google Scholar] [CrossRef]
  10. Legg, M.; Bradley, S. Ultrasonic proximal sensing of pasture biomass. Remote Sens. 2019, 11, 2459. [Google Scholar] [CrossRef] [Green Version]
  11. Gargiulo, J.; Clark, C.; Lyons, N.; de Veyrac, G.; Beale, P.; Garcia, S. Spatial and temporal pasture biomass estimation integrating electronic plate meter, Planet CubeSats and Sentinel-2 satellite data. Remote Sens. 2020, 12, 3222. [Google Scholar] [CrossRef]
  12. Gitelson, A.A.; Vina, A.; Ciganda, V.; Rundquist, D.C.; Arkebauer, T.J. Remote estimation of canopy chlorophyll content in crops. Geophys. Res. Lett. 2005, 32, L08403. [Google Scholar] [CrossRef]
  13. Sankaran, S.; Khot, L.R.; Espinoza, C.Z.; Jarolmasjed, S.; Sathuvalli, V.R.; Vandemark, G.J.; Miklas, P.N.; Carter, A.H.; Pumphrey, M.O.; Knowles, N.R.; et al. Low-altitude, high-resolution aerial imaging systems for row and field crop phenotyping: A review. Eur. J. Agron. 2015, 70, 112–123. [Google Scholar] [CrossRef]
  14. Sangjan, W.; Sankaran, S. Phenotyping architecture traits of tree species using remote sensing techniques. Trans. ASABE 2021, 64, 1611–1624. [Google Scholar] [CrossRef]
  15. Valencia-Ortiz, M.; Sangjan, W.; Selvaraj, M.G.; McGee, R.J.; Sankaran, S. Effect of the solar zenith angles at different latitudes on estimated crop vegetation indices. Drones 2021, 5, 80. [Google Scholar] [CrossRef]
  16. Zhang, C.; Marzougui, A.; Sankaran, S. High-resolution satellite imagery applications in crop phenotyping: An overview. Comput. Electron. Agric. 2020, 175, 105584. [Google Scholar] [CrossRef]
  17. Sangjan, W.; McGee, R.J.; Sankaran, S. Optimization of UAV-based imaging and image processing orthomosaic and point cloud approaches for estimating biomass in a forage crop. Remote Sens. 2022, 14, 2396. [Google Scholar] [CrossRef]
  18. Schellberg, J.; Verbruggen, E. Frontiers and perspectives on research strategies in grassland technology. Crop Pasture Sci. 2014, 65, 508–523. [Google Scholar] [CrossRef]
  19. Dos Reis, A.A.; Werner, J.P.S.; Silva, B.C.; Figueiredo, G.K.D.A.; Antunes, J.F.G.; Esquerdo, J.C.D.M.; Coutinho, A.C.; Lamparelli, R.A.C.; Rocha, J.V.; Magalhães, P.S.G. Monitoring pasture aboveground biomass and canopy height in an integrated crop–livestock system using textural information from PlanetScope imagery. Remote Sens. 2020, 12, 2534. [Google Scholar] [CrossRef]
  20. Chen, Y.; Fei, X.; Groisman, P.; Sun, Z.; Zhang, J.; Qin, Z. Contrasting policy shifts influence the pattern of vegetation production and C sequestration over pasture systems: A regional-scale comparison in Temperate Eurasian Steppe. Agric. Syst. 2019, 176, 102679. [Google Scholar] [CrossRef]
  21. Miao, L.; Sun, Z.; Ren, Y.; Schierhorn, F.; Müller, D. Grassland greening on the Mongolian Plateau despite higher grazing intensity. Land Degrad. Dev. 2021, 32, 792–802. [Google Scholar] [CrossRef]
  22. Paltsyn, M.Y.; Gibbs, J.P.; Iegorova, L.V.; Mountrakis, G. Estimation and prediction of grassland cover in western Mongolia using MODIS-derived vegetation indices. Rangel. Ecol. Manag. 2017, 70, 723–729. [Google Scholar] [CrossRef]
  23. Veloso, G.A.; Ferreira, M.E.; Júnior, L.G.F.; da Silva, B.B. Modelling gross primary productivity in tropical savanna pasturelands for livestock intensification in Brazil. Remote Sens. Appl. Soc. Environ. 2020, 17, 100288. [Google Scholar] [CrossRef]
  24. Wang, J.; Xiao, X.; Bajgain, R.; Starks, P.; Steiner, J.; Doughty, R.B.; Chang, Q. Estimating leaf area index and aboveground biomass of grazing pastures using Sentinel-1, Sentinel-2 and Landsat images. ISPRS J. Photogramm. Remote Sens. 2019, 154, 189–201. [Google Scholar] [CrossRef]
  25. Fernando, G.; Víctor, C. Pasture Monitoring Applying Normalized Difference Vegetation Index (NDVI) Time Series with Sentinel-2 and Landsat 8 Images, to Improve Milk Production at Santa Mónica Farm, Imbabura, Ecuador. In Computational Science and Its Applications–ICCSA 2020; Gervasi, O., Murgante, B., Misra, S., Garau, C., Blečić, I., Taniar, D., Apduhan, B.O., Rocha, A.M.A.C., Tarantino, E., Torre, C.M., et al., Eds.; Springer International Publishing: Cham, Switzerland, 2020; pp. 560–575. [Google Scholar] [CrossRef]
  26. Ara, I.; Harrison, M.T.; Whitehead, J.; Waldner, F.; Bridle, K.; Gilfedder, L.; da Silva, J.M.; Marques, F.; Rawnsley, R. Modelling seasonal pasture growth and botanical composition at the paddock scale with satellite imagery. Silico Plants 2021, 3, diaa013. [Google Scholar] [CrossRef]
  27. Chen, Y.; Guerschman, J.; Shendryk, Y.; Henry, D.; Harrison, M.T. Estimating pasture biomass using Sentinel-2 imagery and machine learning. Remote Sens. 2021, 13, 603. [Google Scholar] [CrossRef]
  28. Schuster, C.; Schmidt, T.; Conrad, C.; Kleinschmit, B.; Förster, M. Grassland habitat mapping by intra-annual time series analysis–Comparison of RapidEye and TerraSAR-X satellite data. Int. J. Appl. Earth Obs. Geoinf. 2015, 34, 25–34. [Google Scholar] [CrossRef]
  29. Roth, A.; Marschalk, U.; Winkler, K.; Schättler, B.; Huber, M.; Georg, I.; Künzer, C.; Dech, S. Ten years of experience with scientific TerraSAR-X data utilization. Remote Sens. 2018, 10, 1170. [Google Scholar] [CrossRef]
  30. Fauvel, M.; Lopes, M.; Dubo, T.; Rivers-Moore, J.; Frison, P.L.; Gross, N.; Ouin, A. Prediction of plant diversity in grasslands using Sentinel-1 and-2 satellite image time series. Remote Sens. Environ. 2020, 237, 111536. [Google Scholar] [CrossRef]
  31. De Vroey, M.; Radoux, J.; Defourny, P. Grassland mowing detection using sentinel-1 time series: Potential and limitations. Remote Sens. 2021, 13, 348. [Google Scholar] [CrossRef]
  32. Gao, R.; Kong, Q.; Wang, H.; Su, Z. Diagnostic feed values of natural grasslands based on multispectral images acquired by small unmanned aerial vehicle. Rangel. Ecol. Manag. 2019, 72, 916–922. [Google Scholar] [CrossRef]
  33. Insua, J.R.; Utsumi, S.A.; Basso, B. Estimation of spatial and temporal variability of pasture growth and digestibility in grazing rotations coupling unmanned aerial vehicle (UAV) with crop simulation models. PLoS ONE 2019, 14, e0212773. [Google Scholar] [CrossRef] [PubMed]
  34. Zhou, Y.; Gowda, P.H.; Wagle, P.; Ma, S.; Neel, J.P.; Kakani, V.G.; Steiner, J.L. Climate effects on tallgrass prairie responses to continuous and rotational grazing. Agronomy 2019, 9, 219. [Google Scholar] [CrossRef]
  35. Reinermann, S.; Asam, S.; Kuenzer, C. Remote sensing of grassland production and management—A review. Remote Sens. 2020, 12, 1949. [Google Scholar] [CrossRef]
  36. Billman, E.D.; Williamson, J.A.; Soder, K.J.; Andreen, D.M.; Skinner, R.H. Mob and rotational grazing influence pasture biomass, nutritive value, and species composition. Agron. J. 2020, 112, 2866–2878. [Google Scholar] [CrossRef]
  37. Guretzky, J.A.; Mamo, M.; Schacht, W.H.; Volesky, J.D.; Wingeyer, A.B. Mob grazing increases trampling but not litter deposition on a Nebraska Sandhills subirrigated meadow. Crop Forage Turfgrass Manag. 2020, 6, e20047. [Google Scholar] [CrossRef]
  38. Green, S.; Brazee, B. Harvest Efficiency in Prescribed Grazing; Technical Note No. TN Range No. 73; USDA National Resources Conservation Service: Boise, ID, USA, 2012.
  39. Leach, N.; Coops, N.C.; Obrknezev, N. Normalization method for multi-sensor high spatial and temporal resolution satellite imagery with radiometric inconsistencies. Comput. Electron. Agric. 2019, 164, 104893. [Google Scholar] [CrossRef]
  40. Scheffler, D.; Hollstein, A.; Diedrich, H.; Segl, K.; Hostert, P. AROSICS: An automated and robust open-source image co-registration software for multi-sensor satellite data. Remote Sens. 2017, 9, 676. [Google Scholar] [CrossRef]
  41. Canty, M.J.; Nielsen, A.A.; Schmidt, M. Automatic radiometric normalization of multitemporal satellite imagery. Remote Sens. Environ. 2004, 91, 441–451. [Google Scholar] [CrossRef] [Green Version]
  42. Quirós Vargas, J.J.; Zhang, C.; Smitchger, J.A.; McGee, R.J.; Sankaran, S. Phenotyping of plant biomass and performance traits using remote sensing techniques in pea (Pisum sativum, L.). Sensors 2019, 19, 2031. [Google Scholar] [CrossRef]
  43. Gitelson, A.A.; Gritz, Y.; Merzlyak, M.N. Relationships between leaf chlorophyll content and spectral reflectance and algorithms for non-destructive chlorophyll assessment in higher plant leaves. J. Plant Physiol. 2003, 160, 271–282. [Google Scholar] [CrossRef] [PubMed]
  44. Jiang, Z.; Huete, A.R.; Didan, K.; Miura, T. Development of a two-band enhanced vegetation index without a blue band. Remote Sens. Environ. 2008, 112, 3833–3845. [Google Scholar] [CrossRef]
  45. Louhaichi, M.; Borman, M.M.; Johnson, D.E. Spatially located platform and aerial photography for documentation of grazing impacts on wheat. Geocarto Int. 2001, 16, 65–70. [Google Scholar] [CrossRef]
  46. Gitelson, A.A.; Kaufman, Y.J.; Merzlyak, M.N. Use of a green channel in remote sensing of global vegetation from EOS-MODIS. Remote Sens. Environ. 1996, 58, 289–298. [Google Scholar] [CrossRef]
  47. Boegh, E.; Soegaard, H.; Broge, N.; Hasager, C.B.; Jensen, N.O.; Schelde, K.; Thomsen, A. Airborne multispectral data for quantifying leaf area index, nitrogen concentration, and photosynthetic efficiency in agriculture. Remote Sens. Environ. 2002, 81, 179–193. [Google Scholar] [CrossRef]
  48. Haboudane, D.; Miller, J.R.; Pattey, E.; Zarco-Tejada, P.J.; Strachan, I.B. Hyperspectral vegetation indices and novel algorithms for predicting green LAI of crop canopies: Modeling and validation in the context of precision agriculture. Remote Sens. Environ. 2004, 90, 337–352. [Google Scholar] [CrossRef]
  49. Qi, J.; Chehbouni, A.; Huete, A.R.; Kerr, Y.H.; Sorooshian, S. A modified soil adjusted vegetation index. Remote Sens. Environ. 1994, 48, 119–126. [Google Scholar] [CrossRef]
  50. Rouse, J.W.; Haas, R.H.; Schell, J.A.; Deering, D.W. Monitoring vegetation systems in the Great Plains with ERTS. NASA Spec. Publ. 1974, 351, 309–317. [Google Scholar]
  51. Rondeaux, G.; Steven, M.; Baret, F. Optimization of soil-adjusted vegetation indices. Remote Sens. Environ. 1996, 55, 95–107. [Google Scholar] [CrossRef]
  52. Gitelson, A.A. Wide dynamic range vegetation index for remote quantification of biophysical characteristics of vegetation. J. Plant Physiol. 2004, 161, 165–173. [Google Scholar] [CrossRef] [Green Version]
  53. Huete, A.; Didan, K.; Miura, T.; Rodriguez, E.P.; Gao, X.; Ferreira, L.G. Overview of the radiometric and biophysical performance of the MODIS vegetation indices. Remote Sens. Environ. 2002, 83, 195–213. [Google Scholar] [CrossRef]
  54. De Mendiburu, F. Agricolae: Statistical Procedures for Agricultural Researc, R Package Version 1.3–3; Comprehensive R Arch. Network. 2020. Available online: https://CRAN.R-project.org/package=agricolae (accessed on 18 July 2021).
  55. Schowengerdt, R.A. Remote Sensing: Models and Methods for Image Processing; Elsevier: Amsterdam, The Netherlands, 2006. [Google Scholar]
  56. Delegido, J.; Verrelst, J.; Meza, C.M.; Rivera, J.P.; Alonso, L.; Moreno, J. A red-edge spectral index for remote sensing estimation of green LAI over agroecosystems. Eur. J. Agron. 2013, 46, 42–52. [Google Scholar] [CrossRef]
  57. Dong, T.; Liu, J.; Shang, J.; Qian, B.; Ma, B.; Kovacs, J.M.; Walters, D.; Jiao, X.; Geng, X.; Shi, Y. Assessment of red-edge vegetation indices for crop leaf area index estimation. Remote Sens. Environ. 2019, 222, 133–143. [Google Scholar] [CrossRef]
  58. Matese, A.; Toscano, P.; Di Gennaro, S.F.; Genesio, L.; Vaccari, F.P.; Primicerio, J.; Belli, C.; Zaldei, A.; Bianconi, R.; Gioli, B. Intercomparison of UAV, aircraft and satellite remote sensing platforms for precision viticulture. Remote Sens. 2015, 7, 2971–2990. [Google Scholar] [CrossRef]
  59. Akumu, C.E.; Amadi, E.O.; Dennis, S. Application of drone and worldview-4 satellite data in mapping and monitoring grazing land cover and pasture quality: Pre-and post-flooding. Land 2021, 10, 321. [Google Scholar] [CrossRef]
  60. Gao, Q.; Schwartz, M.W.; Zhu, W.; Wan, Y.; Qin, X.; Ma, X.; Liu, S.; Williamson, M.A.; Peters, C.B.; Li, Y. Changes in global grassland productivity during 1982 to 2011 attributable to climatic factors. Remote Sens. 2016, 8, 384. [Google Scholar] [CrossRef]
  61. Qamer, F.M.; Xi, C.; Abbas, S.; Murthy, M.S.; Ning, W.; Anming, B. An assessment of productivity patterns of grass-dominated rangelands in the Hindu Kush Karakoram region, Pakistan. Sustainability 2016, 8, 961. [Google Scholar] [CrossRef]
  62. Kath, J.; Le Brocque, A.F.; Reardon-Smith, K.; Apan, A. Remotely sensed agricultural grassland productivity responses to land use and hydro-climatic drivers under extreme drought and rainfall. Agric. For. Meteorol. 2019, 268, 11–22. [Google Scholar] [CrossRef]
  63. Wylie, B.; Howard, D.; Dahal, D.; Gilmanov, T.; Ji, L.; Zhang, L.; Smith, K. Grassland and cropland net ecosystem production of the US Great Plains: Regression tree model development and comparative analysis. Remote Sens. 2016, 8, 944. [Google Scholar] [CrossRef]
  64. Magiera, A.; Feilhauer, H.; Waldhardt, R.; Wiesmair, M.; Otte, A. Modelling biomass of mountainous grasslands by including a species composition map. Ecol. Indic. 2017, 78, 8–18. [Google Scholar] [CrossRef]
  65. Yin, G.; Li, A.; Wu, C.; Wang, J.; Xie, Q.; Zhang, Z.; Nan, X.; Jin, H.; Bian, J.; Lei, G. Seamless upscaling of the field-measured grassland aboveground biomass based on gaussian process regression and gap-filled landsat 8 OLI reflectance. ISPRS Int. J. Geo-Inf. 2018, 7, 242. [Google Scholar] [CrossRef]
  66. Zeng, N.; Ren, X.; He, H.; Zhang, L.; Zhao, D.; Ge, R.; Li, P.; Niu, Z. Estimating grassland aboveground biomass on the Tibetan Plateau using a random forest algorithm. Ecol. Indic. 2019, 102, 479–487. [Google Scholar] [CrossRef]
  67. Dusseux, P.; Vertès, F.; Corpetti, T.; Corgne, S.; Hubert-Moy, L. Agricultural practices in grasslands detected by spatial remote sensing. Environ. Monit. Assess. 2014, 186, 8249–8265. [Google Scholar] [CrossRef] [PubMed]
  68. Tamm, T.; Zalite, K.; Voormansik, K.; Talgre, L. Relating Sentinel-1 interferometric coherence to mowing events on grasslands. Remote Sens. 2016, 8, 802. [Google Scholar] [CrossRef]
  69. Lopes, M.; Fauvel, M.; Girard, S.; Sheeren, D. Object-based classification of grasslands from high resolution satellite image time series using Gaussian mean map kernels. Remote Sens. 2017, 9, 688. [Google Scholar] [CrossRef]
  70. John, R.; Chen, J.; Giannico, V.; Park, H.; Xiao, J.; Shirkey, G.; Ouyang, Z.; Shao, C.; Qi, J. Grassland canopy cover and aboveground biomass in Mongolia and Inner Mongolia: Spatiotemporal estimates and controlling factors. Remote Sens. Environ. 2018, 213, 34–48. [Google Scholar] [CrossRef]
  71. Taravat, A.; Wagner, M.P.; Oppelt, N. Automatic grassland cutting status detection in the context of spatiotemporal Sentinel-1 imagery analysis and artificial neural networks. Remote Sens. 2019, 11, 711. [Google Scholar] [CrossRef] [Green Version]
Figure 1. Location and weather data of the study area (a) the study location in Cheney, WA, United States, and (b) monthly meteorological data of Spokane County in Washington State, US, from January 2015 to December 2020 acquired from NOAA–NECI.
Drones 06 00232 g001
Figure 2. Experimental design of the study area consisted of two different grazing managements: LD—low density and HD—high density with four soil fertility management: N—no fertility supplement (control), M—partially-aged manure, P—organic forms of phosphorus, and sulfur fertilizers, and C—non-aerated compost tea.
Drones 06 00232 g002
Figure 3. Image processing pipeline used to process both satellite and UAS imagery.
Drones 06 00232 g003
Figure 4. Vegetation index maps of the study area constructed from satellite (2017–2019) and UAS (2019) imagery.
Drones 06 00232 g004
Figure 5. Box-and-whisker plots of extracted mean statistical VI data, EVI2 and MCARI2, created from satellite images from 2017 to 2019 to represent the pasture productivity changing on different grazing intensities and fertility management over the study period between original data and normalized data.
Drones 06 00232 g005
Figure 6. Grazing density effects on VI data extracted from satellite and UAS imagery. F: main effect from fertility management; I: interaction effect from grazing density and fertility management.
Drones 06 00232 g006
Figure 7. Effects of grazing density on the mean EVI2 and MCARI2 data extracted from satellite and UAS imagery in 2019. Different letters above each bar indicate statistically different means between grazing density treatments (p < 0.05, except the normalized data of UAS imagery p < 0.10; ANOVA; Fisher’s LSD test).
Drones 06 00232 g007
Figure 8. Scatter plots demonstrating the relationship of the extracted VI values from satellite and UAS sensing platforms in 2019 (a) mean data and (b) median data.
Drones 06 00232 g008
Table 1. Parameters and information for sensors applied in the study.
Parameter/SensorPlanetScope (Level 3B)DJI Phantom 4 ProRedEdge
TypeMultispectralVisible (RGB 1)Multispectral
PlatformSatelliteUASUAS
Spatial resolution3 m0.62 cm 23.44 cm 3
Spectral band (nm)Blue: 455–515
Green: 500–590
Red: 590–670
NIR: 780–860
Blue, Green, and Red: 390~700Blue: 475 ± 10
Green: 560 ± 10
Red: 668 ± 5
Red Edge: 717 ± 5
NIR 4: 840 ± 20
Acquisition date5 June 2017
8 June 2018
28 May 2019
28 May 201928 May 2019
1 RGB: Red-Green-Blue spectral bands; 2 Raw images were acquired at 25 m UAS flight altitude; 3 Raw images were acquired at 50 m UAS flight altitude; 4 NIR: Near-Infrared.
Table 2. Summary of vegetation indices that were extracted in the study.
Vegetation IndexFormulationRef.
Chlorophyll Index GreenCIgreen N I R G r e e n 1 [43]
Enhanced Vegetation Index 2EVI2 2.5 × N I R R e d 1 + N I R + 2.4 × R e d [44]
Green Leaf IndexGLI 2 × G r e e n R e d B l u e 2 × G r e e n + R e d + B l u e [45]
Green Normalized Difference Vegetation IndexGNDVI N I R G r e e n N I R + G r e e n [46]
Leaf Area IndexLAI 3.618 × E V I   1 0.118 [47]
Modified Chlorophyll Absorption Ratio Index 2MCARI2 1.5 × 2.5 × N I R R e d 1.3 × N I R G r e e n 2 × N I R + 1 2   6 × N I R 5 × R e d 0.5 [48]
Modified Soil Adjusted Vegetation Index 2MSAVI2 2 × N I R + 1 2 × N I R + 1 2 ( 8 × N I R R e d 2 [49]
Normalized Difference Vegetation IndexNDVI N I R R e d N I R + R e d [50]
Optimized Soil Adjusted Vegetation IndexOSAVI N I R R e d N I R + R e d + 0.16 [51]
Wide Dynamic Range Vegetation IndexWDRVI b × N I R R e d b × N I R + R e d ; b = 0.15 [52]
1 EVI: Enhanced Vegetation Index = 2.5 × N I R R e d N I R + 6 × R e d 7.5 × B l u e + 1 , ref. [53].
Publisher’s Note: MDPI stays neutral with regard to jurisdictional claims in published maps and institutional affiliations.

