Abstract
Software engineering is a discipline utilizing Unified Modelling Language (UML) diagrams, which are accepted as a standard to depict object-oriented design models. UML diagrams make it easier to identify the requirements and scopes of systems and applications by providing visual models. In this manner, this study aims to systematically review the literature on UML diagram utilization in software engineering research. A comprehensive review was conducted over the last two decades, spanning from 2000 to 2019. Among several papers, 128 were selected and examined. The main findings showed that UML diagrams were mostly used for the purpose of design and modeling, and class diagrams were the most commonly used ones.
Published: 10 March 2021
1. Introduction
Software enables organizations to adopt competitive differentiation and competitive change because they can design, enhance, and adapt their systems, products, and services to different market sectors, from manufacturing to art, and provide rapid and flexible supply chain management [1]. However, every aspect of a system or application is determined to develop software. Therefore, software development is complex [2], and software engineering has emerged as an engineering discipline which deals with any software product from the early stages of system specification to the maintenance of this system or application. It helps develop more reliable systems and decreases the cost for developing the system [3].
Systematic literature review (SLR) is a research methodology, which makes it easier to recognize, analyze, and interpret all existing studies [4]. Its objective is not only finding all evidence for research questions but also contributing to improve evidence-based guidelines [5]. It consists of three processes, which are planning, execution, and reporting. Although these processes can consist of many steps depending on the research target, it must include the steps of data retrieval, study selection, data extraction, and data synthesis [6].
The Unified Modeling Language (UML) is also used to develop a system in software engineering, which is a visual language to define and document a system. The requirements in scenarios that express how users use a system are shown with the UML. The constraints of a system are also shown with the UML [4]. Hence, many researchers who work as software engineers publish papers about how UML diagrams are utilized to develop a system and contribute to the practice in order to advance the software engineering discipline. In our study, SLR is used to understand which UML diagrams are popular, why they are used, and which application areas are the most popular [2].
The aim of this paper is to determine the situation and the future of UML diagrams in the software engineering discipline. Thus, the research questions and keywords were identified, and then publications between 2000 and 2019 were investigated using Google Scholar. A total of 247 publications were found, and 128 of them included the following UML diagrams: a class diagram, activity diagram, sequence/interaction diagram, state machine diagram, system sequence diagram, deployment diagram, collaboration/communication diagram, package diagram, object diagram, domain model diagram, and a component diagram. These publications were classified in terms of the distribution years, the publishers, the application areas, the usage purpose, and the types of UML diagrams. A Microsoft Excel spreadsheet was used to store and analyze these data with bar graphs and pie charts.
The rest of the paper is composed of three sections: Method, Results, and Conclusion. In the Method section, the SLR process is investigated in detail, giving an outline for how the methodology is applied and how the data is collected, which consists of four sub-sections: Research Questions, Search Strategy, Inclusion and Exclusion Criteria, and Data Extraction. The Results section expresses the findings for the included papers, which is composed of five subsections, those being the answers to the research questions. The last section includes discussion and comments on the findings, the situation, and the future of this study.
2. Method
This study was conducted with the SLR methodology in three phases, consisting of planning, exploring, and reporting, based on Kitchenham’s theoretical framework. In this framework, each of the phases can be broken down into many steps [6]. The planning phase consists of the following steps: research questions, search strategy, inclusion and exclusion criteria, and data extraction.
2.1. Research Questions
The objective of this paper is to investigate the use of various types of UML diagrams against various variables. Several research questions were discussed, based on the previous literature and on common sense. The following are the basic research questions:
- RQ1.
- What is the distribution of the number of publications by year?
- RQ2.
- What is the distribution of the number of publications by publishers and publishing types?
- RQ3.
- What is the distribution of the publications according to the application areas?
- RQ4.
- For which purposes are UML diagrams utilized in the publications?
- RQ5.
- What are the most commonly used UML diagrams in the publications?
2.2. Search Strategy
This systematic literature review was performed through only the Google Scholar search engine, using a set of predefined keywords (shown in Table 1). The base keyword for the search strings was UML. This keyword was combined with the search strings listed in Table 1. The years between 2000 and 2019 were determined to be the target period, and relevant articles were downloaded that met the general criterion, which included at least one of the UML diagrams given in Table 2.
Table 1.
Search strings.
Table 2.
Types of Unified Modeling Language (UML) diagrams.
Moreover, the process of forward and backward snowballing was undertaken to extend the research into two stages: using the original papers and then using the additional papers that were found [7]. To do this, for each paper, the members of the team checked the references in the paper, looking at the titles as well as the abstracts.
2.3. Inclusion and Exclusion Criteria
After a general research strategy and criteria, several relevant keywords were identified in terms of the research questions, the research was organized, and 247 publications were found in the databases. A set of detailed criteria was created in order to select the publications related to the research purpose. The inclusion and exclusion criteria were the following:
- The publications must be published in the English language;
- The publications must be published between 2000 and 2019;
- The publications must include at the least one UML diagram.
Figure 1 displays the SLR process and the results of the inclusion and exclusion criteria, and 52% of the downloaded publications—that is 128 publications—were included in the study out of a total number of 247 papers.
Figure 1.
Systematic literature review diagram.
2.4. Data Extraction
A data extraction process was conducted in order to deal with the research questions and discover patterns and trends. For this purpose, a Microsoft Excel spreadsheet was used to store and organize the data about the publications, which were the certain classification characteristics regarding the research questions such as type, publisher, usage purpose, and application area. Table 3 shows each classification characteristic and their categories used in this study.
Table 3.
The classification characteristics for the publications.
3. Results
This section explains the results of our literature review analyses on the publications and includes the findings related to the research questions. It is organized as subsections in terms of the research questions.
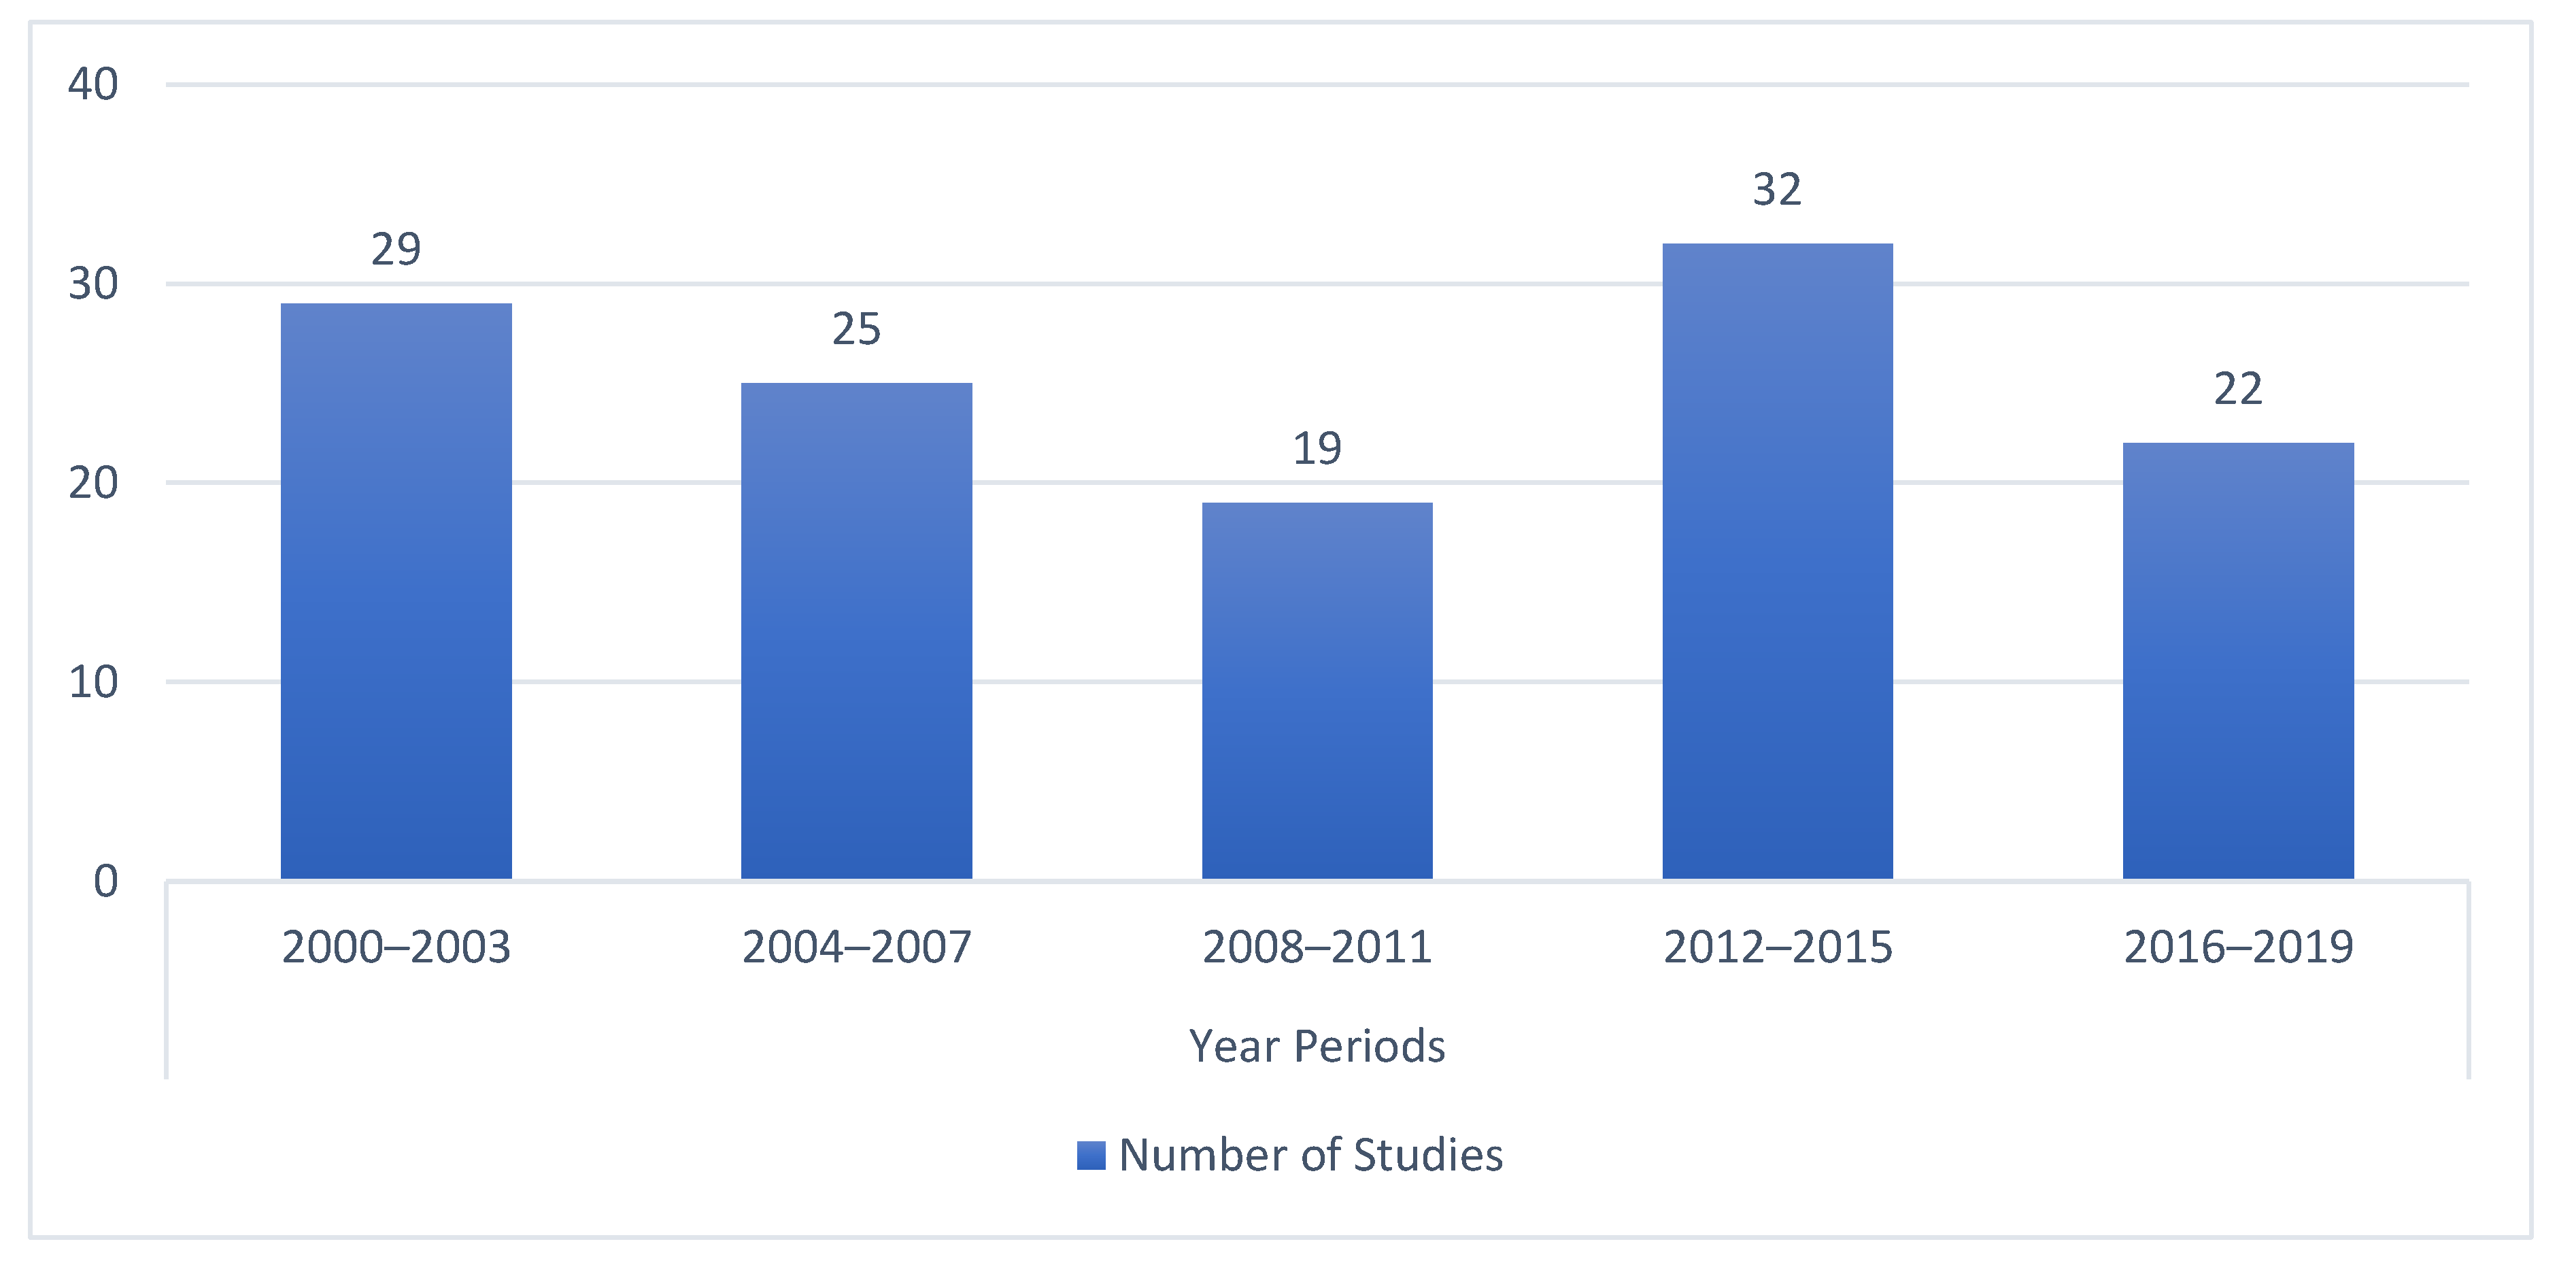
3.1. RQ1. What Is the Distribution of the Number of Publications by Year?
Figure 2 shows the distribution of the publications between 2000 and 2019 through four-year subperiods. The peak subperiod was between 2012 and 2015 at 25%, whereas the subperiod between 2000 and 2004 was 23%, the subperiod between 2004 and 2007 was 20%, and the subperiod between 2016 and 2019 was 17%.
Figure 2.
Distribution of papers based on four-year subperiods.
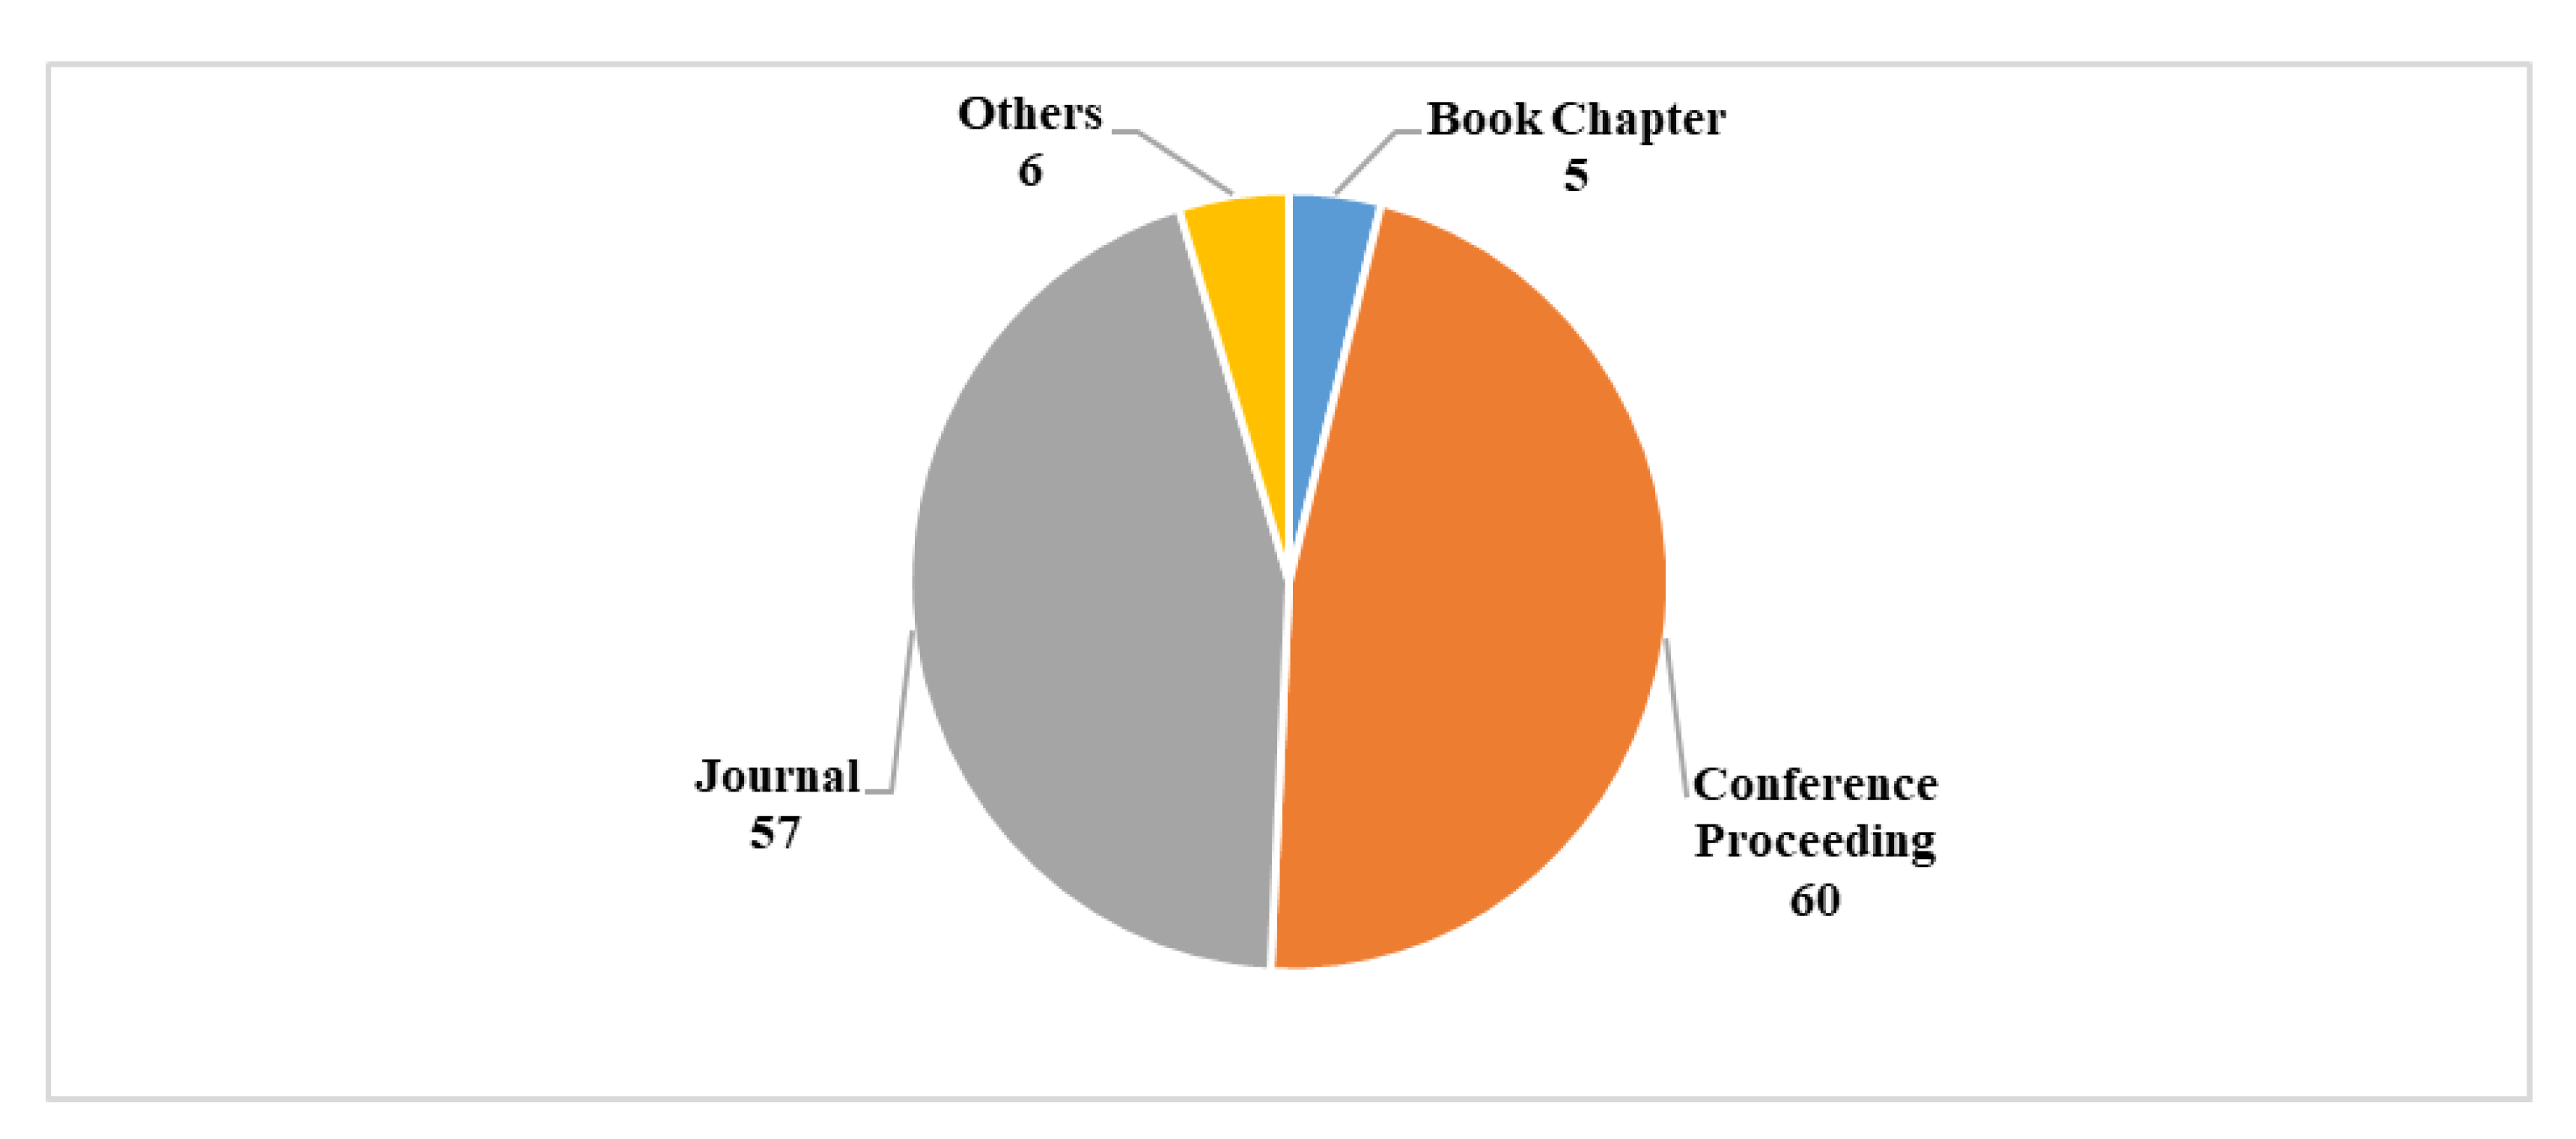
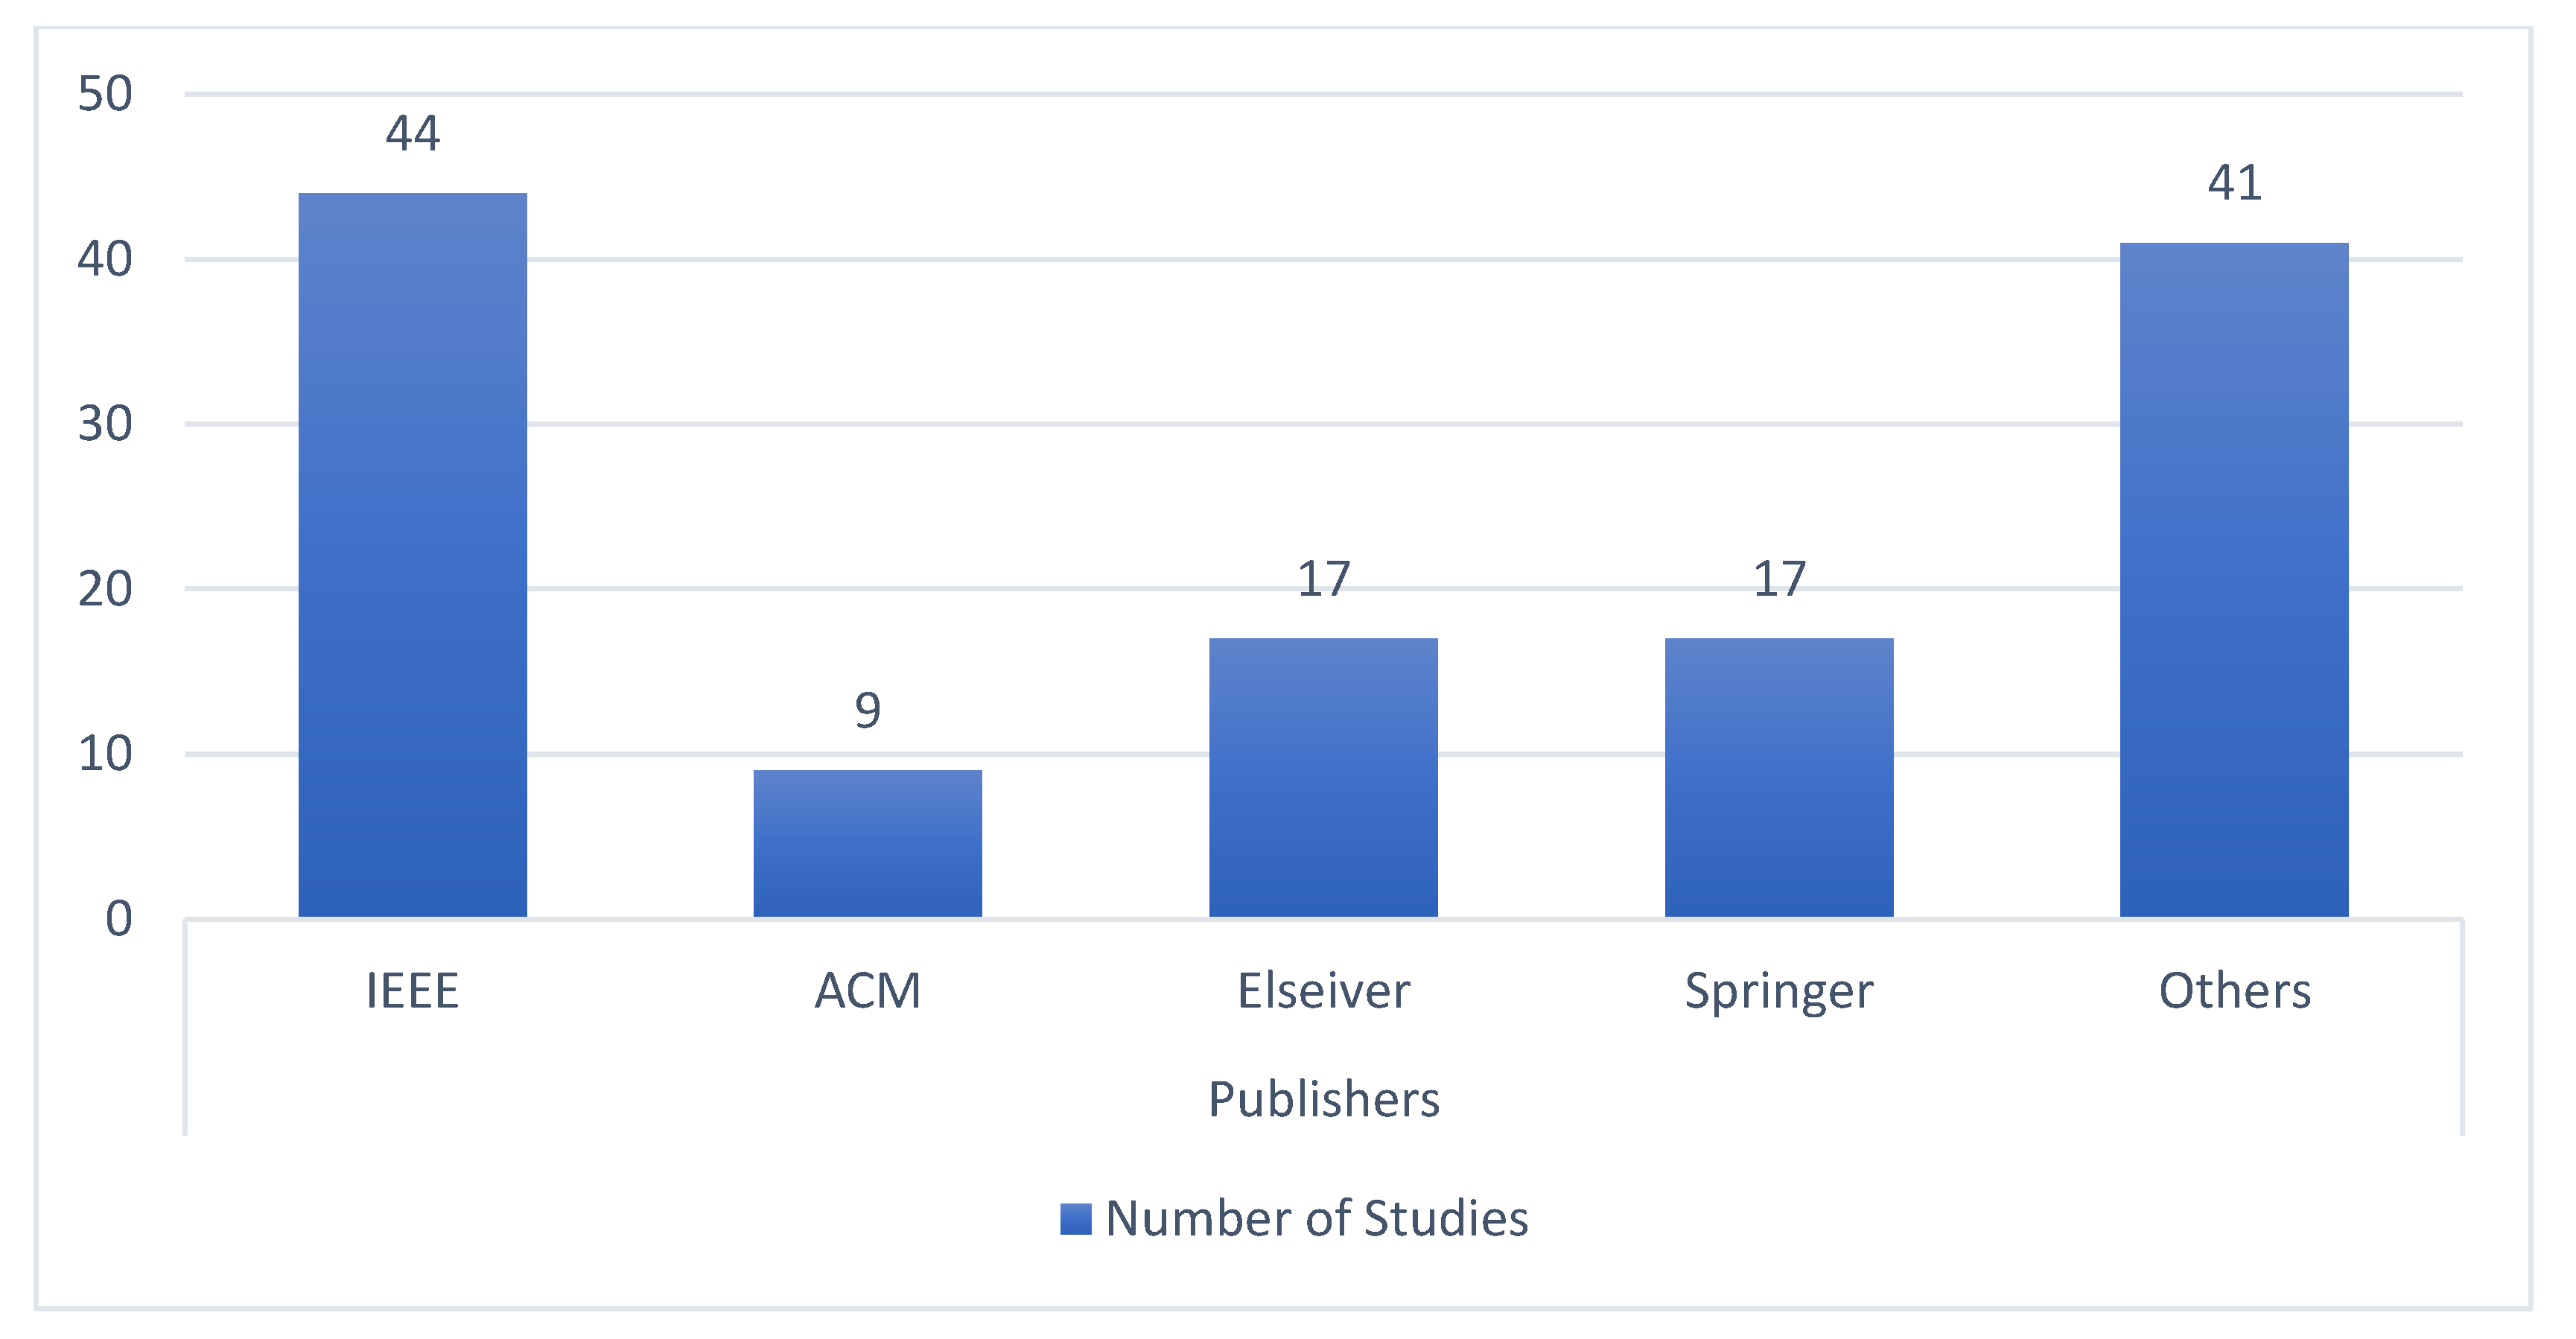
3.2. RQ2. What Is the Distribution of the Number of Publications by Publishers and Publishing Types?
Figure 3 illustrates the distribution of the types of publications. It expresses that the number of conference proceedings was 60, which was 47% of all publications, while the book chapter publications had the lowest number and percentage of 4%, the number of journal papers had a rate of 44%, and the percentage of other publications was 5%.
Figure 3.
The number of articles by publication type.
Figure 4 shows the number of publications in terms of the publishers. A total of 44 publications were published by IEEE, while Elsevier and Springer had the same number of publications at 17. Moreover, 9 publications were published in ACM. Other publishers, such as Taylor & Francis, Wiley, and others, had 41 publications.
Figure 4.
Distribution of articles by publisher.
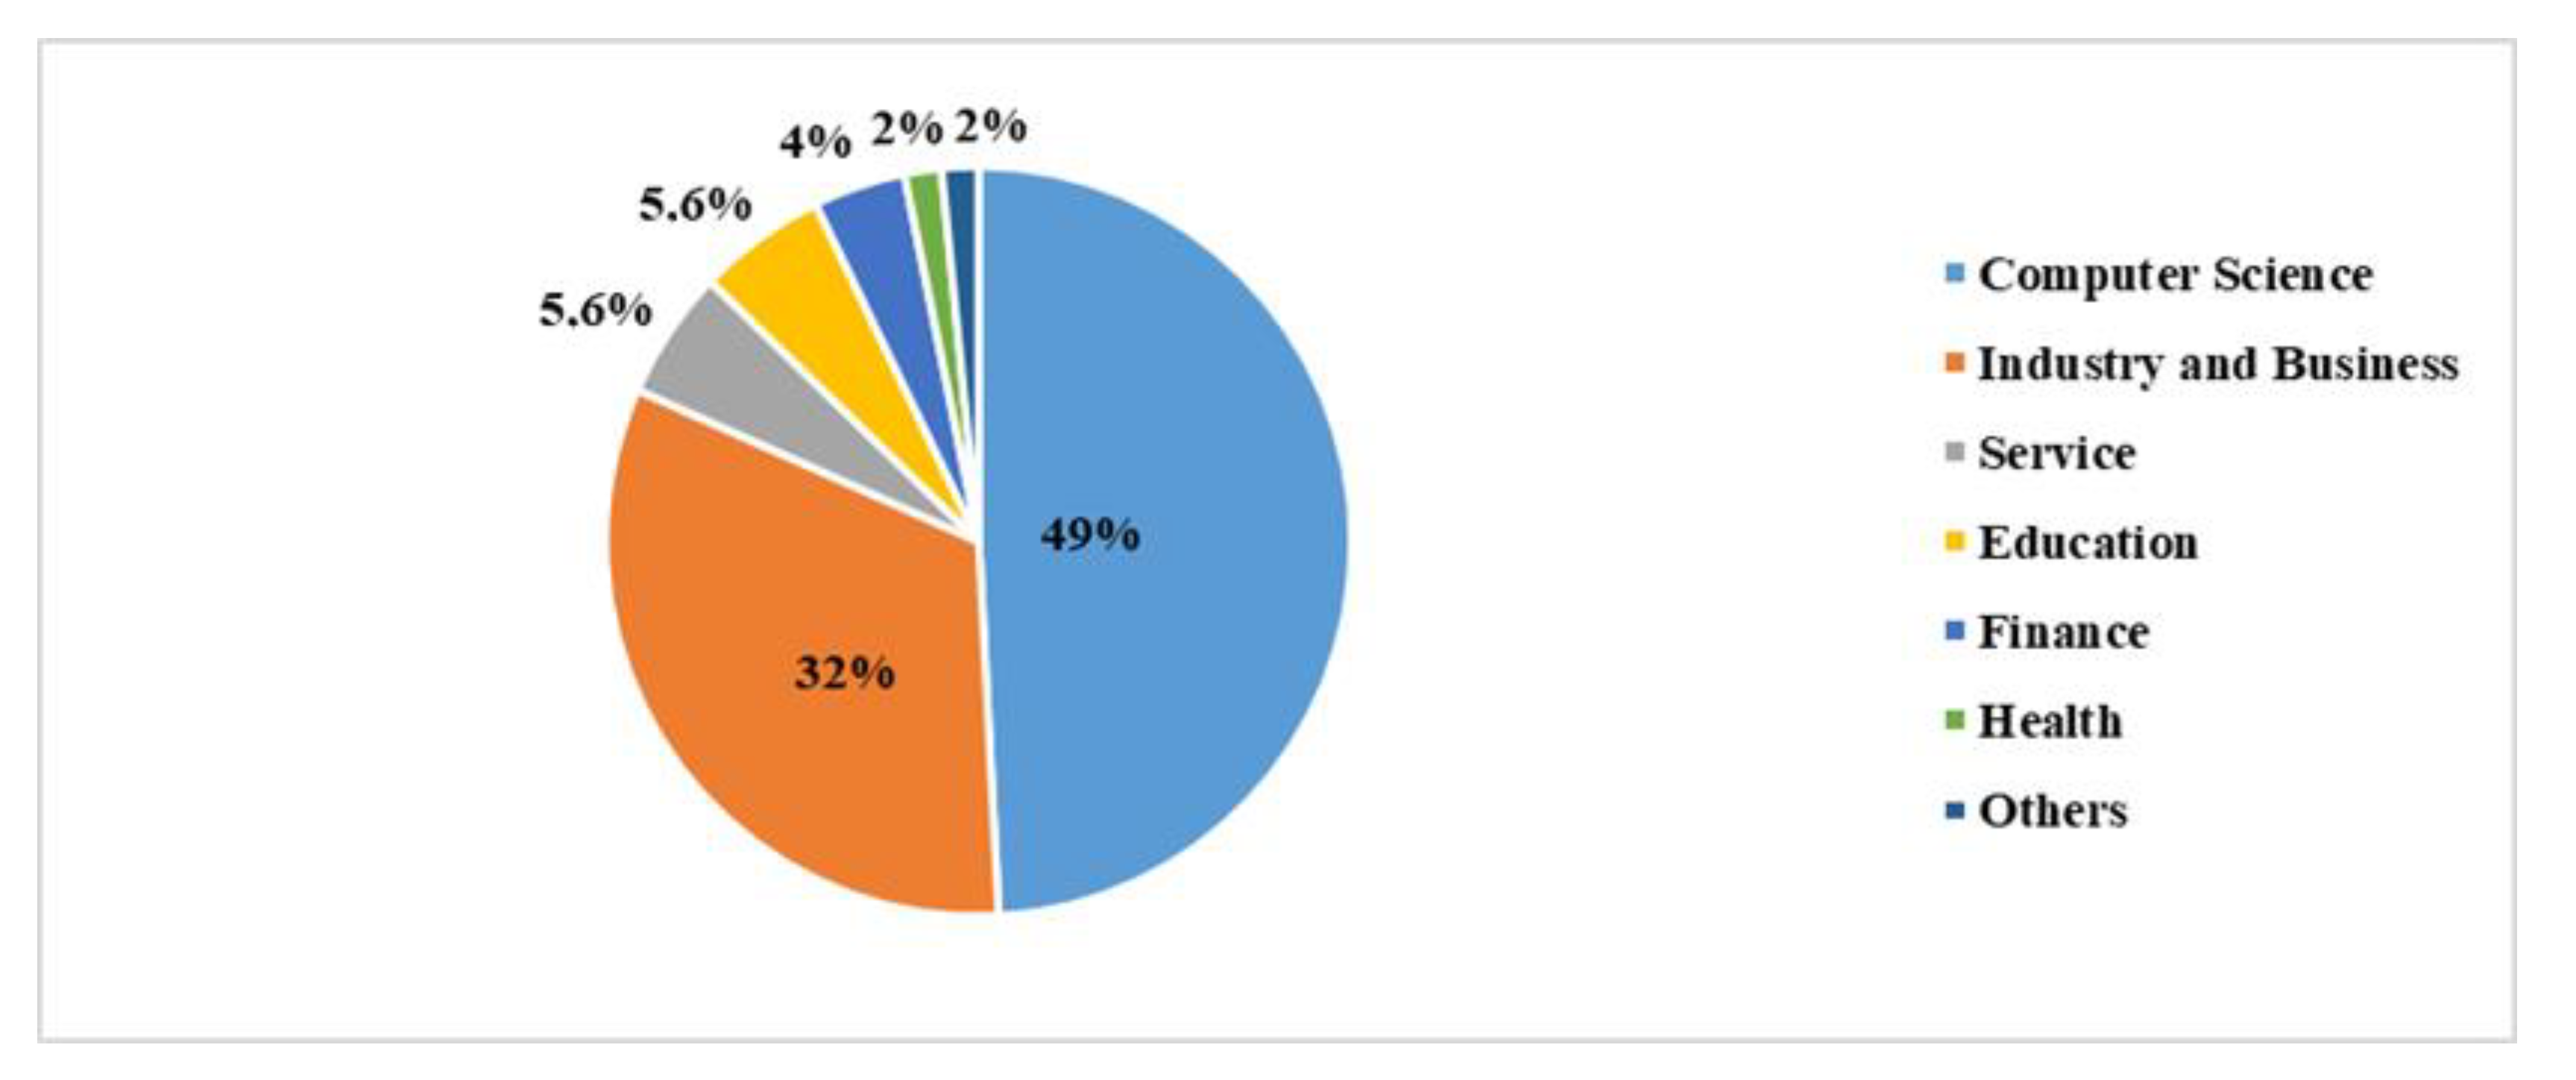
3.3. RQ3. What Is the Distribution of the Publications According to the Application Areas?
Figure 5 expresses the distribution of publications for each application. The greatest number of publications was mainly published for computer science and industry and business applications, respectively, whereas the least number of articles was published for finance and other application areas.
Figure 5.
Distribution of publications by application area.
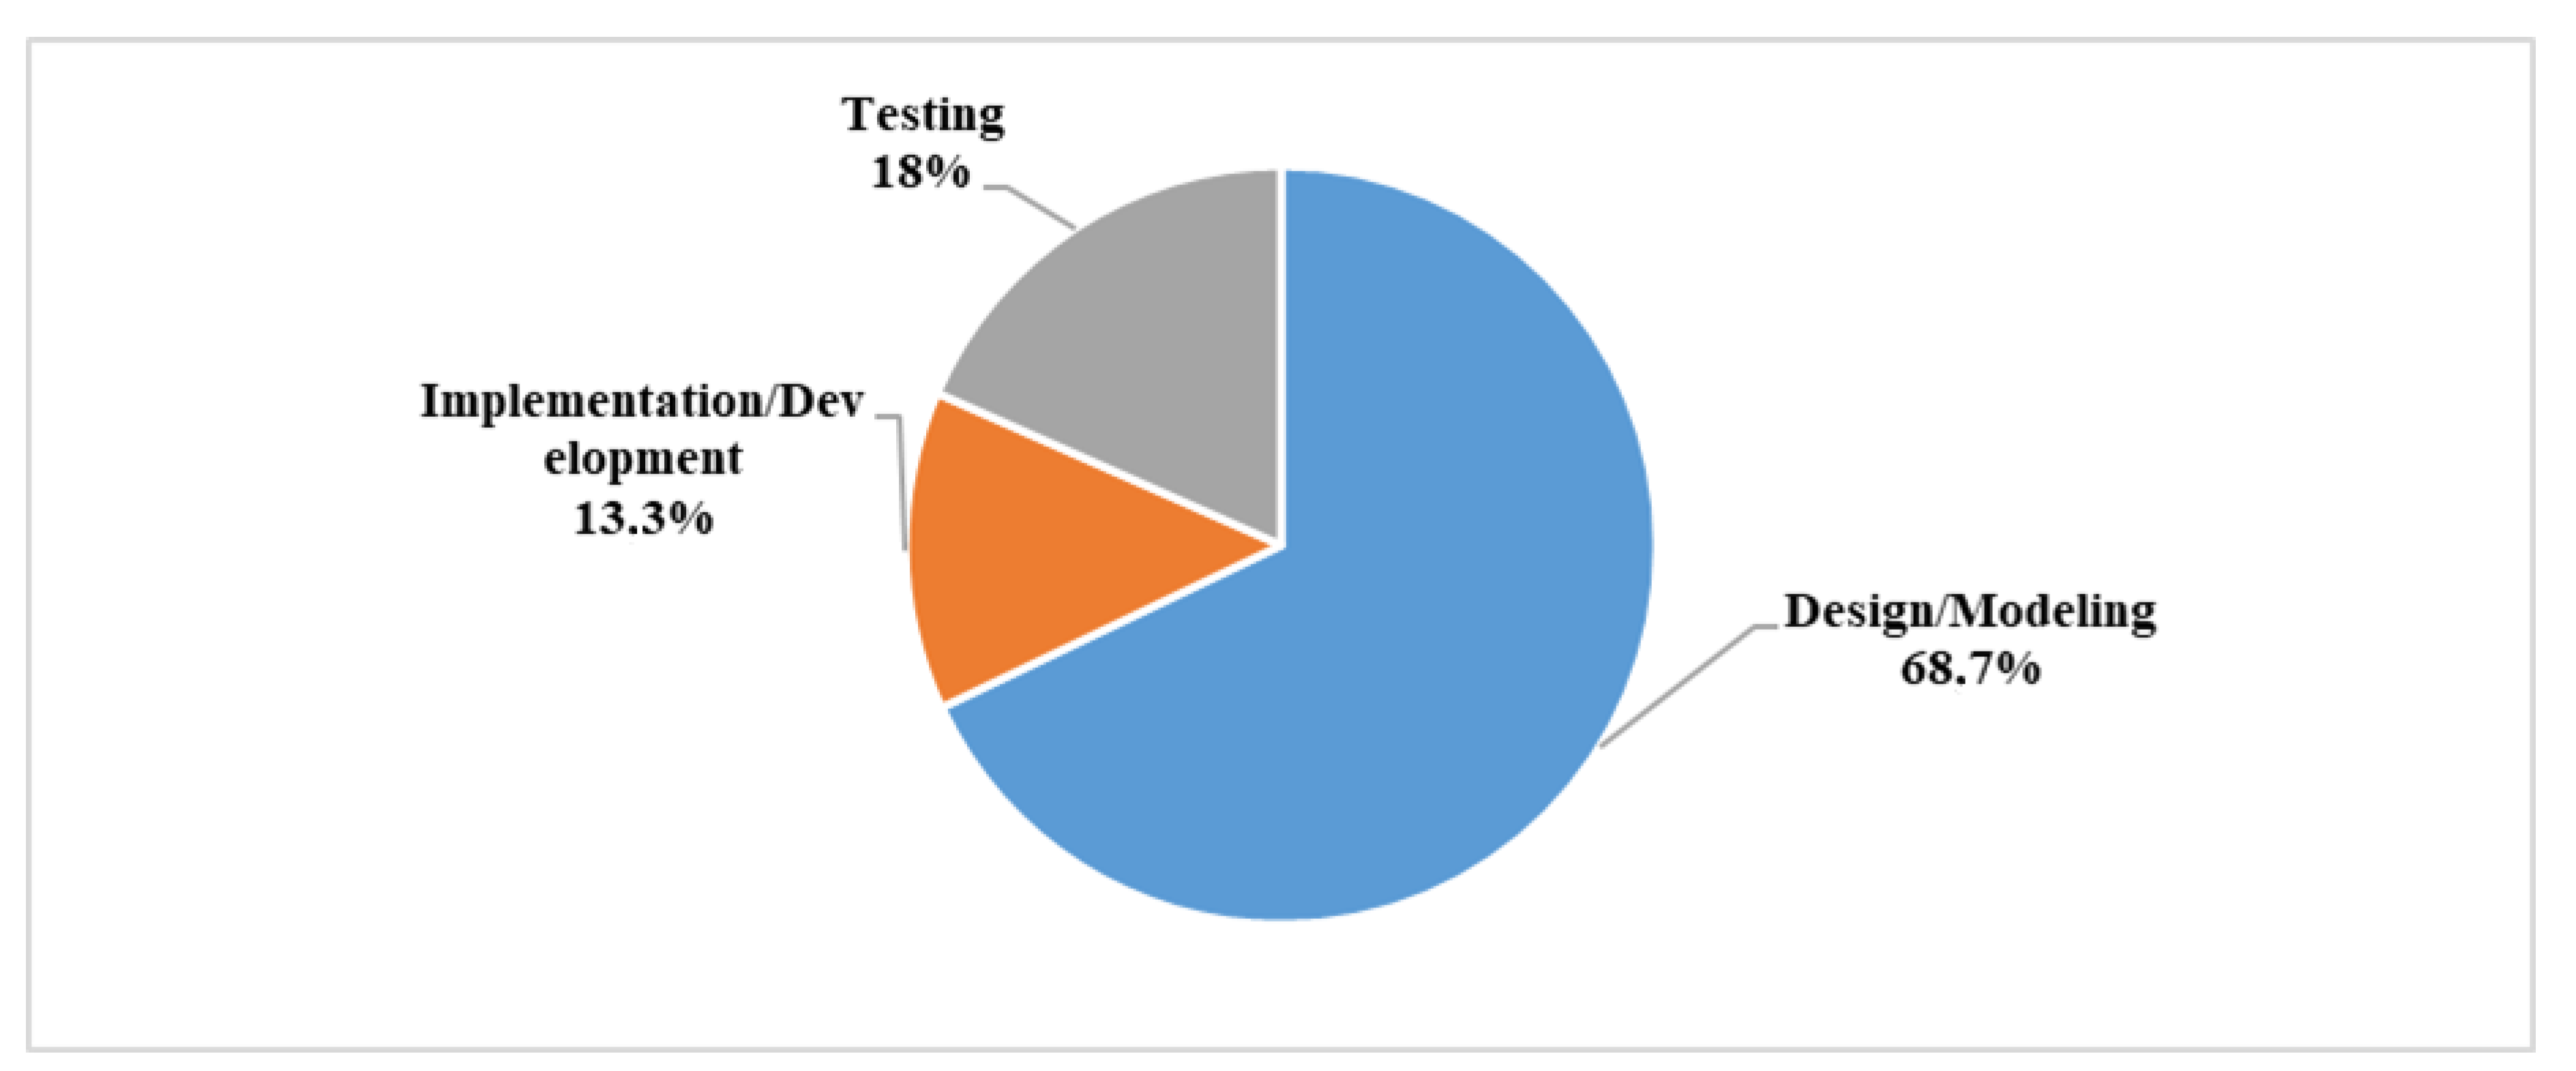
3.4. RQ4. For Which Purposes Are UML Diagrams Utilized in the Publications?
More than two-thirds of the publications used UML diagrams for design purposes. Other purposes for utilizing UML diagrams included testing and implementation or development, with percentages of 18% and 13.3%, respectively. These can be seen in Figure 6 in detail.
Figure 6.
Distribution of articles by purpose of UML diagram usage.
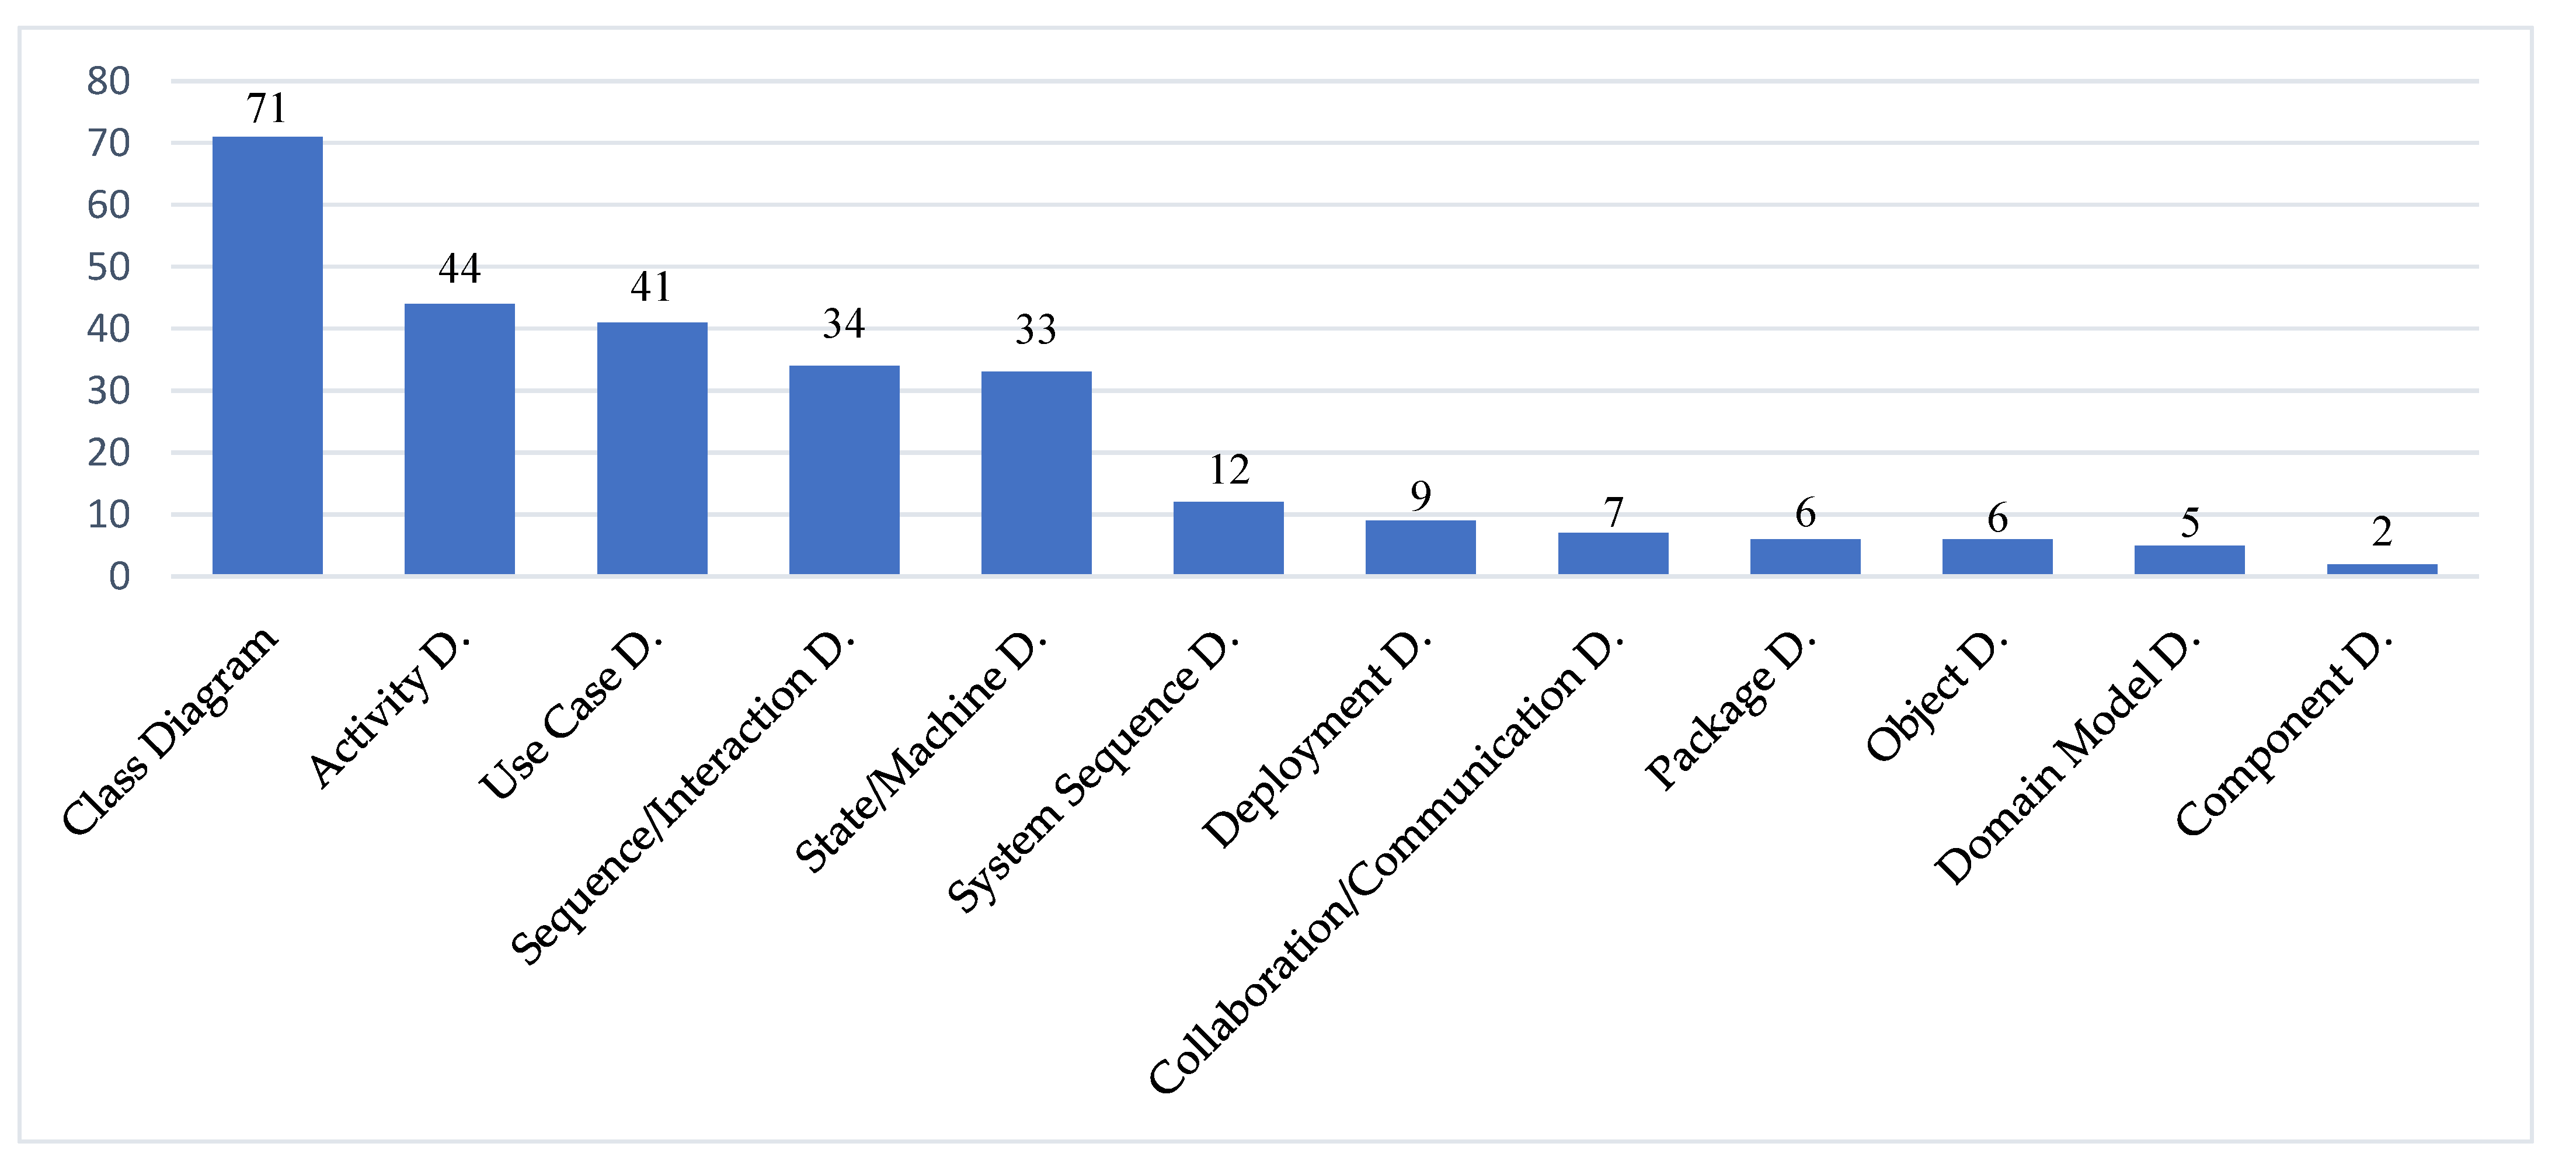
3.5. RQ5. What Are the Most Commonly Used UML Diagrams in the Publications?
The distribution for the number of each type of UML diagram is expressed in Figure 7. The least-used UML diagram was the component diagram, which had a rate of 0.7%. However, the class diagram was the most commonly used one and was in 26.3% of all the articles.
Figure 7.
UML diagram usage in publications.
Table 4 gives information about the distribution of publications that either had only one UML diagram type or more than one diagram type, and half of the studies contained only one distinct diagram type; 18.8% of the publications included two or three different types of diagrams, and 13.2% of the publications included four different types of UML diagrams. Only one publication contained five different types of UML diagrams, and 3% of all the publications contained six different types of UML diagrams.
Table 4.
Distribution of publications by UML diagram type usage.
Apart from this table, when the diagrams under the category of Others were examined one by one, it was seen that single usages of the collaboration, component, and object diagrams totaled zero; that is, they were never used individually in any publication.
Table 5 was formed to see the associations of the diagrams that were used in the same publication. In other words, one can find the counts of publications that included two specific diagrams in a study by looking at the junction square of the diagram names in the table. Additionally, the bold numbers in the middle of the table give the total counts of publications that included the related diagrams.
Table 5.
The association matrix for the usage of UML diagram types.
The five diagrams that had high usage rates in Figure 7 took place directly by their names in the table. The other six diagrams were taken under the category of Others. Accordingly, it is obvious that high associations were correlated with the usage rates of the diagrams. When comparing the differences between the associations together with the total number of the publications, there were no significant differences, but when a class diagram had 27 associations with the other diagrams in 71 total publications, the use case for the other diagrams had 25 associations with 41 total publications, which was significantly lower than the class diagrams. The activity diagrams also had less association with the state machine diagrams compared with all the other diagrams.
4. Conclusions
The aim of this study was to present a comprehensive systematic literature review to detect research trends on the use of UML diagrams within the past twenty years. For this purpose, research questions were identified, and then a specific search strategy was followed. All related studies published for a twenty-year period were systematically reviewed. A total of 128 publications were included and investigated in terms of the research questions. Furthermore, the following main findings were discovered:
- The most common usage of UML diagrams in publications was class diagrams, while sequence and state machine diagrams had the low rate of usage;
- Most of the publications were either conference proceedings or journals, whereas there were only a few publications which were book chapters or other publication types. Furthermore, the largest number of articles using UML diagrams was published by IEEE;
- Most of the articles were published for the computer science and industry application fields, respectively;
- The articles utilized UML diagrams mostly for the purposes of designing and modeling.
This research reviewed articles published between 2000 and June 2019 by searching for a set of certain keywords. In further studies, it might be valuable to use a wider set of keywords and extend the time span in order to provide a more comprehensive picture of the literature related to this topic.
Author Contributions
Conceptualization, Y.B.; methodology, H.K.; analysis, A.M.E.; original draft preparation, H.K., Y.B., A.M.E.; writing—review and editing, S.P.; supervision, S.P. All authors have read and agreed to the published version of the manuscript.
Funding
This research received no external funding.
Conflicts of Interest
The authors declare no conflict of interest.
References
- Boehm, B. Some future trends and implications for systems and software engineering processes. Syst. Eng. 2006, 9, 1–19. [Google Scholar] [CrossRef]
- Thomas, D. MDA: Revenge of the modelers or UML utopia? IEEE Softw. 2004, 21, 15–17. [Google Scholar] [CrossRef]
- Sommerviller, I. Software Engineering, 9th ed.; Addison-Wesley: Boston, MA, USA, 2011; pp. 7–9. [Google Scholar]
- Kitchenham, A.B. Procedures for performing systematic reviews. Keele Univ. 2004, 33, 1–26. [Google Scholar]
- Kitchenham, B.; Brereton, O.P.; Budgen, D.; Turner, M.; Bailey, J.; Linkman, S. Systematic literature reviews in software engineering—A systematic literature review. Inf. Softw. Technol. 2009, 51, 7–15. [Google Scholar] [CrossRef]
- Genero, M.; Fernández-Saez, A.M.; Nelson, H.J.; Poels, G.; Piattini, M. Research review: A systematic literature review on the quality of UML models. J. Database Manag. (JDM) 2011, 22, 46–70. [Google Scholar] [CrossRef]
- Jalali, S.; Wohlin, C. Systematic literature studies: Database searches vs. backward snowballing. In Proceedings of the ACM-IEEE International Symposium on Empirical Software Engineering and Measurement, Lund, Sweden, 20–21 September 2012; pp. 29–38. [Google Scholar]
Publisher’s Note: MDPI stays neutral with regard to jurisdictional claims in published maps and institutional affiliations. |
© 2021 by the authors. Licensee MDPI, Basel, Switzerland. This article is an open access article distributed under the terms and conditions of the Creative Commons Attribution (CC BY) license (https://creativecommons.org/licenses/by/4.0/).