Abstract
There is a growing social awareness about accessibility. The accessibility in cities and public spaces has become in an important issue in official agendas due to recent European directives. There are several studies on the way to improve accessibility in cities but they do not offer the possibility of view if solutions applied are valid over time. This paper proposes a method to measure the degree of accessibility of a city or urban area by using data from conflicting accessibility points collected by the own citizens. It will allow us to visualize in a concise way how accessible a city is and its progression in the time.
1. Introduction
The past few years have seen a strong and growing interest in the idea of Smart Cities, with Information and Communication Technology (ICT) having the ongoing potential to allow local governments to manage social, industrial and commercial processes in a different way to increase efficiency and user satisfaction [1].
Despite the expansion of this area, there are still many issues to resolve. One of these issues is focused on achieving Accessible Cities. Accessibility is an element of life quality that has universal interest, a right of all citizens, a determining factor of the habitability of cities, and an essential element in modern society. Unfortunately, some spaces of the public built environment are not accessible enough, its design does not take into account the requirements of people with mobility difficulties and other physical or sensory limitations (of understanding, communication or perception) [2].
A key aspect to deal with regard to the tasks of assessment and maintenance, as well as to detect and manage different problems of accessibility, is to have an accurate awareness about the current state of urban accessibility. This real and updated knowledge on urban accessibility will help in improving mobility and livability of cities and, thereby, the quality of life and welfare of all citizens [3].
For the aforementioned reasons, and following the line of previous investigations and developments of this research group [2], a method is proposed to measure the degree of accessibility of a city or urban area by using data from conflicting accessibility points collected by the own citizens. This model will allow us to visualize in a concise way how accessible a city is and its progression in the time.
2. Related Work
2.1. Background
There is a growing social awareness about accessibility. The accessibility in cities and public spaces has become in an important issue in official agendas due to recent European directives [4]. Hereby, exist diverse initiatives like The Disability Strategy 2010–2020 [5] and The Europe 2020 Horizon [6] where accessibility is conceived as a requirement of all spaces, facilities, services and products.
Up to now, methodologies have been used to solve specific problems in controlled urban environments, however, these have not been as effective as one might wish to maintain these functional solutions over time. Cities are still full of barriers of movement and few efforts are devoted to analyzing the possible causes or elements that contribute to their generation.
Until the last years, data about urban accessibility has been obtained using traditional methods like street observation and audits [7], interviews [8,9] and surveys/questionnaires [10,11,12,13] from authorities to handicapped people and other interested groups like family or friends.
New technologies allow the creation of innovative methods to continuously monitor accessibility in urban areas and systems to improve it. Nowadays, citizens by themselves can provide that kind of data to the local governments, using new technologies, such as web pages, mobile apps [14] and social network communities [3].
Nonetheless, most of the analyzed systems provide static data and do not offer the possibility of view if solutions applied are valid over time. Because of this, our research group developed the system described below and on which the method proposed in this article is based.
2.2. System for Acquiring Urban Accessibility Issues
Our research group developed a system composed by a mobile application that allows citizens to register accessibility issues that they find in the urban environment and a web console for the management of those issues by local governments [15,16]. Figure 1 shows different accessibility issues handled by the mobile App.
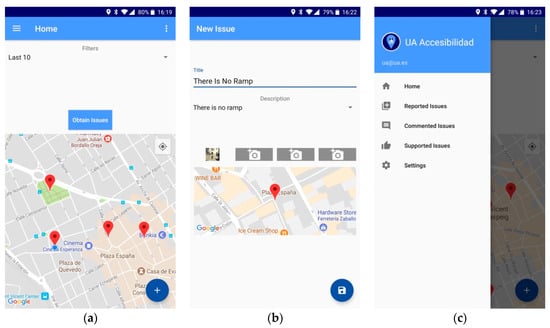
Figure 1.
(a,b) Examples of the accessibility issues in the city of Alicante; (c) App menu.
The registration of a claim implies that the user makes the description of it and allows the application to access its location through the GPS integrated in the mobile device. Optionally, the user can indicate if they have any type of disability and, if so, indicate it in a list. For more accuracy when it comes to identifying the location and veracity of problems within the city by administrations, it is allowed to add images. All recorded incidents must go through a verification process to avoid inappropriate use of the system. This verification process will be carried out from the web application as indicated below. In addition to adding conflicting points, it will be possible to know the status of other previously registered points that are in the process of being resolved. The possible states of a claim are the following:
- Not verified: These will be the claims that have not yet been validated by the administration.
- Verified: Once the claim has been reviewed and verified by the administration, it is classified into three different states:
- ○
- Waiting. It is the first step once the administration verifies the veracity of a claim and plans the solution process. This state is where decisions are made regarding the priority of one issue over another.
- ○
- In progress. At this moment, the administration has already begun the relevant work for the solution of the registered problem.
- ○
- Solved. It is the last step of the process. The work has finished and the point has ceased to be conflictive.
This registration model allows us to check that the solutions applied to problems continue to be effective over time, and an issue that has been solved and that is affected by other factors may no longer be valid.
The application has a map in which the conflicting access points are marked. Depending on the state of these points, one type of marker or another will be used to differentiate them from each other.
Thanks to the application, a bi-directional communication channel is achieved that facilitates communication between citizens and the local government, easing procedures and opening a new communication way.
3. Method Description
In combination with the system described above, we propose a method that allows us to measure the accessibility degree of a city. This measure is composed by two indicators, the Administrations Implication Degree (AID) and the Citizens Implication Degree (CID).
3.1. Administrations Implication Degree (AID)
This measurement reflects the level of local government commitment to make its city accessible. It is a value from 0 to 100. To obtain this value we use the next variables:
- N° of verified issues
- N° of solved issues
- N° of in progress issues
- N° of not solved issues (N° of verified issues—N° de of solved issues)
At the same time, AID is formed by two calculations, Solved Issues Indicator (SII) (2) and In Progress Issues Indicator (PII) (3). We think that SII has more relevance than PII, that is why we give it the 80% of weight. These weights will be adjusted as the system will be calibrated.
where Solved Issues Indicator (SII) is:
and in Progress Issues Indicator (PII) is:
AID = (SII ∗ 0.8) + (PII ∗ 0.2),
SII = N° of solved issues ∗ 100/N° of verified issues,
PII = N° of in progress issues ∗ 100/N° of not solved issues.
3.2. Citizens Implication Degree (CID)
This indicator reflects the citizens level of commitment to make its city accessible. It is a value between E and A+. To obtain this value we use the next variables:
- Population
- N° of active users
First of all, we obtain Max CID:
and then, this value is divided in 10 fractions, without decimals, where Max CID correspond with A+ and 0 with E.
Max CID = Population/log(Population)4,
Finally, when Max CID is calculated (4), we extract the real value of CID from the generated values depicted in Figure 2 using the N° of active users.
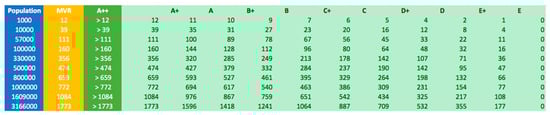
Figure 2.
Table that represents the intervals of CID values for different amount of population.
For example, an imaginary city where population is 10,000 people and there are 33 active users:
so, the CID of this imaginary city is A, because 33 is between 35 and 31.
Max CID = 10,000/(log(10,000))4 ≅ 39,
With both indicators, we obtain an index formed by a number (AID) and a letter (CID) that allows us to quickly identify the level of accessibility of a city. It allows us to know how involved is the administration and the citizens to make their city more accessible. Being able to obtain this value in a simple way and in real time allows to track the cities as it has not been possible until now. This system could be extrapolated to other areas of cities such as, for example, the state of street furniture.
Figure 3 is a simulation of how the proposed index could be represented, evaluating different neighborhood and the whole city.
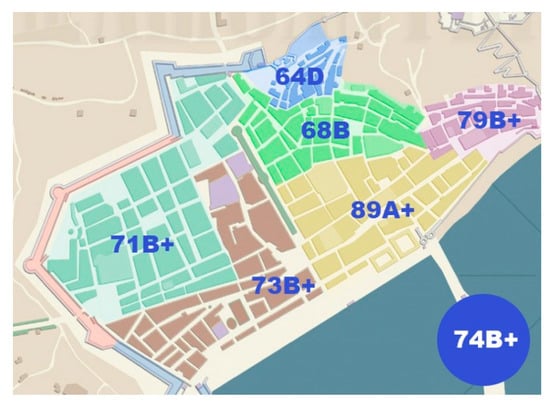
Figure 3.
Simulation example of index values in a city. Number correspond to AID and letter to CID.
4. Conclusions
In this work, a method capable of measuring the quality of accessibility in urban areas has been presented. Based on previous investigations and developments of this research group, it has been possible to develop this method thanks to ICT. The deployment of this system gives us a vision of the evolution of a city over the time and the ability of compare different cities in terms of accessibility.
With a minimum cost of implantation this system could help how disabled people moves in cities, improving his quality life. In addition, it would help administrations in the decision-making process, when they determine which problem is more important to solve before than others and if they are solving the issues in the correct way.
Additionally, that would force somehow that the administrations of the worst valued cities take measures and that the local governments of the best valued could use it to attract tourists and citizens who wanted to live there. It must be taken into account that it is not a definitive system, in the future more variables could be added to the set to obtain more precise data or obtain other types of results. In addition, it is a system that could be easily extrapolated to other areas.
Author Contributions
All authors were involved in the foundation items. All authors wrote the paper and read and approved the final manuscript.
Acknowledgments
This work has been funded by the Conselleria de Educación, Investigación, Cultura y Deporte, of the Community of Valencia, Spain, within the program of support for research under project AICO/2017/134.
Conflicts of Interest
The authors declare no conflict of interest.
References
- McKinlay, P. Make way for smart cities: Opportunities, challenges and capacities of New Zealand local governments. Asia Pac. J. Public Admin. 2017, 39. [Google Scholar] [CrossRef]
- Mora, H.; Gilart-Iglesias, V.; Pérez-del Hoyo, R.; Andújar-Montoya, M.D. A Comprehensive System for Monitoring Urban Accessibility in Smart Cities. Sensors 2017, 17, 1834. [Google Scholar] [CrossRef] [PubMed]
- Pérez-del Hoyo, R.; García-Mayor, C.; Mora, H.; Gilart-Iglesias, V.; Andújar-Montoya, M.D. Improving urban accessibility: A methodology for urban dynamics analysis in smart, sustainable and inclusive cities. Int. J. Sustain. Dev. Plan. 2017, 12, 357–367. [Google Scholar] [CrossRef]
- Mora, H.; Gilart-Iglesias, V.; Pérez-del Hoyo, R.; Andújar-Montoya, M.D.; Compañ-Gabucio, H.J. Interactive cloud system for the analysis of accessibility in smart cities. Int. J. Sustain. Dev. Plan. 2016, 11, 447–458. [Google Scholar] [CrossRef]
- European Commission. Persons with Disabilities. Available online: http://ec.europa.eu/social/main.jsp?catId=1137 (accessed on 26 April 2018).
- European Commission. What Is Horizon 2020? Available online: https://ec.europa.eu/programmes/horizon2020/en/what-horizon-2020 (accessed on 27 April 2018).
- Mackett, R.L.; Achuthan, K.; Titheridge, H. TitleAMELIA: Making streetsore accessible for peoplewith mobilitydifficulties. URBAN DESING Int. 2008, 13, 81–89. [Google Scholar] [CrossRef]
- Hashim, A.E.; Samikon, S.A.; Ismail, F.; Kamarudin, H.; Jalil, M.N.M.; Arrif, N.M. Access and Accessibility Audit in Commercial Complex: Effectiveness in Respect to People with Disabilities (PWDs). Procedia Soc. Behav. Sci. 2012, 50, 452–461. [Google Scholar] [CrossRef]
- Venter, C.; Savill, T.; Rickert, T.; Bogopane, H.; Venkatesh, A. Enhancing Accessibility for People with Disabilities Living in Urban Areas. Available online: http://www.globalride-sf.org/images/DFID.pdf (accessed on 4 May 2018).
- Beale, L.; Field, K.; Briggs, D.; Picton, P.; Matthews, H. Mapping for Wheelchair Users: Route Navigation in Urban Spaces. Cartogr. J. 2006, 43, 68–81. [Google Scholar] [CrossRef]
- Soltani, S.H.K.; Abbas, M.Y.; Awang, M.B. Disabled Children in Public Playgrounds: A Pilot Study. Procedia Soc. Behav. Sci. 2012, 36, 670–676. [Google Scholar] [CrossRef]
- Soltani, S.H.K.; Shamb, M.; Awangb, M.; Yamanb, R. Accessibility for Disabled in Public Transportation Terminal. Procedia Soc. Behav. Sci. 2012, 35, 89–96. [Google Scholar] [CrossRef]
- Le-Klähn, D.-T.; Hall, M.C.; Gerike, R. Analysis of Visitor Satisfaction with Public Transport in Munich. J. Public Transp. 2014, 17, 5. [Google Scholar] [CrossRef]
- Wheelmap Project. Available online: http://wheelmap.org/ (accessed on 2 May 2018).
- Pérez-del Hoyo, R.; Mora, H.; Gilart-Iglesias, V.; Andújar-Montoya, M.D. Urban and Building Accessibility Diagnosis using ‘Accessibility App’ in Smart Cities—A Case Study. In Proceedings of the 6th International Conference on Smart Cities and Green ICT Systems (SMARTGREENS), Porto, Portugal, 22–24 April 2017; pp. 99–108. [Google Scholar]
- Mollá-Sirvent, R.A.; Mora, H.; Gilart-Iglesias, V. Sistema de Monitorización de la Accesibilidad Ciudadana en Entornos Urbanos. Available online: https://rua.ua.es/dspace/bitstream/10045/74407/1/Sistemas-de-monitorizacion-de-accesibilidad.pdf (accessed on 17 October 2018).
Publisher’s Note: MDPI stays neutral with regard to jurisdictional claims in published maps and institutional affiliations. |
© 2018 by the authors. Licensee MDPI, Basel, Switzerland. This article is an open access article distributed under the terms and conditions of the Creative Commons Attribution (CC BY) license (https://creativecommons.org/licenses/by/4.0/).