Proceeding Paper

Impact of Beacon-Dependent Parameters on Bluetooth Low Energy Indoor Positioning Accuracy †

by
Gabriel de Blasio
*,
Alexis Quesada-Arencibia
,
José Carlos Rodríguez-Rodríguez
,
Carmelo R. García
and
Roberto Moreno-Díaz Jr.
Instituto Universitario de Ciencias y Tecnologías Cibernéticas, Universidad de Las Palmas de Gran Canaria, 35018 Las Palmas de Gran Canaria, Spain
*
Author to whom correspondence should be addressed.
Presented at the 12th International Conference on Ubiquitous Computing and Ambient Intelligence (UCAmI 2018), Punta Cana, Dominican Republic, 4–7 December 2018.
Proceedings 2018, 2(19), 1223; https://doi.org/10.3390/proceedings2191223
Published: 23 October 2018
(This article belongs to the Proceedings of UCAmI 2018)

Abstract

:
Blue Low Energy technology is playing an important role nowadays in ubiquitous systems, being the beacons a key element. The configuration of parameters related to the beacons, such as their transmission power or their advertising interval should be studied in order to build fingerprinting indoor positioning systems based on this technology as accurate as possible. In this work, we study the impact and the interplay of those parameters in static indoor positioning as well as the orientation effect in the calibration phase. To reduce the time of data collection, a semi-automatic system is introduced.

1. Introduction

Bluetooth Low Energy (BLE) is increasingly used in indoor positioning systems, both as a single technology and in combination with other technologies [1,2,3]. In the fingerprinting method, the user’s position is characterized by the signal pattern detected from each BLE transmitter or beacon [2,3,4]. Fingerprinting method consists in two phases: calibration (or offline) and positioning (or online). In the calibration phase, it is necessary to construct a database (reference fingerprint database) for a set of points of known positions (reference points). In that database, each reference element or fingerprint consists of the coordinates of the reference points, the Received Signal Strength (RSS) or the measurement of the power present in the radio signal received by each beacon, the orientation in which these RSS readings have been taken, etc. In the positioning phase, users in an unknown position obtain the RSS values for different beacons (target fingerprints) and compare these RSS values with those stored in the reference fingerprint database. By means of some matching algorithm, such as Weighted K-Nearest Neighbor (WKNN), users ultimately obtain the coordinates of their position.
Accuracy in fingerprinting indoor positioning systems based on BLE is currently a major concern because there are some factors that might affect it: those related to signal emitters or beacons, such as the advertising interval (how often the beacon transmits), the transmission power (the expected power at 1 m), because the maximum range of the broadcasted signal depends on it and because the RSS suffer interferences, reflections, etc., the BLE channel, or those environmental-related [4,5,6]. In addition, one of the biggest drawbacks in the fingerprinting method is that site surveys or calibration campaigns are time consuming [7].
Studying the influence of all these parameters and their inter-relation is a very arduous task due, for example, to the amount of data to be handled. A possible way of solution would be the use of semi-autonomous or autonomous systems in charge of data collection that would allow deepening these studies. Due to mobile devices do not distinguish between the three BLE channels and the aggregate signal may lead to reduced positioning accuracy, this type of device has not been used in this work [3].
To start studies of this type we will test a semi-autonomous system in a reduced environment. The main contributions of this work are:
  • We provide a study on those parameters related to the configuration of beacons that can affect the positioning accuracy.
  • We also study the impact on accuracy by increasing the number of orientations in the fingerprinting calibration phase.
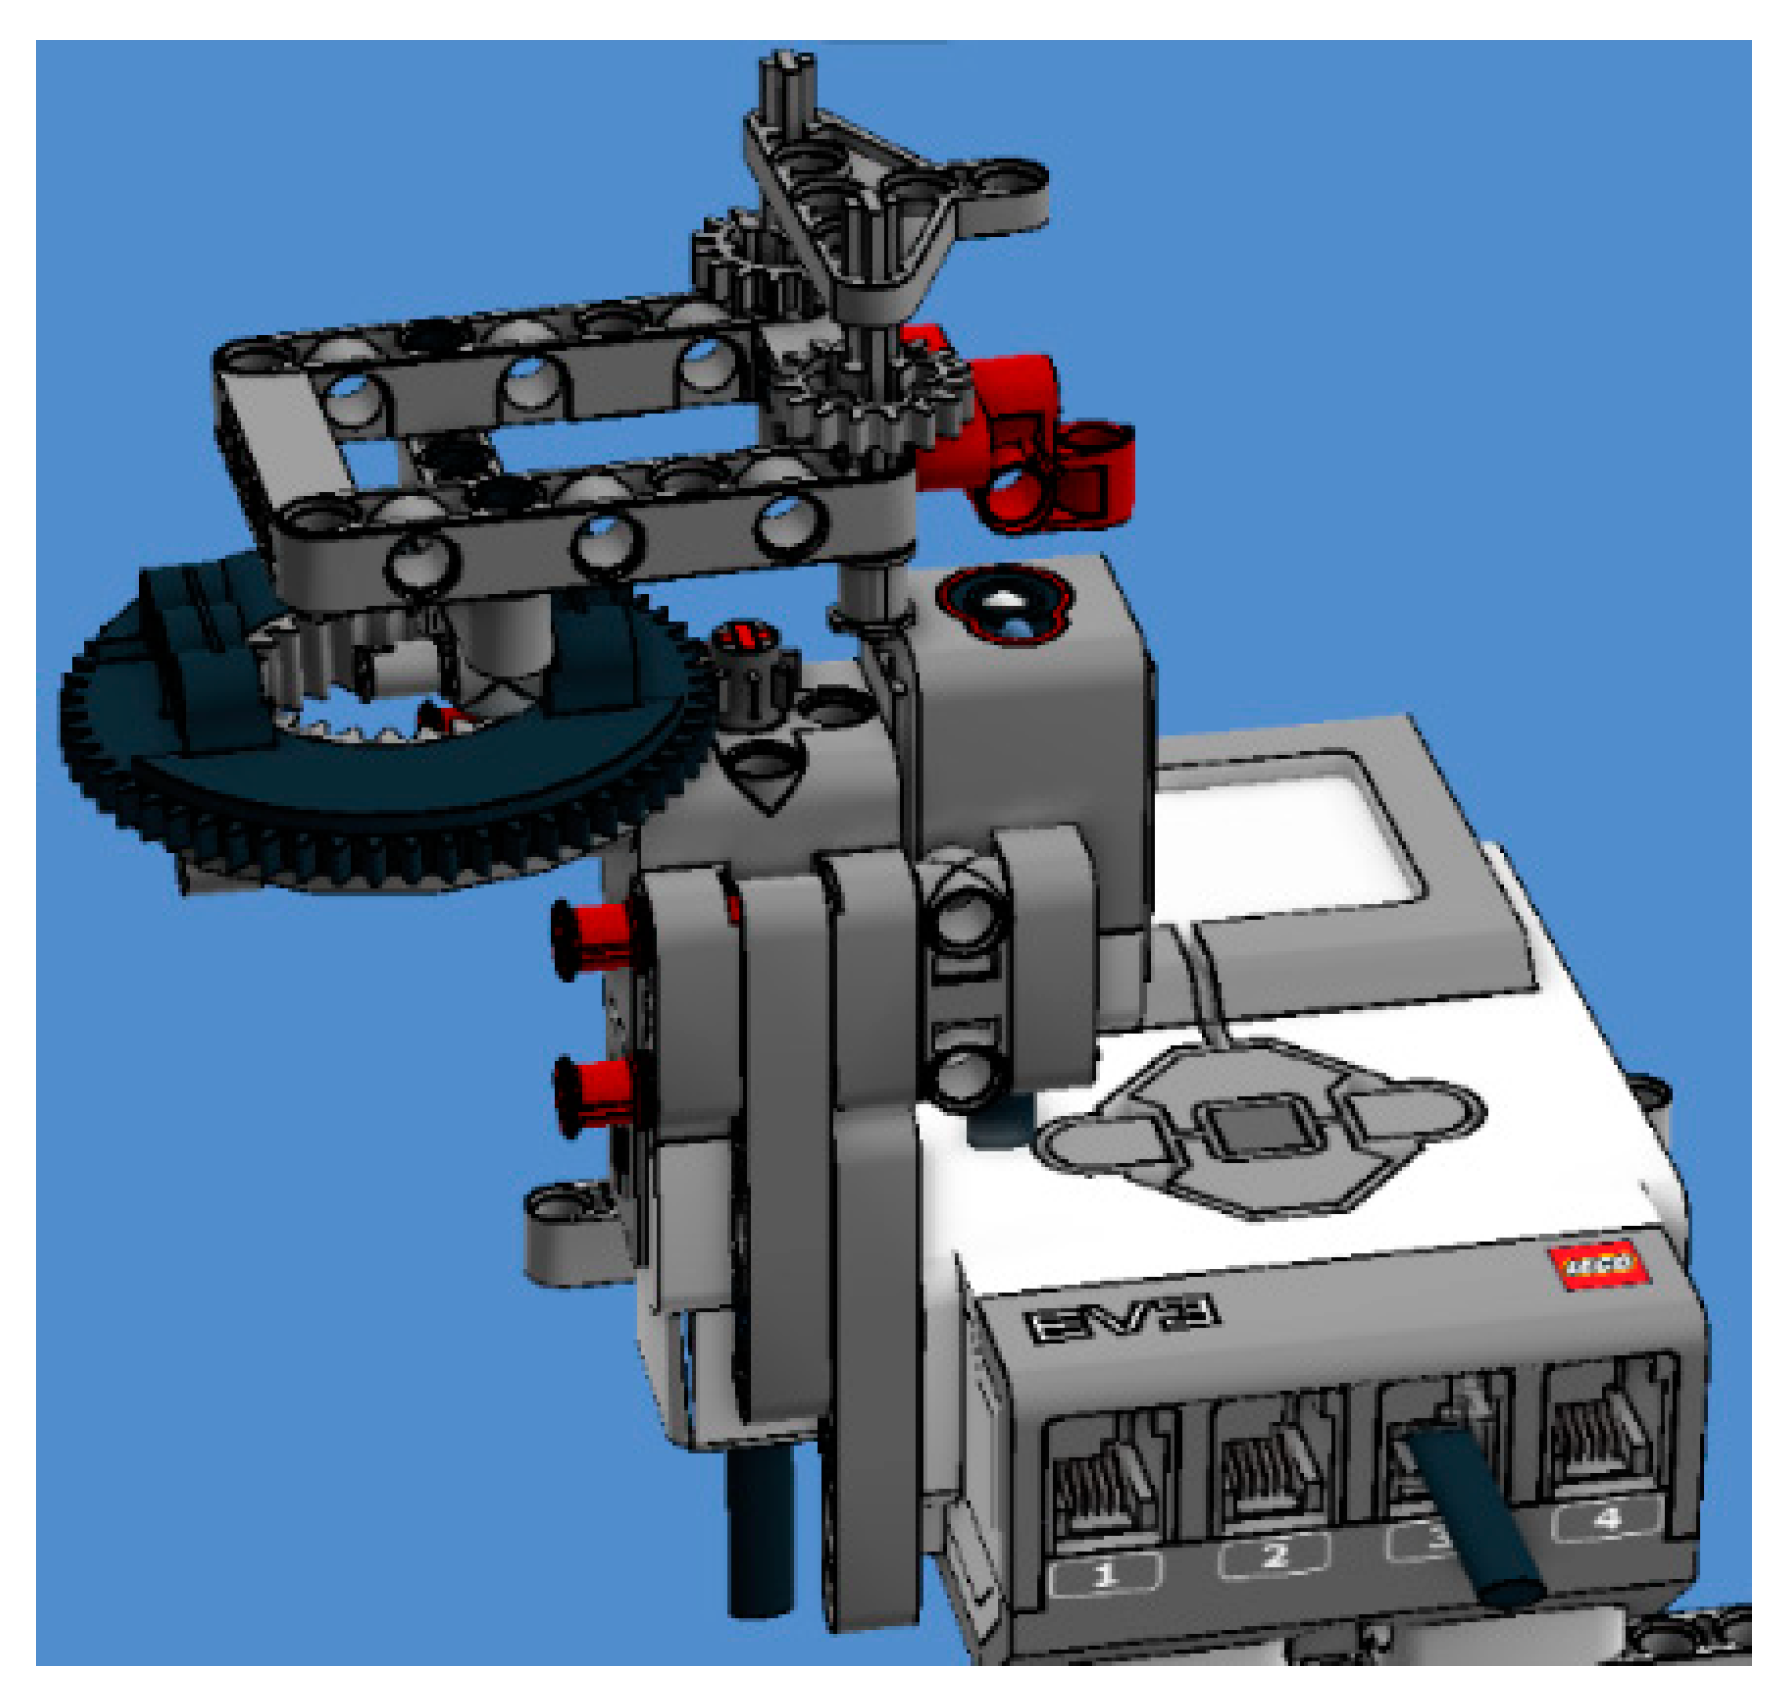
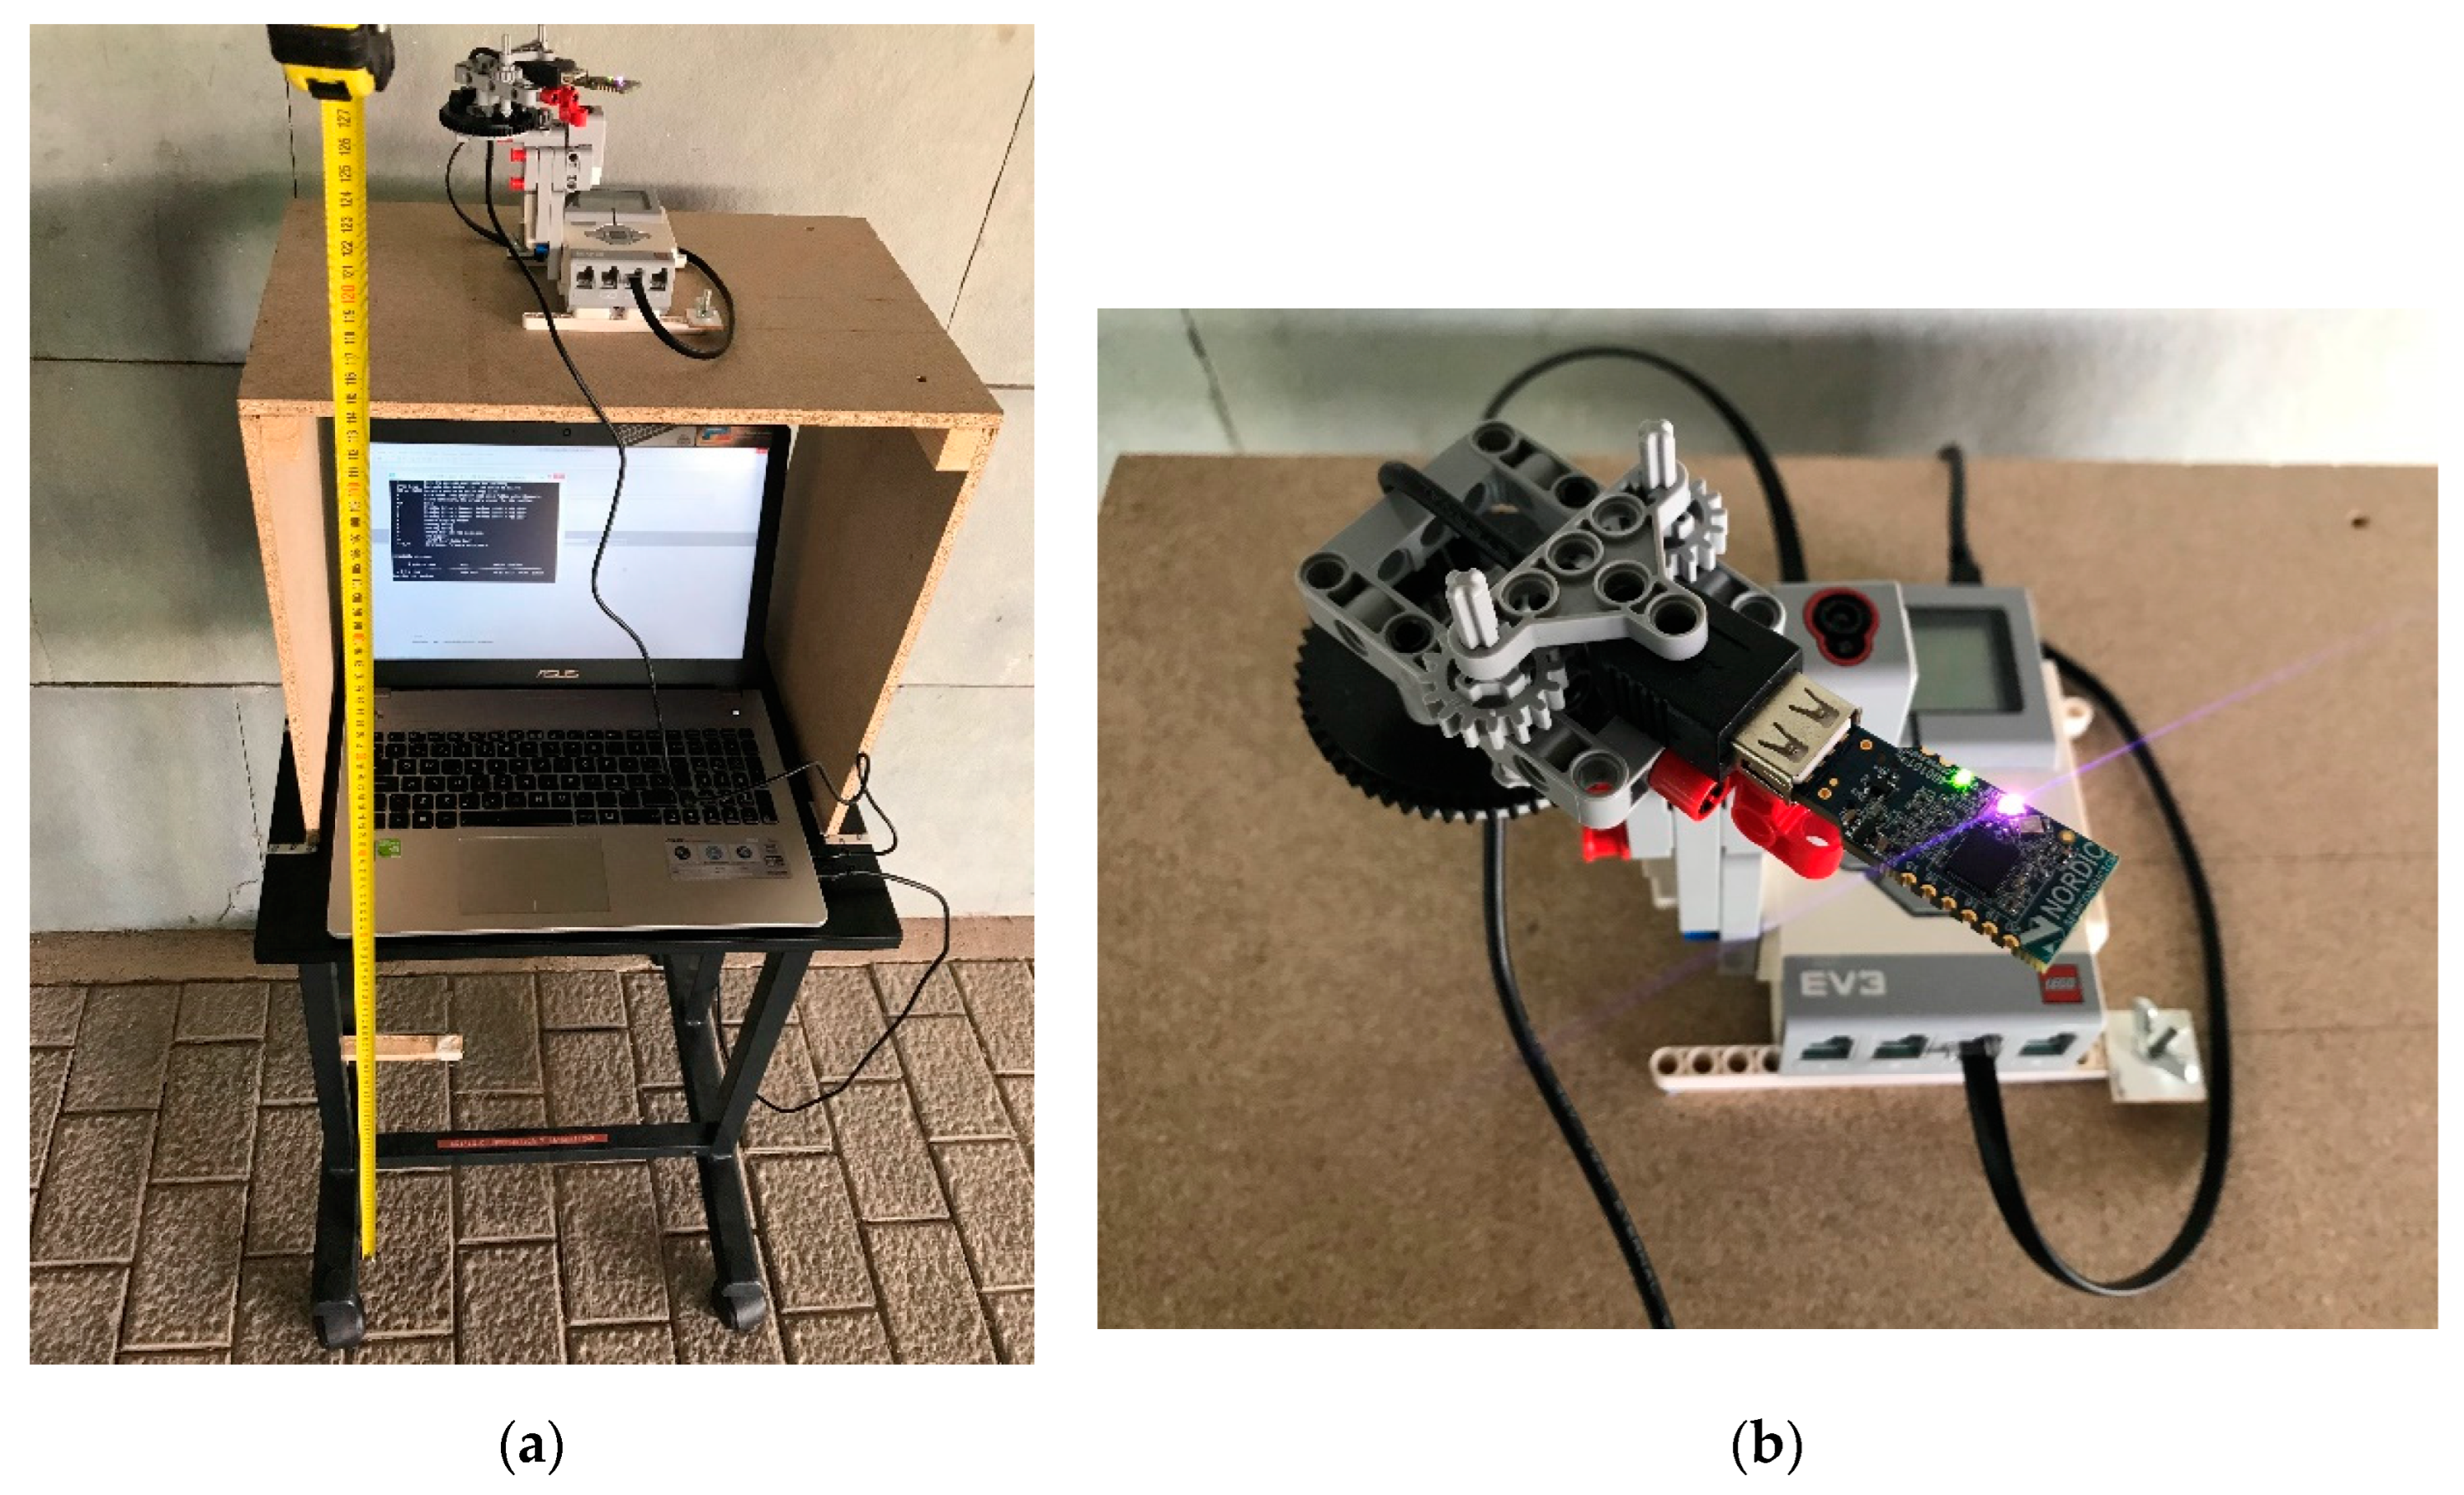
  • We present a new semi-automatic system that, not only facilitates those studies mentioned above, but also shortens the duration of data collection.
This paper is organized in six sections: Section 2 reviews related works, Section 3 and Section 4 will describe material and methods and the experimental setup. Section 5 shows the results of the experiments carried out and, finally, the conclusions and future lines of work are presented in Section 6.

2. Related Works

There are many works on indoor positioning based on BLE: within the specific category of those works based on the fingerprinting method, we may mention that Faragher et al. [1] were among the first to conduct experimental tests of fine-grained BLE positioning and a detailed study into the key parameters for accurate indoor positioning using the BLE radio signals. Kajioka et al. [8] demonstrated the viability of positioning through the received signal strength of BLE beacons using fingerprinting and squared Euclidean distance for template matching. Zhu et al. [9] proposed a complete positioning method and a series of optimizations to improve positioning accuracy. Faragher et al. [10] explored the use of BLE beacons for fingerprint positioning and demonstrated an improvement over Wi-Fi positioning. Fard et al. [11] provided a more accurate, cost-efficient approach to the indoor positioning of mobile devices using the iBeacon protocol, concluding that more training data do not always yield higher accuracy.
In relation to works on the study of parameters related to beacons or those related with the environment, we may mention those of Castillo-Cara et al. [12,13], where they identify in a simple setup the main system parameters to be taken into account on the design of BLE4.0 beacons-based indoor localization mechanisms, and explore two parameters: transmission power and physical characteristic of the scenario. Lu et al. [14] adjusted iBeacon transmission power to increase BLE signal differences in indoor environments. In Sie’s et al. work [15] beacons emit at low transmission power level to limit the estimation error; each beacon transmits with multiple power levels to increase the utilizing efficiency. de Blasio et al [3] studied the impact of the orientation in the positioning phase and the impact of BLE protocols and channels, using 40 distance metrics in order to minimize fluctuations and degradation factors and obtain the greatest possible accuracy and precision; they also studied the impact of sampling time, in both calibration and positioning phases.
He et al. [16] investigated the problem of beacon deployment for unambiguous user positioning; they theoretically proved a series of performance bounds on the number of required beacons, and formulated a novel integer linear program that jointly determines the beacon positions along with their power levels and broadcast intervals. Pelant et al. [17] created a Ray-Launching based simulation model to study the performance of BLE technology in indoor localization, where RSS fingerprinting map was created based on theoretical and measurements results; their results show that accuracy highly depends on the number of sectors in the environment and on the number of beacons considered.

3. Material and Methods

Four Accent Systems iBKS 105 BLE beacons were deployed in an environment described in next section. To collect those BLE signals, an Asus N56J laptop with a Nordic Semiconductor nRF51 BLE dongle were used. The dongle was fixed on a LEGO EV3 [18] unit (see Figure 1) and connected to the laptop port via a USB cable.
The EV3 unit had the role of orienting the dongle in a horizontal plane at any angle between 0° and 360° with increments of 1°. The EV3 unit was fixed to a table with wheels, being the orientation of the table fixed at all times (see Figure 2a,b).
The sniffing software employed was Nordic Semiconductor ble-sniffer win-1.0.1-1111 together with Wireshark 2.6.0. The data collection process is initiated through a batch file that controls the orienting device and calls the sniffing software.
Both in calibration and positioning phase, the same laptop, dongle and software were used. WKNN was the pattern-matching algorithm used to compare fingerprints of both calibration and positioning phase. WKNN is an improvement on the classic Nearest Neighbor (NN) and K-Nearest Neighbor (KNN) algorithms [4]. Reference points obtained in the calibration phase, which are close to test points obtained in the positioning phase, should have a higher weight than reference points that are far away. The estimated coordinates ( x e , y e ) of the test points are calculated using the formula:
( x e , y e ) = i = 1 k ( x i , y i ) · w i i = 1 k w i             w i = 1 d i
where ( x i , y i ) are the coordinates of the k reference points and w i are the weights for each distance d i . The distance/similarity metrics employed in this paper were Euclidean, Mahalanobis and Pearson Correlation [19,20].

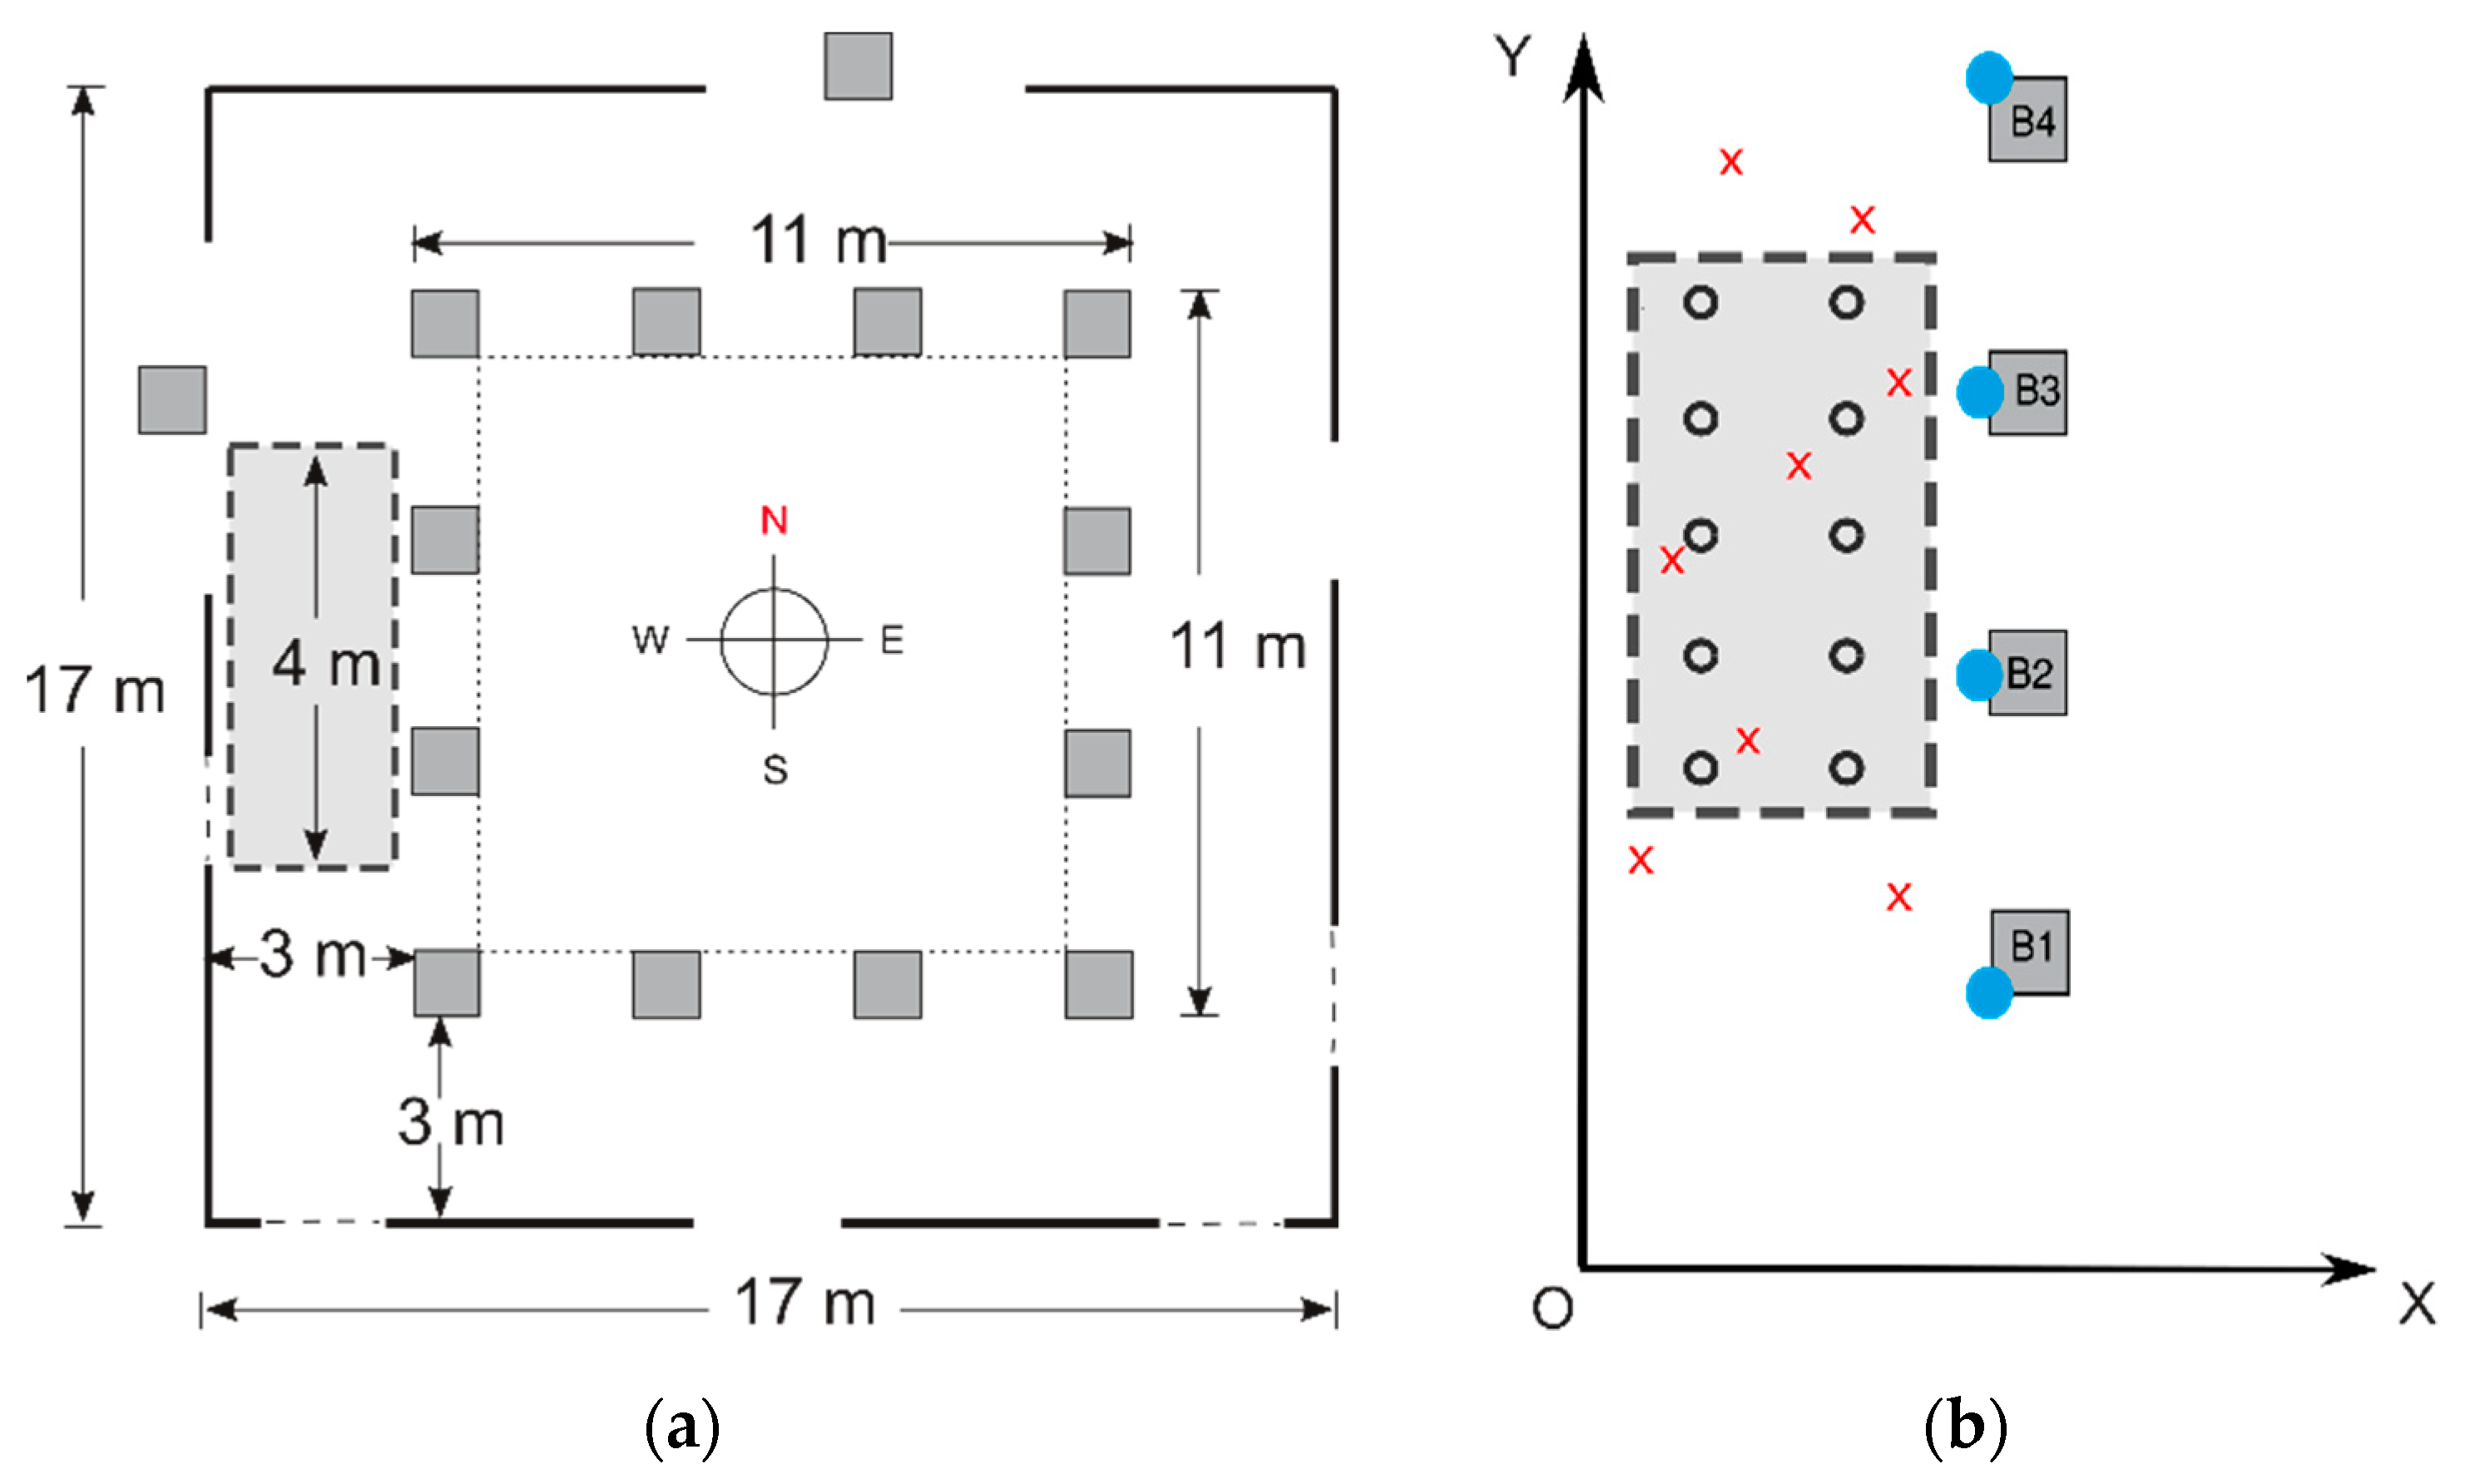
4. Experimental Setup

Figure 3a shows a schematic view of the chosen scenario. The four BLE 4.x beacons deployed were situated on columns at a height of 2.1 m and configured with the Eddystone and iBeacon protocols.
Within the aforementioned scenario, a small rectangular testbed of 4 m × 3 m was chosen with a grid of ten reference points and eight test points (see Figure 3b, taking the (x, y) coordinates of all points with a laser pointer. In both the calibration and positioning phases, measurements were taken without people present by means of the semi-automatic system described previously in Section 3.
Once the raw reference fingerprints had been recorded, taking 120 samples, a small fingerprint database was constructed taking the mean of the maximum RSS values for each cardinal direction, protocol and channel [3]. In the positioning phase, a similar procedure used in the calibration phase was used to record at eight test points situated randomly in the grid: in this case, only eight samples for each protocol and channel, for each cardinal direction (and for a random orientation also) were taken. A smaller fingerprint database was constructed from the original: for a particular beacon, protocol and channel, the maximum RSS value for each orientation was calculated [3]. We guaranteed the coherence of the orientation in both phases using a compass.

5. Results

In this work, positioning accuracy is expressed by the mean error [4,21]. For the sake of space, we present in this section only some accuracy results, indicating whether or not they are general results for all possible cases.
As a prior consideration to the tests carried out, Figure 4 shows the graphs of the RSS vs. time for all protocols-channels, all four beacons in an intermediate point of the grid, setting the transmission power (Tx), advertising interval (Adv) and orientation. It can be seen that, since there are no people present in data collection, these graphs do not present large variations in the RSS values.
With the materials and methods described in Section 3 and in the experimental environment described in Section 4, three tests were designed with the same beacon parameters for both the calibration and test phase:
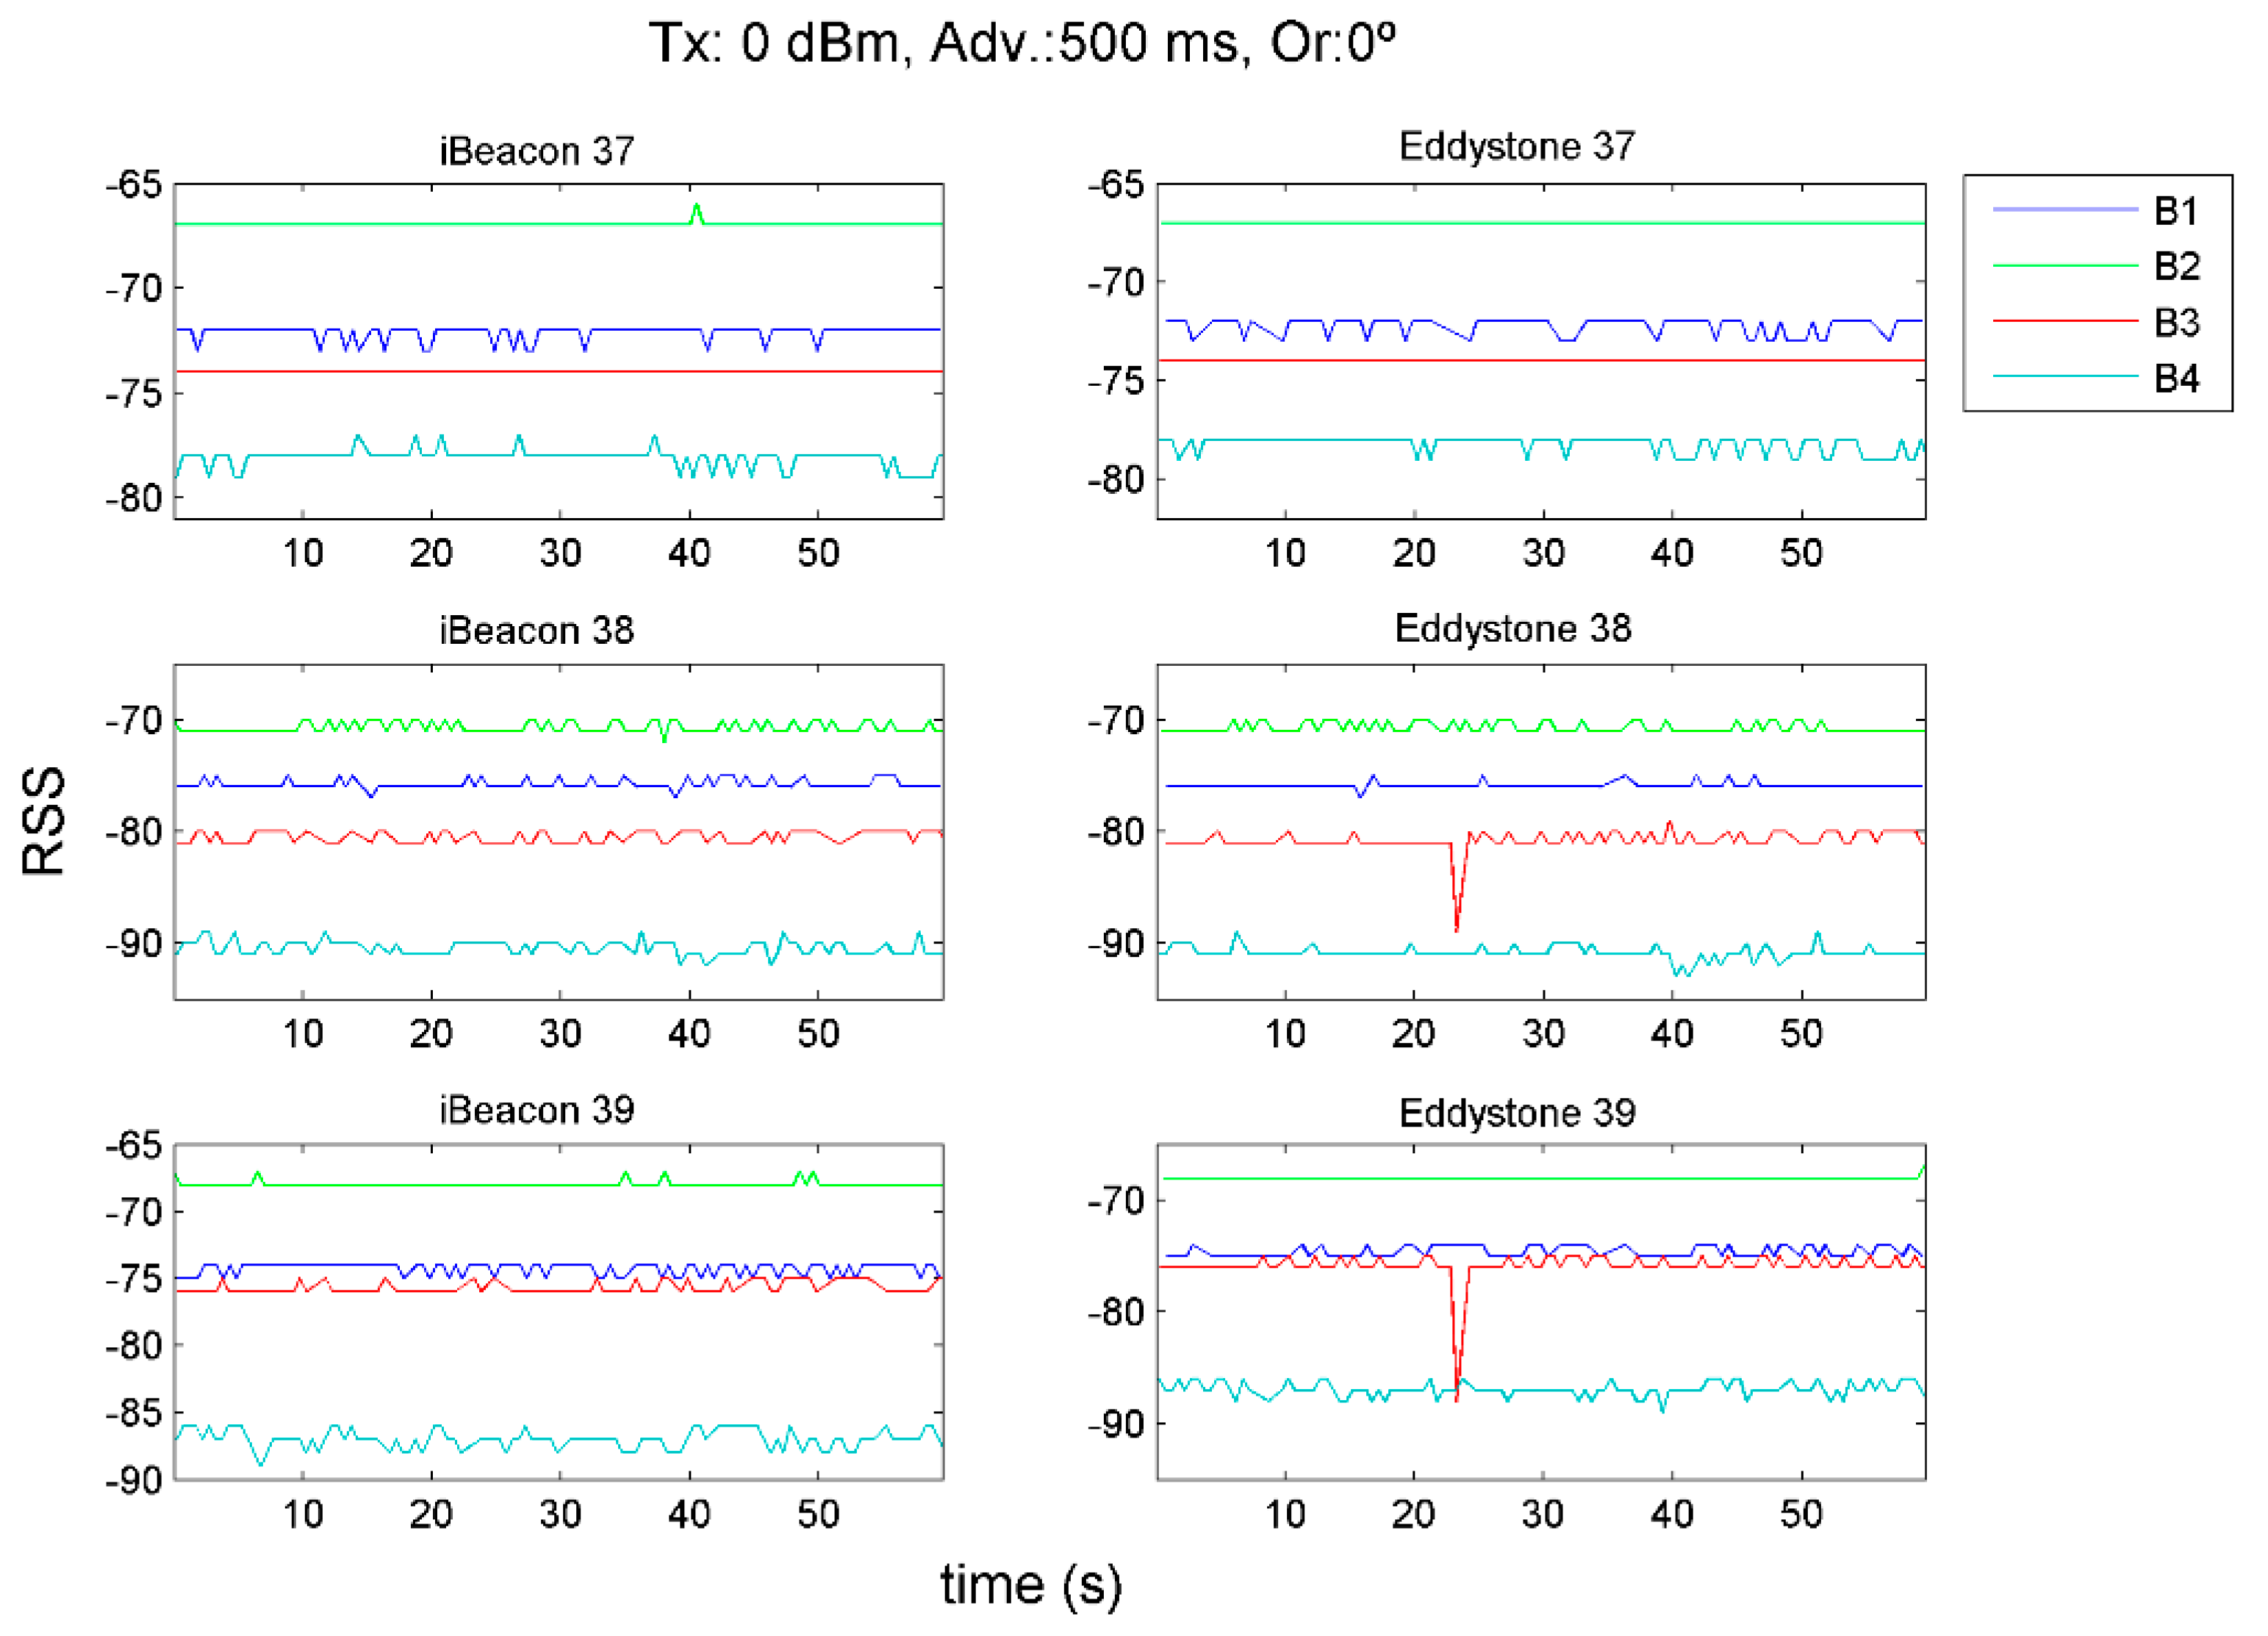
  • Test1: The objective of the first test is to set the beacons’ transmission power and varying the advertising interval, A, to find what value produces the best accuracy.
  • Test2: By setting the best advertising interval, A, obtained in Test 1, the objective of the second test is to vary the transmission power, Tx, to find the value that produces the best accuracy results.
  • Test3: Setting both the best advertising interval, A, obtained in Test1 and the best transmission power, Tx, obtained in Test2, the objective of the third test is to detect if incrementing the number of orientations in the calibration phase the accuracy results improve significantly.

5.1. Test1 Results

The transmission power was set to 0 dBm, taking as advertising intervals, A, the following three values: 300 ms, 500 ms and 950 ms. In the calibration phase, RSS values were taken in the four cardinal directions (E, N, W, S). In the positioning phase, RSS values were taken in the same cardinal directions as well as in a fifth random orientation.
Table 1 shows the values of the accuracy (in meters) for the iBeacon protocol, channel 37, different orientations, values of A (300 ms, 500 ms and 950 ms), the first three values of k and Euclidean distance. It can be seen that there is no single value of A that produces the best accuracy for all orientations. The same results occur with the rest of protocol-channel-distance combinations.

5.2. Test2 Results

For this test, a value of A equal to 500 ms was taken, since it balances the sampling time and the battery consumption. Transmission powers were set to 0 dBm and +4 dBm. In the calibration phase, RSS values were taken in four cardinal directions (E, N, W, S). In the positioning phase, RSS values were taken in the same cardinal directions as well as in a fifth random orientation.
Table 2 shows the values of the accuracy (in meters) for the Eddystone protocol, channel 39, different orientations, values of Tx, the first three values of k and Euclidean distance. It can be seen that, in general, Tx = +4 dBm produces the best accuracy, especially for a random orientation. The same results occur with the rest of protocol-channel-distance combinations.

5.3. Test3 Results

For this test, a value of A equal to 500 ms and a value of Tx equal to +4 dBm were taken. In the calibration phase, RSS values were taken in the four cardinal directions plus four intermediate directions (i.e., E, NE, N, NW, W, SW, S, SE). In the positioning phase, RSS values were taken in a random orientation only.
Table 3 shows a comparison of the values of the accuracy taking four cardinal directions and four cardinal directions plus four intermediate directions in the calibration phase and a random orientation in the positioning phase. It can be clearly observed how the accuracy improves significantly when incrementing cardinal directions in the calibration phase.

6. Conclusions and Future Work

In this paper, we present different studies of static positioning that analyze the impact on the accuracy of parameters related to the configuration of BLE beacons, such as the transmission power, Tx and the advertising interval. The effect of orientation on accuracy in the calibration phase is also studied. To facilitate the collection of data, a semi-automatic system is presented.
In a small 4 m × 3 m testbed and according to our results:
  • There is clearly no advertising interval value that produces the best accuracy results.
  • Best accuracies are obtained with all the beacons set to high transmission power values (Tx = + 4 dBm). Comparing these best values with those obtained for other transmission power values, differences can reach values of 70 cm, especially for random orientations.
  • Better accuracy results are obtained by increasing the number of orientations in the calibration phase: differences can reach up to 60 cm depending on the protocol and channel.
In this work, all accuracy results obtained are similar regardless of the distance used (Euclidean, Mahalanobis and Pearson Correlation) although the Euclidean distance produces slightly higher values: this could be due to the absence of people in the data collection and the low standard deviation of the RSS shown in Figure 4.
As future lines of action, we may mention the following: develop a fully automatic system that allows data collection to be autonomous and that facilitates studies in different larger environments; include the presence of people in the data collection, mainly in the positioning phase; work with more transmission powers and advertising intervals, as well as the number and positioning of the beacons.

Author Contributions

Conceptualization, Methodology and Investigation, G.d.B., A.Q.-A., J.C.R.-R., C.R.G. and R.M.-D.J.

References

  1. Faragher, R.; Harle, R. Location fingerprinting with Bluetooth low energy beacons. IEEE J. Sel. Areas Commun. 2015, 33, 2418–2428. [Google Scholar] [CrossRef]
  2. de Blasio, G.; Quesada-Arencibia, A.; García, C.R.; Molina-Gil, J.; Caballero-Gil, C. Study on an indoor positioning system for harsh environments based on wi-fi and bluetooth low energy. Sensors 2017, 17, 1299. [Google Scholar] [CrossRef] [PubMed]
  3. de Blasio, G.; Quesada-Arencibia, A.; García, C.R.; Rodríguez-Rodríguez, J.C.; Moreno-Díaz, R., Jr. A protocol-channel-based indoor positioning performance study for Bluetooth low energy. IEEE Access 2018, 6, 33440–33450. [Google Scholar] [CrossRef]
  4. Liu, H.; Darabi, H.; Banerjee, P.; Liu, J. Survey of wireless indoor positioning techniques and systems. IEEE Trans. Syst. Man Cybern. C (Appl. Rev.) 2007, 37, 1067–1080. [Google Scholar] [CrossRef]
  5. He, S.; Chan, S.H.G. Wi-Fi Fingerprint-Based Indoor Positioning: Recent Advances and Comparisons. IEEE Commun. Surv. Tutor. 2016, 18, 466–490. [Google Scholar] [CrossRef]
  6. Zafari, F.; Gkelias, A.; Leung, K.K. A survey of indoor localization systems and technologies. arXiv 2017, arXiv:1709.01015. [Google Scholar] [CrossRef]
  7. Davidson, P.; Piché, R. A Survey of Selected Indoor Positioning Methods for Smartphones. IEEE Commun. Surv. Tutor. 2017, 19, 1347–1370. [Google Scholar] [CrossRef]
  8. Kajioka, S.; Mori, T.; Uchiya, T.; Takumi, I.; Matsuo, H. Experiment of indoor position presumption based on RSSI of Bluetooth LE beacon. In Proceedings of the IEEE GCCE, Tokyo, Japan, 7–10 October 2014; pp. 337–339. [Google Scholar]
  9. Zhu, J.; Luo, H.; Chen, Z.; Li, Z. RSSI based Bluetooth low energy indoor positioning. In Proceedings of the IEEE IPIN, Busan, Korea, 27–30 October 2014; pp. 526–533. [Google Scholar]
  10. Faragher, R.; Harle, R. An analysis of the accuracy of Bluetooth low energy for indoor positioning applications. In Proceedings of the ION GNSS+, Tampa, FL, USA, 8–12 September 2014; pp. 201–210. [Google Scholar]
  11. Fard, H.K.; Chen, Y.; Son, K.K. Indoor positioning of mobile devices with agile iBeacon deployment. In Proceedings of the IEEE CCECE, Halifax, NS, Canada, 3–6 May 2015; pp. 275–279. [Google Scholar]
  12. Castillo-Cara, M.; Lovón-Melgarejo, J.; Bravo-Rocca, G.; Orozco-Barbosa, L.; García-Varea, I. An empirical study of the transmission power setting for Bluetooth-based indoor localization mechanisms. Sensors 2017, 17, 1318. [Google Scholar] [CrossRef] [PubMed]
  13. Castillo-Cara, M.; Lovón-Melgarejo, J.; Bravo-Rocca, G.; Orozco-Barbosa, L.; García-Varea, I. An analysis of multiple criteria and setups for Bluetooth smartphone-based indoor localization mechanism. J. Sens. 2017. [Google Scholar] [CrossRef]
  14. Lu, T.-T.; Yeh, S.-C.; Chen, C.-Y. A study of indoor positioning systems using iBeacons with different transmission power levels. J. Chin. Inst. Eng. 2017, 40, 525–535. [Google Scholar] [CrossRef]
  15. Sie, M.-K.; Kuo, C.-H. Indoor location estimation using BLE beacon with multiple transmission power levels. In Proceedings of the IEEE International Conference on Consumer Electronics, ICCE-TW, Taipei, Taiwan, 12–14 June 2017. [Google Scholar]
  16. He, W.; Ho, P.-H.; Tapolcai, J. Beacon deployment for unambiguous positioning. IEEE IoT J. 2017, 4, 1370–1379. [Google Scholar] [CrossRef]
  17. Pelant, J.; Tlamsa, Z.; Benes, V.; Polak, L.; Kaller, O.; Bolecek, L.; Kufa, J.; Sebesta, J.; Kratochvil, T. BLE device indoor localization based on RSS fingerprinting mapped by propagation modes. In Proceedings of the 2017 27th International Conference Radioelektronika (RADIOELEKTRONIKA), Brno, Czech Republic, 19–20 April 2017; pp. 1–5. [Google Scholar]
  18. ev3dev Home. Available online: http://www.ev3dev.org/ (accessed on 10 January 2018).
  19. Deza, M.M.; Deza, E. Encyclopedia of Distances, 1st ed.; Springer: Berlin/Heidelberg, Germany, 2009; pp. 297–310. [Google Scholar]
  20. Cha, S.H. Comprehensive Survey on Distance Similarity Measures between Probability Density Functions. Int. J. Math. Mod. Methods Appl. Sci. 2007, 4, 300–307. [Google Scholar]
  21. Saraiva, R.; Lovisolo, L. RF Positioning: Fundamentals, Applications and Tools; Artech House Publishers: Boston, MA, USA, 2015; p. 5. ISBN 978-1-60807-816-5. [Google Scholar]
Figure 1. Design of the “orienting” device or semi-automatic data collection system. The BLE dongle and the USB cable that connects it to the laptop are not shown in the figure.
Proceedings 02 01223 g001
Figure 2. The orienting device: (a) General view mounted on the table showing connections to the laptop and its height to the ground; (b) Close view with the BLE dongle and the USB cable that connects it to the laptop.
Proceedings 02 01223 g002
Figure 3. Schematic view of the scenario and testbed: (a) Dimensions of scenario and small rectangular testbed along with cardinal directions; (b) Representation of the axes of the chosen coordinates, along with beacons (blue dots), reference and test points (black circles and red crosses respectively).
Proceedings 02 01223 g003
Figure 4. RSS vs. time graphs in an intermediate point of the grid, for all protocols and channels, all four beacons, setting the transmission power to 0 dBm, advertising interval to 500 ms and orientation 0° (equivalent to the cardinal direction East).
Proceedings 02 01223 g004
Table 1. Accuracy (m) for iBeacon protocol, channel 37 and Euclidean distance.
iBeacon 37
East (0°)North (90°)West (180°)South (270°)Random
k/A300500950300500950300500950300500950300500950
11.61.11.21.51.51.21.51.11.71.31.21.50.91.51.3
21.41.11.21.61.31.51.31.31.71.31.31.31.11.41.4
31.51.31.31.61.31.61.31.31.51.41.31.31.31.51.4
Table 2. Accuracy (m) for Eddystone protocol, channel 39 and Euclidean distance for two values of transmission power: Tx = 0 dBm and Tx = +4 dBm.
Eddystone 39
East (0°)North (90°)West (180°)South (270°)Random
k/Tx0+40+40+40+40+4
11.11.11.91.61.31.41.41.41.71.0
21.11.31.61.41.31.21.11.01.81.1
31.21.31.61.31.31.21.01.21.71.2
Table 3. Accuracy (m) for all protocols-channels and Euclidean distance, taking 4 cardinal directions (CD) and 4 cardinal directions + 4 intermediate directions (ID) in the calibration phase and in a random orientation in the positioning phase.
iBeacon 37Eddystone 37iBeacon 38Eddystone 38iBeacon 39Eddystone 39
k4 CD8 ID4 CD8 ID4 CD8 ID4 CD8 ID4 CD8 ID4 CD8 ID
11.51.21.61.31.51.01.71.11.01.11.01.1
21.61.31.61.31.41.21.41.21.21.11.11.1
31.41.31.51.31.41.31.41.31.31.11.21.1
Publisher’s Note: MDPI stays neutral with regard to jurisdictional claims in published maps and institutional affiliations.

