Proceeding Paper

Analysis of Cultivated Land Fragmentation and Its Influencing Factors in Northern China †

The School of Geology and Geomatics, Tianjin Chengjian University, Tianjin 300384, China
*
Author to whom correspondence should be addressed.
Presented at the 31st International Conference on Geoinformatics, Toronto, ON, Canada, 14–16 August 2024.
Proceedings 2024, 110(1), 16; https://doi.org/10.3390/proceedings2024110016
Published: 3 December 2024
(This article belongs to the Proceedings of The 31st International Conference on Geoinformatics)

Abstract

:
Revealing the spatial distribution patterns and driving factors of cultivated land fragmentation is of great significance for optimizing the utilization and management of cultivated land resources and promoting moderate-scale agricultural operations. Based on the 2020 Landsat8 Collection2 surface reflectance data from Changping District, Binhai New Area, and Hulin City, this study comprehensively utilized the landscape pattern index method and the moving window method was used to evaluate the spatial distribution characteristics of cultivated land fragmentation. Furthermore, the Geodetector was employed to analyze the factors which influenced cultivated land fragmentation. The results indicated that the comprehensive indices of cultivated land fragmentation in the three research areas are 0.133, 0.132, and 0.140, respectively, suggesting that the degree of fragmentation is highest in Binhai New Area and lowest in Hulin City. Apart from topographical factors, there are differences in the secondary driving factors of cultivated land fragmentation across the different study areas.

1. Introduction

Cultivated land, as the cornerstone of agriculture, is crucial to food security and social stability [1]. With the advancement of urbanization, the issue of cultivated land fragmentation in China has become increasingly prominent [2], hindering large-scale farming, dampening farmers’ enthusiasm for production, and impacting food security [3]. This paper takes typical farming areas in northern China as the research area, analyzing the fragmentation status under different topographical and economic conditions, aiming to reveal its spatial patterns, optimize layouts, and promote intensive utilization.
In recent years, scholars have conducted extensive research on the evaluation and influencing factors of cultivated land fragmentation [4,5,6,7,8], with the choice of indicator systems varying according to research objectives. Key considerations include plot size, spatial distribution [9], natural quality [10], and utilization conditions [11]. The landscape pattern index method quantifies the overall distribution but struggles to capture local variations [7,12]; the moving window method compensates for this shortcoming by precisely demonstrating fragmentation differences [13,14]. The combination of these two approaches provides a comprehensive analysis of the fragmentation mechanism [15].
Cultivated land fragmentation is influenced by the intricate interplay of natural, social, and economic factors [4,16]. Existing research predominantly adopts a qualitative analysis, lacking quantification and exploration of interactions. However, Geodetector [12] can precisely quantify the importance and interactions of factors, providing data support for governance strategies [16].
This paper selects three distinct research areas in northern China, utilizing landscape pattern indices, the moving window method, and geodetector to conduct in-depth, quantitative analyses of the mechanisms influencing fragmentation, which aims to fill research gaps, revealing complex relationships and inherent logics.

2. Overview of the Study Area and Data

2.1. Overview of the Study Area

Changping District is mainly flat land with high economic development and population mobility. Binhai New Area, adjacent to the Bohai Sea, also boasts high levels of development and mobility. Hulin City, characterized by plains and hills, has relatively low levels of economic development and mobility but features large-scale mechanized production.

2.2. Data

The data used in this paper include (1) Landsat8 Collection2 surface reflectance data were used to obtain the spatial distribution of cultivated land; (2) ASTER GDEM V3 (30 m) Dataset was used for impact factor analysis; (3) Statistical data from the official websites of three research areas were used for impact factor analysis.

3. Methodology

3.1. Landscape Pattern Index Method

The landscape pattern index method quantifies spatial structural characteristics of landscapes, reflecting heterogeneity in patch types, shapes, sizes, etc. This paper considers regional differences in topography, population mobility, and economic status. Seven indicators (LPI, PLAND, DIVISION, AI, AWMPFD, CONTAG, SHDI) from three dimensions (cultivated land area, shape, distribution) were selected to characterize cultivated land fragmentation in three research areas [17,18].

3.1.1. Data Standardization

The original values of each index are standardized through the range standardization method to eliminate the influence of index dimension [19].
Forward indicator:
Q i j = ( X i j X i m i n ) ( X i m a x X i m i n )
Negative indicator:
Q i j = ( X i m a x X i j ) ( X i m a x X i m i n )
where Q i j is the quantification result of the j-th evaluation index for the i-th sample, X i j is the initial value of the j-th evaluation index for the i-th sample, X i m i n is the minimum value of the j-th evaluation index, and X i m a x is the maximum value of the j-th evaluation index.

3.1.2. Entropy and Weight Calculation of Index

To ensure the scientific allocation of weights, the entropy method was selected to calculate the weights of each index after standardization. The specific formula is as follows [19].
e j = k j = 1 m ( Q i j × I n Q i j ) , k = 1 I n ( m )
w j = 1 e i i = 1 n e i
where Q i j is the standardized value of the j-th evaluation index for the i-th sample, e i is the entropy value of the j-th evaluation index, w i is the weight value of the j-th evaluation index, n represents the total number of evaluation indices, and m refers to the number of study areas.

3.1.3. Evaluation Model

The degree of cultivated land fragmentation through the comprehensive index method was evaluated. The higher the index value, the lower the degree of fragmentation [20]. The specific formula is as follows:
P j = i = 1 n Q i j W i j
where P j represents the cultivated land fragmentation index of the j-th research unit, Q i j represents the value of the i-th evaluation index for the j-th research unit, W i j represents the weight of the i-th evaluation index, and n represents the total number of evaluation indices.

3.2. Moving Window Method

In order to comprehensively analyze the spatial distribution characteristics of cultivated land fragmentation within the study area, we employed a moving window approach to calculate the selected landscape indices, and the window size is 90 m.

3.3. Geodetector

The Geodetector is a statistical method used to detect spatial differentiation and reveal the driving factors behind it [17]. In this paper, we selected elevation (X1), slope (X2), aspect (X3), population (X4), population density (X5), total agricultural output value (X6), and GDP (X7), as detection factors from the perspectives of topography, socio-economics, and population. The calculation formula is as follows [18,21]:
q = 1 i = 1 3 N i σ i 2 N σ 2
where N is the number of samples in the study area, i is the partition (i = 1, 2, 3), σ 2 , and σ i 2 are the variances of indicators in the study area and the variances of partition, respectively.

4. Results and Discussion

4.1. Analysis of Evaluation Results

4.1.1. Calculation Results of Weights

The weights of cultivated land fragmentation indicators reflect their influence on the overall evaluation. After standardization, the entropy weight method was used to calculate indicator weights (Table 1).
The weights of shape fragmentation in the three areas are notably higher than those of area and distribution fragmentation.

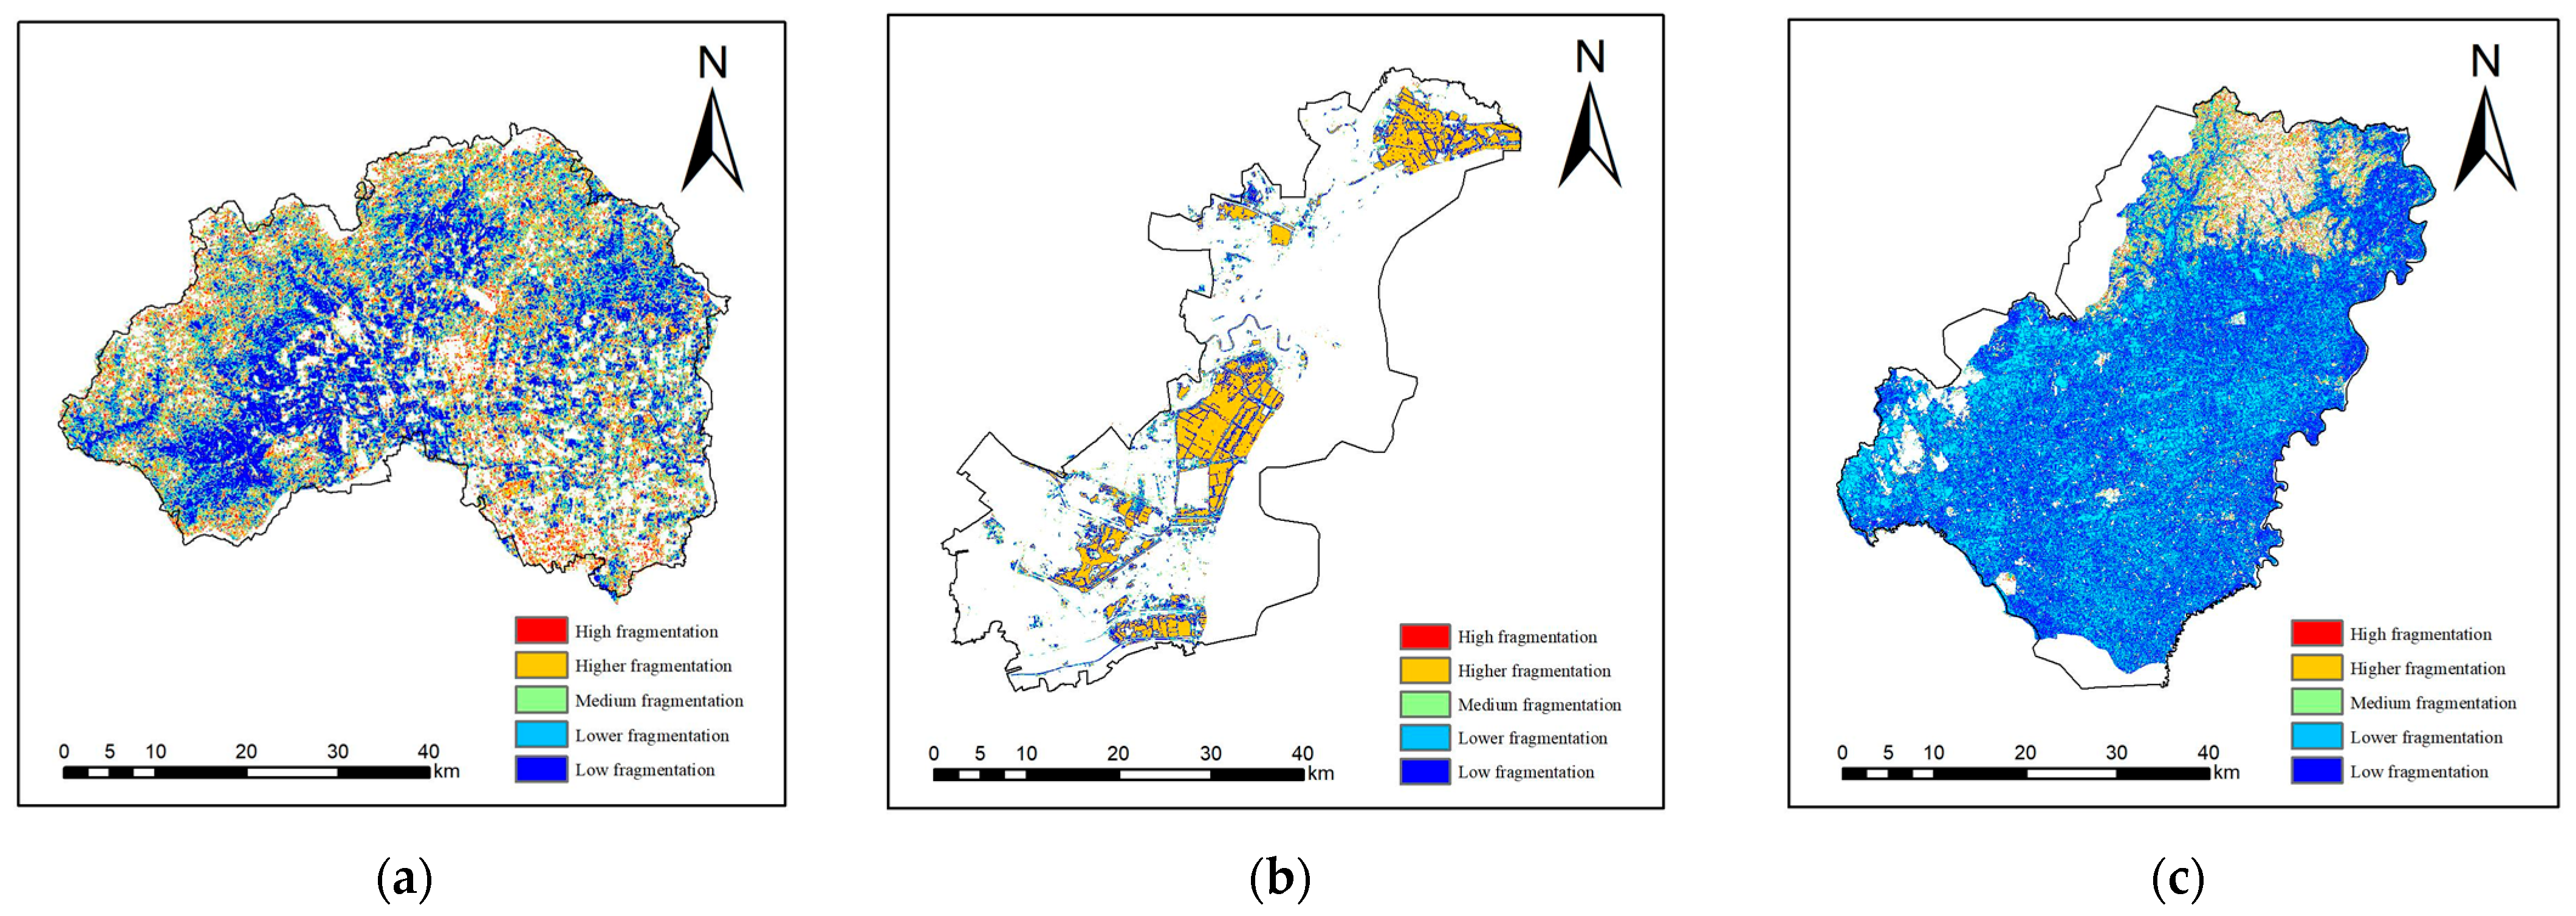
4.1.2. Evaluation and Analysis of Cultivated Land Fragmentation

The degree of cultivated land fragmentation in the three study areas was evaluated using the comprehensive index method. And, the evaluation results were classified into five levels using the natural breaks method in ArcGIS (Table 2 and Figure 1, Figure 2, Figure 3 and Figure 4).
In terms of area fragmentation, as shown in Figure 1, Changping District showed the most severe fragmentation, with the overall situation presenting heavy fragmentation. Mild fragmentation was mainly concentrated in the central area, while heavy fragmentation was dispersed throughout the district, potentially due to factors such as urban planning needs. Binhai New Area showed a moderate level of fragmentation, with the vast majority of the area experiencing mild fragmentation, reflecting a relatively high level of integration in land use and planning. However, due to factors such as topography, severe fragmentation still occurs in the peripheral areas. Hulin City showed the least severe fragmentation, with the majority of the area belonging to the mild category, and indicating a high degree of attention to land use. Nevertheless, due to the unique geographical location and climatic conditions, severe fragmentation occurs in the north.
In terms of shape fragmentation, as shown in Figure 2, all three research areas exhibit a predominantly mild to relatively mild level of fragmentation. For Changping District, severe fragmentation was scattered, indicating the presence of various irregular and dispersed shapes in cultivated land. In Hulin City, severe fragmentation was relatively concentrated, which suggesting more obvious shape irregularities in some areas, while other areas were more regular. Conversely, severe fragmentation was almost non-existent in Binhai New Area, indicating relatively regular and concentrated shapes in cultivated land.
Regarding distribution fragmentation, as shown in Figure 3, Hulin City showed the most severe fragmentation, with high levels of severe fragmentation in the central and southern research areas, resulting in the geographical dispersion of agriculture. Mild fragmentation areas were concentrated in the north and scattered in the central and southern research area. Binhai New Area showed a moderate level of fragmentation, with most areas belonging to the mild category. Severe fragmentation was concentrated on the edges, which may be related to the terrain or other factors. Changping District showed the least severe fragmentation, dominated by mild fragmentation, with a few areas exhibiting severe fragmentation concentrated in the central area, which may be related to economic factors such as urban development.
In terms of the fragmentation types, the severity of area fragmentationin the Changping District was significantly greater than that of shape and distribution fragmentation, indicating that the fragmentation of cultivated land in Changping was mainly manifested by the presence of numerous small plots of land. These small plots of land may be scattered in various corners of rural areas, forming scattered cultivated land. In contrast, Binhai New Area and Hulin exhibited a significantly higher degree of distribution fragmentation compared to the area and shape fragmentation, suggesting that cultivated land distribution was irregularly spaced, with cultivated land divided into small, irregularly shaped plots. In addition to the differences in shape and size, even in the same area, the spacing of cultivated land showed difference, resulting in the discontinuity of cultivated land and uneven yield.
Therefore, in terms of overall fragmentation, as shown in Figure 4, Binhai New Area showed the most severe fragmentation, with a predominance of moderately severe fragmentation, while mild fragmentation was scattered around the area. Changping District showed a moderate level of fragmentation, with mild to moderately mild fragmentation being the mainstay, and severely fragmented areas being the most scattered. Hulin showed the least severe fragmentation, with mild fragmentation as the primary type, while some northern area exhibited moderately severe to moderate fragmentation.

4.2. Analysis of Influencing Factors

Using the factor detector module of the Geodetector, the impacts of elevation, slope, aspect, population, population density, total agricultural output value, and GDP were investigated on cultivated land fragmentation in three research areas. The q-value was calculated, where a higher q-value indicates a greater contribution of the corresponding factor to cultivated land fragmentation.
As shown in Table 3 and Figure 5, fragmentation in Changping District and Hulin City was primarily influenced by both natural and social factors, while that in Binhai New Area was predominantly influenced by natural and demographic factors. The main influencing factor for cultivated land fragmentation in all three research areas is terrain, with the degree of topographical relief positively correlated with the degree of cultivated land fragmentation. Apart from terrain, the secondary driving factors of cultivated land fragmentation varied across different study areas. In Changping, the main influencing factor was total agricultural output value, indicating that lower agricultural development levels and the poorer development of large-scale and modern agriculture lead to more severe cultivated land fragmentation. In Binhai New Area, the primary factor was population, suggesting that population growth drove urban expansion, resulting in the decentralization of rural settlements and the subsequent fragmentation of original cultivated land. In Hulin City, GDP was the primary factor, indicating that the area’s high level of economic development had led to the extensive use of mechanized production, while for promoting economic growth, the space for large agricultural machinery operations was required, which reduces the scale and spatial aggregation of land resources and exacerbates cultivated land fragmentation.
According to the results of interactive detection among various factors shown in Figure 5, the interactions of all seven factors enhanced the impact on cultivated land fragmentation, indicating that the influence of these factors was not independent but interrelated. While one factor changed, there was a high likelihood that the distribution and degree of cultivated land fragmentation would also change.

5. Conclusions

This paper used 2020 Landsat8 Collection2 data, employed landscape pattern indices, the moving window method, and the geodetector to study cultivated land fragmentation in three research areas:
  • In terms of the overall degree of fragmentation, the Binhai New Area showed the most severe fragmentation, which was mainly severe with light patches. Changping District showed moderate fragmentation, mainly light with a scattered severe area. Hulin City showed the least fragmentation, mainly light, but some northern areas are moderate to severe.
  • Topography was the primary factor affecting cultivated land fragmentation. Factor interactions had a greater impact than individual factors, exhibiting mutual or nonlinear enhancement.
  • Secondary factors differ by areas: total agricultural output value in Changping District, population in Binhai New Area, and GDP in Hulin City.

Author Contributions

Conceptualization, S.Z.; methodology, Q.N.; writing—original draft preparation, Q.N.; writing—review and editing, S.Z. and D.Z.; project administration, Z.W.; funding acquisition, S.Z. All authors have read and agreed to the published version of the manuscript.

Funding

This research was funded by National Natural Science Foundation of China, grant number 41971310.

Institutional Review Board Statement

Not applicable.

Informed Consent Statement

Not applicable.

Data Availability Statement

Data available upon request.

Conflicts of Interest

The authors declare no conflicts of interest.

References

  1. Zhang, J.; Chen, M.; Huang, C.; Lai, Z. Labor Endowment, Cultivated Land Fragmentation, and Ecological Farming Adoption Strategies among Farmers in Jiangxi Province. China. Land 2022, 11, 679. [Google Scholar] [CrossRef]
  2. Zhou, Y.; Chen, T.; Feng, Z.; Wu, K. Identifying the contradiction between the cultivated land fragmentation and the construction land expansion from the perspective of urban-rural differences. Ecol. Inform. 2022, 71, 101826. [Google Scholar] [CrossRef]
  3. Chang, Y.; Zhang, T.; Zhang, F.; Shi, J.; Xie, Z. Analysis on the Spatiotemporal Variability and Driving Factors of Cultivated Land Fragmentation in the Hilly Region of Eastern Gansu. Res. Soil Water Conserv. 2021, 28, 264–271. [Google Scholar]
  4. Liu, J.; Jin, X.; Xu, W.; Sun, R.; Han, B.; Yang, X.; Gu, Z.; Xu, C.; Sui, X.; Zhou, Y. Influential factors and classification of cultivated land fragmentation, and implications for future land consolidation: A case study of Jiangsu Province in eastern China. Land Use Policy 2019, 88, 104185. [Google Scholar] [CrossRef]
  5. Xu, W.; Jin, X.; Liu, J.; Zhou, Y. Analysis of influencing factors of cultivated land fragmentation based on hierarchical linear model: A case study of Jiangsu Province, China. Land Use Policy 2021, 101, 105119. [Google Scholar] [CrossRef]
  6. Liu, J.; Jin, X.; Xu, W.; Zhou, Y. Evolution of cultivated land fragmentation and its driving mechanism in rural development: A case study of Jiangsu Province. J. Rural Stud. 2022, 91, 58–72. [Google Scholar] [CrossRef]
  7. Wang, D.; Yang, H.; Hu, Y.; Zhu, A.-X.; Mao, X. Analyzing Spatio-Temporal Characteristics of Cultivated Land Fragmentation and Their Influencing Factors in a Rapidly Developing Region: A Case Study in Guangdong Province, China. Land 2022, 11, 1750. [Google Scholar] [CrossRef]
  8. Wang, X. Changes in cultivated land loss and landscape fragmentation in China from 2000 to 2020. Land 2022, 11, 684. [Google Scholar] [CrossRef]
  9. Lei, Y.; Zhang, X.; Luo, J.; Li, Y.; Wang, Z.; Yao, L.; Li, X. Spatio-temporal evolution of urban landscape pattern in arid areas on different zones: A case study of Zhangye City. Acta Ecol. Sinion 2023, 43, 2034–2048. [Google Scholar]
  10. Tan, Y.; Chen, H.; Lian, K.; Yu, Z. Comprehensive Evaluation of Cultivated Land Quality at County Scale: A Case Study of Shengzhou, Zhejiang Province, China. Environ Res. Public Health 2020, 17, 1169. [Google Scholar] [CrossRef]
  11. Zhang, X.; Yang, H.; Ma, W.; Yang, M.; Wang, H.; You, Y.; Hui, Y.; Gong, Z.; Wang, T. Ecological Risk Assessment of Cultivated Land Based on Landscape Pattern: A Case Study of Tongnan District, Chongqing. Smart Agric. 2024, 6, 58–68. [Google Scholar]
  12. Liang, J.; Pan, S.; Chen, W.; Li, J.; Zhou, T. Cultivated land fragmentation and its influencing factors detection: A case study in Huaihe River Basin, China. Int. J. Environ. Res. Public Health 2022, 19, 138. [Google Scholar] [CrossRef] [PubMed]
  13. Deng, Z.; Cao, J.; Hu, Y. Spatial and temporal evolution of landscape pattern in downtown area of Jixi City, China. Eur. J. Remote Sens. 2020, 53, 104–113. [Google Scholar] [CrossRef]
  14. Liu, K.; Yang, Y.; Shi, R.; Li, Q.; Wu, B.; Zheng, H.; Mi, C. Spatiotemporal changes and driving forces of landscape patterns in the Yuqiao Reservoir watershed during 1990–2020. J. Agric. Resour. Environ. 2023, 40, 154–164. [Google Scholar]
  15. Ai, J.; Yang, L.; Liu, Y.; Yu, K.; Liu, J. Dynamic Landscape Fragmentation and the Driving Forces on Haitan Island, China. Land 2022, 11, 136. [Google Scholar] [CrossRef]
  16. Wang, J.; Xu, C. Geodetector: Principle and prospective. Acta Geogr. Sin. 2017, 72, 116–134. [Google Scholar]
  17. Zhao, X.; Yan, W.; Wang, K.; Xu, Y.; Zheng, H.; Sang, Z. Study of the Morphological Characteristics of Cultivated Land in Semiarid Sandy Areas. Land 2023, 12, 1849. [Google Scholar] [CrossRef]
  18. Wang, Y.; Zhao, X.; Zuo, L.; Zhang, Z.; Wang, X.; Yi, L.; Liu, F.; Xu, J. Spatial Differentiation of Land Use and Landscape Pattern Changes in the Beijing–Tianjin–Hebei Area. Sustainability 2020, 12, 3040. [Google Scholar] [CrossRef]
  19. Li, D.; Duo, L.; Bao, C.; Zhang, X.; Zhou, Z. Spatiotemporal Distribution and Fragmentation Driving Mechanism in Paddy Fields and Dryland of Urban Agglomeration in the Middle Reaches of the Yangtze River. Land 2024, 13, 58. [Google Scholar] [CrossRef]
  20. Gan, H.; Zhao, Z. Spatial and Temporal Characteristics of Cultivated Land Fragmentation in Central Guizhou Economic Zone Based on Landscape Index: A case study of GUI an New Area. Cent. South Agric. Sci. Technol. 2022, 43, 98–104+109. [Google Scholar]
  21. Xu, M.; Lu, N.; Wang, X.; Zhang, Z. Evolution of farmland landscape fragmentation and its driving factors in the Beijing-Tianjin-Hebei region. J. Clean. Prod. 2023, 418, 138031. [Google Scholar] [CrossRef]
Figure 1. (a) Changping District distribution map of land fragmentation; (b) Binhai New Area distribution map of land fragmentation; and (c) Hulin City distribution map of land fragmentation.
Proceedings 110 00016 g001
Figure 2. (a) Changping District distribution map of shape fragmentation; (b) Binhai New Area distribution map of shape fragmentation; and (c) Hulin City distribution map of shape fragmentation.
Proceedings 110 00016 g002
Figure 3. (a) Changping District distribution map of distribution fragmentation; (b) Binhai New Area distribution map of distribution fragmentation; and (c) Hulin City distribution map of distribution fragmentation.
Proceedings 110 00016 g003
Figure 4. (a) Changping District comprehensive fragmentation distribution map; (b) Binhai New Area comprehensive fragmentation distribution map; and (c) Hulin City comprehensive fragmentation distribution map.
Proceedings 110 00016 g004
Figure 5. (a) Changping District interaction detection results; (b) Binhai New Area interaction detection results; and (c) Hulin City interaction detection results. Different colors represent different levels of interaction intensity. Specifically, the red portion indicates a very strong interaction, while the blue portion signifies a weaker interaction. The other colors, situated between red and blue, represent a gradual transition in interaction intensity from high to low.
Proceedings 110 00016 g005
Table 1. Weight calculation results.
Objective
Layer
Criterion
Layer
Indicator
Layer
Weight Coefficient
Changping DistrictBinhai New AreaHulin City
Evaluation of cultivated land fragmentation in different research areasArea indexLPI0.12990.12910.1345
PLAND0.13130.13770.1367
Shape indexCONTAG0.15870.15700.1414
AI0.13420.12900.1455
AWMPFD0.14130.13840.1540
Dispersion indexSHDI0.15450.15190.1372
DIVISION0.15010.15690.1507
Table 2. Calculation results of cultivated land fragmentation index.
Criterion LayerChangping DistrictBinhai New AreaHulin City
Area index0.5000.5410.547
Shape index0.3310.3300.330
Dispersion index0.5510.5160.512
Comprehensive index0.1330.1320.140
Table 3. Factor detection results.
X1X2X3X4X5X6X7
Changping District0.36180.39600.34420.14730.09850.42080.2354
Binhai New Area0.11320.24660.40100.24780.42440.01930.1939
Hulin City0.23410.14400.29900.22700.23150.37930.4492
Disclaimer/Publisher’s Note: The statements, opinions and data contained in all publications are solely those of the individual author(s) and contributor(s) and not of MDPI and/or the editor(s). MDPI and/or the editor(s) disclaim responsibility for any injury to people or property resulting from any ideas, methods, instructions or products referred to in the content.

