Abstract
The cosmic web is one of the most complex systems in nature, consisting of galaxies and clusters of galaxies joined by filaments and walls, leaving large empty regions called cosmic voids. The most common method of describing the web is a correlation function and its derivative, the fractal function. In this paper, I provide a review of the fractal properties of the cosmic web from the observational point of view within the Newtonian concordance CDM Universe framework. I give a brief history of fractal studies of the Universe. I then describe the derivation of the fractal function from angular and spatial distributions of galaxies and their relations. Correlation functions are not sensitive to the shape of the galaxy distribution. To improve our quantitative understanding of properties of the web, statistics must be used which are sensitive to the pattern of the web.
1. Introduction
Long ago scientists noticed that many natural processes are self-similar over a large range of scales. Well-known examples are coastlines and mountain regions. The self-similarity of natural processes was discussed by Benoit Mandelbrot [], who suggested the term fractal for this phenomenon. A similar phenomenon was observed in the distribution of galaxies, which are hierarchically clustered. This was noticed by Charlier [] and studied in more detail by Carpenter [], Kiang [] Wertz [,], Haggerty and Wertz [] and de Vaucouleurs [,]. Based on these observations a branch in physical cosmology, named fractal cosmology, was formed in the 1980s []. An important issue in the fractal cosmology is the fractal dimension and its dependence on the scale. The fractal dimension of a homogeneous spatial object is three, of a surface is two, and of a line is one. Actual objects can have non-integer values of the fractal dimension.
Studies of the fractal properties of the cosmic web are conducted using either the Newtonian framework or the relativistic approach. In the Newtonian framework, researchers use direct observational data and N-body simulations to describe large-scale structures, assuming gravity to be the dominant force, without accounting for relativistic effects. This approach treats cosmic structures within the concordant Lambda Cold Dark Matter (CDM) universe model, relying on classical mechanics to model clustering patterns. The history of the formation of this model is given, among others, in books by Peebles [,] and Einasto [].
In contrast, the relativistic approach incorporates general relativity, taking into account the expansion of the Universe and relativistic corrections to gravitational interactions. This perspective provides a more accurate description of cosmic evolution, particularly on a large scale, where relativistic effects influence the formation of the distribution of structures. Studies in this field examine how fractal-like properties emerge within the relativistic framework. This often involves the use of tensor-based models and relativistic perturbation theory. Relativistic approaches include, among other topics, theories of inflation [,], chaotic inflation (Linde [,], Linde and Riotto [], Linde [], and Nambu and Sasaki []), and quantum gravity (Ambjørn et al. [] and Calcagni [,]).
In this review, I provide an overview of the fractal properties of the cosmic web in the Newtonian approximation of the Lambda Cold Dark Matter (CDM) Universe. The review is based on the Newtonian approach for two reasons: (i) almost all fractal studies of real and simulated galaxies are conducted within the framework of the Lambda Cold Dark Matter universe, described in a new section; (ii) the relativistic approach is mostly related to the early stages of the evolution of the Universe, where some constraints of the concordant Lambda Cold Dark Matter Universe are invalid. The relativistic approach is a new and rapidly evolving field of study. It is outside the scope of the present observational review.
I begin with the description of the Lambda Cold Dark Matter (CDM) Universe in Section 2. Next, I give a brief history of fractal studies of the cosmic web in Section 3. Section 3.1 discusses the angular distribution of galaxies and how this can be described by the angular correlation function. Section 4 discusses the statistical description of the cosmic web by measuring the correlation function and fractal dimension. In Section 5 and Section 6, I discuss the correlation and fractal analysis of the web using spatial data. Section 7 is devoted to comparing angular and spatial distributions of galaxies. Here, I pay special attention to two aspects of fractal studies: the dependence of fractal characteristics on the scale from sub-megaparsec to hundreds of megaparsecs and the differences between 2D and 3D fractal characteristics. Section 8 is devoted to the study of the structure and evolution of the cosmic web, using combined spatial and velocity data. Section 9 discusses the scale of homogeneity of the cosmic web. The review concludes with a summary and outlook.
2. Basics of the Concordant CDM Universe
In Section 2, I describe the concordant CDM Universe, the basic framework of fractal studies of the cosmic web. The concordant CDM model of the Universe is based on five pillars: the Big Bang model of the birth of the Universe, the Big Bang nucleosynthesis, data on the cosmic microwave background (CMB) radiation, data on the web-like distribution of galaxies in the present epoch, and the inflation hypothesis.
The Big Bang model is based on the general relativity theory by Einstein [] and its extensions, developed by Friedmann [] and Lemaître []. An alternative model of a Steady-state Universe by Hoyle [] contradicts many astronomical data and is now rejected. The physics of the Big Bang is now well known. There exist variants that suggest that the Bang that created our Universe was actually only one event in the chaotic inflation, as discussed, among others, by Linde [,].
According to the Big Bang model, the Universe began in an extremely hot and dense state. After a few minutes, the Universe cooled to temperatures that allowed light chemical elements—hydrogen, helium and deuterium—to form. This process is called Big Bang nucleosynthesis and was studied first by Hoyle [] and more recently by Cyburt et al. []. All heavier elements were synthesized in stars, as studied in detail by Burbidge et al. []. The results of these calculations are in good agreement with the observed distribution of chemical elements in stars and gas clouds.
The evolution of densities of various components of the Universe in units of the critical density is shown in Figure 1. The total density is equal to the critical density with very high accuracy, since even small deviations from the critical density increase during the evolution. The vertical dashed line corresponds to the present moment, and the gray shaded region represents the future. The vertical dotted lines show epochs of equality of radiation and matter, , recombination, , and equality of dark energy and matter, . Solid colored lines show components of the standard CDM, and dotted lines represent a model, where is replaced by decaying dark energy, as suggested by recent DESI measurements [].
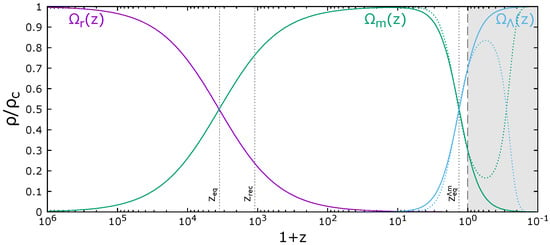
Figure 1.
The evolution of radiation (), matter (), and dark energy () densities shown as a function of redshift z []. Reproduced with permission from Einasto, J.; Hütsi, G.; Szapudi, I.; Tenjes, P., Spinning the Cosmic Web; published by World Scientific, 2025.
The third important epoch in the cosmic history is the recombination of hydrogen at at temperatures around 3000° K. The emission from this epoch is observable as CMB radiation. As stressed by Sunyaev and Chluba [], the physics at this epoch is very simple and well understood from laboratory experiments. The CMB radiation angular power spectrum depends on essential cosmological parameters. Modern CMB observations with the Planck satellite [] yield for the spatial curvature of the Universe . This means that the Planck data did not find any deviations from a spatial flat Universe with and . For the amount of matter, the Planck data give the following values: baryon density , cold dark matter (CDM) density , and dark energy density . These density estimates are in good agreement with estimates from Big Bang nucleosynthesis for baryonic matter, dark matter (DM) in systems of galaxies, as found by Einasto et al. [] and Ostriker et al. [], and with the dark energy density value found from direct measurements of supernovas by Perlmutter et al. [] and Riess et al. []. Planck and recent James Webb Space Telescope data yield for the Hubble constant km Mp, and the age of the Universe Gyr [].
The inflation hypothesis of the early evolution of the Universe was suggested independently by Starobinsky [] and Guth [] and extended by Linde [,] to chaotic inflation. Possible problems of the concordant CDM model were analyzed in detail by Di Valentino et al. [].
3. A Short History of the Fractal Studies of the Cosmic Web
In this section, I give a short history of fractal studies of the cosmic web. First, I describe the angular distribution of galaxies and the discovery of the cosmic web. Discussion of the fractal character of the cosmic web follows.
3.1. Angular Distribution of Galaxies
In their studies, Carpenter [] and de Vaucouleurs [] observed that extragalactic entities establish a linear correlation between their characteristic density and radius when expressed in logarithmic terms, as illustrated in Figure 2. This correlation exhibits a slope of approximately and aligns with the Schwarzschild limit. Furthermore, de Vaucouleurs [] highlighted that Abell’s rich clusters are not only clustered on the characteristic scale of superclusters but also extend to larger scales, indicating an ongoing clustering phenomenon among galaxies. More recently, Sankhyayan et al. [] created a catalog of superclusters based on galaxy clusters identified in the Sloan Digital Sky Survey (SDSS) by York et al. []. The authors derived the relationship between density contrast and comoving size, discovering a slope of around ∼−2.
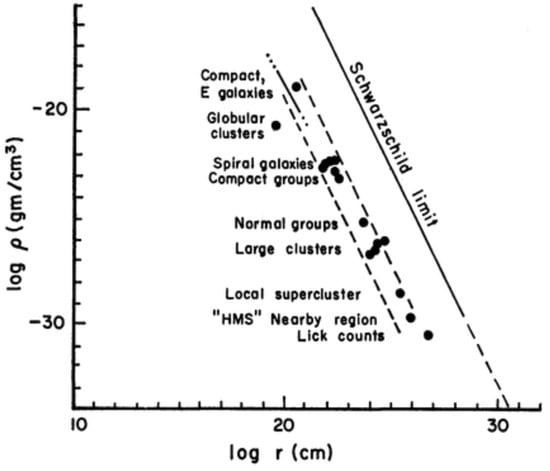
Figure 2.
Density-radius relation of various systems of galaxies []. Reproduced with permission from AAAS, The Case for a Fierarchical Cosmology; published by Science, 1970.
The first deep catalog of galaxies, covering the whole northern hemisphere, was made in the Lick Observatory with the 20-inch Carnegie astrograph by Shane and Wirtanen []. Actual counts of galaxies were made in cells. Seldner et al. [] used these actual counts and corrected the count for various errors and plate sensitivity differences. The final map of galaxies in the northern galactic hemisphere is shown in the left panel of Figure 3. Several well-known clusters of galaxies are seen on the map. For example, the Coma cluster appears near the center of the map. The general impression is that field galaxies are distributed approximately randomly.
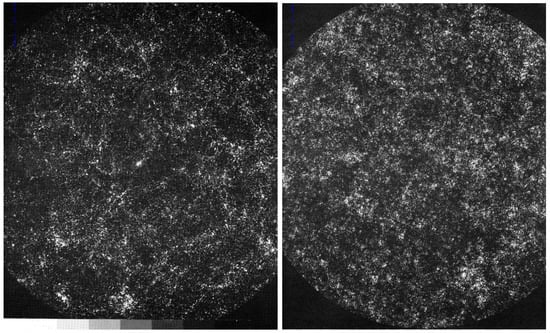
Figure 3.
(Left): Map of Lick survey galaxies in the northern galactic hemisphere brighter than and north of galactic latitude []. (Right): Simulated map of galaxies imitating the 2D distribution of Lick galaxies [].
Soneira and Peebles [] developed a fractal model Universe to match the character of the galaxy distribution in the Lick survey. The model assigns ‘galaxy’ positions in a three-dimensional clustering hierarchy, fixes absolute magnitudes, and projects angular positions of objects brighter than onto sky. This procedure yields a galaxy map, shown in the right panel of Figure 3. Both the real Lick map and the computer generated map were used to calculate two-point angular correlation functions.
Peebles [] proposed utilizing the correlation method for the analysis of distribution of galaxies, applying it to all significant catalogs of extragalactic objects, including works by Hauser and Peebles [], Peebles and Hauser [], Peebles [], Peebles and Groth [], and Peebles []. These investigations demonstrated that the angular distribution of galaxies could be characterized by a power law. When the estimated angular correlation function is converted to the spatial correlation function, it retains a power law form:
where Mpc is the correlation length, and is a characteristic power index []. This power law is valid in the scale interval Mpc, where distances are expressed in units of the dimensionless Hubble constant h ( h km/s per megaparsec). Groth and Peebles [] showed that the angular correlation function is essentially zero at angular distances degrees. The conclusion from these studies, based on the apparent (two-dimensional) distribution of galaxies and clusters on the sky, confirmed the picture that galaxies and clusters of galaxies are hierarchically clustered.
In 1970s and 1980s, British and Australian astronomers used Schmidt telescope plates to photograph the whole sky. The Automatic Plate Measuring (APM) machine in Cambridge was used to scan these plates. Special software was developed to separate galaxy and star images. The final catalog contains over two million galaxies brighter than . Maddox et al. [] used APM galaxies to calculate the angular correlation function of galaxies, results are shown in Figure 4. We see that the power law relation, Equation (1), is valid over three decades of angular distances, degrees. The almost constant slope of the angular correlation function over a large range of angular scales was interpreted by Peebles [] as evidence that the spatial correlation function is well represented by the law Equation (1) over the range of separations 10 kpc Mpc. As we see below in Section 7, this conclusion was influenced by the insensitivity of the two-dimensional correlation function to the spatial structure of the cosmic web.
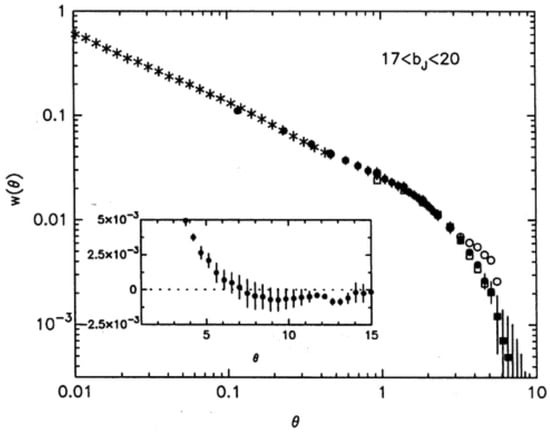
Figure 4.
Average angular correlation function of APM catalog of galaxies in the magnitude range . The inset shows the mean angular CF on a linear scale. As argument, the angular separation in degrees is used [].
3.2. Discovery of the Cosmic Web
In late 1970s, the number of galaxies with measured redshifts allowed finding the distances of galaxies and studying the spatial three-dimensional (3D) distribution of galaxies. The first results of these analyses were reported in the IAU Symposium “Large Scale Structure of the Universe” in Tallinn, September 1977 []. Jõeveer et al. [] presented the study of the structure of the Perseus–Pisces Supercluster and its surroundings and of the global network of superclusters and galaxy chains/filaments. Brent Tully and Fisher [] presented a movie of the Local Supercluster. To obtain a spatial image of the supercluster, he used the simple trick of making the image rotate, which created a three-dimensional illusion. The movie showed that the Local Supercluster consists of a number of chains of galaxies that branch off from the supercluster’s central cluster in the Virgo constellation as legs of a spider. William Tifft, in his talk, gave an overview of the recent study of the Coma supercluster and its environ by Gregory and Thompson [].
The wedge diagram of galaxies in the 30– declination zone gives us a fascinating glimpse into the cosmic web. This diagram reveals how galaxies within the Perseus–Pisces Supercluster are arranged like a chain, with clusters and groups of galaxies appearing like pearls along a necklace. This structure is a prime example of the cosmic web’s basic elements: clusters, filaments, sheets, and voids. Superclusters of galaxies are massive, but they occupy only about 4% of the Universe’s total space. The remaining 96% is composed of vast voids. This large-scale geometry forms a continuous network that includes clusters, filaments, sheets, and the spaces between them. Interestingly, central galaxies in rich clusters are typically of the cD type and are often active radio sources.
Sergei Shandarin’s early numerical simulations were groundbreaking in illustrating the evolution of particles through gravitational clustering, based on the theory developed by Zeldovich []. In the right panel of Figure 5, you can see a fascinating system of high- and low-density regions. High-density areas are compact and clumped together, forming a network of filaments that enclose expansive under-dense regions. This visualization was pivotal, as it gave the first glimpse into the Universe’s structural patterns as predicted by the Zeldovich model.
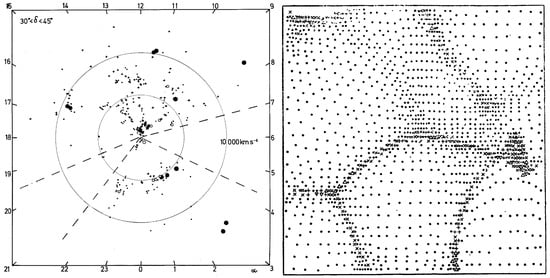
Figure 5.
(Left): Wedge diagram for the – declination zone. Filled circles show rich clusters of galaxies, open circles—groups, dots—galaxies, crosses—Markarian galaxies []. (Right): Distribution of particles in simulations by (Shandarin 1975, private communication), [].
The origin of this filamentary structure was analyzed by Bond et al. [], who introduced the term “cosmic web” to characterize this phenomenon. Analyses of galaxy distribution indicated that the correlation length of clusters significantly exceeds that of individual galaxies (see, for instance, Bahcall and Soneira [], Klypin and Kopylov []). This observation was interpreted by Kaiser [] as a form of bias affecting clusters in relation to galaxies. Szalay and Schramm [] showed that, if the correlation function is in the form Equation (1), its index determines the fractal dimension of the sample: .
3.3. Discussion of the Fractal Character of the Cosmic Web
The next step was made by Einasto et al. [], who demonstrated that the correlation length is influenced not only by the luminosity of galaxies but also by the depth of the sample, as illustrated in Figure 6. This relationship between galaxy correlation length and sample depth was interpreted by Pietronero [] as evidence for a fractal structure in the distribution of galaxies. Pietronero emphasized that the fractal nature of galaxy distribution extends to infinitely large distances, suggesting that the entire Universe exhibits fractal characteristics. Furthermore, Jones et al. [] examined the galaxy distribution within the CfA redshift survey and in a simulation of the CDM model conducted by Gramann [,], which is recognized as one of the first CDM simulations featuring particles within a 40 Mpc box. The authors concluded that both the galaxy distribution and the CDM model can be effectively described using a multifractal approach, indicating that the fractals possess more than one scaling index. The dimensionality of this distribution varies between 1 and 3.
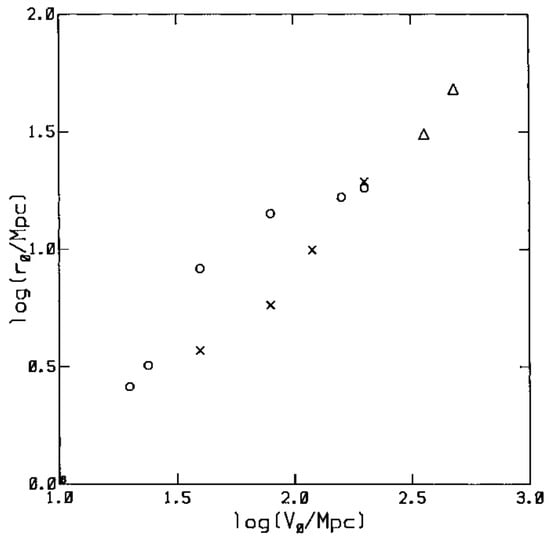
Figure 6.
The different symbols (circles, crosses, triangles) highlight that different types of galaxy groupings have distinct clustering properties. Rich clusters, for example, might show a larger correlation length compared to galaxies [].
Fractal properties of the distribution of galaxies were discussed in the IAU Symposium “Large scale structures of the Universe”, held in Balatonfured, Hungary, on 15–20 June 1987. Bernard Jones reported basic results by Jones et al. []. He started his talk showing the distribution of galaxies and declared “this is a fractal”. The distribution of both observed and model samples can be described by multifractals with varying fractal dimension. A further discussion of the fractal character of the large-scale distribution of galaxies was by Mandelbrot [], who mentioned that he developed the multifractal concept long ago, between 1970 and 1976, as described in his books [,]. Further, he concentrated on the question: is the transition to homogeneity at the distance inside or outside of the limiting distance of data, ? If , we cannot make any decisions on the transition scale to homogeneity. After the Symposium, Alex Szalay invited a small group of interested people to Budapest to discuss in a relaxed atmosphere the fractal character of galaxy distribution: Benoit Mandelbrot, Yakov Zeldovich, Bernard Jones, and the author of the present review. In the discussion, we agreed that the limit of the validity of the power-law character of the correlation function with constant index is at least Mpc. Available data go beyond this distance and show definitely a multifractal character. However, inside the limit of observational and model data, Mpc, there is no evidence for the transition to homogeneity with fractal index . Thus, further studies are needed to find the value of . Zeldovich disliked the fractal description of the Universe for two reasons: (i) it gives no hint to the physics of the formation and evolution of the Universe, and (ii) it contradicts other data that show that the mean density of matter is not zero, as predicted by a simple fractal model.
Subsequent discussions of the fractal characteristics of the cosmic web have been undertaken by various research groups, employing diverse methodologies. The majority of these discussions have centered around the widely accepted concordant CDM model. Key aspects of this model were presented at several IAU Symposia: in Tallinn in 1977 [], Crete in 1982 [], Hungary in 1987 [], and again in Tallinn in 2014 []. The theoretical underpinnings of this model are rooted in the hierarchical clustering scenario proposed by Peebles and Yu [], alongside the pancake model for cosmic web formation introduced by Zeldovich [], and its extension through catastrophe theory as described by Arnold et al. []. Further advancements in methodology involved the application of statistical measures to investigate the fractal nature of galaxy distributions, as explored by Mandelbrot [] and Martinez and Jones []. These methods encompass various definitions of fractal dimensions, including the Hausdorff dimension, capacity dimension, and correlation dimension (for definitions, refer to Martínez and Saar []).
In late 1970s, a burst of interest in the fractal character of the Universe emerged. Different authors had various styles in fractal studies: the Anglo-American style, Italian style, and a more neutral style, represented by Mandelbrot, Jones, Martinez, and Balian and Schaeffer [,]. The latter authors confirmed the bifractal character of galaxy distribution between scales from 0.1 to 10 Mpc, with different fractal dimensions for dense clustered regions and for underdense regions. Song and Ruffini [], Ruffini et al. [] constructed a cellular fractal model of the early universe. The authors assumed that dark matter consisted of some ’inos’, which become non-relativistic at epoch , and calculated the main parameters of “ elementary cells”: characteristic Jeans masses are , radii 100 Mpc, and epochs . The authors predicted that the cellular fractal model has an upper cutoff, and above this cutoff the mean density does not decrease with distance. This model was compared with observations by Calzetti et al. [,]. More recent investigations into the fractal properties of the cosmic web have been conducted by Gaite et al. [] and Gaite [,].
The Anglo-American style of fractal studies was based essentially on the angular distribution of galaxies. The first steps in this approach were conducted by Peebles and Yu [] and Peebles [], who suggested the use of the correlation function to describe the distribution of galaxies. The next essential step was the application of a fractal model by Soneira and Peebles [] to describe the angular distribution of galaxies. A further use of this approach was the study of the distribution of APM galaxies by Maddox et al. []. The fractal character of the cosmic web was analyzed by Peebles [] and Peebles []. It is characteristic that authors of the Anglo-American style studies avoided in their publications the term “cosmic web”.
The Italian style of fractal studies is essentially the continuation of earlier work by Charlier [], Kiang [], and de Vaucouleurs [,] on the hierarchical distribution of galaxies. This style is represented by Pietronero [], Pietronero et al. [], Pietronero and Sylos Labini [], Sylos Labini et al. [], and Borgani []. The focus of Italian-style studies was the fractal behavior of the Universe on large scales.
A dialogue between the Anglo-American and Italian views on fractal properties of the Universe took place during the celebration of the 250th anniversary of Princeton University []. Marc Davis [] presented the Anglo-American group’s view. His main arguments were as follows: (i) the constant value of the correlation length for 2D and 3D samples of various depths, Mpc; (ii) the mean density of galaxies is the same for nearby and more distant samples, and the scatter of densities decreases with distance. Luciano Pietronero [] described the Italian vision. According to this view, the correlation length of samples increases with distance, and the mean density decreases with distance up to ∼1000 Mpc. Pietronero made a bet with Davis, over a case of Italian or Californian wine, Neil Turok was the referee—The correlation length for volume-limited samples, , is Mpc (Davis) or Mpc (Pietronero). These are fundamental questions, and I discuss these aspects of fractal studies in later sections.
4. Statistics of Galaxy Clustering
Differences between fractal studies of various styles start from variations in the methods to describe the fractal properties of the Universe. The three-dimensional distribution of galaxies and clusters of galaxies was described in the Tallinn 1977 symposium only qualitatively. In this section, I discuss some aspects of statistics related to the estimation of quantitative statistical parameters of the cosmic web.
4.1. Measuring Spatial Distribution of Galaxies
In the late 1970s, astronomers and cosmologists began to realize that the Universe’s total density of matter was about 20% of what we call the “critical density”—the density needed for the Universe to be flat and perfectly balanced. Most intriguingly, they found that the majority of this mass was in a mysterious form: dark matter. This was highlighted by the pioneering work of Einasto et al. [] and Ostriker et al. [], who laid the groundwork for our understanding of this cosmic puzzle (for a discussion see de Swart []). Back then, scientists knew from Big Bang nucleosynthesis (the process that created the first atomic nuclei) that only about 5% of this critical density was made up of baryonic matter, which is the “normal” matter that makes up stars, planets, and us. The rest had to be something else. Given this gap, the scientific community began considering the possibility that dark matter was non-baryonic. The first candidate was massive neutrinos, which were then known as hot dark matter (HDM) because they moved at relativistic speeds.
The first quantitative comparison of Peebles’ and Zeldovich’s structure formation models was conducted by Zeldovich et al. []. The authors investigated the properties of the distribution of real galaxies in the Virgo–Coma region using CfA data (sample O), the distribution of particles in a 3D simulation by Klypin and Shandarin [], calculated using the assumption that the dark matter particle population is made of neutrinos (sample A). The second model H was constructed according to the prescription described by Soneira and Peebles []. The two-dimensional view of this model is shown in the right panel of Figure 3. The authors used also the Poisson distribution of particles. Three tests were used: the spatial correlation function, percolation, and multiplicity tests.
The left panel of Figure 7 illustrates the spatial correlation functions for three different samples. This figure highlights a significant characteristic of the O and A samples: the presence of a distinct knee in their correlation function, which is notably absent in the hierarchical H and Poisson P models. At short distances, the correlation function is highly sensitive to the arrangement of galaxies or particles that are in close proximity to one another. In this range, most galaxies are found within clusters and groups that typically exhibit an almost spherical configuration. Conversely, at greater distances, the correlation function reflects the existence of galaxy filaments that are primarily one-dimensional in nature. Therefore, as we transition from small to large mutual distances among galaxies or particles, the geometric structure of the arrangement shifts. In contrast, the hierarchical and Poisson models lack filaments, resulting in a correlation function that appears featureless.
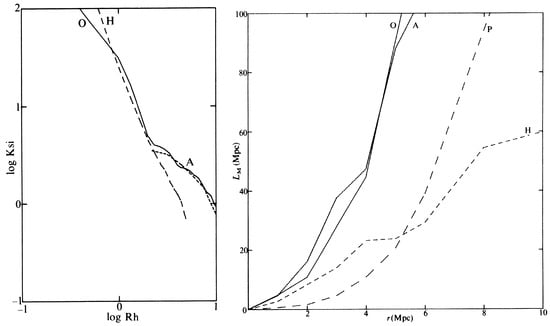
Figure 7.
(Left panel): the correlation function of the observed sample O around the Virgo cluster (cube of side 80 Mpc), of the sample generated by the hierarchical clustering model H, and of the adiabatic model A. (Right panel): the maximal length of connected regions as a function of neighbourhood radius r for four catalogs: O, A, H, and P (Poisson model). All distances are expressed for Hubble constant []. Reproduced with permission from Zeldovich, Y.B.; Einasto, J.; Shandarin, S.F., Giant voids in the universe; published by Nature, 1982.
The percolation method enables the assessment of the largest system’s length as a diagnostic tool. The right panel of Figure 7 illustrates the maximal lengths of galaxy and particle systems as a function of the neighborhood radius r. The neighborhood radius defines a range of distances around a galaxy or particle, where other elements are taken into account for analysis. Both galaxies and particles in simulations exhibit clustering behavior; consequently, at smaller radii r, the length of the longest system increases at a rate that surpasses that of a Poisson sample. However, at greater distances, the behavior of the samples diverges. In both the observed sample O and the model sample A, filaments connect clusters into a network. These filaments facilitate the formation of longer systems, resulting in a more rapid increase in the length of the longest system compared to the Poisson scenario. As depicted in Figure 7, the growth patterns of samples O and A are nearly identical. In contrast, for sample H, the rate of increase of length L with respect to radius r at larger distances is slower than that observed in the Poisson sample. This can be attributed to the lower density of field particles in sample H, as a significant portion of the particles is concentrated within clusters. Thus, this test proves to be sensitive to the existence of filaments that link clusters into a cohesive network.
The multiplicity test revealed distinct distributions of multiplicities across all samples. The observed sample exhibits a relatively balanced representation of systems with varying richness, indicating the presence of a detailed structure comprising galaxy systems of diverse richness levels. Notably, the majority of galaxies are concentrated within a single extensive structure—the Virgo supercluster. In contrast, the A sample features a prominent large system as well, but its distribution of smaller systems closely resembles that of a Poisson sample. This suggests a scarcity of systems with intermediate richness, such as small-scale filaments. Consequently, the A sample, derived from the neutrino-dominated Universe model, also appears to contradict the observational data.
The primary conclusion drawn from this analysis is that the hierarchical clustering model proposed by Soneira and Peebles [] fails to perform adequately across all tests, while the adiabatic model struggles specifically in the multiplicity test. Additionally, the neutrino-based adiabatic model encounters a significant challenge: it predicts that structure forms too late. Observational data indicate that galaxies and rich clusters of galaxies formed earlier than this model suggests, as highlighted by van den Bergh []. Consequently, both conventional neutrino-dominated cosmology and the hierarchical clustering model exhibit shortcomings. To address the challenges associated with neutrinos as a candidate for dark matter, Peebles [] proposed that dark matter consists of weakly interacting particles, known as Cold Dark Matter.
To evaluate the viability of the Cold Dark Matter (CDM) concept, Melott et al. [] conducted an analysis of the pioneering 3D CDM simulation by Centrella and Melott []. This examination revealed that the CDM model aligns with all quantitative tests employed by Zeldovich et al. []. The formation of galaxies is initiated by the collapse of small-scale perturbations, consistent with the clustering scenario proposed by Peebles. In contrast, large-scale structures develop in accordance with Zeldovich’s framework. The concept of the cosmic web was further refined by Bond et al. [], whose study elucidated the mechanisms by which filaments are interconnected to create this intricate network. However, both structure formation scenarios require adjustments. Hierarchical clustering is not merely a random occurrence; rather, it represents a continuous flow of particles and galaxies directed toward attractors formed from the highest peaks of the primordial fluctuation field. The process of pancaking originates from these peaks, resulting in various types of caustics, as suggested by Arnold et al. [].
4.2. Measuring the Correlation Function
Early studies of the distribution of galaxies were based on two-dimensional (2D) angular data as described in Section 3.1. To measure the distribution in a quantitative way, the correlation function was applied []. As discussed by Peebles [], the angular correlation function of almost all samples of galaxies is well represented by a power-law function:
where A is a constant, and is a parameter, whose value for most samples studied was . This power law can be inverted and has the solution:
where B is a constant, depending on A. These equations show that the angular correlation function is a power law with index lower by one unit than the spatial correlation function .
When, in the 1980s, galaxy samples with known radial velocities were obtained, a question emerged: how to use these three-dimensional (3D) data to characterize the distribution in a quantitative way. Distances of galaxies, calculated from observed radial velocities, are influenced by the Kaiser [] effect—an apparent contraction of the galaxy density field in the radial direction. To avoid this effect, Peebles [] and Davis and Peebles [] suggested the use of the angular position of galaxies to find first the two-dimensional correlation function. In this case, pair separations can be calculated parallel to the line of sight, , and perpendicular to the line of sight, . The angular correlation function, , can be found by integrating over the measured , using the equation
where and are the minimum and maximum distances of the galaxies in the sample. This equation has the form of the Abel integral equation and can be inverted to recover the spatial correlation function []:
If the correlation function is described as a power law function, angular and spatial functions have the forms of Equations (2) and (3), respectively. Davis and Peebles [] made a correlation analysis of the CfA redshift survey with magnitude limit 14.5 and applied the procedure described above to find correlation function parameters. The authors found that the spatial correlation function can be well represented by a power law, Equation (1), with parameters Mpc, and .
In subsequent years, this procedure was applied in most correlation analyses. Norberg et al. [] investigated the luminosity dependence of galaxy clustering in the 2dF Galaxy Redshift Survey. To measure the correlation length, the authors used projected angular correlation functions as suggested by Davis and Peebles []. The authors found the real space correlation length Mpc and power law slope . Zehavi et al. [,] studied the luminosity dependence of the SDSS galaxy correlation function and applied the standard procedure to measure the projected correlation function. Over the scales Mpc the power law approximation yields for correlation length of galaxies with : Mpc and .
4.3. Measuring the Fractal Dimension
The discovery of the dependence of the correlation length from the type of objects by Bahcall and Soneira [], Klypin and Kopylov [], and Einasto et al. [] and the interpretation of this effect by Pietronero [] in fractal terms initiated discussions on the following topic: what are the best methods to characterize fractal properties of the spatial distribution of galaxies? This problem was discussed also by Calzetti et al. [], Coleman and Pietronero [], and Borgani [], who pointed to the fact that, in the usual correlation analysis, the observed galaxy distribution is normalized to the Poissonian distribution in a way that cannot be used to test the homogeneity of the sample.
The natural estimator to determine the two-point correlation function is
where r is the galaxy pair separation (distance), and and are normalized counts of galaxy–galaxy and random–random pairs at a distance r of the pair members. Normalization equalizes the sum of all to the sum of all . Galaxies are clustered; thus, at small distances, the number density of galaxies is enhanced, , and . At large distances, the density of galaxies is less than the mean galaxy density (a large fraction of galaxies is located in clusters), thus , and by construction at large distances , as found already by Calzetti et al. []. The relative volume of regions with is much larger than the relative volume of regions with ; thus, the correlation function on larger scales is only slightly negative, see Figure 4. The crossover at separation , where , is approximately proportional to the depth of the sample.
Pietronero [], Calzetti et al. [], and Coleman et al. [] interpreted the increase in the galaxy correlation length with the sample size with this normalization effect and suggested that, instead of , an alternative clustering measure should be used: , where n is the mean density of galaxies. Another possibility is to use, instead of the correlation function , the structure function , where is the mean number of galaxies lying in a shell of thickness at distance r from any other point. In a Poisson process, . The structure function has a power law form on small scales, Mpc, and approaches zero at large separations. In the following analysis, I use the structure function to investigate fractal properties of the distribution of galaxies.
5. Correlation Analysis of the Cosmic Web
Historically, the quantitative analysis of the cosmic web has been dominated by correlation functions and their derivatives, the structure function and the fractal dimension function. It is well-known that the correlation function contains information on amplitudes of the density field but not on their phases. The importance of the phase information in the formation of the cosmic web has been understood long ago. To demonstrate the role of phase information, Coles and Chiang [] extracted the simulated density field, Fourier transformed the density field, and randomized phases of all Fourier components. The modified field has on all wavenumbers k the same amplitudes as the original field, only the phases of waves are different. In the modified field, no structures are visible.
Over the years, a variety of statistical methods have been developed to analyze specific aspects of the spatial patterns in the large-scale Universe. Almost all these methods are borrowed from other branches of science such as image processing, mathematical morphology, computational geometry, and medical imaging. The richness of various methods to investigate the structure of the cosmic web is seen in proceedings of the IAU Symposium “The Zeldovich Universe: Genesis and Growth of the Cosmic Web” [].
In the early years of the 21th century, new redshift surveys were published—the 2dF and the Sloan Digital Sky Survey (SDSS). The 2dF survey by Colless et al. [] allowed finding angular correlation functions of 2dF galaxies [], discussed in Section 3.1. Next, the SDSS was available [,,], which allowed studying the distribution of galaxies in much larger volumes of space. It was used to calculate correlation functions and power spectra of SDSS galaxies by Tegmark et al. [] and Zehavi et al. []. New large numerical simulations of the cosmic web were developed, which included hydrodynamical processes of formation and evolution of galaxies — the Millennium simulation by Springel et al. [] and the Illustris The Next Generation (IllustrisTNG) simulation by Springel et al. []. These observational and modeling possibilities allowed studying the character of the distribution of dark matter and galaxies in much more detail.
As described above, various groups obtained very different pictures of the fractal characteristics of the cosmic web. Thus, it is evident that a new independent study is needed, using more recent observational data and simulations. This was conducted by Einasto et al. [,]. In this section, I describe the conventional correlation analysis of the cosmic web, using as tests SDSS galaxies and particles from several modern CDM model simulations. First, I discuss the formation of galaxies in the cosmic web and the method, how to select particles in simulations to form samples of particles, comparable to samples of galaxies.
5.1. Formation of Galaxies in the Cosmic Web
By comparing spatial distributions of dark matter particles and galaxies, Jõeveer et al. [] and Zeldovich et al. [] found that there are almost no galaxies in voids, but voids are populated by a rarefied field of DM particles, see Figure 5. The authors emphasized from this difference that the galaxy formation is a threshold phenomenon. The analysis by White and Rees [] confirmed this: the galaxy formation is a two-stage process: first, dark matter condenses to form heavy halos, where various hydrodynamical processes form visible galaxies. The first numerical simulations of galaxy formation with a hydrodynamical method by Cen and Ostriker [] confirmed this model, verified by Springel et al. [] by a much more detailed hydrodynamical simulation. In high-density regions the baryonic matter forms galaxies, and in low-density regions it remains in the pre-galactic diffuse form together with low-density field of dark matter.
Based on these arguments, it is natural to use particles in high-density regions to get a sample of DM particles that imitates samples of galaxies. We apply a sharp particle density limit, , to select biased samples of particles. This method is similar to the Ising model, discussed by Repp and Szapudi []. Actually galaxy formation is a stochastic process; thus, the matter density limit, which divides unclustered and clustered matter, is fuzzy. However, a fuzzy density limit has little influence on the properties of correlation functions of biased and non-biased samples. Thus, we can accept a fixed threshold limit and select for biased model samples particles with density labels, .
5.2. Correlation Functions of Galaxies and Matter
In early studies of the spatial distribution of galaxies, only samples with a rather low distance limit were available, which raised the question: how representative are these samples in terms of describing the whole cosmic web? As discussed in Section 3, various authors interpreted these early data in a very different way. To avoid these difficulties, I use in the following analysis only galaxy and model samples found in a large sample volume, as conducted by Einasto et al. [,].
Einasto et al. [] used the luminosity-limited galaxy samples by Tempel et al. [], selected from data release 10 of the SDSS galaxy redshift survey []. The catalog has a Petrosian r- band magnitude limit and contains 489, 510 galaxies. The SDSS samples have magnitude limits , , , , and and are referred to as SDSS.18t, SDSS.19t, SDSS.20t, SDSS.21t, and SDSS.22t. The effective size of the sample is 500 Mpc. One view of the SDSS density field is presented in Figure 8. We see here a complicated network of clusters, filaments, and voids. The rich complex of superclusters in the lower part of the Figure is the Sloan Great Wall, which actually consists of three superclusters [].
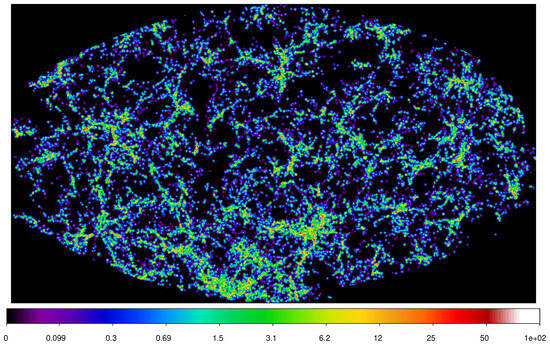
Figure 8.
Slice of the density field from the Sloan Digital Sky Survey at a distance of 240 Mpc and thickness of 10 Mpc. At lower part of the figure, the Sloan Great Wall is seen []. Reproduced with permission from Einasto, J., Dark Matter and Cosmic Web Story; published by World Scientific, 2024.
To have both high spatial resolution and the presence of density perturbations in a large scale interval, Einasto et al. [] used a series of simulations of the CDM models with box sizes Mpc with and number of particles . The cosmological parameters for all simulations are () = (0.28, 0.72, 0.044, 0.693, 0.84, 1.00). In the present analysis, I use the model of size 512 Mpc. Additionally, I use the simulated galaxy sample of the Millennium simulation by [] and Croton et al. [], which has the box of size 500 Mpc, and the EAGLE simulation by McAlpine et al. []. EAGLE simulations were run in boxes of sizes 25, 50, and 100 Mpc.
In the Einasto et al. [] simulation, the authors calculated local density values, , at particle locations using the locations of the 27 nearest particles, and expressed the densities in units of the average density. The authors formed samples corresponding to the simulated galaxies, containing particles that exceeded a certain density limit, . These samples are denoted as LCDM.i, where i denotes the particle density limit . The full DM model covers all particles, corresponds to the particle density limit , and is therefore denoted LCDM.00.
Correlation functions of CDM and SDSS samples are shown in the left and right panels of Figure 9, respectively. Figure 9 shows that samples with different galaxy luminosity and particle density limit form approximately parallel sequences, where the amplitude of the correlation functions increases with the increase in the luminosity/density limit. For galaxy samples, the amplitudes of the correlation functions are almost constant for low-luminosity samples and rise for samples brighter than approximately . The behavior of CDM model particle density selected correlation functions is different—with increasing particle density threshold , the amplitudes rise continuously. The luminosity dependence of the correlation functions is the principal factor of the biasing phenomenon, as shown by Kaiser []. A further discussion of the correlation length is given in the following subsection.
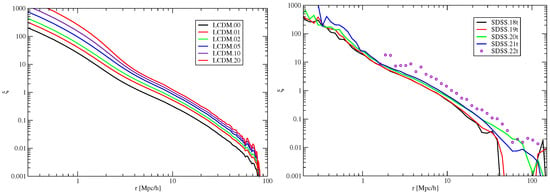
Figure 9.
Correlation functions of galaxies, . (Left panel) shows CDM model of box size 512 Mpc for different particle selection limits. (Right panel) is for SDSS galaxies using five luminosity thresholds [].
5.3. Luminosity Dependence of the Correlation Length
The dependence of the correlation length on the size and luminosity of samples was the main object of early analyses by Pietronero [], Pietronero et al. [], and Davis []. Pietronero et al. [] defended the view that the correlation length increases with the size of samples until very large scales, Mpc. Davis [] argued that it remains constant, Mpc for all sample sizes. I use new analyses of the correlation length to have a fresh view of the problem.
The data presented above allow calculating the correlation lengths of observed SDSS samples and simulated Millennium and EAGLE samples. In Figure 10, I show the correlation lengths, , of the SDSS, EAGLE, and Millennium samples as functions of magnitude . We see that, for low and intermediate luminosities, all samples have correlation lengths Mpc, which rises to higher values for more luminous galaxies. The correlation length has a rather similar luminosity dependence for all samples. The luminosity dependence of the correlation functions is the principal factor of the biasing phenomenon, as discussed by Kaiser [].
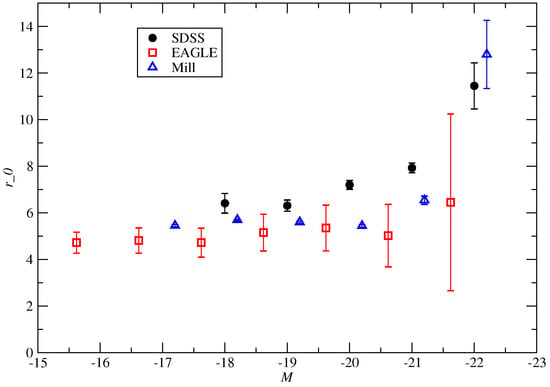
Figure 10.
Correlation length in Mpc of SDSS galaxies as a function of their absolute magnitudes. For comparison, we also show the correlation lengths of the EAGLE and Millennium simulations for various magnitude bins [].
SDSS and Millennium samples have sizes 500 Mpc, which is sufficiently large to consider them as representative for the whole cosmic web. Our analysis shows that correlation lengths of low and medium luminosity galaxies have the value Mpc, as predicted by Davis [], and contrary to the prediction by Pietronero et al. []. But notice that the correlation length of the EAGLE sample at low luminosities, Mpc, is smaller than for the SDSS and Millennium samples. This can be the sample volume effect as discussed by Pietronero et al. [], since the size of EAGLE samples is smaller than sizes of SDSS and Millennium samples.
A significant aspect of luminosity dependence is the observation that the correlation length remains nearly constant at low luminosities, . This phenomenon is evident in the SDSS.19 and SDSS.18 observational samples; however, it cannot be extrapolated to lower luminosities due to the lack of very faint galaxies in the luminosity-limited samples from SDSS. In the galaxy samples from the EAGLE and Millennium models, a gradual decline in with decreasing luminosity can be tracked down to very faint galaxies, with in the EAGLE sample and in the Millennium sample. Similar findings have been reported by Norberg et al. [] and Zehavi et al. [], indicating that the correlation lengths of low luminosity galaxies approach a specific limit as luminosity decreases. This trend suggests that very faint galaxies tend to follow the spatial distribution of their brighter counterparts, implying that faint galaxies often serve as satellites of more luminous galaxies.
6. Fractal Analysis of the Cosmic Web
To describe fractal properties of the cosmic web, most authors applied the correlation function and its derivatives, the structure function and the fractal dimension function. In this section, I describe how these functions can be used to analyze fractal properties of the cosmic web. In the fractal analysis, I use the same set of SDSS and model samples as discussed in the previous section. Model and SDSS samples have almost identical volumes; thus, the volume dependence of fractal properties is absent, and we see the luminosity (particle density limit) dependence of samples.
The natural estimator to determine the two-point spatial correlation function is given by the function Equation (6). Based on arguments discussed in Section 4.3, I use in the following analysis the structure function,
and its log–log gradient, the gradient function,
which I call the function.
Martínez and Saar [] defined the correlation dimension
where is the average of the structure function,
The parameter is related to the effective fractal dimension function of samples at mean separation of galaxies at r [,],
For our study, I prefer to use the local value of the structure function to define its gradient:
Notice that the fractal dimension is defined for a range of scales r; thus, the definition (11) is only an approximation of the true fractal dimension. Also notice that the function has the opposite sign compared to the parameter in the correlation function, Equation (1).
In the previous section, we examined the correlation functions of our model alongside the observed samples. Figure 11 illustrates the structure functions, represented as , while Figure 12 depicts the fractal dimension functions, denoted as . Notably, the last figure clearly indicates that the fractal dimension function features two distinct regions, with a transition occurring at a separation of approximately Mpc. This phenomenon has been previously identified by Zeldovich et al. [] and Zehavi et al. []. In the case of smaller mutual separations r, the correlation function effectively describes the distribution of matter within dark matter halos, whereas, at larger separations, it pertains to the distribution of the halos themselves.
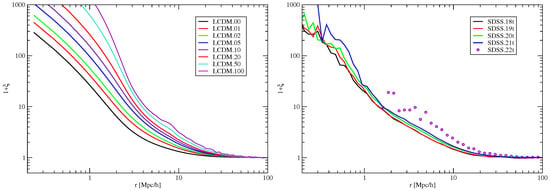
Figure 11.
The structural functions are defined as . The positioning of the panels remains consistent with what is illustrated in Figure 9 [].
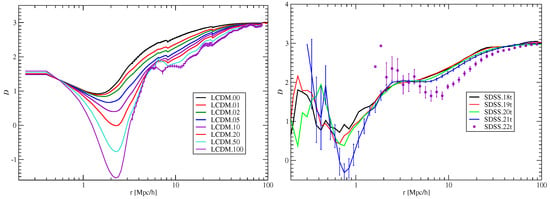
Figure 12.
The fractal dimension functions are expressed as . The positioning of the panels corresponds to that depicted in Figure 9. Error values are provided for a selection of representative samples [].
The fractal dimension function is a crucial concept in understanding the geometric properties of complex structures in cosmology, particularly in analyzing the distribution of particles in the Universe. In the context of CDM (Lambda Cold Dark Matter) samples, this function provides insights into how matter is distributed on various scales. The parameter represents a particle density limit, which is essential when selecting particles for analysis. By adjusting this limit, researchers can examine how different densities affect the fractal characteristics of the sample. The left panel of Figure 12 illustrates that the fractal dimension function for the CDM samples is influenced by the particle density threshold, , employed in the selection of particles for the sample. All CDM samples exhibit a uniform gradient function value of at a distance of Mpc, corresponding to a local fractal dimension of . At approximately 2 Mpc, the gradients reach a minimum that varies according to the particle density limit of the samples. The observed minimum in the gradients at around 2 Mpc suggests a transition in the distribution of particles. This may imply that there are significant changes in the spatial arrangement of matter at this scale, reflecting the complexities of cosmic structures. After this point, the increase in the fractal dimension function signifies a return to a more regular distribution, culminating in the expected maximum value of at the largest distances. This value signifies a uniform and isotropic distribution of matter, consistent with the assumptions of the CDM model at cosmological scales.
The equivalent values of the fractal dimension functions at r = 0.5 Mpc, succeeded by a minimum around Mpc, can be attributed to the internal structure of dark matter (DM) halos. The extent of this minimum is influenced by the particle density threshold . Notably, DM halos exhibit nearly uniform density profiles, which can be characterized by both the Navarro–Frenk–White (NFW) profile [] and the Einasto profile []:
In this context, represents the central density, while a denotes the semi-major axis of the equidensity ellipsoid. The characteristic radius is indicated by , and N serves as a structural parameter that allows for variations in the density profile’s shape. Research by Wang et al. [] demonstrated that the density profiles of halos across a diverse range of masses exhibit a consistent shape parameter value of , maintaining a similar form throughout a broad spectrum of halo masses. At the outer boundary of the halo, the gradient transitions to . It is important to highlight that the depth of the minimum in the CDM model sample aligns with the local value of the function; thus, interpreting this as the fractal dimension may not be entirely accurate.
Following the minimum observed at higher separation values r, the distribution of dark matter (DM) particles within filaments outside the halos becomes predominant. This shift contributes to an increase in the fractal dimension function. As illustrated in Figure 12 and Figure 2 of Zehavi et al. [], the transition from individual DM halos to the broader cosmic web occurs at approximately Mpc, which aligns well with the typical scales of DM halos. Thus, we can conclude that the correlation functions of CDM models uniquely characterize the internal structure of DM halos, as well as the fractal dimensional properties of the entire cosmic web.
Figure 12 illustrates that the fractal dimension functions of SDSS galaxy samples closely resemble those of the CDM sample, albeit with significantly greater scatter observed at small separations. The minor discrepancies in shape indicate that the internal structures of dark matter (DM) halos in the CDM models are distinct from those found in actual and simulated galaxy clusters. In the CDM model samples, all DM particles with density values are included, allowing for a comprehensive view of the density profile of the halos extending to their outer edges. Conversely, in real galaxy samples, only galaxies that exceed the selection threshold in brightness are represented. Consequently, in the most luminous galaxy samples, it is common for only one or a few of the brightest galaxies to fall within the observable range, leaving the true internal structures of the clusters, up to their outer boundaries, obscured.
7. Comparing Angular and Spatial Distributions of Galaxies
Redshifts are known to be influenced by the local movements of galaxies within clusters, a phenomenon referred to as the Finger-of-God (FoG) effect. Additionally, galaxies and clusters tend to move towards gravitational attractors, as described by the Kaiser effect []. To mitigate the impact of the Kaiser effect when computing correlation functions, Davis and Peebles [] recommended utilizing galaxy position and velocity data independently, as detailed in Section 3.1. The inversion described in Equation (5) presupposes that the spatial three-dimensional (3D) and projected two-dimensional (2D) density fields exhibit statistical similarity. This premise has been widely accepted within the astronomical community, and the application of Equations (4) and (5) for the calculation of 3D correlation functions has become a standard practice.
A visual assessment of the 2D and 3D density fields, illustrated in Figure 3 and Figure 8, reveals significant distinctions between the two. The 3D density field is primarily characterized by the filamentary structure of the cosmic web, while the 2D field exhibits a more random distribution. Consequently, the accuracy of the standard method for calculating correlation functions (CFs) in this context remains uncertain. To establish the relationship between the 2D and 3D CFs, it is essential to compare these functions using the same dataset. The findings from this comparison have been documented by Einasto et al. [] and are presented in this work.
7.1. Relation Between 2D and 3D Correlation Functions
To compare 2D and 3D correlation functions, Einasto et al. [] constructed the 2D density fields on a grid by integrating the 3D field,
In the next phase of their research, the authors segmented the cubic sample into n sequentially arranged 2D sheets, each measuring Mpc. Here, represents the thickness of each individual sheet, while n takes values of 1, 2, 4, and so forth, up to 2048, indicating the total number of sheets created. For each value of n, the authors computed the 2D correlation functions (CFs) for all n sheets and subsequently determined the average CF corresponding to each n.The sheet corresponding to encompasses the entire sample along the z-direction, with a thickness of Mpc. For , the thickness reduces to Mpc, while for , the thickness is Mpc. Through this methodology, the authors were able to calculate 2D correlation functions across a variety of particle density thresholds and 2D sample thickness L within the context of the CDM model, as well as for different magnitude limits derived from the Millennium sample referenced by Springel et al. [].
Two-dimensional correlation functions (CFs) are influenced by two key parameters: the thickness of the sheets, defined as Mpc, and the particle density threshold for CDM samples, denoted as , or the magnitude limit for Millennium samples. The analysis reveals that the 2D CFs exhibit a luminosity dependence that closely mirrors that of 3D CFs. This indicates that the correlation functions of 2D samples retain the luminosity dependence characteristic of their 3D counterparts. As luminosity increases, the amplitude of the correlation functions also rises, illustrating the well-established biasing effect described by Kaiser [].
In our study, a key aspect is the relationship between the thickness of the samples and the 2D correlation functions. Figure 13 illustrates these correlation functions for a fixed particle density limit of in LCDM.10 samples, as well as for Millennium samples Mill.20.5 with a luminosity threshold of . These limits roughly align with galaxies. In Figure 13, we present the 2D correlation functions across various sample thicknesses, represented as Mpc, with the number of sheets ranging from to . The case with reflects the total sample thickness of and exhibits the lowest amplitude. Conversely, the final case corresponds to the average 2D correlation function of the thinnest sheets, each measuring Mpc. Notably, the 2D correlation functions for the thinnest samples, where , closely resemble the 3D correlation functions indicated by the dotted lines in Figure 13. This finding suggests that the structural information regarding dark matter halos and the overall cosmic web is comprehensively retained in the thin 2D correlation functions.
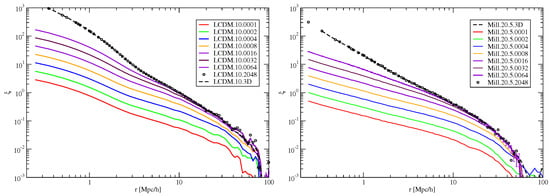
Figure 13.
(Left): The two-dimensional correlation functions (CFs) of the CDM model are presented with a particle density threshold of , analyzed across various thicknesses of 2D samples. (Right): The two-dimensional CFs of the Millennium samples, constrained by a magnitude limit of , are displayed in real space. For our analysis, we define pair separations perpendicular to the line of sight as . The sample thicknesses are represented by the parameter L. Different thicknesses of the 2D samples are denoted by lines of distinct colors. For reference, we include dotted lines representing the three-dimensional functions for samples with the same density threshold of and magnitude limit of [].
The relationship between luminosity and correlation functions, as discussed in this and the preceding section, is well established. This analysis reveals that the amplitudes of two-dimensional correlation functions (2D CFs) are also affected by an additional parameter: the sample thickness, denoted as L. The variation in the amplitudes of 2D CFs with respect to sample thickness is a consequence of the spatial configuration of the cosmic web. This cosmic web comprises galaxies arranged in a complex filamentary structure, leaving significant regions of space unoccupied by galaxies. In projected views, clusters and filaments occupy these voids, which varies with sample thickness. Consequently, the patterns of the cosmic web in two dimensions differ qualitatively from those in three dimensions, with the disparity becoming more pronounced as the thickness of the 2D sheets increases.
7.2. Fractal Analysis of the 2D Cosmic Web
In Figure 14, we illustrate the gradient functions for the CDM model, utilizing a particle density limit of , alongside the Millennium samples constrained by a magnitude limit of . The analysis employs pair separations that are perpendicular to the line of sight, defined as . The parameter representing the thickness of the samples, denoted as L, is also incorporated. Different thicknesses of the 2D samples are indicated by lines of varying colors. For comparative purposes, we include 3D functions represented by dotted lines for samples with the same density and magnitude limits of and , respectively. Additionally, error bars are provided for the 2D samples where .
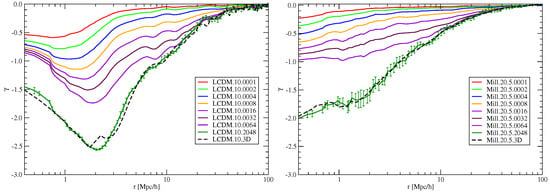
Figure 14.
(Left): Two-dimensional gradient functions of the CDM model, utilizing a particle density threshold of , are presented for various thicknesses of 2D samples. (Right): Two-dimensional gradient functions of Millennium samples, constrained by a magnitude limit of , are displayed in real space [].
The comparison of the gradient functions of two-dimensional samples with the fractal dimension functions of three-dimensional samples, as illustrated in Figure 12, indicates that the fine structure information at small scales is largely retained in the two-dimensional samples derived from the CDM model. Conversely, in the Millennium samples, the details regarding the internal structure of clusters are diminished in the two-dimensional correlation functions (CFs). At the luminosity threshold of , the clusters are comprised of only a limited number of bright galaxies. The amplitudes of the two-dimensional CFs in the Millennium samples are relatively low, leading to the dominance of the first constant term in the gradient function . As depicted in the right panel of Figure 14, for thicker samples, the slope of the two-dimensional CF exhibits a gradual variation over an extensive range of separations, specifically for Mpc. This behavior supports the established observation that the two-dimensional CF can be effectively modeled using a simple power-law function, as demonstrated by Groth and Peebles [], Davis and Peebles [], and Maddox et al. []. Additionally, Figure 14 illustrates that the value of the two-dimensional gradient function is influenced by the thickness of the samples. When the thickness ranges from 64 to 128 Mpc, the gradient achieves a value of approximately at shorter distances, smoothly approaching at Mpc. This finding aligns with the results reported by Groth and Peebles [], Davis and Peebles [], and Maddox et al. [] concerning the angular correlation function.
The previous examination of the correlation study conducted by Groth and Peebles [] and Peebles [] revealed a flat profile of 2D correlation functions across an extensive separation range of Mpc. This analysis suggests that the broad range observed is primarily due to the 2D correlation functions’ insensitivity to the presence of halos (clusters), rendering the actual structure at smaller separations undetectable. Additionally, the amplitude of the 2D correlation functions plays a significant role. As illustrated in Figure 13, the amplitude of the 2D correlation functions is notably lower than that of the 3D correlation functions, which varies with the thickness of the 2D samples. According to Norberg et al. [] and Zehavi et al. [], the correlation lengths for the faintest galaxies were measured at approximately Mpc, a value interpreted as representative of 3D samples. Figure 13 suggests that for these faint galaxies, the actual amplitude of the 3D correlation functions is greater, resulting in true 3D correlation lengths near 6 Mpc. This finding aligns closely with our measurements of the correlation lengths of SDSS samples, as depicted in Figure 10.
8. Structure and Evolution of Cosmic Web from Combined Spatial and Velocity Data
The correlation function used in the study of fractal properties of the cosmic web uses only spatial data on the distribution of galaxies and dark matter. Modern numerical simulations and observational data allow the use of all phase–space data—spatial positions and velocities of particles and galaxies. In this section, I discuss the structure and evolution of the cosmic web using full phase–space data. Such combined data are very useful to study the hierarchy of the cosmic web in low-density regions—voids.
8.1. Void Hierarchy
One aspect of the hierarchical structure of the cosmic web is the hierarchy of voids. Already early studies showed that diameters of voids have a large scatter, from a few megaparsecs to hundred megaparsecs (Kirshner et al. [], Pan et al. [], Sutter et al. [], Nadathur and Hotchkiss []). Sheth and van de Weygaert [] studied the formation and evolution of voids, using numerical simulations of the evolution of the cosmic web. The authors showed that voids have a remarkable hierarchical structure—voids are filled with a complex web of tenuous filaments and low-mass haloes. During the evolution, larger voids grow by the mergers of smaller voids, which is analogous to how massive clusters form by merging less massive clusters and groups. Small voids, which are located on overdensity regions, disappear as the overdensity collapses around them.
In their study, Aragon-Calvo and Szalay [] conducted a thorough examination of the hierarchical organization of cosmic voids through advanced numerical simulations. The large-scale fluctuations responsible for the formation of voids encompass smaller fluctuations that develop within regions resembling a locally low-density Universe. This phenomenon is evident at every level within the void hierarchy, as subvoids themselves harbor even smaller sub-subvoids, as illustrated in Figure 15. This observation highlights the hierarchical nature of the cosmic web, where low-density filamentary structures on smaller scales exhibit similarities to those on larger scales.
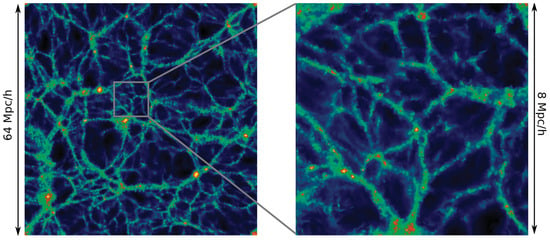
Figure 15.
The hierarchy of structure within the cosmic web is illustrated in the provided visuals. The left panel displays the density field across a narrow slice of a 64 Mpc simulation based on the CDM cosmology model. Meanwhile, the right panel focuses on a specific highlighted area within that slice. The density field for this zoomed-in region was derived from a high-resolution resimulation featuring , centered in the void region [].
Cosmic structures of varying scales can be analyzed by applying smoothing techniques to density fields with different smoothing parameters. The original density field retains all intricate details, while smoothing at a scale of 2 Mpc emphasizes structures characteristic of galaxy groups. In contrast, a smoothing scale of 4 Mpc brings out features such as the cores of superclusters and large voids. The top panels of Figure 16 illustrate the original density field at redshift (left panel), alongside its smoothed versions at 2 and 4 Mpc (center and right panels, respectively). By comparing the panels with different smoothing scales, we can observe the hierarchical arrangement of filaments and voids. To capture the finer details of this cosmic web, the boundaries of voids were identified using the SpineWeb method, which is depicted in the bottom panels of Figure 16. The SpineWeb method, as described by Aragon-Calvo and Szalay [], involves calculating the density and velocity fields, along with their respective gradients.
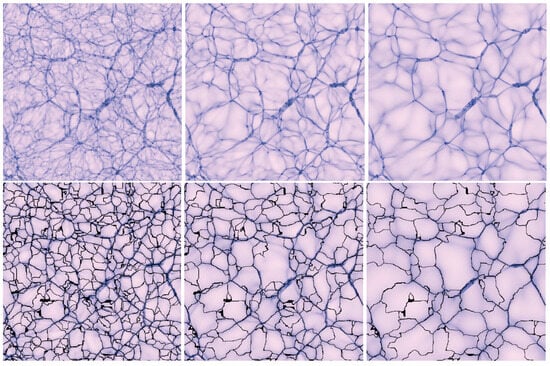
Figure 16.
(Top): Density field across a thin slice of the simulation box at for three cases: original field (left panel), after smoothing with 2 Mpc (central panel), and with 4 Mpc (right panel). (Bottom): Hierarchical cosmic web spine superimposed to its corresponding density field for the bottom, middle, and top levels (left, central, and right panels, respectively) [].
It is widely recognized that galaxies exclusively develop within dark matter halos, as void regions lack sufficient density for galaxy formation. Figure 17 illustrates the variations in the distribution of simulated galaxies (dark matter halos) alongside the density and velocity fields. The top-left panel displays a slice of the density field, highlighting halos within a 2 Mpc thick section. These halos are situated in high-density areas of the cosmic web, including filaments and clusters. The process of galaxy formation occurs in two stages: initially, dark matter aggregates to form halos, followed by the emergence of galaxies within these halos []. As depicted in Figure 17, halos containing galaxies occupy only a minor portion of the overall spatial volume.
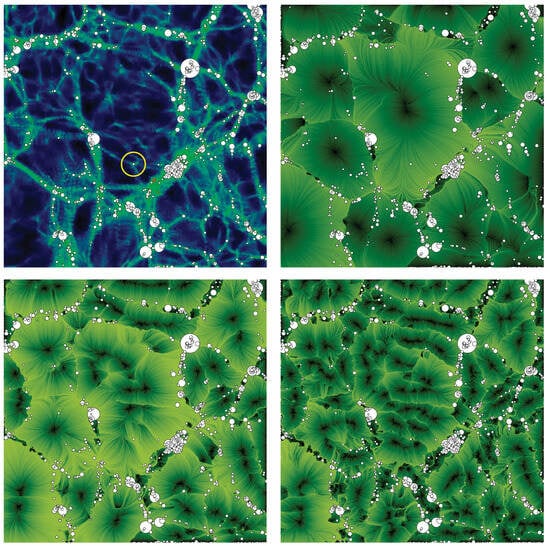
Figure 17.
Dark matter haloes superimposed on the density and velocity fields. The (top-left panel) shows a slice of the density field and all the FoF haloes closer than 1 Mpc from the slice. The residual velocity field is shown at scales 4, 2, and 1 Mpc in the (top-right), (bottom-left), and (bottom-right panel), respectively. We show the same FoF haloes as in the density field slice [].
The velocity fields depicted in the top right and bottom panels of Figure 17 are presented at smoothing scales of 4, 2, and 1 Mpc, alongside the same halos illustrated in the top left panel. This figure illustrates the hierarchy of voids nested within larger voids, where the largest voids are subdivided into progressively smaller ones. The local velocity fields in regions surrounding halos and voids exhibit significant differences. In halo regions, the velocity field is characterized by turbulence, which facilitates the condensation of matter into halos and subhalos. Conversely, at the larger smoothing scales of 4 and 2 Mpc, the velocity field surrounding the void halo is predominantly laminar and directed toward the halos. At the smaller scale of 1 Mpc, the velocity field approaches the halo from multiple directions. It is important to note that this intricate structure observed in low-density regions is composed of a sparse field of dark matter filaments and baryonic gaseous matter.
8.2. Evolution of Galaxies in the Void Hierarchy
Most galaxy formation models successfully replicate a diverse array of observations and shed light on the physical processes taking place within halos as distinct entities []. In reality, galaxies develop within the large-scale environment of the cosmic web. To comprehend how the cosmic environment influences galaxy characteristics, Aragon Calvo et al. [] introduced the Cosmic Web Detachment (CWD) model. This model integrates multiple mechanisms that inhibit star formation and illustrates how galaxies acquire star-forming gas in their formative stages through a network of primordial filaments, as outlined in the preceding section.
The development and progression of hierarchical structures within the cosmic web are illustrated in Figure 18. The upper panels depict the density and velocity fields of the cosmic web at an early epoch, specifically at redshift , while the lower panels represent the current epoch at . The left panels showcase density fields spanning 32 Mpc, the central panels display the corresponding velocity fields, and the right panels provide a cross section of these fields. During the early epoch, the velocity field exhibits coherence, with star-forming cold gas being accreted through primordial coherent filamentary streams. Star formation occurs in conjunction with the accretion of cold gas and ceases once the gas supply is depleted. In contrast, at later epochs, the velocity field surrounding halos—indicated by red and white circles—becomes highly chaotic.
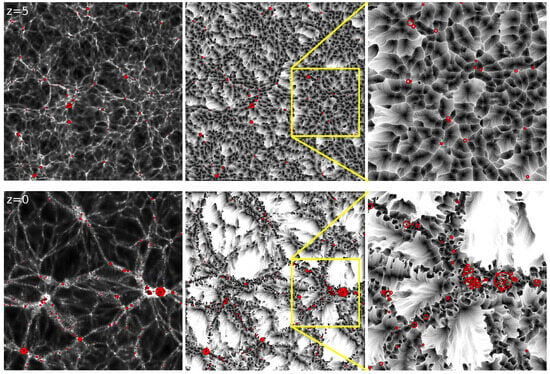
Figure 18.
Coherent vs. chaotic velocity field around halos. For explanation see text [].
9. Scale of Homogeneity
A key question in the fractal analysis of the cosmic web centers around the scale of homogeneity, where opinions among various authors diverge significantly. The Anglo-American school, as discussed in Section 3.1, has predominantly focused on utilizing only 2D data for their studies. According to the comprehensive findings of Maddox et al. [], the fractal nature of galaxy distribution appears to be applicable within the distance range of 10 kpc Mpc, exhibiting a fractal dimension of approximately . This upper limit has been regarded as the scale of homogeneity.
The Italian School, as noted by Pietronero [] and Sylos Labini et al. [], established that the fractal nature of galaxy distribution, characterized by a fractal dimension of approximately , holds true from small scales up to the most extensive scales examined for visible matter. The most comprehensive samples studied by Sylos Labini et al. [] encompass radio galaxies and quasars, spanning a magnitude range of .
One method for determining the limit of a fractal structure involves calculating the fractal dimension function from the gradient function, as outlined in Section 6. The CDM and SDSS fractal dimension functions, illustrated in Figure 12, converge towards the limit of , at a distance of approximately Mpc, which represents just 1/5 of the sample size. Pan and Coles [] examined the spatial distribution of IRAS sources from the PSC catalog and derived fractal dimensions across two distance ranges: Mpc and Mpc. In the first range, the fractal dimension fluctuated between , while in the second range, it remained constant at . Sarkar et al. [] applied multifractal analysis to assess the scale of homogeneity within the range of 60 to 70 Mpc, utilizing SDSS DR6 spectroscopic galaxy data. Furthermore, Scrimgeour et al. [] conducted a spectroscopic survey of blue galaxies within a cosmic volume of approximately 1 Gpc and established a lower limit for the fractal dimension of on scales ranging from about 80 Mpc to ∼300 Mpc, with a confidence level of 99.99 percent.
One approach to determining the scale of homogeneity is to examine the structures of the largest astronomical objects, such as voids and superclusters. The recent catalog of superclusters from the SDSS survey compiled by Liivamägi et al. [] includes objects identified using both adaptive and fixed density thresholds. The largest superclusters reach sizes of up to 120 Mpc for the primary galaxy superclusters and 200 Mpc for the LRG superclusters. Notably, the largest superclusters recorded in the Sankhyayan et al. [] catalog of SDSS superclusters also measure 200 Mpc.
Independent insights into the structure of the cosmic web are derived from velocity data. In their analysis, Courtois et al. [] examined the velocity field utilizing cosmic flow CF4 peculiar velocities. The research revealed that the bulk flow amplitude approaches zero at greater distances, suggesting an increasing homogeneity of the Universe. Within a range of 150 Mpc, the measured bulk flow is km/s. This indicates that the dynamic scale of homogeneity has not yet been attained within the 200–300 Mpc interval from the observer, signifying that the local Universe continues to display notable fluctuations in mass distribution and the dynamics of galaxy movements. Additionally, ref. [] investigated a sample of quasars from the SDSS survey, discovering that this sample deviates from a random Poisson distribution. The authors concluded that the concept of a scale of homogeneity is not applicable. Instead, homogeneity is achieved only asymptotically as the observational scale increases, with no inherent characteristic scale in the Universe beyond which it can be considered homogeneous. Nevertheless, at scales exceeding 300 Mpc, the distribution of quasars approaches that of a homogeneous sample.
10. Summary and Outlook
The cosmic web is a complex geometric pattern. One of the aspects of the structure of the cosmic web is its fractal nature, which was recognized already in the introduction of the fractal concept by Mandelbrot [,]. In this review, I discussed various aspects of fractal properties of the cosmic web from an observational point of view. Our discussion can be summarized in following points.
Fractal properties from two-dimensional data. The first application of the fractal character of the distribution of galaxies was made by Soneira and Peebles [] in the construction of the angular distribution of galaxies in a fractal way to mimic the Shane and Wirtanen [] distribution of galaxies, as displayed in Figure 3. A deeper 2D distribution of APM galaxies was expressed by Maddox et al. [] by a power-law correlation function, which has a constant slope over the range of angular distances, degrees. This was interpreted as a hint that the power-law correlation function is valid in the range of separations 10 kpc Mpc [].
Determining fractal dimension. As discussed in Section 4.3, Pietronero [] noticed that the correlation function is normalized to a Poissonian distribution and is forced to vanish at large scales. For this reason, it is not suited for measuring large-scale homogeneity. To measure the fractal dimension, instead of the correlation function, its derivative, the structure function, , and its log–log gradient, , should be used. The fractal dimension can be found from the gradient as follows: . In our analysis, we have used this definition of the fractal dimension.
Fractal properties from three-dimensional data. Essential fractal properties of the cosmic web are displayed in the fractal dimension function, Figure 12. The analysis was based on a CDM model of size 512 Mpc, and a SDSS sample of similar volume. The fractal dimension function of both samples has two well separated regions: on small separations, Mpc, the function characterizes the distribution of particles/galaxies in halos, and on larger separations, it characterizes the distribution of particles/galaxies in filaments. Fractal dimension functions depend on the magnitude (particle density) limits of samples. The minimum of the dimension function at scale Mpc is deeper for samples of luminous galaxies. However, the depth of the minimum of the fractal dimension function is exaggerated, since it is based on the local value of the gradient of the structure function, .
The gradient function from 2D data, presented in Figure 14, depends on the depth of the 2D sample. Very thin 2D samples behave similar to 3D samples. With increasing thickness of the samples, the information on the distribution of particles/galaxies in halos is gradually erased. This effect is very strong for SDSS and Millennium galaxy samples. Analyses of the relation between 2D and 3D correlation functions, presented in Section 7, shows that, in 2D distribution of galaxies, the information on the distribution of galaxies in clusters has been erased, and the division of the correlation function into two regions, halos and filaments, is not seen.
Fractal properties from velocity data. Velocity data yield essential additional information on the structure of the cosmic web. The combination of spatial and velocity data shows that the internal structure of voids is very complex. Inside voids there exist subvoids, sub-subvoids, etc., and the fractal character of the dark matter distribution continues to small scales.
Scale of homogeneity. Early 2D data emphasized that the fractal character of the distribution of galaxies extends only to Mpc and that, beyond this limit, the distribution of galaxies is homogeneous. Later analyses have shown that the correlation function is not suited to find the limit of the fractal nature of the galaxy distribution; instead, the structure function can be applied. The scale of homogeneity has been studied by many authors, who found that the local Universe still has some fluctuations in the distribution of galaxies on distance Mpc. Homogeneity is only achieved asymptotically, as the scale of observation increases.
To conclude, we can say that the contemporary understanding of the fractal properties of the Universe includes the best aspects of both the Anglo-American and Italian approaches.
Funding
This work was supported by Tartu Observatory, University of Tartu.
Data Availability Statement
No new data were created or analyzed in this study. Data sharing is not applicable to this article.
Acknowledgments
Our special thanks to the anonymous referees for stimulating suggestions that greatly improved the paper and to colleagues in Tartu Observatory for discussions. Figures are reproduced by permission of the AAS, Monthly Notices of the Royal Astronomical Society, and EDPsciences. Permission is granted for the purpose of reuse in “Fractal properties of the cosmic web” and does not extend to any other forms of distribution or reproduction beyond what is customary for the journal’s dissemination practices.
Conflicts of Interest
The author declares no conflicts of interest. The funders had no role in the design of the study; in the collection, analyses, or interpretation of data; in the writing of the manuscript; or in the decision to publish the results.
References
- Mandelbrot, B.B. The Fractal Geometry of Nature; Echo Point Books & Media, LLC: Brattleboro, VT, USA, 1977. [Google Scholar]
- Charlier, C.V.L. How an infinite world may be built up. Medd. Fran Lunds Astron. Obs. Ser. I 1922, 98, 1–37. [Google Scholar]
- Carpenter, E.F. Some Characteristics of Associated Galaxies. I. a. Density Restriction in the Metagalaxy. Astrophys. J. 1938, 88, 344. [Google Scholar] [CrossRef]
- Kiang, T. On the clustering of rich clusters of galaxies. Mon. Not. R. Astron. Soc. 1967, 135, 1–22. [Google Scholar] [CrossRef]
- Wertz, J.R. Newtonian Hierarchical Cosmology. Ph.D. Thesis, University of Texas, Austin, TX, USA, 1970. [Google Scholar]
- Wertz, J.R. A Newtonian Big-Bang Hierarchical Cosmological Model. Astrophys. J. 1971, 164, 227. [Google Scholar] [CrossRef]
- Haggerty, M.J.; Wertz, J.R. On the redshift-magnituderelation in hierarchical cosmologies. Mon. Not. R. Astron. Soc. 1972, 155, 495. [Google Scholar] [CrossRef]
- de Vaucouleurs, G. The Case for a Hierarchical Cosmology. Science 1970, 167, 1203–1213. [Google Scholar] [CrossRef]
- de Vaucouleurs, G. The Large-Scale Distribution of Galaxies and Clusters of Galaxies. Publ. Astron. Soc. Pacif. 1971, 83, 113. [Google Scholar] [CrossRef]
- Pietronero, L. The fractal structure of the universe: Correlations of galaxies and clusters and the average mass density. Phys. A Stat. Mech. Its Appl. 1987, 144, 257–284. [Google Scholar] [CrossRef]
- Peebles, P.J.E. Cosmology’s Century: An Inside History of our Modern Understanding of the Universe; Princeton University Press: Princeton, NJ, USA, 2020. [Google Scholar] [CrossRef]
- Peebles, P.J.E. The Whole Truth. A Cosmologist’s Reflections on the Search for Objective Reality; Princeton University Press: Princeton, NJ, USA, 2022. [Google Scholar]
- Einasto, J. Dark Matter and Cosmic Web Story, 2nd ed.; World Scientific: Singapore, 2024. [Google Scholar]
- Starobinsky, A.A. A new type of isotropic cosmological models without singularity. Phys. Lett. B 1980, 91, 99–102. [Google Scholar] [CrossRef]
- Guth, A.H. Inflationary universe: A possible solution to the horizon and flatness problems. Phys. Rev. D 1981, 23, 347–356. [Google Scholar] [CrossRef]
- Linde, A.D. Chaotic inflation. Phys. Lett. B 1983, 129, 177–181. [Google Scholar] [CrossRef]
- Linde, A. Hybrid inflation. Phys. Rev. D 1994, 49, 748–754. [Google Scholar] [CrossRef]
- Linde, A.; Riotto, A. Hybrid inflation in supergravity. Phys. Rev. D 1997, 56, R1841–R1844. [Google Scholar] [CrossRef]
- Linde, A. Particle Physics and Inflationary Cosmology. arXiv 2005, arXiv:hep-th/0503203. [Google Scholar] [CrossRef]
- Nambu, Y.; Sasaki, M. Stochastic approach to chaotic inflation and the distribution of universes. Phys. Lett. B 1989, 219, 240–246. [Google Scholar] [CrossRef]
- Ambjørn, J.; Jurkiewicz, J.; Loll, R. Reconstructing the Universe. Phys. Rev. D 2005, 72, 064014. [Google Scholar] [CrossRef]
- Calcagni, G. Quantum field theory, gravity and cosmology in a fractal universe. J. High Energy Phys. 2010, 2010, 120. [Google Scholar] [CrossRef]
- Calcagni, G. Fractal Universe and Quantum Gravity. Phys. Rev. Lett. 2010, 104, 251301. [Google Scholar] [CrossRef] [PubMed]
- Einstein, A. Die Grundlage der allgemeinen Relativitätstheorie. Ann. Der Phys. 1916, 354, 769–822. [Google Scholar] [CrossRef]
- Friedmann, A. Über die Möglichkeit einer Welt mit konstanter negativer Krümmung des Raumes. Z. Phys. 1924, 21, 326–332. [Google Scholar] [CrossRef]
- Lemaître, G. Un Univers homogène de masse constante et de rayon croissant rendant compte de la vitesse radiale des nébuleuses extra-galactiques. Ann. Soc. Scietifique Brux. 1927, 47, 49–59. [Google Scholar]
- Hoyle, F. A New Model for the Expanding Universe. Mon. Not. R. Astron. Soc. 1948, 108, 372–382. [Google Scholar] [CrossRef]
- Hoyle, F. The synthesis of the elements from hydrogen. Mon. Not. R. Astron. Soc. 1946, 106, 343. [Google Scholar] [CrossRef]
- Cyburt, R.H.; Fields, B.D.; Olive, K.A. Primordial nucleosynthesis in light of WMAP. Phys. Lett. B 2003, 567, 227–234. [Google Scholar] [CrossRef]
- Burbidge, E.M.; Burbidge, G.R.; Fowler, W.A.; Hoyle, F. Synthesis of the Elements in Stars. Rev. Mod. Phys. 1957, 29, 547–650. [Google Scholar] [CrossRef]
- Adame, A.G.; Aguilar, J.; Ahlen, S.; Alam, S.; Alexander, D.M.; Alvarez, M.; Alves, O.; Anand, A.; Andrade, U.; Armengaud, E.; et al. DESI 2024 VI: Cosmological constraints from the measurements of baryon acoustic oscillations. J. Cosmol. Astropart. Phys. 2025, 2025, 021. [Google Scholar] [CrossRef]
- Einasto, J.; Hütsi, G.; Szapudi, I.; Tenjes, P. Spinning the Cosmic Web; World Scientific: Singapore, 2025. [Google Scholar]
- Sunyaev, R.A.; Chluba, J. Signals from the epoch of cosmological recombination (Karl Schwarzschild Award Lecture 2008). Astron. Nachrichten 2009, 330, 657. [Google Scholar] [CrossRef]
- Planck Collaboration; Aghanim, N.; Akrami, Y.; Ashdown, M.; Aumont, J.; Baccigalupi, C.; Ballardini, M.; Banday, A.J.; Barreiro, R.B.; Bartolo, N.; et al. Planck 2018 results. VI. Cosmological parameters. Astron. Astrophys. 2020, 641, A6. [Google Scholar] [CrossRef]
- Einasto, J.; Kaasik, A.; Saar, E. Dynamic Evidence on Massive coronas of galaxies. Nature 1974, 250, 309–310. [Google Scholar] [CrossRef]
- Ostriker, J.P.; Peebles, P.J.E.; Yahil, A. The size and mass of galaxies, and the mass of the universe. Astrophys. J. Lett. 1974, 193, L1–L4. [Google Scholar] [CrossRef]
- Perlmutter, S.; Aldering, G.; Goldhaber, G.; Knop, R.A.; Nugent, P.; Castro, P.G.; Deustua, S.; Fabbro, S.; Goobar, A.; Groom, D.E.; et al. Measurements of Omega and Lambda from 42 High-Redshift Supernovae. Astrophys. J. 1999, 517, 565–586. [Google Scholar] [CrossRef]
- Riess, A.G.; Filippenko, A.V.; Challis, P.; Clocchiatti, A.; Diercks, A.; Garnavich, P.M.; Gilliland, R.L.; Hogan, C.J.; Jha, S.; Kirshner, R.P.; et al. Observational Evidence from Supernovae for an Accelerating Universe and a Cosmological Constant. Astron. J. 1998, 116, 1009–1038. [Google Scholar] [CrossRef]
- Komatsu, E.; Smith, K.M.; Dunkley, J.; Bennett, C.L.; Gold, B.; Hinshaw, G.; Jarosik, N.; Larson, D.; Nolta, M.R.; Page, L.; et al. Seven-year Wilkinson Microwave Anisotropy Probe (WMAP) Observations: Cosmological Interpretation. Astrophys. J. Suppl. 2011, 192, 18. [Google Scholar] [CrossRef]
- Di Valentino, E.; Levi Said, J.; Riess, A.; Pollo, A.; Poulin, V.; Gómez-Valent, A.; Weltman, A.; Palmese, A.; Huang, C.D.; van de Bruck, C.; et al. The CosmoVerse White Paper: Addressing observational tensions in cosmology with systematics and fundamental physics. arXiv 2025, arXiv:2504.01669. [Google Scholar] [CrossRef]
- Sankhyayan, S.; Bagchi, J.; Tempel, E.; More, S.; Einasto, M.; Dabhade, P.; Raychaudhury, S.; Athreya, R.; Heinämäki, P. Identification of Superclusters and Their Properties in the Sloan Digital Sky Survey Using the WHL Cluster Catalog. Astrophys. J. 2023, 958, 62. [Google Scholar] [CrossRef]
- York, D.G.; Adelman, J.; Anderson, J.E., Jr.; Anderson, S.F.; Annis, J.; Bahcall, N.A.; Bakken, J.A.; Barkhouser, R.; Bastian, S.; Berman, E.; et al. The Sloan Digital Sky Survey: Technical Summary. Astron. J. 2000, 120, 1579–1587. [Google Scholar] [CrossRef]
- Shane, C.; Wirtanen, C. The distribution of galaxies. Publ. Lick Obs. 1967, 22. [Google Scholar] [CrossRef]
- Seldner, M.; Siebers, B.; Groth, E.J.; Peebles, P.J.E. New reduction of the Lick catalog of galaxies. Astron. J. 1977, 82, 249–256. [Google Scholar] [CrossRef]
- Soneira, R.M.; Peebles, P.J.E. A computer model universe—Simulation of the nature of the galaxy distribution in the Lick catalog. Astron. J. 1978, 83, 845–849. [Google Scholar] [CrossRef]
- Peebles, P.J.E. Statistical Analysis of Catalogs of Extragalactic Objects. I. Theory. Astrophys. J. 1973, 185, 413–440. [Google Scholar] [CrossRef]
- Hauser, M.G.; Peebles, P.J.E. Statistical Analysis of Catalogs of Extragalactic Objects. II. the Abell Catalog of Rich Clusters. Astrophys. J. 1973, 185, 757–786. [Google Scholar] [CrossRef]
- Peebles, P.J.E.; Hauser, M.G. Statistical Analysis of Catalogs of Extragalactic Objects. III. The Shane-Wirtanen and Zwicky Catalogs. Astrophys. J. Suppl. 1974, 28, 19. [Google Scholar] [CrossRef]
- Peebles, P.J.E. Statistical Analysis of Catalogs of Extragalactic Objects. IV. Cross-Correlation of the Abell and Shane-Wirtanen Catalogs. Astrophys. J. Suppl. 1974, 28, 37. [Google Scholar] [CrossRef]
- Peebles, P.J.E.; Groth, E.J. Statistical analysis of catalogs of extragalactic objects. V—Three-point correlation function for the galaxy distribution in the Zwicky catalog. Astrophys. J. 1975, 196, 1–11. [Google Scholar] [CrossRef]
- Peebles, P.J.E. Statistical analysis of catalogs of extragalactic objects. VI—The galaxy distribution in the Jagellonian field. Astrophys. J. 1975, 196, 647–651. [Google Scholar] [CrossRef]
- Groth, E.J.; Peebles, P.J.E. Statistical analysis of catalogs of extragalactic objects. VII. Two- and three-point correlation functions for the high-resolution Shane-Wirtanen catalog of galaxies. Astrophys. J. 1977, 217, 385–405. [Google Scholar] [CrossRef]
- Maddox, S.J.; Efstathiou, G.; Sutherland, W.J.; Loveday, J. Galaxy correlations on large scales. Mon. Not. R. Astron. Soc. 1990, 242, 43. [Google Scholar] [CrossRef]
- Peebles, P.J.E. The Galaxy and Mass N-Point Correlation Functions: A Blast from the Past. Astron. Soc. Pac. Conf. Ser. 2001, 252, 201. [Google Scholar]
- Longair, M.S.; Einasto, J. (Eds.) The Large Scale Structure of the Universe; Proceedings of the Symposium, Tallin, Estonian, USSR, September 12–16, 1977; IAU Symposium. 1978, Volume 79. Available online: https://link.springer.com/book/10.1007/978-94-009-9843-8 (accessed on 21 August 2025).
- Jõeveer, M.; Einasto, J.; Tago, E. The cell structure of the Universe. Tartu Astr. Obs. Preprint 1977, 79, 241. [Google Scholar]
- Tully, R.B.; Fisher, J.R. A Tour of the Local Supercluster. In Large Scale Structures in the Universe; Longair, M.S., Einasto, J., Eds.; Symposium—International Astronomical Union; Cambridge University Press: Cambridge, UK, 1978; Volume 79, pp. 214–216. Available online: https://ui.adsabs.harvard.edu/abs/1978IAUS...79..214T/abstract (accessed on 21 August 2025).
- Gregory, S.A.; Thompson, L.A. The Coma/A1367 supercluster and its environs. Astrophys. J. 1978, 222, 784–799. [Google Scholar] [CrossRef]
- Zeldovich, Y.B. Gravitational instability: An approximate theory for large density perturbations. Astron. Astrophys. 1970, 5, 84–89. [Google Scholar]
- Jõeveer, M.; Einasto, J. Has the universe the cell structure. In Large Scale Structures in the Universe; Longair, M.S., Einasto, J., Eds.; IAU Symposium; Cambridge University Press: Cambridge, UK, 1978; Volume 79, pp. 241–250. Available online: https://link.springer.com/chapter/10.1007/978-94-009-9843-8_25 (accessed on 21 August 2025).
- Doroshkevich, A.G.; Kotok, E.V.; Poliudov, A.N.; Shandarin, S.F.; Sigov, I.S.; Novikov, I.D. Two-dimensional simulation of the gravitational system dynamics and formation of the large-scale structure of the universe. Mon. Not. R. Astron. Soc. 1980, 192, 321–337. [Google Scholar]
- Bond, J.R.; Kofman, L.; Pogosyan, D. How filaments of galaxies are woven into the cosmic web. Nature 1996, 380, 603–606. [Google Scholar] [CrossRef]
- Bahcall, N.A.; Soneira, R.M. The spatial correlation function of rich clusters of galaxies. Astrophys. J. 1983, 270, 20–38. [Google Scholar] [CrossRef]
- Klypin, A.A.; Kopylov, A.I. The Spatial Covariance Function for Rich Clusters of Galaxies. Sov. Astron. Lett. 1983, 9, 41. [Google Scholar]
- Kaiser, N. On the spatial correlations of Abell clusters. Astrophys. J. Lett. 1984, 284, L9–L12. [Google Scholar] [CrossRef]
- Szalay, A.S.; Schramm, D.N. Are galaxies more strongly correlated than clusters? Nature 1985, 314, 718–719. [Google Scholar] [CrossRef]
- Einasto, J.; Saar, E.; Klypin, A.A. Structure of superclusters and supercluster formation. V—Spatial correlation and voids. Mon. Not. R. Astron. Soc. 1986, 219, 457–478. [Google Scholar] [CrossRef]
- Jones, B.J.T.; Martinez, V.J.; Saar, E.; Einasto, J. Multifractal description of the large-scale structure of the universe. Astrophys. J. Lett. 1988, 332, L1–L5. [Google Scholar] [CrossRef]
- Gramann, M. Formation of the structure in an axion Universe with a cosmological constant. Tartu Astr. Obs. Publ. 1987, 52, 216–255. [Google Scholar]
- Gramann, M. Structure and formation of superclusters. VIII—Evolution of structure in a model with cold dark matter and cosmological constant. Mon. Not. R. Astron. Soc. 1988, 234, 569–582. [Google Scholar] [CrossRef]
- Mandelbrot, B.B. Discussion Panel: Fractal Large Scale Structures and Crossover to Homogeneity: The Mass-Radius Function versus the Correlations, and the Measurement of the Corrrelation Range. In Large Scale Structures of the Universe; Audouze, J., Pelletan, M.C., Szalay, A., Zel’dovich, Y.B., Peebles, P.J.E., Eds.; IAU Symposium. 1988, Volume 130, pp. 482–484. Available online: https://www.cambridge.org/core/journals/symposium-international-astronomical-union/article/discussion-panel/617AC4E14DDB6690A89E56AD0334A35A (accessed on 21 August 2025).
- Mandelbrot, B.B. The Fractal Geometry of Nature; Freeman: San Francisco, CA, USA, 1982. [Google Scholar]
- Abell, G.O.; Chincarini, G. (Eds.) Early Evolution of the Universe and Its Present Structure; IAU Symposium; D. Reidel Publishing Company: Dordrecht, The Netherlands, 1983; Volume 104. [Google Scholar]
- Audouze, J.; Pelletan, M.C.; Szalay, A.; Zel’dovich, Y.B.; Peebles, P.J.E. (Eds.) Large-Scale Structures in the Universe. Observational and Analytical Methods. Proceedings of the 130th Symposium of the International Astronomical Union, Dedicated to the Memory of Marc A. Aaronson (1950–1987), Held in Balatonfured, Hungary, 15–20 June 1987; IAU Symposium; Kluwer Academic Publishers: Dordrecht, The Netherlands, 1988; Volume 130. [Google Scholar]
- van de Weygaert, R.; Shandarin, S.; Saar, E.; Einasto, J. (Eds.) The Zeldovich Universe: Genesis and Growth of the Cosmic Web; IAU Symposium; Cambridge University Press: Cambridge, UK, 2016; Volume 308. [Google Scholar] [CrossRef]
- Peebles, P.J.E.; Yu, J.T. Primeval Adiabatic Perturbation in an Expanding Universe. Astrophys. J. 1970, 162, 815–836. [Google Scholar] [CrossRef]
- Arnold, V.I.; Shandarin, S.F.; Zeldovich, I.B. The large scale structure of the universe I. General properties. One-and two-dimensional models. Geophys. Astrophys. Fluid Dyn. 1982, 20, 111–130. [Google Scholar] [CrossRef]
- Martinez, V.J.; Jones, B.J.T. Why the universe is not a fractal. Mon. Not. R. Astron. Soc. 1990, 242, 517–521. [Google Scholar] [CrossRef]
- Martínez, V.J.; Saar, E. Statistics of the Galaxy Distribution; Chapman & Hall/CRC: Boca Raton, FL, USA, 2002. [Google Scholar]
- Balian, R.; Schaeffer, R. Galaxies: Fractal Dimensions, Counts in Cells, and Correlations. Astrophys. J. Lett. 1988, 335, L43. [Google Scholar] [CrossRef]
- Balian, R.; Schaeffer, R. Scale-invariant matter distribution in the universe. II—Bifractal behaviour. Astron. Astrophys. 1989, 226, 373–414. [Google Scholar]
- Song, D.J.; Ruffini, R. Determination of “inos” Masses Composing Galactic Halos. In Observational Cosmology; Hewitt, A., Burbidge, G., Fang, L.Z., Eds.; IAU Symposium; Cambridge University Press: Cambridge, UK, 1987; Volume 124, p. 723. [Google Scholar]
- Ruffini, R.; Song, D.J.; Taraglio, S. The ’ino’ mass and the cellular large-scale structure of the universe. Astron. Astrophys. 1988, 190, 1–9. [Google Scholar]
- Calzetti, D.; Einasto, J.; Giavalisco, M.; Ruffini, R.; Saar, E. The Correlation Function of Galaxies in the Direction of the Coma Cluster. Astrophys. Space Sci. 1987, 137, 101–106. [Google Scholar] [CrossRef]
- Calzetti, D.; Giavalisco, M.; Ruffini, R. The normalization of the correlation functions for extragalactic structures. Astron. Astrophys. 1988, 198, 1–15. [Google Scholar]
- Gaite, J.; Domínguez, A.; Pérez-Mercader, J. The Fractal Distribution of Galaxies and the Transition to Homogeneity. Astrophys. J. Lett. 1999, 522, L5–L8. [Google Scholar] [CrossRef]
- Gaite, J. Smooth halos in the cosmic web. J. Cosmol. Astropart. Phys. 2015, 2015, 020. [Google Scholar] [CrossRef]
- Gaite, J. The Fractal Geometry of the Cosmic Web and Its Formation. Adv. Astron. 2019, 2019, 6587138. [Google Scholar] [CrossRef]
- Peebles, P.J.E. The fractal galaxy distribution. Phys. D Nonlinear Phenom. 1989, 38, 273–278. [Google Scholar] [CrossRef]
- Peebles, P.J.E. Principles of Physical Cosmology; Prinseton University Press: Prinseton, NJ, USA, 1993. [Google Scholar] [CrossRef]
- Pietronero, L.; Montuori, M.; Sylos Labini, F. On the Fractal Structure of the Visible Universe. arXiv 1997, arXiv:astro-ph/9611197. [Google Scholar] [CrossRef]
- Pietronero, L.; Sylos Labini, F. Fractal Structures and the Large Scale Distribution of Galaxies. In Current Topics in Astrofundamental Physics: The Cosmic Microwave Background; Sánchez, N.G., Ed.; Springer: Dordrecht, The Netherlands, 2001; p. 391. [Google Scholar] [CrossRef][Green Version]
- Sylos Labini, F.; Gabrielli, A.; Montuori, M.; Pietronero, L. Finite size effects on the galaxy number counts: Evidence for fractal behavior up to the deepest scale. Phys. A Stat. Mech. Its Appl. 1996, 226, 195–242. [Google Scholar] [CrossRef]
- Borgani, S. Scaling in the Universe. Phys. Rep. 1995, 251, 1–152. [Google Scholar] [CrossRef]
- Turok, N. (Ed.) Critical Dialogues in Cosmology; World Scientific: Singapore, 1997. [Google Scholar][Green Version]
- Davis, M. Is the Universe Homogeneous on Large Scales? arXiv 1997, arXiv:astro-ph/9610149. [Google Scholar] [CrossRef]
- de Swart, J.G. Five decades of missing matter. Phys. Today 2024, 77, 24–43. [Google Scholar] [CrossRef]
- Zeldovich, Y.B.; Einasto, J.; Shandarin, S.F. Giant voids in the universe. Nature 1982, 300, 407–413. [Google Scholar] [CrossRef]
- Klypin, A.A.; Shandarin, S.F. Three-dimensional numerical model of the formation of large-scale structure in the Universe. Mon. Not. R. Astron. Soc. 1983, 204, 891–907. [Google Scholar] [CrossRef]
- van den Bergh, S. Are Clusters of Galaxies Stable? Astron. J. 1962, 67, 285. [Google Scholar] [CrossRef]
- Peebles, P.J.E. Large-scale background temperature and mass fluctuations due to scale-invariant primeval perturbations. Astrophys. J. Lett. 1982, 263, L1–L5. [Google Scholar] [CrossRef]
- Melott, A.L.; Einasto, J.; Saar, E.; Suisalu, I.; Klypin, A.A.; Shandarin, S.F. Cluster analysis of the nonlinear evolution of large-scale structure in an axion/gravitino/photino-dominated universe. Phys. Rev. Lett. 1983, 51, 935–938. [Google Scholar] [CrossRef]
- Centrella, J.; Melott, A.L. Three-dimensional simulation of large-scale structure in the universe. Nature 1983, 305, 196–198. [Google Scholar] [CrossRef]
- Peebles, P.J.E. The Large-Scale Structure of the Universe; Princeton Series in Physics; Prinseton University Press: Prinseton, NJ, USA, 1980. [Google Scholar]
- Kaiser, N. Clustering in real space and in redshift space. Mon. Not. R. Astron. Soc. 1987, 227, 1–21. [Google Scholar] [CrossRef]
- Davis, M.; Peebles, P.J.E. A survey of galaxy redshifts. V. The two-point position and velocity correlations. Astrophys. J. 1983, 267, 465–482. [Google Scholar] [CrossRef]
- Norberg, P.; Baugh, C.M.; Hawkins, E.; Maddox, S.; Peacock, J.A.; Cole, S.; Frenk, C.S.; Bland-Hawthorn, J.; Bridges, T.; Cannon, R.; et al. The 2dF Galaxy Redshift Survey: Luminosity dependence of galaxy clustering. Mon. Not. R. Astron. Soc. 2001, 328, 64–70. [Google Scholar] [CrossRef]
- Zehavi, I.; Zheng, Z.; Weinberg, D.H.; Frieman, J.A.; Berlind, A.A.; Blanton, M.R.; Scoccimarro, R.; Sheth, R.K.; Strauss, M.A.; Kayo, I.; et al. The Luminosity and Color Dependence of the Galaxy Correlation Function. Astrophys. J. 2005, 630, 1–27. [Google Scholar] [CrossRef]
- Zehavi, I.; Zheng, Z.; Weinberg, D.H.; Blanton, M.R.; Bahcall, N.A.; Berlind, A.A.; Brinkmann, J.; Frieman, J.A.; Gunn, J.E.; Lupton, R.H.; et al. Galaxy Clustering in the Completed SDSS Redshift Survey: The Dependence on Color and Luminosity. Astrophys. J. 2011, 736, 59. [Google Scholar] [CrossRef]
- Coleman, P.H.; Pietronero, L. The fractal structure of the universe. Phys. Rep. 1992, 213, 311–389. [Google Scholar] [CrossRef]
- Coleman, P.H.; Pietronero, L.; Sanders, R.H. Absence of any characteristic correlation length in the CfA galaxy catalogue. Astron. Astrophys. 1988, 200, L32–L34. [Google Scholar]
- Coles, P.; Chiang, L. Characterizing the nonlinear growth of large-scale structure in the Universe. Nature 2000, 406, 376–378. [Google Scholar] [CrossRef]
- Colless, M.; Peterson, B.A.; Jackson, C.; Peacock, J.A.; Cole, S.; Norberg, P.; Baldry, I.K.; Baugh, C.M.; Bland-Hawthorn, J.; Bridges, T.; et al. The 2dF Galaxy Redshift Survey: Final Data Release. arXiv 2003, arXiv:astro–ph/0306581. [Google Scholar] [CrossRef]
- Aihara, H.; Allende Prieto, C.; An, D.; Anderson, S.F.; Aubourg, É.; Balbinot, E.; Beers, T.C.; Berlind, A.A.; Bickerton, S.J.; Bizyaev, D.; et al. The Eighth Data Release of the Sloan Digital Sky Survey: First Data from SDSS-III. Astrophys. J. Suppl. 2011, 193, 29. [Google Scholar] [CrossRef]
- Alam, S.; Albareti, F.D.; Allende Prieto, C.; Anders, F.; Anderson, S.F.; Anderton, T.; Andrews, B.H.; Armengaud, E.; Aubourg, É.; Bailey, S.; et al. The Eleventh and Twelfth Data Releases of the Sloan Digital Sky Survey: Final Data from SDSS-III. Astrophys. J. Suppl. 2015, 219, 12. [Google Scholar] [CrossRef]
- Tegmark, M.; Blanton, M.R.; Strauss, M.A.; Hoyle, F.; Schlegel, D.; Scoccimarro, R.; Vogeley, M.S.; Weinberg, D.H.; Zehavi, I.; Berlind, A.; et al. The Three-Dimensional Power Spectrum of Galaxies from the Sloan Digital Sky Survey. Astrophys. J. 2004, 606, 702–740. [Google Scholar] [CrossRef]
- Springel, V.; White, S.D.M.; Jenkins, A.; Frenk, C.S.; Yoshida, N.; Gao, L.; Navarro, J.; Thacker, R.; Croton, D.; Helly, J.; et al. Simulations of the formation, evolution and clustering of galaxies and quasars. Nature 2005, 435, 629–636. [Google Scholar] [CrossRef] [PubMed]
- Springel, V.; Pakmor, R.; Pillepich, A.; Weinberger, R.; Nelson, D.; Hernquist, L.; Vogelsberger, M.; Genel, S.; Torrey, P.; Marinacci, F.; et al. First results from the IllustrisTNG simulations: Matter and galaxy clustering. Mon. Not. R. Astron. Soc. 2018, 475, 676–698. [Google Scholar] [CrossRef]
- Einasto, J.; Hütsi, G.; Kuutma, T.; Einasto, M. Correlation function: Biasing and fractal properties of the cosmic web. Astron. Astrophys. 2020, 640, A47. [Google Scholar] [CrossRef]
- Einasto, J.; Hütsi, G.; Einasto, M. Correlation functions in 2D and 3D as descriptors of the cosmic web. Astron. Astrophys. 2021, 652, A152. [Google Scholar] [CrossRef]
- White, S.D.M.; Rees, M.J. Core condensation in heavy halos—A two-stage theory for galaxy formation and clustering. Mon. Not. R. Astron. Soc. 1978, 183, 341–358. [Google Scholar] [CrossRef]
- Cen, R.; Ostriker, J.P. A three-dimensional hydrodynamic treatment of the hot dark matter cosmological scenario. Astrophys. J. 1992, 399, 331–344. [Google Scholar] [CrossRef]
- Repp, A.; Szapudi, I. A Gravitational Ising Model for the Statistical Bias of Galaxies. arXiv 2019, arXiv:1904.05048. [Google Scholar] [CrossRef]
- Tempel, E.; Tamm, A.; Gramann, M.; Tuvikene, T.; Liivamägi, L.J.; Suhhonenko, I.; Kipper, R.; Einasto, M.; Saar, E. Flux- and volume-limited groups/clusters for the SDSS galaxies: Catalogues and mass estimation. Astron. Astrophys. 2014, 566, A1. [Google Scholar] [CrossRef]
- Ahn, C.P.; Alexandroff, R.; Allende Prieto, C.; Anders, F.; Anderson, S.F.; Anderton, T.; Andrews, B.H.; Aubourg, É.; Bailey, S.; Bastien, F.A.; et al. The Tenth Data Release of the Sloan Digital Sky Survey: First Spectroscopic Data from the SDSS-III Apache Point Observatory Galactic Evolution Experiment. Astrophys. J. Suppl. 2014, 211, 17. [Google Scholar] [CrossRef]
- Liivamägi, L.J.; Tempel, E.; Saar, E. SDSS DR7 superclusters. The catalogues. Astron. Astrophys. 2012, 539, A80. [Google Scholar] [CrossRef]
- Croton, D.J.; Springel, V.; White, S.D.M.; De Lucia, G.; Frenk, C.S.; Gao, L.; Jenkins, A.; Kauffmann, G.; Navarro, J.F.; Yoshida, N. The many lives of active galactic nuclei: Cooling flows, black holes and the luminosities and colours of galaxies. Mon. Not. R. Astron. Soc. 2006, 365, 11–28. [Google Scholar] [CrossRef]
- McAlpine, S.; Helly, J.C.; Schaller, M.; Trayford, J.W.; Qu, Y.; Furlong, M.; Bower, R.G.; Crain, R.A.; Schaye, J.; Theuns, T.; et al. The EAGLE simulations of galaxy formation: Public release of halo and galaxy catalogues. Astron. Comput. 2016, 15, 72–89. [Google Scholar] [CrossRef]
- Zehavi, I.; Weinberg, D.H.; Zheng, Z.; Berlind, A.A.; Frieman, J.A.; Scoccimarro, R.; Sheth, R.K.; Blanton, M.R.; Tegmark, M.; Mo, H.J.; et al. On Departures from a Power Law in the Galaxy Correlation Function. Astrophys. J. 2004, 608, 16–24. [Google Scholar] [CrossRef]
- Navarro, J.F.; Frenk, C.S.; White, S.D.M. A Universal Density Profile from Hierarchical Clustering. Astrophys. J. 1997, 490, 493. [Google Scholar] [CrossRef]
- Wang, J.; Bose, S.; Frenk, C.S.; Gao, L.; Jenkins, A.; Springel, V.; White, S.D.M. Universal structure of dark matter haloes over a mass range of 20 orders of magnitude. Nature 2020, 585, 39–42. [Google Scholar] [CrossRef] [PubMed]
- Kirshner, R.P.; Oemler, A., Jr.; Schechter, P.L.; Shectman, S.A. A million cubic megaparsec void in Bootes. Astrophys. J. Lett. 1981, 248, L57–L60. [Google Scholar] [CrossRef]
- Pan, D.C.; Vogeley, M.S.; Hoyle, F.; Choi, Y.Y.; Park, C. Cosmic voids in Sloan Digital Sky Survey Data Release 7. Mon. Not. R. Astron. Soc. 2012, 421, 926–934. [Google Scholar] [CrossRef]
- Sutter, P.M.; Lavaux, G.; Wandelt, B.D.; Weinberg, D.H. A Public Void Catalog from the SDSS DR7 Galaxy Redshift Surveys Based on the Watershed Transform. Astrophys. J. 2012, 761, 44. [Google Scholar] [CrossRef]
- Nadathur, S.; Hotchkiss, S. A robust public catalogue of voids and superclusters in the SDSS Data Release 7 galaxy surveys. Mon. Not. R. Astron. Soc. 2014, 440, 1248–1262. [Google Scholar] [CrossRef]
- Sheth, R.K.; van de Weygaert, R. A hierarchy of voids: Much ado about nothing. Mon. Not. R. Astron. Soc. 2004, 350, 517–538. [Google Scholar] [CrossRef]
- Aragon-Calvo, M.A.; Szalay, A.S. The Hierarchical Structure and Dynamics of Voids. Mon. Not. R. Astron. Soc. 2013, 428, 3409–3424. [Google Scholar] [CrossRef]
- Aragon Calvo, M.A.; Neyrinck, M.C.; Silk, J. Galaxy Quenching from Cosmic Web Detachment. Open J. Astrophys. 2019, 2, 7. [Google Scholar] [CrossRef]
- Pan, J.; Coles, P. Large-scale cosmic homogeneity from a multifractal analysis of the PSCz catalogue. Mon. Not. R. Astron. Soc. 2000, 318, L51–L54. [Google Scholar] [CrossRef]
- Sarkar, P.; Yadav, J.; Pandey, B.; Bharadwaj, S. The scale of homogeneity of the galaxy distribution in SDSS DR6. Mon. Not. R. Astron. Soc. 2009, 399, L128–L131. [Google Scholar] [CrossRef]
- Scrimgeour, M.I.; Davis, T.; Blake, C.; James, J.B.; Poole, G.B.; Staveley-Smith, L.; Brough, S.; Colless, M.; Contreras, C.; Couch, W.; et al. The WiggleZ Dark Energy Survey: The transition to large-scale cosmic homogeneity. Mon. Not. R. Astron. Soc. 2012, 425, 116–134. [Google Scholar] [CrossRef]
- Courtois, H.M.; Mould, J.; Hollinger, A.M.; Dupuy, A.; Zhang, C.P. In search for the Local Universe dynamical homogeneity scale with CF4++ peculiar velocities. arXiv 2025, arXiv:2502.01308. [Google Scholar] [CrossRef]
- Park, C.; Song, H.; Einasto, M.; Lietzen, H.; Heinamaki, P. Large SDSS Quasar Groups and Their Statistical Significance. J. Korean Astron. Soc. 2015, 48, 75–82. [Google Scholar] [CrossRef]
Disclaimer/Publisher’s Note: The statements, opinions and data contained in all publications are solely those of the individual author(s) and contributor(s) and not of MDPI and/or the editor(s). MDPI and/or the editor(s) disclaim responsibility for any injury to people or property resulting from any ideas, methods, instructions or products referred to in the content. |
© 2025 by the author. Licensee MDPI, Basel, Switzerland. This article is an open access article distributed under the terms and conditions of the Creative Commons Attribution (CC BY) license (https://creativecommons.org/licenses/by/4.0/).