Abstract
Traffic safety is a critical issue in highway operation management, where accurate identification of accident hotspots enables proactive risk prevention and facility optimization. Traditional methods relying on historical statistics often fail to capture macro-level environmental patterns and micro-level dynamic variations. To address this challenge, we propose a Dual-Branch Feature Adaptive Gated Fusion Network (DFAGF-Net) that integrates satellite remote sensing imagery with traffic flow time-series data. The framework consists of three components: the Global Contextual Aggregation Network (GCA-Net) for capturing macro spatial layouts from remote sensing imagery, a Sequential Gated Recurrent Unit Attention Network (Seq-GRUAttNet) for modeling dynamic traffic flow with temporal attention, and a Hybrid Feature Adaptive Module (HFA-Module) for adaptive cross-modal feature fusion. Experimental results demonstrate that the DFAGF-Net achieves superior performance in accident hotspot recognition. Specifically, GCA-Net achieves an accuracy of 84.59% on satellite imagery, while Seq-GRUAttNet achieves an accuracy of 82.51% on traffic flow data. With the incorporation of the HFA-Module, the overall performance is further improved, reaching an accuracy of 90.21% and an F1-score of 0.92, which is significantly better than traditional concatenation or additive fusion methods. Ablation studies confirm the effectiveness of each component, while comparisons with state-of-the-art models demonstrate superior classification accuracy and generalization. Furthermore, model interpretability analysis reveals that curved highway alignments, roadside greenery, and varying traffic conditions across time are major contributors to accident hotspot formation. By accurately locating high-risk segments, DFAGF-Net provides valuable decision support for proactive traffic safety management and targeted infrastructure optimization.
1. Introduction
With the continuous development of the social economy and the increasing demand for travel, the number of traffic accidents worldwide has been rising, resulting in severe casualties and substantial economic losses [1]. According to the World Health Organization (WHO), road traffic crashes claim approximately 1.19 million lives annually worldwide, and cost most countries around 3% of their gross domestic product (GDP). In China, the Ministry of Public Security of the People’s Republic of China reported that in 2023 China’s operating highway network reached 5.44 million km (including 184,000 km of highways) while major road accidents (those causing three or more deaths) still numbered 436, a 12% decline from 2019 but indicating continued risk amid growth. In highway scenarios, the high operating speed of vehicles and the difficulty of timely rescue often lead to more serious traffic risks once an accident occurs [2]. Therefore, accurately identifying potential highway accident hotspots is essential for guiding travel safety measures and optimizing the deployment of protective infrastructure.
Highway accident hotspot (HAH) identification is an important research direction in the field of traffic safety [3]. An accident hotspot refers to a road segment and its surrounding area with frequent traffic accidents and a high level of risk, formed under the combined influence of multiple factors such as road geometry, traffic volume, and surrounding environmental layout [4]. These regions are unevenly distributed along highways and are often difficult to identify, yet they have a significant impact on traffic safety and frequently lead to severe traffic casualties. Traditional HAH identification mainly relies on accident data mapping and statistical reports, which makes large-scale hotspot detection a time-consuming and labor-intensive task.
In recent years, some scholars have employed machine learning models to identify traffic accident hotspots by incorporating traffic-related features at different levels. For example, Amorim et al. [5] constructed a machine learning classification model by mining accident reports with respect to road type, weather conditions, incident characteristics, and spatial mapping relationships, thereby achieving accurate classification of road risk hotspots. Similarly, Mirzahossein et al. [6] utilized big data and a multi-level decision-making approach to classify traffic accident hotspots and applied the analytic hierarchy process to determine the final hotspot locations. Their results demonstrated a 72% correlation between the identified hotspots and historical accident data. The surrounding built environment has been proven to be closely associated with the frequency of traffic accidents. Wang et al. [7] collected built environment information around accident hotspots and employed a regression model to relate environmental features with road operation data for hotspot identification, thereby analyzing the impact of environmental factors on frequent traffic accidents. Le et al. [8] integrated geographic information technology with machine learning methods to explore the impact of accident severity on the formation of accident hotspot distributions and analyzed the contribution of different weather conditions and seasonal characteristics to hotspot identification. Considering the influence of different accident types on hotspot formation, Wang et al. [9] developed both univariate and bivariate negative binomial conditional autoregressive models for accident hotspot detection, incorporating road geometric design features and traffic flow conditions to examine the differences among hotspot regions formed by various collision types. It is worth noting that these studies generally require the collection of a large amount of structured information as research data support, which may limit the applicability and scalability of the proposed methods.
In addition to spatial and imagery-based approaches, recent research has increasingly emphasized the dynamic characteristics of traffic flow and the potential of multimodal integration for traffic safety analysis. Lee and Lee [10] proposed a congestion-boundary approach for phase transitions in traffic flow, providing a quantitative characterization of transitions between free-flow and congested regimes in large-scale networks. Min et al. [11] developed a deep multimodal learning framework that combines dedicated short-range communication data with vehicle detection system outputs to improve the accuracy of traffic speed estimation on highways. In addition, Zhang et al. [12] proposed a data-driven framework for modeling the stochastic fundamental diagram (SFD) of mixed traffic flow, incorporating interactions between automated vehicles (AVs) and human-driven vehicles (HVs). This work provides a probabilistic foundation for understanding the stochastic nature of mixed traffic and offers valuable insights for improving traffic management and safety strategies. Collectively, these studies underscore the value of integrating traffic dynamics and heterogeneous data modalities to better understand, predict, and mitigate road traffic risks.
Beyond multimodal and traffic flow–based studies, simulation-based techniques have also played an increasingly important role in evaluating and enhancing road safety under complex traffic conditions. For instance, Akopov and Beklaryan et al. [13] developed a simulation framework to estimate accident rates involving unmanned ground vehicles within smart-city transportation systems, providing a quantitative basis for risk management in emerging mobility contexts. Similarly, Mahmud et al. [14] conducted a comprehensive review of micro-simulation modeling for traffic safety assessment and discussed its applicability to heterogeneous traffic environments. Moreover, recent advancements have integrated simulation models with machine learning techniques, particularly the multi-agent reinforcement learning (MARL) approach, which enables the dynamic optimization of driving strategies and cooperative behaviors to improve traffic safety performance. For example, Gan et al. [15] applied a deep MARL framework for cooperative vehicle decision-making in merging scenarios, while Benhamza et al. [16] utilized MARL-based control for intelligent traffic signal coordination, both demonstrating the potential of MARL to enhance safety through adaptive and coordinated traffic management.
In recent years, with the development of urban open data platforms and computer vision technologies, satellite remote sensing imagery has been increasingly used to extract potential accident-related features for hotspot identification. This unstructured data provides full coverage, near–real-time monitoring, and rich representations of highway environments. For instance, Liang et al. [17] integrated multi-scale satellite remote sensing imagery and employed a self-supervised cross-matching strategy to accurately estimate collision-prone areas. Nair et al. [18] proposed a novel hybrid road segmentation method, extracting spatial features from remote sensing data—such as curvature, sight distance, land use, and network attributes—and applied a binary logistic regression model to identify accident hotspots and analyze high-collision zones. Similarly, AlKheder et al. [19] utilized computer vision techniques to extract road geometric alignments from remote sensing images, combining them with traffic operation characteristics to analyze accident hotspots and identify critical variables influencing crash frequency. Gonzalez et al. [20] leveraged remote sensing data to detect wildlife–vehicle collision hotspots, using diverse image representations as inputs to compare the effectiveness of various machine learning algorithms for hotspot identification. These studies primarily focused on extracting structured features that represent environmental and spatial layouts from remote sensing imagery. With the advancement of deep learning, automated feature extraction from imagery for accident hotspot recognition has become another important research direction. For example, Wijnands [21] applied unsupervised deep encoders to automatically extract road network structures from remote sensing images and clustered similar geometric patterns to identify intersections with different safety levels. Huang et al. [22] fused remote sensing imagery with road network structures, constructing a multi-branch network for pixel-level inference and recognition of traffic accident risks. Guo et al. [23] combined remote sensing and street-view data to build a dual-branch contextual feature network for fine-grained recognition of urban traffic accident hotspots. However, these methods are mainly tailored to urban contexts and may not be directly applicable to HAH identification. Most existing remote sensing-based approaches primarily emphasize static spatial representations of road environments and rely heavily on visual appearance features. However, such methods often overlook the complex macro-level spatial organization and contextual dependencies that play a critical role in the formation of HAH. Moreover, their reliance on urban imagery frequently leads to models that perform well in structured city environments but struggle to generalize to large-scale, high-speed highway scenarios. Unlike urban intersections, HAH exhibit heterogeneous scales and irregular spatial distributions, making them more difficult to identify through conventional image-based models. Therefore, motivated by these limitations, one of the main objectives of this study is to propose an efficient remote sensing-based model capable of identifying HAH from complex macro-level roadway layouts.
It is worth noting that although the macroscopic distribution of highway accident hotspots can usually be observed from remote sensing imagery, certain hotspot and non-hotspot regions may still exhibit similar spatial structures, such as comparable lane numbers and road geometry, which hinders the precise identification of accident hotspots. Compared with remote sensing imagery, highway traffic flow records offer high sampling frequency and comprehensive information categories, and have been widely applied in areas such as traffic volume estimation [24], accident risk analysis [25], and navigation planning [26]. Notably, accident hotspot regions typically exhibit dense and complex traffic flow states, which distinguishes them from non-hotspot areas. However, previous studies have often relied on short-term traffic flow features to estimate traffic conditions at specific time intervals, failing to capture the evolving patterns of risk embedded in long-term temporal sequences. This limitation restricts the ability of existing models to reflect continuous variations in traffic dynamics that influence accident formation. To address this issue, it is essential to design a deep learning framework capable of learning long-range temporal dependencies and accurately extracting dynamic risk features from traffic flow sequences. Therefore, another objective of this study is to develop an HAH classification model that effectively leverages long-term traffic flow dynamics for more accurate and robust hotspot identification.
In our study, the fusion of remote sensing imagery and traffic flow sequence data offers multiple advantages for the identification of HAH. Satellite imagery provides macro-level spatial layouts, while traffic flow sequences capture micro-level dynamic characteristics, enabling a more fine-grained representation of accident-prone regions. It is worth noting that previous research on heterogeneous data fusion has often relied on direct feature stacking or additive fusion, which can lead to feature redundancy and coarse representation. Moreover, when the data sources exhibit distinct categorical characteristics, such approaches frequently hinder the model’s ability to make accurate classifications. These limitations highlight the need for a more flexible and adaptive fusion strategy that can selectively integrate complementary information from multiple modalities while minimizing redundancy and interference. Therefore, designing an effective heterogeneous feature fusion framework is essential to improve both model accuracy and feature interpretability. The final objective of this study is to propose an adaptive gated fusion module capable of cross-domain feature learning and integration, enabling more accurate and interpretable HAH recognition.
In summary, this study aims to propose a Dual-Branch Feature Adaptive Gated Fusion Network (DFAGF-Net) that integrates satellite remote sensing imagery and traffic flow time-series information to achieve accurate identification of HAH. Specifically, the proposed DFAGF-Net consists of three components: a remote sensing branch, a traffic flow time-series branch, and an adaptive fusion module. In the remote sensing branch, a Global Contextual Aggregation Network (GCA-Net) is developed to learn macro-level representations and spatial layout correlations from remote sensing imagery. In the traffic flow time series branch, a Sequential GRU Attention Network (Seq-GRUAttNet) is designed to model dynamic traffic flow data and capture temporal risk features embedded in traffic sequences. Furthermore, unlike existing multi-modal fusion frameworks based on simple feature concatenation or additive averaging, the proposed Hybrid Feature Adaptive Module (HFA-Module) performs adaptive feature weighting and cross-modal interaction through a gating mechanism. This design enables DFAGF-Net to capture complementary macro–micro correlations while effectively suppressing redundant feature interference, thereby enhancing the accuracy and interpretability of HAH identification. The list of abbreviations is shown in Table 1.

Table 1.
List of abbreviations.
2. DFAGF-Net Framework
2.1. DFAGF-Net
The architecture of the proposed DFAGF-Net is illustrated in Figure 1, which consists of three main components: the remote sensing branch, the traffic flow time-series branch, and the adaptive fusion module. In the remote sensing branch, the proposed GCA-Net is employed to extract macro spatial layouts and contextual correlation features from satellite imagery that reflect high-risk regions of highway accident occurrence. These features correspond to physical roadway and environmental characteristics such as lane configuration, curvature, gradient, interchange complexity, and roadside land-use intensity, all of which are known to influence accident probability. Within GCA-Net, the CFT Block (CNN Fusion Transformation Block) serves as a key component that bridges the convolutional and transformer structures, enabling the model to adaptively fuse local convolutional representations with global contextual dependencies for enhanced spatial feature learning. The 2D Conv (two-dimensional convolution) operation is further utilized to capture fine-grained local structures such as road edges, lane markings, and median geometry, which are closely related to roadway safety risk factors. In the traffic flow time-series branch, Seq-GRUAttNet is designed to model long traffic flow sequences, capturing temporal risk features such as fluctuations in speed, volume, and density that describe evolving congestion and instability patterns on the highway. Finally, the HFA-Module is introduced to adaptively fuse macro-spatial features with traffic flow temporal features, thereby enhancing the representation of risk-related patterns. This fusion allows DFAGF-Net to jointly interpret geometric risks (e.g., sharp curves or narrow shoulders) and dynamic risks (e.g., recurring speed drops or traffic turbulence), thereby improving the accuracy and robustness of HAH identification.
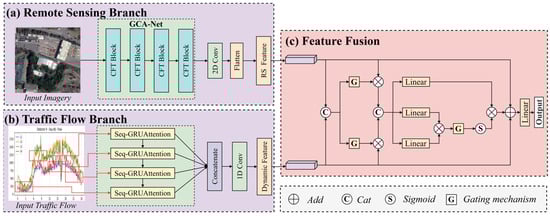
Figure 1.
DFAGF-Net (a) GCA-Net for extracting macro-level features from remote sensing images; (b) Seq-GRUAttNet for capturing traffic flow sequence features; (c) HFA-Module based on remote sensing images and traffic flow sequence data.
2.2. GCA-Net
The macro-level scenes of HAH areas often exhibit differences in shape and size, while micro-level road layouts (e.g., alignment and median configuration) also have a significant impact on risk formation [22]. Therefore, accurately extracting risk features related to traffic accidents from a macro perspective remains a highly challenging task. In recent years, Transformers have demonstrated unique advantages in capturing global dependencies, and researchers have attempted to transfer such architectures to the field of computer vision to enhance global modeling capabilities at the image level [27]. Among them, the most representative work is the Vision Transformer (ViT), which divides an image into patches treated as sequential inputs and employs a self-attention mechanism for classification tasks [28].
It is worth noting that the extraction of accident-related features depends not only on the overall scene layout but also on capturing the interactions between local regions. In the context of remote sensing imagery, these features are closely associated with roadway and environmental elements—such as lane curvature, interchange density, shoulder width, vegetation proximity, and built-up surroundings—that reflect potential safety hazards. Remote sensing imagery provides vital spatial information for pinpointing high-risk highway segments and distinguishing potential accident hotspots from ordinary road sections. Although the traditional self-attention mechanism in ViT can model long-range dependencies across different regions, each query–key mapping is treated independently, resulting in a lack of direct modeling of spatial neighborhood context. To address this issue, we propose GCA-Net, which integrates the CNN architecture for local spatial feature extraction with the Transformer architecture for global feature representation through the incorporation of a CFT Block (CNN Fusion Transformation Block). The CFT Block serves as a bridge between convolutional and transformer layers, enabling adaptive fusion of local and global spatial information. In this way, GCA-Net jointly captures both macro layouts and fine-grained local features embedded in remote sensing imagery, thereby improving recognition accuracy. The architecture of the proposed GCA-Net is illustrated in Figure 2, which consists of three components: a Local Extraction Unit (LEU), a Global Aggregation Transformer (GAT), and a Feature Aggregation Feedforward Cell (FAFC). These components will be described in detail in the following subsections.
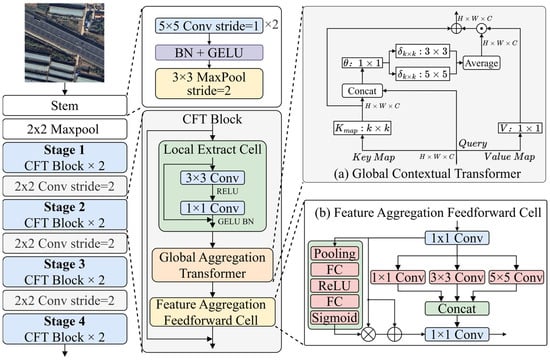
Figure 2.
The proposed GCA-Net architecture: (a) Global Aggregation Transformer for contextual multi-scale feature extraction; (b) Feature Aggregation Feedforward Cell for feature aggregation.
Local Extraction Cell. In the process of macro-feature modeling for HAH regions, the model is expected to maintain translation invariance with respect to regional position shifts such as rotation and translation during feature extraction. However, conventional Transformer architectures typically introduce absolute positional encodings for each token, which may compromise global invariance to some extent. To alleviate this issue, we introduce a Local Extraction Cell (LEC) to extract local information, which is defined as:
where , with denoting the image resolution and C the number of feature channels. The operation captures local spatial patterns, while the convolution is employed for information integration along the channel dimension. The GELU activation function and batch normalization are further applied to enhance the stability and expressiveness of the extracted features.
Global Aggregation Transformer. The conventional self-attention mechanism relies solely on independent query–key matching for feature interaction, without explicitly modeling the relationships between neighboring positions. This limitation weakens the capacity of contextual information for local modeling in 2D feature maps, thereby restricting the adaptive learning of spatial neighborhood dependencies. To overcome this problem, we propose a Transformer architecture that integrates contextual aggregation and multi-scale learning, termed the GAT. As shown in Figure 1c, GAT introduces multi-scale contextual interactions among adjacent spatial keys, strengthening the modeling of global dependencies in feature maps.
Given an input 2D feature map , the Keys (K), Queries (Q), and Values (V) are defined as , , , respectively. Unlike conventional self-attention mechanisms that directly generate keys using a 1 1 convolution, the GAT block employs a k k convolution kernel along the spatial dimension to smoothly model neighboring keys, thereby capturing feature correlations across different receptive fields. In our experiments, k = 3. The resulting reresent aggregated local context and are used as augmented keys in subsequent attention opertions.
During the computation of attention weights, GAT concatenates with Q and performs contextual interaction through two convolutional layers: the first is a 1 1 convolution with ReLU activation, which compresses and fuses channel information; the second consists of parallel 3 3 and 5 5 convolutions (without activation), which model multi-scale local correlations. After average pooling, the generated contextual weight maps are multiplied element-wise with the value map, and aggregated to obtain the final output features , which are enriched with global context awareness.
Feature Aggregation Feedforward Cell. In Transformer architectures, the conventional feedforward network typically consists of two linear transformations designed to expand and compress feature dimensions by a fixed ratio. As illustrated in Figure 2, we propose the Feature Aggregation Feedforward Cell (FAFC), which aims to enhance the capability of capturing multi-scale information through a multi-scale feature aggregation mechanism.
Specifically, the input features are first projected through a 1 1 convolution layer along the channel dimension. The projected features are then fed in parallel into three convolutional branches with kernels of 1 1, 3 3, and 5 5, respectively, to capture multi-scale information under different receptive fields. The outputs of these branches are concatenated along the channel dimension and subsequently fused and compressed by another 1 1 convolution, yielding the aggregated feature representation .
In addition, the input feature X is further processed by a channel attention mechanism to adaptively capture information across different dimensions, as formulated below:
Finally, the output of the FAFC, denoted as , is defined as:
2.3. Seq-GRUAttNet
Unlike macro-level remote sensing imagery that reflects the overall spatial layout of roads, traffic flow time series contain more fine-grained temporal evolution information, enabling the characterization of dynamic operating states within accident hotspot regions. Temporal variations in traffic speed, volume, and density often capture the progression of congestion and instability, which are key precursors of crash risk. In particular, abnormal fluctuations—such as recurrent speed drops, sudden flow breakdowns, or prolonged congestion—can reveal hazardous driving conditions and reflect the accumulation of potential conflicts in specific highway segments. Therefore, to fully exploit the temporal dependencies and potential patterns in traffic flow, we design an attention-enhanced recurrent neural network, termed Seq-GRUAttNet. Unlike conventional GRU models, Seq-GRUAttNet integrates an attention mechanism into the gating units, allowing adaptive learning of contextual feature correlations, as illustrated in Figure 3.
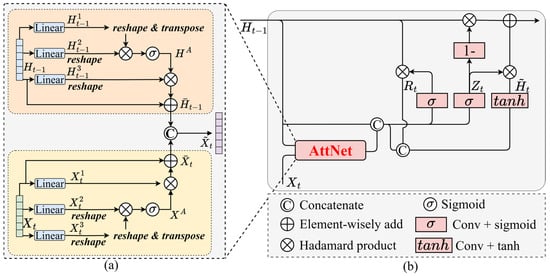
Figure 3.
The proposed Seq-GRUAttNet: (a) the attention network used in Seq-GRUAttNet; (b) the overall architecture of Seq-GRUAttNet.
Unlike macro-level remote sensing imagery that reflects the overall spatial layout of roads, traffic flow time series contain more fine-grained temporal evolution information, enabling the characterization of dynamic operating states within accident hotspot regions. Traffic flow exhibits significant temporal variations, which are often closely related to accident occurrence. Therefore, to fully exploit the temporal dependencies and potential patterns in traffic flow, we design an attention-enhanced recurrent neural network, termed Seq-GRUAttNet. Unlike conventional GRU models, Seq-GRUAttNet integrates an attention mechanism into the gating units, allowing adaptive learning of contextual feature correlations.
Specifically, given the current input feature , where C denotes the three core traffic indicators—average speed, flow, and density—representing the operational state of the road segment at time step t, it is first mapped through a linear layer into two new feature vectors, and . A matrix multiplication is then performed between and the transpose of , followed by a softmax activation function to compute the attention map XA. Next, is multiplied with XA, and the result is reshaped into , denoted as . Here, represents the input feature vector at time step t, obtained from the linear projection of the initial traffic flow input. At this stage, the feature contains traffic dynamics adaptively learned through the attention mechanism. This process can be formulated as follows:
Here, denotes the number of feature channels at the current time step, and represents the softmax activation function. The same operation is applied to the historical feature , yielding the attention map and the attention-enhanced feature , which incorporates traffic dynamics from the previous time step. Finally, the features and are concatenated and passed through a linear layer for deep feature fusion, thereby associating the current and historical features to capture the dynamic variations in traffic flow. This process is formulated as:
Thus, Seq-GRUAttNet can be formulated as follows:
In the above equations, denotes the output of the sequence frame after passing through the attention network. and refer to the Sigmoid and hyperbolic tangent activation functions, respectively. and represent the convolution operator and the Hadamard product, respectively. represents the convolutional update gate, and are the trainable parameters to be optimized during model learning.
2.4. HFA-Module
Since remote sensing imagery and traffic flow sequences provide heterogeneous features with different risk representations, we design an HFA-Module for adaptive feature fusion. A gating mechanism is introduced to filter redundant information and minimize interference during hotspot recognition.
Specifically, the output features from the remote sensing branch and the traffic flow branch, denoted as and , are first combined, and a gating mechanism composed of two linear layers with a sigmoid activation function is applied to the fused feature . This produces reconstructed features and , where redundancy is effectively suppressed. The reconstructed features are then multiplied by their corresponding branch outputs, and , to provide adaptive risk-aware information for each branch. The results are subsequently aggregated to obtain , which encodes cross-modal correlations of heterogeneous features.
Since contains potential risk-related representations, it is further mapped into the query (Q), key (K), and value (V) in an attention mechanism. The similarity between Q and K is computed through matrix multiplication, transformed into attention weights using the softmax function, and finally multiplied by V. The attention-enhanced feature is then added to and , and passed through a fully connected layer to obtain the final risk classification output . This process is formulated as:
In denotes the output dimension of the linear layer. In our accident hotspot classification task, .
3. Results and Discussion
3.1. Datasets
In this study, we focus on accident hotspot identification; therefore, the classification scheme only considers two categories: accident hotspot areas and non-hotspot areas. We collected highway traffic accident data from Shandong Province, China, for the year 2022, and mapped the incidents onto a geographic map based on their location information. The DBSCAN clustering algorithm was employed to detect accident hotspots, where the hyperparameter epsilon defines the radius of the circular neighborhood around each accident point to check the number of incidents within it, and minPoints specifies the minimum number of accidents required within this neighborhood for it to be marked as a hotspot cluster. To determine the optimal epsilon value for urban accident hotspot partitioning, a K-Distance graph was plotted. The point of maximum curvature on the K-Distance curve was selected, yielding an optimal epsilon of 100 m. The value of minPoints was empirically set to 10, meaning that each identified accident hotspot region must contain at least 10 traffic accidents.
Specifically, using these hyperparameter values, a total of 304 accident hotspot regions were identified on highways in Shandong Province, China. Accidents not located within any hotspot region were labeled as noise and classified as non-hotspots. For model training and validation, 800 non-hotspot samples were randomly selected as negative instances, ensuring their uniform distribution across the study area. Each sample consisted of a satellite remote sensing image together with the corresponding dynamic traffic flow information, including both speed and volume.
3.2. Experiment and Evaluation Settings
The proposed DFAGF-Net was implemented and trained using the PyTorch framework (version 1.10.0) under Python 3.8. All experiments were conducted on a workstation running Ubuntu 20.04, equipped with an AMD Ryzen 7 5800X CPU (3.80 GHz) (Advanced Micro Devices, Inc., Santa Clara, CA, USA) and an NVIDIA GeForce RTX 3060 GPU (Nvidia Corporation, Santa Clara, CA, USA). The GPU acceleration was supported by CUDA 11.3 and cuDNN 7.5, which significantly improved the efficiency of model training. A summary of the detailed experimental configuration is provided in Table 2.
Table 2.
Experimental environment and parameter configuration.
During the training phase, the total number of epochs was set to 300 with a batch size of 8, and each epoch consisted of 111 iterations, resulting in 33,300 training iterations in total. The total training time was approximately 3 h and 50 min. To evaluate model accuracy and prevent overfitting, the validation set was tested every 222 training iterations. The dataset was divided into training and validation sets with an 8:2 ratio. Considering the limited sample size, the validation set was used as an independent test set for model evaluation and comparison, and was not involved in model training or parameter updates. To assess the predictive performance of the proposed model, the following evaluation metrics were adopted: accuracy, recall, precision, and F1-score. Accuracy refers to the proportion of correctly classified samples over the total number of samples. Recall represents the proportion of correctly identified positive samples relative to the total number of actual positives. Precision measures the proportion of correctly identified positive samples relative to the total number of samples predicted as positive. The F1-score is the harmonic mean of recall and precision, providing a balanced assessment of both metrics.
where TP denotes true positives, FP denotes false positives, FN denotes false negatives, and TN denotes true negatives.
3.3. Experimental Validation
The training and validation results of the proposed DFACF-Net are shown in Figure 4. Figure 4a illustrates the accuracy curves during the training and validation process. As the number of iterations increases, the accuracy gradually rises and converges, with the training accuracy approaching 0.93 and the validation accuracy fluctuating around 0.90. In addition, Figure 4b plots the loss curves, where both training and validation losses continuously decrease and eventually converge. The small gap between them demonstrates the strong generalization ability of the model. Furthermore, Figure 4c presents the confusion matrix on the testing set: among the non-hotspot samples, 122 were correctly identified and only 8 were misclassified as hotspots; among the actual hotspot samples, 80 were correctly recognized while 11 were missed, showing overall satisfactory performance.
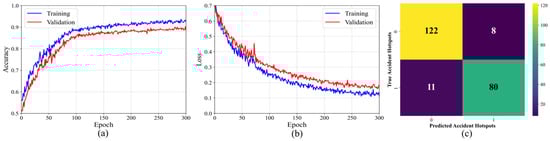
Figure 4.
Results of our DFACF-Net on the accident hotspot dataset: (a) accuracy during the training process; (b) training and validation loss curves; (c) confusion matrix on the testing dataset (where 0 denotes non-HAH and 1 denotes HAH).
Moreover, Table 3 reports the quantitative results on the testing set, where the model achieves an Accuracy of 90.2%, a Precision of 91.4%, a Recall of 90.1%, and an AUC of 0.92. These results indicate that the proposed DFACF-Net not only maintains high classification accuracy in HAH identification but also achieves a good balance between precision and recall, effectively distinguishing hotspot regions from non-hotspot ones.
Table 3.
Evaluation metrics of DFACF-Net on the HAH dataset.
3.4. Results of the Remote Sensing Imagery Branch Model
3.4.1. Ablation Analysis of the Remote Sensing Branch Model
In this section, we conduct ablation experiments on the proposed GCA-Net branch based on satellite remote sensing data to analyze the role and contribution of its individual components. As shown in Table 4, the ViT is employed as the baseline model for the satellite branch, achieving an accuracy of 79.61% and an F1-score of 0.77 on the accident hotspot classification task.
Table 4.
Ablation study of the proposed GCA-Net architecture for performance evaluation.
It is noteworthy that the proposed GCA-Net fully exploits the complementary advantages of CNN and Transformer architectures by employing the CFT Block as the feature extraction unit, which integrates the LEU, GAT, and FAFC. This design enables the model to achieve superior accuracy in HAH prediction. Specifically, introducing the LEU before the ViT significantly improves the modeling of local spatial features, preventing the loss of adjacent contextual information that often occurs with the direct linear projection of image patches. As shown in Table 4 (No. 2), this modification increases the classification accuracy to 80.33% and the F1-score to 0.79. Similarly, the effectiveness of FAFC is verified in No. 3, where multi-level feature aggregation combined with GAT leads to a 1.7% improvement in accuracy (from 79.61% to 81.03%) and a 3.8% improvement in F1-score (from 0.77 to 0.80). When both LEU and FAFC are inserted before and after the attention mechanism, further performance gains are achieved. These modules jointly enhance local feature extraction and multi-scale feature fusion, thereby alleviating the poor mapping effect of direct linear patch projection. Compared with the baseline, this configuration improves accuracy by 2.9% (from 79.61% to 81.94%) and increases the F1-score by 5.2%.
Finally, the combination of LEU, GAT, and FAFC (Table 4, No. 5) yields the best overall performance, confirming that the proposed GAT provides superior capability over conventional attention mechanisms. By introducing multi-scale convolutions, GAT enables contextual interaction across spatial dimensions, thereby strengthening the representation of accident risk information from remote sensing imagery. Overall, the complete GCA-Net architecture outperforms the baseline model by improving accuracy by 6.3% (from 79.61% to 84.59%) and F1-score by 10.4% (from 0.77 to 0.85). Notably, GAT achieves the highest precision (83.37%), which is particularly beneficial for real-world HAH classification tasks, as the model prioritizes capturing as many true HAH regions as possible, thereby reducing the risk of missed detections that may cause severe traffic hazards.
3.4.2. Comparison of GCA-Net with Existing Deep Learning Models
To further validate the effectiveness of the proposed GCA-Net in the satellite branch for accident hotspot classification, we conducted comparative experiments with several representative deep learning models. All models were trained and tested on the same training and validation sets to ensure a fair comparison.
As shown in Table 5, EfficientNet [29], DenseNet [30], and ResNet [31] represent typical CNN-based architectures, while Swin [32] and ViT are representative Transformer-based architectures. The results indicate that CNN-based models generally outperform Transformer-based models. Among them, DenseNet achieved the best performance within the CNN group, with an accuracy of 82.46% and an F1-score of 0.83, surpassing ViT (Acc. 79.61%, F1-score 0.77) and Swin (Acc. 77.32%, F1-score 0.80).
Table 5.
Performance comparison of GCA-Net and other deep learning models.
Among all compared models, the proposed GCA-Net achieved the best overall performance, with an accuracy of 84.59%, precision of 83.37%, recall of 86.19%, and an F1-score of 0.85. Compared with conventional CNN and Transformer models, GCA-Net improved accuracy by approximately 3–7% and F1-score by 0.02–0.08. In terms of model efficiency, GCA-Net maintains a moderate parameter scale (21.75 M) and computational complexity (10.21 G FLOPs), which are comparable to DenseNet (21.91 M, 10.43 G) but significantly lower than Swin (27.15 M, 15.43 G) and ViT (26.86 M, 14.21 G). This balance between performance and efficiency highlights the compact yet powerful design of GCA-Net. These results demonstrate that the integration of LEU for local feature modeling, GAT for global contextual enhancement, and FAFC for multi-scale feature aggregation enables GCA-Net to achieve superior discriminative power and generalization capability in satellite imagery-based HAH classification.
3.5. Experiments on Sequential Feature Association in the Traffic Flow Branch
In the traffic flow time-series branch, dynamic traffic flow data are adopted as inputs, which differ substantially from static features. Time-series characteristics provide more detailed representations of traffic-related factors within HAH regions, thereby improving recognition accuracy under homogeneous macro-level scenarios. To better capture contextual dependencies among sequential features, we conducted a series of comparative experiments with different feature fusion strategies, as summarized in Table 6.
Table 6.
Comparison of sequential feature association methods in the traffic flow branch.
In Experiment No. 1, features were combined solely by concatenation, which neglects contextual associations inherent in temporal dynamics, resulting in the lowest performance (Acc. 70.52%, F1-score 0.72). Experiments No. 2 and No. 3 employed LSTM and GRU to model flattened sequential data. Although these approaches performed better than direct concatenation (No. 1), they only aggregated historical and current features without considering the varying contributions of different time steps, thus limiting expressive capability. To further enhance temporal dependency modeling, Experiments No. 4 and No. 5 incorporated BiLSTM and BiGRU, respectively, enabling bidirectional modeling of sequential data. These methods improved performance, achieving Acc. values of 80.14% and 80.82%, with F1-scores stabilized at 0.79.
Finally, Experiment No. 6 validated the effectiveness of the proposed Seq-GRUAttNet. By integrating an attention-enhanced gating mechanism into GRU, Seq-GRUAttNet adaptively selects critical temporal fragments and explicitly models dependencies between past and current features, substantially improving the utilization of sequential information. The results show that Seq-GRUAttNet achieved the best performance, with an Acc. of 82.51%, representing a 17% improvement over direct concatenation. In terms of computational efficiency, Seq-GRUAttNet maintains a moderate parameter count (9.84 M) and FLOPs (4.78 G)—comparable to GRU (8.64 M, 4.14 G) yet significantly lower than BiLSTM (13.42 M, 6.87 G) and BiGRU (11.92 M, 5.16 G). This balance between accuracy and efficiency confirms that the attention-gated mechanism enhances representational capacity without introducing substantial computational overhead.
3.6. Comparison with Other Models
To further demonstrate both the computational efficiency and interpretability advantages of the proposed DFAGF-Net, additional comparisons were conducted with classical spatial statistical models and existing deep learning fusion frameworks.
Traditional spatial statistical approaches—Kernel Density Estimation (KDE), Conditional Autoregressive (CAR) models, and Getis–Ord Gi*—are included to establish a baseline for interpretability. For KDE, the continuous spatial risk intensity was converted into a binary hotspot map by applying a threshold value of 0.5, where regions with were defined as potential accident hotspots and the remainder as non-hotspots. Under this setting, KDE achieved an accuracy of 59.98% and an F1 score of 0.60. The CAR model improved slightly (Acc = 62.68%, F1 = 0.63) by incorporating spatial autocorrelation among adjacent regions, while the Getis–Ord Gi* statistic further enhanced hotspot identification (Acc = 64.82%, F1 = 0.65) through localized significance testing. Although these classical approaches provide strong interpretability and transparent spatial inference, they are limited in capturing nonlinear cross-modal dependencies between remote sensing imagery and dynamic traffic flows.
By contrast, deep learning-based frameworks achieve substantially higher recognition performance. DF-Transformer [33] and TSImageFusion [34] demonstrate that multimodal fusion of imagery and traffic data can effectively model global and temporal dependencies, reaching accuracies of 88.74% and 87.62%, respectively. However, their fusion strategies primarily rely on fixed concatenation or attention weighting, which restricts adaptive feature interaction across modalities. The proposed DFAGF-Net introduces an adaptive gated fusion mechanism that dynamically adjusts the contribution of each modality through a dual-branch design. This mechanism differs from conventional concatenation or additive attention schemes by learning gating coefficients that regulate the flow of spatial and temporal risk features during joint optimization. As shown in Table 7, DFAGF-Net achieves the highest overall performance—90.21% accuracy, 91.42% precision, 90.16% recall, and an F1 score of 0.92.
Table 7.
Summarizes the quantitative results across all models.
3.7. Effectiveness of Dual-Branch Feature Fusion
The proposed DFAGF-Net for HAH recognition consists of the GCA-Net, the Seq-GRUAttNet and the HFA-Module. Each branch models static spatial and dynamic temporal features, while the fusion module integrates these heterogeneous representations to achieve cross-modal complementarity and joint classification. To validate the effectiveness of dual-branch feature fusion, a series of comparative experiments were conducted, as summarized in Table 8.
Table 8.
Comparison of dual-branch feature fusion methods.
From the single-branch experiments, GCA-Net achieved the best performance on satellite imagery, with an accuracy of 84.59% and an F1-score of 0.85. In contrast, the Seq-GRUAttNet, based on dynamic traffic flow data, achieved an accuracy of 82.51%. This discrepancy is mainly attributed to the inherent characteristics of the two data modalities. Satellite imagery provides a wide coverage and high-resolution macro-level perspective, directly reflecting road geometry, land-use patterns, and large-scale transportation facilities, which are relatively stable environmental features strongly influencing the spatial distribution of HAH. Therefore, the satellite branch holds an advantage in recognition accuracy. Conversely, dynamic traffic flow data capture the temporal dimension of traffic operations, including traffic volume fluctuations, speed variations, and congestion evolution. Although slightly less accurate, these features complement satellite imagery by reflecting short-term dynamic risk information that static imagery cannot convey.
On this basis, we explored different levels of dual-branch feature fusion. Feature concatenation (Table 8, No. 3) allows direct integration of heterogeneous features and achieves an accuracy of 86.11%. However, the direct addition of features (Table 8, No. 4) disrupts the domain-specific characteristics of each modality, leading to a performance decline compared with the single-branch results. In terms of computational efficiency, both fusion methods substantially increase the model size, with Params of 32.43 M and 31.98 M and FLOPs of 15.97 G and 15.77 G, respectively, indicating higher complexity but limited performance gain. More importantly, the proposed DFAGF-Net, by introducing an adaptive gating mechanism into the fusion process, effectively models the dynamic weighting of crossmodal features and significantly enhances overall performance while maintaining a moderate computational cost (33.58 M, 16.89 G). As a result, DFAGF-Net achieved the best results across all evaluation metrics, with an accuracy of 90.21%, representing a 4.7% improvement over direct feature concatenation.
To further validate the effectiveness of the proposed DFAGF-Net in multimodal data fusion, we compared three models on the validation set: (a) the satellite-based GCA-Net, (b) the traffic flow-based Seq-GRUAttNet, and (c) the dual-branch fusion DFAGF-Net. The corresponding confusion matrices are shown in Figure 5.
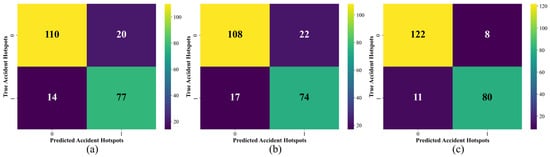
Figure 5.
Confusion matrices of different branch models on the validation set: (a) GCA-Net based on satellite imagery; (b) Seq-GRUAttNet based on traffic flow data; (c) DFAGF-Net with dual-branch fusion.
The single-branch models exhibited performance differences. GCA-Net (Figure 5a) correctly identified 187 samples (110 non-hotspots and 77 hotspots), achieving higher overall accuracy than Seq-GRUAttNet (Figure 5b), which correctly identified 182 samples. This difference arises because satellite imagery provides macro-level and relatively stable environmental features, while the traffic flow branch emphasizes temporal dynamics, offering complementary information on traffic state evolution. By contrast, the dual-branch DFAGF-Net (Figure 5c) substantially reduced prediction errors, correctly identifying 202 samples (122 non-hotspots and 80 hotspots), thereby achieving the best overall performance. These findings are consistent with the quantitative metrics in Table 6, further demonstrating that cross-modal deep fusion significantly enhances discriminative capability. More importantly, in the validation set, a subset of samples produced conflicting predictions between the two single-branch models. In these cases, GCA-Net and Seq-GRUAttNet each correctly classified part of the samples, whereas DFAGF-Net correctly recognized the majority of them, with an accuracy notably higher than either single-branch model. This confirms that multimodal fusion not only improves overall performance but also provides greater robustness and decision-making capability in handling ambiguous or conflicting cases.
3.8. Model Interpretability Analysis
To further explore the internal decision mechanisms of DFAGF-Net and verify the interpretability of its dual-branch design, visual analyses were conducted from both the spatial and temporal perspectives. Specifically, the Grad-CAM++ [35] technique was applied to the remote sensing branch (GCA-Net), and the Integrated Gradients (IG) method was used to evaluate the temporal contribution of traffic flow features within the Seq-GRUAttNet branch.
The Grad-CAM++ visualization results revealed that the model primarily focuses on curved highway alignments and roadside tree belts, suggesting that complex geometric curvature and dense vegetation along the roadway contribute significantly to the formation of highway accident hotspots. These areas may impair drivers’ visibility or induce steering instability at high speeds, thereby increasing crash risk, as shown in Figure 6a. Meanwhile, the IG-based temporal analysis further elucidates how the relative contributions of traffic density, speed, and flow vary across different time periods, as illustrated in Figure 6b. Specifically, during the early morning hours (00:00–04:00), high-speed and low-flow conditions exert a strong positive influence on accident risk, reflecting the danger of high-speed driving under low visibility and sparse traffic. From 05:00 to 10:00, as traffic volume increases and congestion emerges, dense traffic conditions become the dominant contributing factor to risk formation, corresponding to the morning peak. During 10:00–15:00, when flow and speed stabilize at moderate levels, their influence on risk remains neutral, indicating a relatively safe and balanced traffic state. In contrast, during the evening peak period (16:00–20:00), both traffic density and flow again show strong positive contributions, suggesting that high-volume, high-speed interactions significantly elevate accident likelihood under mixed travel demands. After 21:00, the contributions of all variables gradually decline as the traffic environment stabilizes.
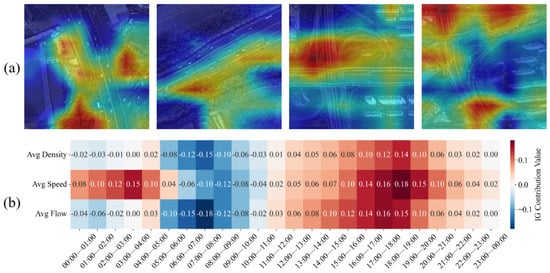
Figure 6.
Model interpretability analysis. (a) Grad-CAM++-based interpretability analysis for the remote sensing branch (b) IG-based interpretability analysis for the traffic flow branch.
Together, these findings indicate that DFAGF-Net effectively captures both spatial structural risks and temporal dynamic patterns, providing interpretable insights into the mechanisms underlying highway accident hotspot formation.
4. Conclusions
This study addresses the challenge of HAH identification by proposing a dual-branch context-aware feature adaptive fusion network (DFAGF-Net) that integrates satellite remote sensing imagery and traffic flow time-series data. The model consists of three main components: the GCA-Net satellite branch, the Seq-GRUAttNet traffic flow branch, and the HFA-Module for cross-modal fusion, enabling comprehensive risk feature extraction at both macro and micro levels.
This study proposes a DFAGF-Net that integrates satellite remote sensing imagery and traffic flow time-series data for accurate HAH identification. The model comprises three components: GCA-Net for macro spatial feature extraction, Seq-GRUAttNet for temporal risk modeling, and the HFA-Module for adaptive cross-modal fusion. In the satellite branch, the proposed GCA-Net effectively combines the strengths of CNNs and Transformers by incorporating the LEU, GAT, and FAFC modules, jointly modeling global spatial structures and local contextual dependencies. Compared with the baseline, GCA-Net improved accuracy by 6.3% and the F1-score by 10.4%. In the traffic flow branch, Seq-GRUAttNet enhances GRU with an attention mechanism to adaptively capture critical temporal dependencies, achieving a 17% improvement in accuracy over feature concatenation. Further experiments demonstrate that multimodal fusion outperforms single-branch models. While direct concatenation or simple addition yields limited improvement due to feature redundancy, the proposed DFAGF-Net introduces an adaptive gating mechanism that dynamically balances cross-modal feature contributions and enhances discriminative power. On the real-world dataset, DFAGF-Net achieved 90.21% accuracy, exceeding single-branch models by 5.6%. Confusion matrix analysis further confirms that DFAGF-Net correctly resolves most conflicting predictions between branches, demonstrating strong robustness and generalization capability.
Accurate identification of HAHs provides valuable guidance for practical traffic safety management. By integrating remote sensing imagery with traffic flow data, the proposed framework enables early recognition of emerging risk patterns, allowing transportation authorities to transition from reactive responses after crashes to proactive interventions that mitigate potential hazards in advance. The high spatial precision achieved by DFAGF-Net can support the optimization of safety facility deployment—such as signage, lighting, and guardrail installation—as well as inform dynamic traffic control strategies in critical zones. Thus, while this study primarily focuses on hotspot identification, its results offer a robust analytical foundation for data-driven traffic safety policymaking and long-term accident reduction efforts.
Overall, DFAGF-Net effectively leverages the complementary strengths of satellite imagery and traffic flow data, providing an efficient and reliable solution for intelligent identification of highway accident hotspots. The findings not only advance spatial risk detection but also offer valuable support for future traffic safety management and preventive decision-making. Nevertheless, several limitations should be acknowledged. Due to the limited scope of the dataset, the model may require further fine-tuning when applied to cross-domain scenarios. Future research will focus on improving the model’s generalization across diverse highway environments through domain adaptation and transfer learning techniques, as well as incorporating additional heterogeneous data sources—such as weather, incident, and infrastructure information—to enrich risk representation. Furthermore, developing lightweight or incremental variants of DFAGF-Net will be explored to enable real-time hotspot prediction and rapid risk assessment in intelligent transportation systems. Such advancements are expected to enhance the practicality, adaptability, and operational efficiency of the proposed framework in broader real-world traffic safety applications.
Author Contributions
Conceptualization, methodology, formal analysis and writing, J.J.; investigation, visualization, and formal analysis, W.G.; investigation and visualization, C.B.; project administration, and funding acquisition, S.J. All authors have read and agreed to the published version of the manuscript.
Funding
This research was funded by “Pioneer” and “Leading Goose” R&D Program of Zhejiang (2025C01053), the National Natural Science Foundation of China (Grant No. 72361137006), the Natural Science Foundation of Zhejiang Province (Grant No. LR23E080002), and the Project Supported by Scientific Research Fund of Zhejiang Provincial Education Department (Grant No. Y202353473).
Data Availability Statement
The data that support the findings of this study are available upon reasonable request to the author, Wentong Guo.
Conflicts of Interest
Jun Jing is employed by the Shandong Hi-speed Group Co., Ltd. The remaining authors declare that the research was conducted in the absence of any commercial or financial relationships that could be construed as a potential conflict of interest.
References
- Ahmed, S.; Hossain, M.A.; Ray, S.K.; Bhuiyan, M.M.I.; Sabuj, S.R. A Study on Road Accident Prediction and Contributing Factors Using Explainable Machine Learning Models: Analysis and Performance. Transp. Res. Interdiscip. Perspect. 2023, 19, 100814. [Google Scholar] [CrossRef]
- Ahmed, A.; Farhan, M.; Eesaar, H.; Chong, K.T.; Tayara, H. From Detection to Action: A Multimodal AI Framework for Traffic Incident Response. Drones 2024, 8, 741. [Google Scholar] [CrossRef]
- Song, L.; Fan, W.D.; Li, Y.; Wu, P. Exploring Pedestrian Injury Severities at Pedestrian-Vehicle Crash Hotspots with an Annual Upward Trend: A Spatiotemporal Analysis with Latent Class Random Parameter Approach. J. Saf. Res. 2021, 76, 184–196. [Google Scholar] [CrossRef] [PubMed]
- Hazaymeh, K.; Almagbile, A.; Alomari, A.H. Spatiotemporal Analysis of Traffic Accidents Hotspots Based on Geospatial Techniques. ISPRS Int. J. Geo-Inf. 2022, 11, 260. [Google Scholar] [CrossRef]
- Amorim, B.D.S.P.; Firmino, A.A.; Baptista, C.D.S.; Júnior, G.B.; Paiva, A.C.D.; Júnior, F.E.D.A. A Machine Learning Approach for Classifying Road Accident Hotspots. ISPRS Int. J. Geo-Inf. 2023, 12, 227. [Google Scholar] [CrossRef]
- Mirzahossein, H.; Nobakht, P.; Waller, T.; Lin, D.-Y. Pinpointing Critical Traffic Hotspots in Megacities: A Data-Driven Approach Using Google Maps and AHP in Tehran. Innov. Infrastruct. Solut. 2025, 10, 251. [Google Scholar] [CrossRef]
- Wang, D.; Krebs, E.; Nickenig Vissoci, J.R.; de Andrade, L.; Rulisa, S.; Staton, C.A. Built Environment Analysis for Road Traffic Crash Hotspots in Kigali, Rwanda. Front. Sustain. Cities 2020, 2, 17. [Google Scholar] [CrossRef]
- Le, K.G.; Liu, P.; Lin, L.-T. Determining the Road Traffic Accident Hotspots Using GIS-Based Temporal-Spatial Statistical Analytic Techniques in Hanoi, Vietnam. Geo-Spat. Inf. Sci. 2020, 23, 153–164. [Google Scholar] [CrossRef]
- Wang, X.; Feng, M. Freeway Single and Multi-Vehicle Crash Safety Analysis: Influencing Factors and Hotspots. Accid. Anal. Prev. 2019, 132, 105268. [Google Scholar] [CrossRef]
- Lee, E.H.; Lee, E. Congestion Boundary Approach for Phase Transitions in Traffic Flow. Transp. B Transp. Dyn. 2024, 12, 2379377. [Google Scholar] [CrossRef]
- Min, J.H.; Ham, S.W.; Kim, D.-K.; Lee, E.H. Deep Multimodal Learning for Traffic Speed Estimation Combining Dedicated Short-Range Communication and Vehicle Detection System Data. Transp. Res. Rec. 2023, 2677, 247–259. [Google Scholar] [CrossRef]
- Zhang, X.; Yang, K.; Sun, J.; Sun, J. Stochastic Fundamental Diagram Modeling of Mixed Traffic Flow: A Data-Driven Approach. Transp. Res. Part C Emerg. Technol. 2025, 179, 105279. [Google Scholar] [CrossRef]
- Akopov, A.S.; Beklaryan, L.A. Simulation of Rates of Traffic Accidents Involving Unmanned Ground Vehicles within a Transportation System for the ‘Smart City’. Бизнес-инфoрматика 2022, 16, 19–35. [Google Scholar]
- Mahmud, S.M.S.; Ferreira, L.; Hoque, M.S.; Tavassoli, A. Micro-Simulation Modelling for Traffic Safety: A Review and Potential Application to Heterogeneous Traffic Environment. IATSS Res. 2019, 43, 27–36. [Google Scholar] [CrossRef]
- Gan, Q.; Li, B.; Xiong, Z.; Li, Z.; Liu, Y. Multi-Vehicle Cooperative Decision-Making in Merging Area Based on Deep Multi-Agent Reinforcement Learning. Sustainability 2024, 16, 9646. [Google Scholar] [CrossRef]
- Benhamza, K.; Seridi, H.; Agguini, M.; Bentagine, A. A Multi-Agent Reinforcement Learning Based Approach for Intelligent Traffic Signal Control. Evol. Syst. 2024, 15, 2383–2397. [Google Scholar] [CrossRef]
- Liang, G.; Zulu, J.; Xing, X.; Jacobs, N. Unveiling Roadway Hazards: Enhancing Fatal Crash Risk Estimation Through Multiscale Satellite Imagery and Self-Supervised Cross-Matching. IEEE J. Sel. Top. Appl. Earth Obs. Remote Sens. 2024, 17, 535–546. [Google Scholar] [CrossRef]
- Nair, S.R.; Bhavathrathan, B.K. Hybrid Segmentation Approach to Identify Crash Susceptible Locations in Large Road Networks. Saf. Sci. 2022, 145, 105515. [Google Scholar] [CrossRef]
- AlKheder, S.; Gharabally, H.A.; Mutairi, S.A.; Mansour, R.A. An Impact Study of Highway Design on Casualty and Non-Casualty Traffic Accidents. Injury 2022, 53, 463–474. [Google Scholar] [CrossRef]
- González-Vélez, J.C.; Torres-Madronero, M.C.; Murillo-Escobar, J.; Jaramillo-Fayad, J.C. An Artificial Intelligent Framework for Prediction of Wildlife Vehicle Collision Hotspots Based on Geographic Information Systems and Multispectral Imagery. Ecol. Inform. 2021, 63, 101291. [Google Scholar] [CrossRef]
- Wijnands, J.S.; Zhao, H.; Nice, K.A.; Thompson, J.; Scully, K.; Guo, J.; Stevenson, M. Identifying Safe Intersection Design through Unsupervised Feature Extraction from Satellite Imagery. Comput. Aided Civ. Eng. 2021, 36, 346–361. [Google Scholar] [CrossRef]
- Huang, Q.; Jia, H.; Yuan, Z.; Wu, R. PL-TARMI: A Deep Learning Framework for Pixel-Level Traffic Crash Risk Map Inference. Accid. Anal. Prev. 2023, 191, 107174. [Google Scholar] [CrossRef]
- Guo, W.; Jin, S.; Li, Y.; Jiang, Y. The Dynamic-Static Dual-Branch Deep Neural Network for Urban Speeding Hotspot Identification Using Street View Image Data. Accid. Anal. Prev. 2024, 203, 107636. [Google Scholar] [CrossRef] [PubMed]
- Zhang, N.; Yang, X.; Guo, H.; Dong, H.; Ma, W. Approximate Inference of Traffic Flow State at Signalized Intersections Using a Bayesian Learning Framework. IEEE Trans. Intell. Transp. Syst. 2023, 24, 4765–4776. [Google Scholar] [CrossRef]
- Cao, Q.; Bai, Q.; Li, Z.; Li, H.; Ma, Y. Optimal Deployment of Sensors along Freeway Corridors for Traffic Accident Detection. J. Transp. Eng. Part A Syst. 2023, 149, 04023042. [Google Scholar] [CrossRef]
- Chen, L.-W.; Tsao, C.-C. Time-Dependent Lane-Level Navigation With Spatiotemporal Mobility Modeling Based on the Internet of Vehicles. IEEE Trans. Syst. Man Cybern. Syst. 2024, 54, 7721–7732. [Google Scholar] [CrossRef]
- Yan, H.; Ma, X.; Pu, Z. Learning Dynamic and Hierarchical Traffic Spatiotemporal Features With Transformer. IEEE Trans. Intell. Transp. Syst. 2022, 23, 22386–22399. [Google Scholar] [CrossRef]
- Dosovitskiy, A.; Beyer, L.; Kolesnikov, A.; Weissenborn, D.; Zhai, X.; Unterthiner, T.; Dehghani, M.; Minderer, M.; Heigold, G.; Gelly, S.; et al. An Image Is Worth 16x16 Words: Transformers for Image Recognition at Scale. Available online: https://arxiv.org/abs/2010.11929v2 (accessed on 25 November 2023).
- Tan, M.; Le, Q. EfficientNet: Rethinking Model Scaling for Convolutional Neural Networks. In Proceedings of the of the 36th International Conference on Machine Learning, PMLR, Long Beach, CA, USA, 24 May 2019; pp. 6105–6114. [Google Scholar]
- Huang, G.; Liu, Z.; Van Der Maaten, L.; Weinberger, K.Q. Densely Connected Convolutional Networks. In Proceedings of the 2017 IEEE Conference on Computer Vision and Pattern Recognition (CVPR), Honolulu, HI, USA, 21–26 July 2017; pp. 2261–2269. [Google Scholar] [CrossRef]
- He, K.; Zhang, X.; Ren, S.; Sun, J. Deep Residual Learning for Image Recognition. In Proceedings of the 2016 Ieee Conference on Computer Vision and Pattern Recognition (cvpr), Las Vegas, NV, USA, 26 June–1 July 2016; IEEE: New York, NY, USA, 2016; pp. 770–778. [Google Scholar]
- Liu, Z.; Lin, Y.; Cao, Y.; Hu, H.; Wei, Y.; Zhang, Z.; Lin, S.; Guo, B. Swin Transformer: Hierarchical Vision Transformer Using Shifted Windows. Available online: https://arxiv.org/abs/2103.14030v2 (accessed on 25 May 2021).
- Yang, C.; Yang, C. Deep Fusion of Time Series and Visual Data through Temporal Features: A Soft-Sensor Model for FeO Content in Sintering Process. Expert Syst. Appl. 2025, 268, 126243. [Google Scholar] [CrossRef]
- Rasekh, A.; Heidari, R.; Hosein Haji Mohammad Rezaie, A.; Sharifi Sedeh, P.; Ahmadi, Z.; Mitra, P.; Nejdl, W. Robust Fusion of Time Series and Image Data for Improved Multimodal Clinical Prediction. IEEE Access 2024, 12, 174107–174121. [Google Scholar] [CrossRef]
- Chattopadhay, A.; Sarkar, A.; Howlader, P.; Balasubramanian, V.N. Grad-CAM++: Generalized Gradient-Based Visual Explanations for Deep Convolutional Networks. In Proceedings of the 2018 IEEE Winter Conference on Applications of Computer Vision (WACV), Lake Tahoe, NV, USA, 12–15 March 2018; pp. 839–847. [Google Scholar]
Disclaimer/Publisher’s Note: The statements, opinions and data contained in all publications are solely those of the individual author(s) and contributor(s) and not of MDPI and/or the editor(s). MDPI and/or the editor(s) disclaim responsibility for any injury to people or property resulting from any ideas, methods, instructions or products referred to in the content. |
© 2025 by the authors. Licensee MDPI, Basel, Switzerland. This article is an open access article distributed under the terms and conditions of the Creative Commons Attribution (CC BY) license (https://creativecommons.org/licenses/by/4.0/).