Abstract
The current work highlights key challenges in the design of small-scale, high-rotational-speed centrifugal compressors for R-290 at domestic application scale on the basis of a single-stage demonstrator unit that is currently developed by ebm-papst. The demonstrator is operated in a vapor-compression cycle at a total pressure ratio up to 3, a maximum rotational speed of 240 krpm, and with maximum power supply of 3.2 kWe. Emphasis is placed on challenges related to aerodynamic stage design, impeller back wall sealing, and impeller thrust force balancing. Appropriate measures are proposed to overcome these challenges and compressor performance is quantified to evaluate the prospects of small-scale, centrifugal compressors for R-290 application in a wider context. Considerations related to mechanical design and manufacturing are briefly illustrated. Main design and performance assessments are conducted through 3D CFD RANS calculations.
1. Introduction
The United Nations 2030 Agenda [1] and the European Green Deal [2] set goals to improve quality of life and to protect the natural environment from degradation through a transformation of our societies toward the path of sustainable development. As part of this transformation, the ambition is to make the European Union climate-neutral with zero pollution by 2050. About 1.8% of the overall greenhouse gas emissions in the EU27 in 2022 were caused by the emission of hydrofluorocarbons (HFCs) [3]. In addition to their high global warming potential (GWP), many HFCs degrade into Per- and Polyfluorinated Substances (PFASs). PFASs are chemically very stable and accumulate in organisms and plants, which can lead to negative effects on health and the environment. Despite the overall reduction in greenhouse gas emissions in the EU27 since 1990, the prevalence of emissions caused by HFCs continued to rise until 2014 [3]. The F-Gas Regulation [4] aimed at reducing HFCs emissions from 2014 onwards by imposing strict rules to prevent emissions and by placing restrictions on the imports and the production of HFCs. The use of HFCs is no longer permitted if environmentally friendly alternatives are available. A phase-out of the use of HFCs by 2050 was decided upon [4]. This legislation is leading to the refrigeration and heat pump industry making efforts to replace fluorinated refrigerants with more environmentally friendly alternatives.
Most refrigeration machines and heat pumps are vapor compression refrigeration machines (VCRs). This type of refrigeration cycle utilizes the latent heat of the refrigerant and the change in the evaporation temperature with pressure to transfer heat from a low- to a high-temperature level for cooling or heating purposes. In the refrigeration cycle, heat is absorbed by evaporation of the refrigerant at low temperature and low pressure. After compression to a higher pressure level, the heat is released at a higher temperature through condensation of the refrigerant. HFCs are widely used in VCRs as refrigerants because they facilitate the design of very efficient refrigeration cycles, are chemically very stable, and are non-flammable. Established natural (non-fluorinated) refrigerants include propane (R-290) for general heating and refrigeration applications and ethane (R-170) for low-temperature refrigeration. They enable the operation of refrigeration machines in pressure and temperature ranges comparable to those of the widely used HFCs, but are significantly less harmful (low GWP, no PFAS). However, they are flammable [5].
The compressor is a critical component of VCR. For refrigeration machines with a thermal power of less than 40 kW, typically, scroll or twin rotary compressors are used. They provide a wide operating range at good efficiency. However, these machines require oil in the refrigerant for lubrication and sealing of the rotor gaps. This oil content (up to 8%) increases the required compressor power and reduces the heat exchanger performance [6].
Advances in the manufacturing industry in recent years have enabled the cost-effective production of passive, rigid gas bearings, highly loaded permanent magnet synchronous motors (PMSMs), and high-frequency power electronics. Passive, rigid gas bearings do not require oil for lubrication, an external gas supply, or back-up bearings. During operation, the ”herringbone” structures on the shaft pump gas from the outside of the radial bearing to its center. This creates a gas cushion which lifts the shaft. A similar bearing type (spiral grooves) is used for the axial thrust bearing. In operation, there is no wear on the bearings. The very small gap between shaft and bearing as well as the high stiffness and good alignment result in small bearing clearances. This enables small blade tip clearances of the compressor wheel and high efficiency, even with small wheel sizes. These advancements give rise to the trend of compact turbo compressors using high-rotational-speed electric drives in applications where, traditionally, larger positive displacement compressors are used [7,8].
The HighSpeed drive platform of ebm-papst, which is currently under development, enables the running of refrigeration compressors with drive powers from 3 kWe to 55 kWe at rotational speeds of up to 240 krpm [8]. This allows refrigerant turbo compressors to be designed even for comparatively low cooling capacities. Together with the gas bearing of the drive unit, these machine types enable oil-free and low-maintenance operation. As these units have a high power density, the installation space required is comparatively small in relation to the available power.
In this paper, the design process of a single-stage centrifugal compressor for a refrigeration system using R-290 as refrigerant is presented to illustrate general design considerations and challenges in the design of such machines. This work is an extended version of a previous conference contribution [9]. First, we give an overview of the operating point of the considered refrigeration cycle. Implications for the preliminary sizing of the compressor are highlighted with reference to non-dimensional performance metrics. This is followed by a description of the aerodynamic compressor stage design, conducting a 3D CFD-based multi-objective optimization with reference to a baseline geometry. In addition, the applied thrust-balancing measures and the sealing concept of the optimized impeller wheel are outlined. Finally, the test bench is presented and the design process is validated with the test results of the compressor stage.
2. Design Overview
The refrigeration system considered in this work resembles the design operating conditions of a four-component, air-to-water heat pump operating with a source temperature of 12 °C and a target temperature of 35 °C (A12W35) using R-290 as refrigerant. This is one typical testing condition of space heating units in low temperature application [10]. The heat pump operating point and corresponding thermodynamic states of the refrigerant are illustrated in the T–s diagram shown in Figure 1 applying exemplary specifications of an isentropic compressor efficiency of 75% and 5K superheat and subcooling. In addition, the compressibility factor
is shown for the gas state, which gives an indication of the fluids’ deviation from ideal gas behavior. A pressure ratio of about 3 is required with R-290 to satisfy the desired temperature lift, assuming a typical heat exchanger performance. As compressibility factors show increasing deviations from a value of 1 during the compression process, the compressor design needs to account for real gas behavior.
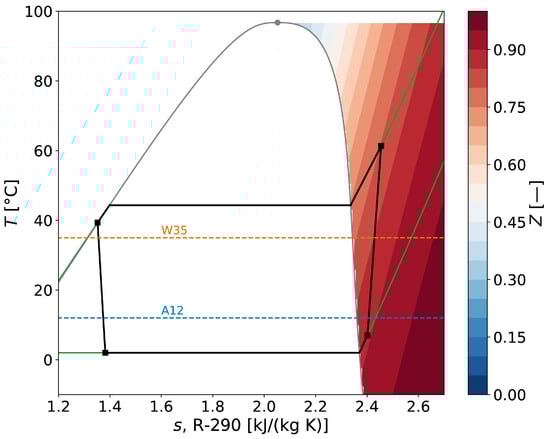
Figure 1.
T–s diagram of R-290 for the heat pump operating point A12W35 and compressibility factors of the gas state.
Design parameters of the developed compressor stage are summarized in Table 1, while Figure 2 shows a comparison of nominal non-dimensional (CFD-derived) parameters with well-known Balje correlations of specific diameter and isentropic efficiency as functions of specific speed [11]. Clearly, the design specific speed is considerably below the ideal value () at which maximum isentropic stage efficiencies can be expected based on Balje’s correlation. This is mainly due to the low mass flow rate, which in turn is determined by the required work input to deliver the required cycle total pressure ratio at a given power. Consequently, increasing specific speed requires operation at higher rotational speeds. For a given impeller tip speed, this also benefits a more compact design, as the impeller diameter would decrease correspondingly. However, there is no practical possibility to achieve a higher specific speed in the given design scenario. The reason for this is that the design rotational speed is already at the maximum value that can be achieved with the current compressor drive platform based on rotordynamic limitations related to critical bending frequencies of the rotor shaft. The isentropic efficiency that is achieved at the design specific speed is about 4.7%pts lower than the correlated value of Balje. In the context of a small-scale machine considered here, this is plausible and satisfactory. As such, efficiency penalties are to be expected primarily due to the relatively larger gap widths and the greater influence of surface roughness. An indicator of the presence of roughness effects on performance is the chord Reynolds number. Above a critical chord Reynolds number of approximately 200,000, roughness is expected to affect the machine performance, since, in this flow regime, roughness elements may extend over the viscous sublayer of turbulent boundary layers [12]. For the design operating condition, the chord Reynolds number is one order of magnitude higher than the critical value, so that roughness needs to be considered as a performance indicator.

Table 1.
Design operating conditions of the compressor.
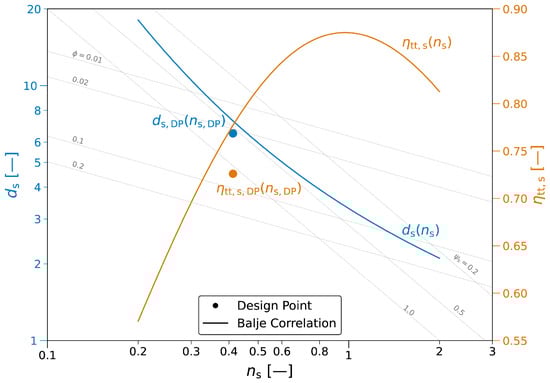
Figure 2.
Specific speed, specific diameter, and isentropic efficiency (CFD-derived) at the design point compared to correlations of Balje [11].
A high impeller tip speed is generally desirable to decrease the stage loading, which can be related to a specific speed and diameter according to Equation (2).
The allowable tip speed is usually limited by the yield strength of the impeller material or by the tip speed Mach number. Higher values of the latter are known to result in performance characteristics with a shorter operating range [13]. For R-290 at given compressor design conditions, the speed of sound is only a1 ≈ at1(pt1, Tt1) ≈ 224 m/s. Since aluminum is used as the impeller material, which permits tip speeds of up to around 370 m/s, the limitation of the tip speed can therefore be attributed to the tip speed Mach number. A design point value of Mu ≈ 1.37 is reached, which is on the progressive side. The associated specific diameter of the design point is close to the “Cordier line” given by Balje, indicating suitable dimensioning.
3. Compressor Stage Design
In this section, the methodology of the applied stage design procedure involving a parameterized 3D CFD optimization campaign is explained first. Subsequently, applied measures to ensure axial thrust balancing of the optimized impeller wheel and to counter seal leakage are presented. Finally, the aerodynamic stage performance is quantified with respect to sensitivities of surface roughness and impeller blade tip clearance.
3.1. Aerodynamic Stage Design Optimization
For the detailed stage design of the compressor, a multi-objective optimizer based on a genetic evolutionary algorithm is applied to a 3D CFD-based process chain. In addition to a combination of genetic operators (mutation, crossover, gradient, differential evolution), metamodels based on kriging are used for the generation of new members in this work. Two objective functions are defined seeking to maximize the total-to-total stage isentropic efficiency at design condition and the normalized slope of the total pressure ratio characteristic curve at design rotational speed according to Equation (3), respectively.
For evaluation of the latter, an off-design point (ODP) at is specified, so that two operating points in total are simulated for each design individual. In order to satisfy the desired pressure ratio at the rated mass flow rate within a tolerable range, optimization is achieved for constraint to total pressure ratios of
The basis of the optimization is a parameterized single-stage centrifugal compressor configuration that is set up in the commercial turbomachinery design software CFturbo 2023 R1.1 [14]. It comprises an inflow pipe, an impeller with splitter blades, a vaneless diffuser, an overhung volute, a cone diffuser, and an outflow pipe. In total, 31 optimization parameters are defined. Of these, nine are related to main dimensions, involving diameters, widths, blade angles, and the blade count. The remaining optimization parameters are related to controls of the meridional contours of hub and shroud, the leading edge positions of the main and splitter blade, as well as the blade shape. To ensure manufacturability by flank milling, the latter is controlled by two profiles, one at hub span and one at shroud span. The camber line of each profile is controlled by five Bézier points, defining the blade angle distribution and the wrap angle. Lean and rake angle are both constraint to zero degrees and a constant blade thickness is defined.
The splitter blades match the shapes of the main blades. The fixed parameters of the design are the shaft diameter and the blade tip clearance. For the latter, a constant value of 50 μm is used in the optimization campaign. This value is 10 μm larger than the actually applied value for the finalized nominal design. This is done to drive the optimizer to find designs with a broader exit width that would be necessary in the course of steering towards an efficient relative tip clearance. The broader exit width with the then reduced tip clearance to 40 μm is aimed at enabling a more robust design with regard to manufacturing tolerances. The optimization is evaluated with respect to a reference design that was designed on basis of manual parametric CFD design iterations. Its values serve as initial values within the optimization. Surface roughness is not considered in the investigated optimization scenario due to uncertainties in the achievable roughness values of manufactured components at the time the optimization was conducted. However, it is considered a posteriori in the finalized nominal design, based on indications on achievable surface roughness of sample manufactured parts.
The computational grid of the impeller flow path is generated with the commercial multi-block structured mesh generator ANSYS Turbogrid 2023 R1 [15]. The radially lower part of the vaneless diffuser up to its radial mid-plane is incorporated into that domain. All other domains are meshed with ANSYS Fluent Meshing 2023 R1 [16], applying an unstructured topology of tetrahedrons and prism layers. This includes the representations of the inlet pipe, the volute combined with the radially upper diffuser passage, the leakage flow path, the exit cone, and the outlet pipe. Due to the rotational periodicity, the domains of the inlet pipe and the impeller, including the radially lower part of the vaneless diffuser, are meshed as a single passage. The non-dimensional wall distance of the first grid layer is targeted to be within all simulations of the optimization. The total mesh size counts ≈0.4 million cells for the setups used in the automated optimization process chain to ensure faster calculation times and focus on capturing the optimization trends. For speed line calculations of selected individuals, the mesh size is increased to ≈2.4 million cells.
All simulations are performed with ANSYS CFX 2023 R1 [17]. Advective flux discretization is based on a high-resolution scheme and closure of the RANS equations is achieved through the k- SST turbulence model. Total pressure and total temperature are specified as inlet boundary conditions along with a unidirectional flow. Furthermore, a turbulence intensity of 5% and a viscosity ratio of 10 are imposed at the inlet. In order to account for the real gas behavior of R-290, thermophysical properties are considered through real gas property tables based on NIST REFPROP 10 data [18]. Properties are tabulated in the range of and , satisfying an interpolation error of less than . Walls are defined as adiabatic and, in the case of the optimization runs, as hydraulically smooth. For performance map calculations of the final nominal geometry, the specified mean roughness depth is considered through conversion to the equivalent sand grain roughness based on [19]. At the outlet domain, a mass flow boundary condition is imposed within the optimization campaign to match the mass flow rates of the design and the off-design operating point. Depending on the position on a speed line curve, either a mass flow or a pressure outlet boundary condition is used for speed line calculations. A pressure boundary condition is imposed at the outlet of the modelled leakage flow path. The back pressure of the leakage flow path is specified with the same value as the total inlet pressure of the compressor. The purpose of this is to approximate the pressure conditions of the full leakage flow path of the test rig, which is connected to the compressor inlet.
Results of the optimization with respect to the two objective functions are shown in Figure 3. Designs that are marked with crosses do not satisfy the constraint concerning the desired pressure ratio at the design mass flow rate and are disregarded from further consideration. The remaining designs reveal a pareto front. Compared to the reference design, the individual with the best efficiency at the design point shows 3.3 efficiency surplus. However, the respective design has an undesirable normalized slope value close to zero and, thus, an expected flat characteristic curve. The other extreme shows an increase in the slope by more than a factor of four that is accompanied with efficiency decrements of more than three percentage points. It is to be noted that the design with the steepest normalized slope does not necessarily indicate the most favorable operating behavior. The reason for this is that the location of the turnover point of a speed line (change in sign of slope) remains uncertain unless a full-speed line calculation is performed. In fact, the turnover point of the design with the steepest normalized slope is reached at a higher mass flow rate than in the reference design. Based on speed line checks of selected designs of the pareto front, the highlighted design is finally selected. With a similar slope, it achieves a 2.9 higher efficiency compared to the original design. Figure 4 shows a comparison of the performance maps of both designs. The optimized design clearly leads to an efficiency gain for all speed lines. The exemplary shown turndown line for a constant pressure ratio of 2.2 indicates that the map width of the optimized stage () is comparable to that of the reference design ().
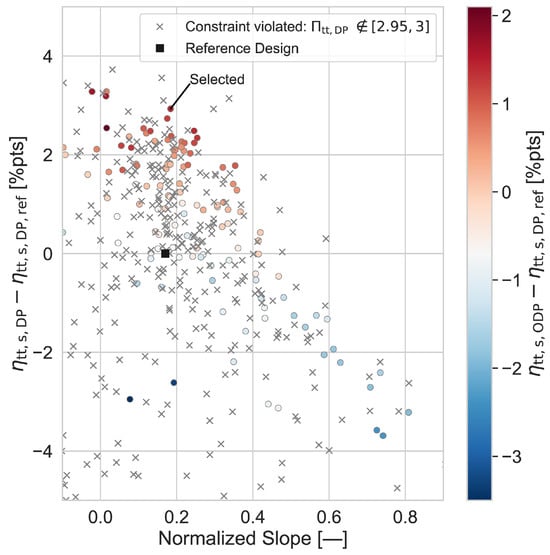
Figure 3.
Results of the multi-objective optimization with two objective functions.
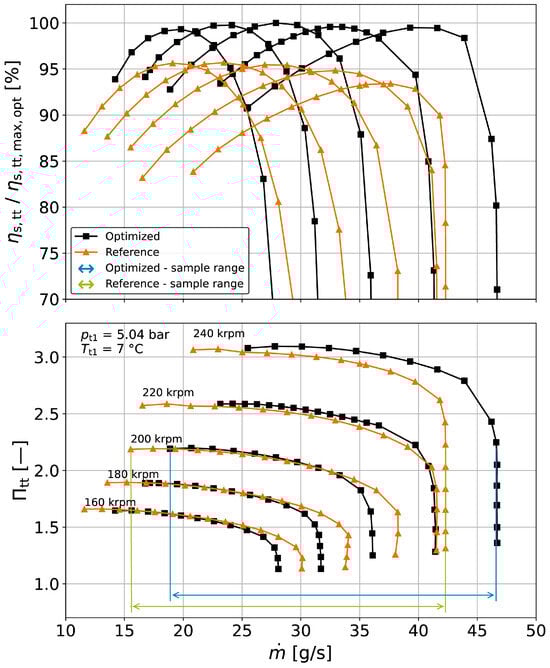
Figure 4.
CFD-derived performance map (hydr. smooth, = 50 μm) of the reference and the optimized design with exemplary turndown operation lines for constant-pressure ratio.
The main dimensions of the selected design and of the initial reference design are given in Table 2, while the meridional contours are shown in Figure 5. One of the most striking differences is the reduction in the vaneless diffuser diameter ratio from a reference value of 1.35 to a value of 1.19 in the optimized design. This can be explained by the relatively wide exit width of both designs with respect to the impeller diameter and the flow coefficient at the design operating condition. The optimized stage design has a relative exit width of that leads to flat absolute impeller exit flow angles around from the tangent at the design point. These values are around the lower end of the conventional design space. Hence, a short vaneless diffuser mitigates performance losses as a consequence of a long diffuser flow path. In addition, the expectable meridional head loss in the volute will be comparatively low, as the flow is still significantly directed in tangential orientation after a very short diffusion passage. The comparatively large exit width of the impeller in both designs is crucial for reducing efficiency losses due to the large relative blade-tip clearances in the extremely narrow channels in absolute terms.
Table 2.
Selected main dimensions of the reference and optimized compressor stage.
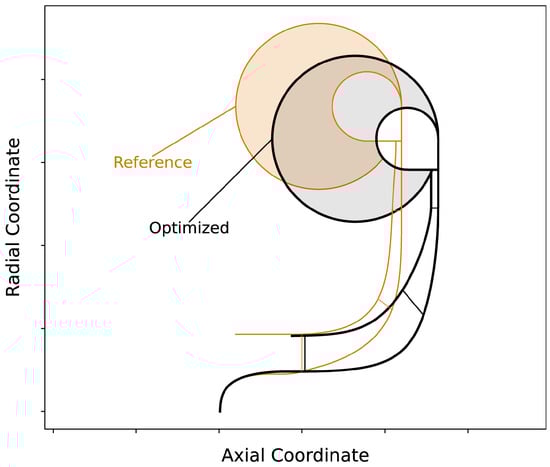
Figure 5.
Meridional contour of the optimized and reference design.
A significant degree of backsweep ( from meridional) was specified for the reference design in order to ensure a steep performance characteristic and reduced stage loading. In the optimized design, the backsweep is further enhanced by . Consequently, the impeller diameter is slightly increased. In the context of work input, the blade pairing count is increased by one, resulting in nine main and splitter blade pairings in the optimization. The accompanying reduction of impeller slip is a trade-off against potentially having surfaces with greater friction.
3.2. Axial Thrust Balancing and Seal Design
For compensation of axial forces, the compressor shaft inherits a self-acting, rigid gas thrust bearing. This allows it to operate at high-shaft-rotational speeds that reach up to 240 krpm. Since power losses due to disk friction are proportional to the third power of the thrust-bearing diameter, knowledge of the expected axial thrust is crucial for adequate sizing of the thrust bearing. One particular challenge is that the load capacity of the thrust bearing is variable and depends almost linearly on the rotational speed. Hence, expected axial thrust needs to be checked over a broad operating range.
Axial thrust is the result of all flow field-related forces acting on the impeller wheel and its shaft in an axial direction. Its calculation through a CFD simulation requires a computational model that takes into account not only the flow field on the front of the impeller, but also the flow field in the rear cavity of the impeller. The magnitude and direction of the force acting on the impeller back disk as a result of the respective pressure distribution depend on the flow resistance of the rear cavity. Ideally, the rear cavity is enclosed, so that there is no leakage flow and thus a seal is not necessary. However, this will result in considerable pressure accumulation in the rear cavity, ultimately leading to a comparatively high thrust force pushing the wheel outwards of the shaft direction. Preliminary CFD investigations with an enclosed rear cavity have shown that such a design is not possible under the given operating conditions, as the resulting thrust is more than four times greater than the bearings’ load capacity at nominal operation. Therefore, a measure is taken to balance the axial thrust of the compressor by means of a stepped labyrinth seal. It comprises successive seal fins and vortex chambers, which are placed at different seal radii inside a leakage flow path.
In the applied stepped seal configuration, the leakage flow path is connected to the compressor inlet. Hence, pressure drops from the high pressure level upstream of the seal to the lower pressure region downstream of the seal, which is comparable to the compressor inlet pressure. Overall, this reduces the force acting on the back disk. A depiction of the leakage flow path throughout the stepped seal and an exemplary, CFD-derived distribution of static pressure, normalized with the compressor inlet total pressure at design operating conditions is given in Figure 6.
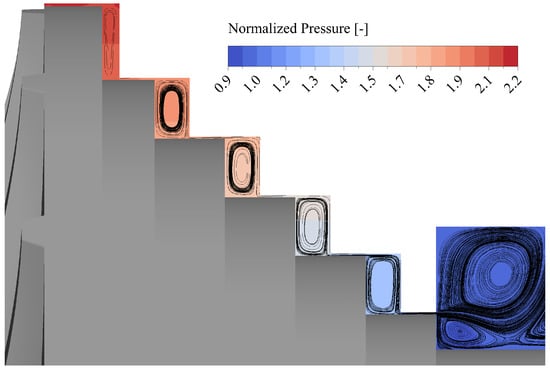
Figure 6.
Distribution of normalized pressure and tangential projection of streamlines in the impeller rear cavity including the stepped seal.
Adjustments to the inlet and outlet radius of the stepped seal are a decisive way of varying the back disk force in order to reduce the resulting thrust force. This is possible because the front disk force is comparatively insensitive with regard to changes in seal radii. The outlet of the stepped seal should be kept at a low radius to minimize the leakage areas for given seal clearances. For the applied stepped seal design, Figure 7 shows a contour plot with the distribution of the resulting net force for the expected operating range normalized with the allowable thrust-bearing load capacity at given rotational speed. All contour maps in this work are based on data interpolation via the triangulation functionality of the Matplotlib library v. 3.10 [20]. Please note possible sensitivities depending on the resolution and the distance from the underlying data. Overall, all resulting forces are kept well within the load capabilities of the thrust bearing. At the design point, almost a complete balance of axial forces is achieved. The highest utilization level is about 69%, which provides sufficient safety margin in the context of a demonstrator rig. It is seen for operation close to the maximum mass flow rates at low rotational speeds. For most parts of the operating map, the force vector has a positive sign, indicating that the wheel is pushed towards the shaft. Only close to the surge line at high rotational speed is it forced in outwards direction of the shaft. However, both force directions are equally viable.
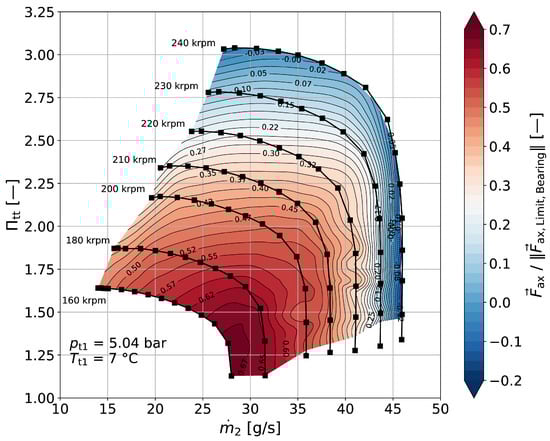
Figure 7.
Utilization level of the thrust bearing in the operating map.
The leakage ratio is about 4.7% at the design point. Changes in the leakage ratio across the entire operating map are shown in Figure 8. Leakage ratios increase as the surge limit is approached due to the higher pressure levels and they decrease as the choked flow conditions are approached. A further increase in the number of vortex chambers, as well as drastic shape adaptations to the seal, such as the trial of an interlocking seal, proved unsuccessful in achieving noteworthy reductions of overall leakage rates in a practical and feasible way from the manufacturing and assembly point of view. The main identified control parameters for leakage are the seal clearance and the seal radius, which are already in the spectrum of lower-end values.
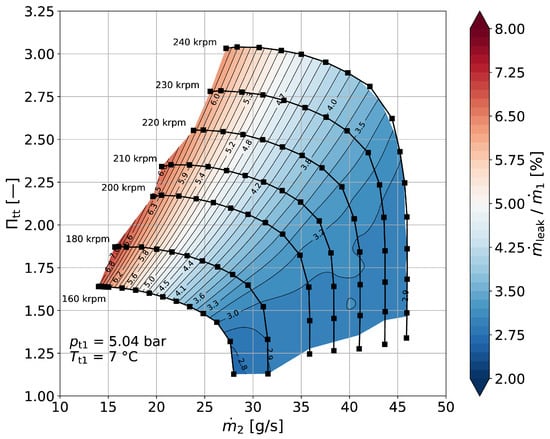
Figure 8.
Seal leakage ratio in the operating map.
3.3. Aerodynamic Performance
Figure 9 shows the performance map of the compressor stage, considering a nominal blade tip clearance of 40 μm (reduction of 10 μm compared to the optimization) and a mean roughness depth of 0.5 μm. As a result of the greater influence of the considered roughness opposed to the applied peak gap reduction, the characteristics are slightly shifted in the direction towards smaller pressure ratios compared to the unadapted design of the optimization. Furthermore, the characteristics are illustrated as a function of the usable outlet mass flow rate and thus show a mass flow reduction by the amount of leakage. The center of the high efficiency region is reached at a moderate speed of around 205 , indicating that the stage design is adequate for the operational speed range of the drive system.
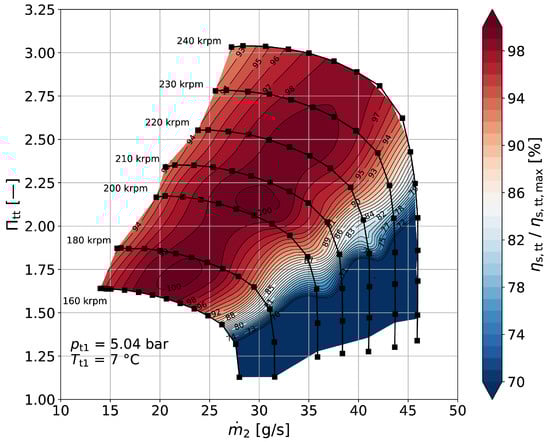
Figure 9.
CFD-derived performance map ( = 0.5 μm, = 40 μm) of the compressor stage.
Sensitivity assessments of the influences of mean roughness depth and blade tip clearance on peak isentropic stage efficiency as well as the corresponding pressure ratio are given through Figure 10 and Figure 11, respectively. Both investigations are based on speed line assessments for the maximum rotational speed of 240 krpm. In line with expectations of high-chord Reynolds numbers (see Table 1), the performance is very sensitive to surface roughness. Compared to the idealized case of a hydraulically smooth surface, the nominal surface roughness of 0.5 μm leads to a decrement of around 4 in peak efficiency and pressure ratio. Since the decrements of the characteristics appear steep and non-linear up to a value of ≈ 1 μm, maintaining the nominal value of roughness in manufacturing is important to prevent performance deviations in the given design spectrum.
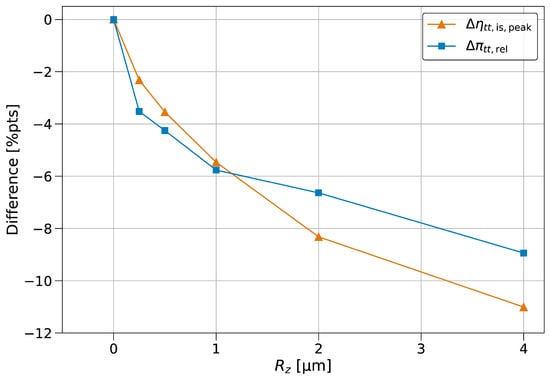
Figure 10.
Changes in peak efficiency and associated pressure ratio with mean roughness depth.
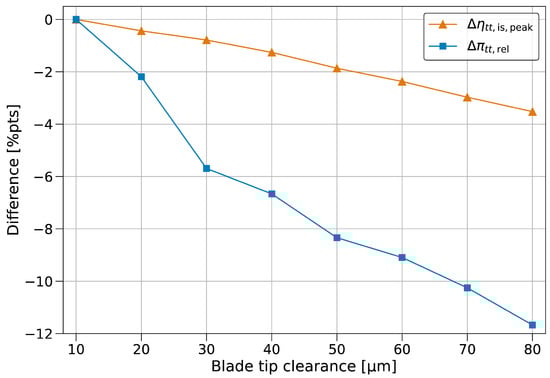
Figure 11.
Changes in peak efficiency and associated pressure ratio with blade tip clearance.
Compared to a sophisticated blade tip clearance of 10 μm, increasing the blade tip clearance by 10 μm indicates a reduction in the pressure ratio by up to 2 within the technically feasible range of clearance gaps between 30 μm and 80 μm. Considering peak efficiency, an almost linear decline of around 1 from the reference is identified for a 10 μm increase in clearance over the complete investigated range. These values give an indication of possible performance losses due to deviations from the nominal geometry in manufacturing and operation.
4. Experimental Validation
To validate the design process and to demonstrate the capabilities of the presented compressor design, a prototype was built and tested. A front view of the wheel and the electric motor is shown in Figure 12. The electric drive system platform P2, currently developed at ebm-papst [8], is used. The rigid gas bearing system was modified to work in R-290. Particular attention was paid to minimizing bearing clearances to enable the small blade-tip clearances.
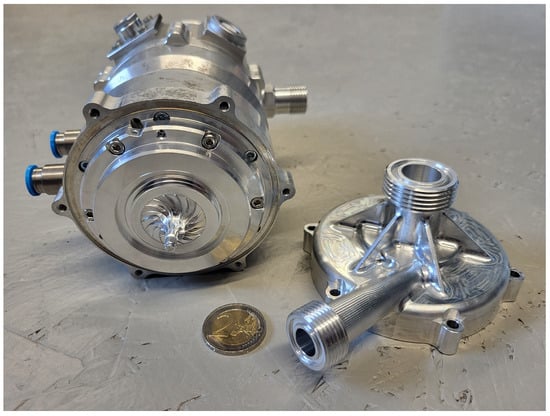
Figure 12.
Compressor prototype.
A schematic of the test rig is shown in Figure 13. While the inlet and outlet temperatures of the compressor are measured with PT100 sensors, the pressure is measured with absolute pressure sensors. The compressor unit has an internal leakage flow path to connect the bearing and motor cavity with the compressor inlet. This way, the gas at the bearing is not subject to compressor outlet pressure, but to the lower compressor inlet pressure. This helps to reduce losses and increase the stability of the bearing. The leakage mass flow rate is minimized by the seal on the backside of the compressor wheel. To allow accurate compressor performance evaluation, the leakage mass flow rate, pressure, and temperature are also measured. All mass flow rates are measured with coriolis mass flow meters. Two parallel outlet throttles allow the precise control of the compressor pressure ratio. A water heat exchanger controls the compressor inlet temperature. To keep the compressor inlet pressure constant over a wide range of pressure ratios, it is necessary to control the amount of R-290 in the test rig. Increasing the pressure ratio of the compressor changes the distribution of R-290 in the test rig. At higher pressure ratios, more R-290 is accumulated in the high-pressure section between the compressor and the outlet throttles. This results in a pressure drop in the low-pressure section. To compensate for this effect and maintain a constant inlet pressure, an inlet pressure-control reservoir adds or removes refrigerant from the low-pressure section. In order to exclude the possibility of refrigerant entering the compressor in its liquid state, a fluid separator is included. A pressure relief valve can short-circuit the compressor to quickly unload the compressor and prevent further damage in case of an emergency shutdown.
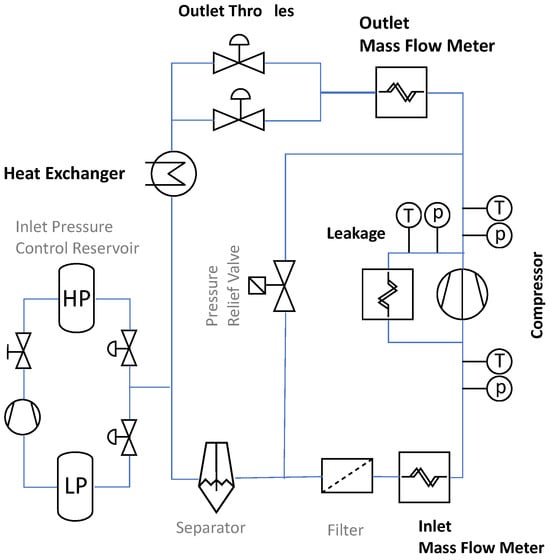
Figure 13.
Schematic of the R-290 compressor test rig.
The test results with a comparison to CFD are shown in Figure 14, Figure 15 and Figure 16. Test data is shown with orange lines including the error bars, which indicate the systematic measurement uncertainty. The CFD data is interpolated to exactly match the speed lines of the test without the need for dedicated speed line simulations. In refrigeration applications, the compressor inlet conditions vary significantly with the operating point. Depending on the temperature of the heat sink, the evaporator temperature and pressure change. To account for these changes in the inlet conditions and to make the data comparable, the test data is corrected to nominal inlet conditions. For real gases, this is implemented for the mass flow rate, rotational speed, and pressure ratio, based on similarities between the non-dimensional performance parameters , , and . Since the equations of state are not trivial, the use of a fluid property data base like CoolProp [21] is convenient. The rotational speed is corrected to reference inlet conditions by assuming similarity of the tip speed Mach number ; see Equation (4). The correction of rotational speed is then only a function of the actual rotational speed and the respective speeds of sound of the fluid and at the reference and actual inlet condition.
Analogously, the mass flow rate is corrected assuming the similarity of flow coefficient , as defined in Equation (6).
Finally, similarity concerning isentropic work coefficient defined in Equation (8) allows us to correct isentropic enthalpy rise and, consequently, the compressor pressure ratio (). In case of an ideal gas, a correction of the specific pressure ratio is not necessary due to constant specific heat. For real gases, however, this is not the case.
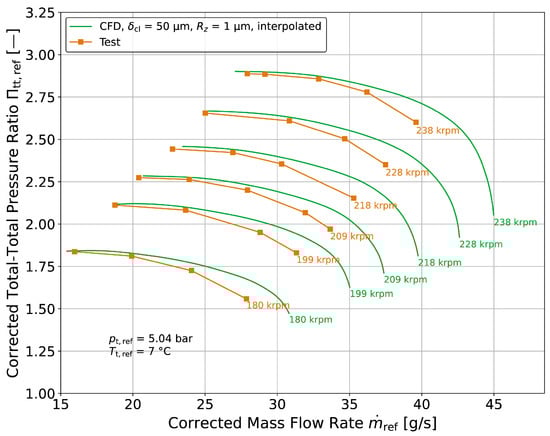
Figure 14.
Test results of corrected total pressure ratio compared with CFD results.
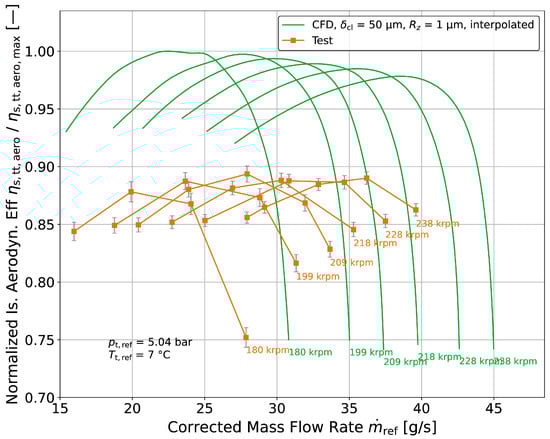
Figure 15.
Test results of normalized isentropic aerodynamic efficiency compared with CFD results.
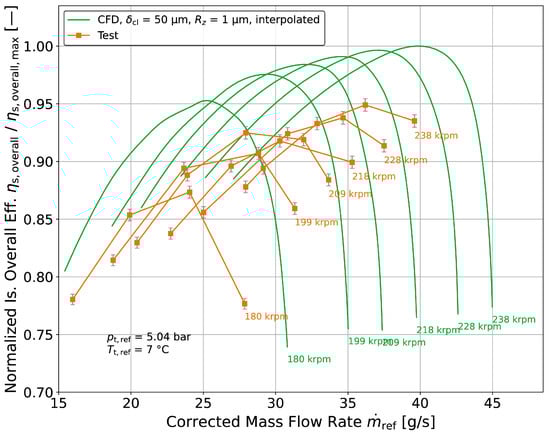
Figure 16.
Test results of normalized isentropic overall efficiency compared with CFD results.
Figure 14 compares the corrected pressure ratio of the test data and simulation. The measured maximum pressure ratio is about 2.9 at 28 / and therefore a bit lower and at a slightly lower mass flow rate than at the design point in the optimization. Based on the sensitivity study shown in Figure 10 and Figure 11, it was found that the test data can be matched best with CFD by a slightly increased blade tip clearance of 50 μm and at a slightly higher overall surface roughness of = 1 μm. Since this variation is within the uncertainty of the state of the prototype hardware, it is reasonable to assume that the tested hardware did indeed have a slightly larger blade-tip clearance and surface roughness than expected. However, the offsets of the choked flow mass flow rates between the test and CFD indicate additional causes of deviation, which were not evaluated yet. In the test, the unit was not driven into surge to avoid damage to the prototypes. The test data therefore does not represent the surge limit. It does, however, represent a reasonable limit of stable operation, where, upon further reduction of mass flow, indications of stalling were present; these included a change in the noise and vibrations of the compressor housing. The stability limit of the CFD data was defined at zero slope of the speed lines. These limits seem to have good agreement between the test and CFD, which validates the approach used to define the stability limit of the CFD compressor maps.
To evaluate compressor performance, two different efficiency definitions are used. Figure 15 shows the normalized, isentropic aerodynamic efficiency of the compressor as defined in Equation (11). This measure is used to evaluate the aerodynamic performance of the compressor. It only considers the compressor inlet and outlet condition, disregarding effects due to leakage mass flow. Since the compressor power is determined using the outlet temperature, it is sensitive to heat transfer. This makes direct comparison to the adiabatic CFD difficult.
Figure 15 shows that although the shape of the speed lines and the location of the maximum value match, the predicted values are up to 10% higher than measured. A large contribution to this deviation is attributed to diabatic effects. The exact heat transfer to the compressor during the measurement is not known and therefore cannot be fully corrected. Other contributing effects are under investigation.
Another measure of performance used is the isentropic overall efficiency shown in Equation (12). It relates the isentropic compression work to the electric input power. This measure is much less sensitive to heat transfer effects. Only the isentropic compression work is slightly influenced by heat transfer due to the change in the pressure rise resulting from diabatic compression compared to adiabatic compression. Unlike Equation (11), the input power is practically unaffected. The overall efficiency accounts for the influences of leakage and losses of the compressor back disk seal by only considering the compressor outlet mass flow rate as useful work. Hence, a higher leakage mass flow rate results in a decreased overall efficiency by increasing the required input power. The overall efficiency considers the aerodynamic performance as well as the losses generated in the bearing system, the electric motor, and the power electronics. For a comparison between test and simulation, these losses are modeled for each component to predict an overall efficiency based on the compressor simulation data [8].
Figure 16 shows a comparison of the measured and predicted normalized overall efficiency. Similar to aerodynamic efficiency, the trends and the location of the peak efficiencies agree well between CFD and test, while the measured levels are lower than predicted. It can be seen that the trend is different to the aerodynamic efficiency, as the overall efficiency decreases towards lower rotational speeds. This is caused by the increased relative losses of the drive system at lower speeds. It is also worth noting that the difference between prediction and test is smaller for the overall efficiency than for the aerodynamic efficiency. Since the overall efficiency is less sensitive to diabatic effects than the aerodynamic efficiency, this affirms the presumption that heat transfer is a significant cause for the difference between predicted and measured aerodynamic efficiency. The differences in predicted and measured overall efficiency are attributed to the accumulated differences between modeled and measured losses of the bearing system, the electric motor, and the power electronics, together with the non-heat transfer-related aerodynamic efficiency differences.
5. Conclusions
The design process, design challenges, and the resulting design of a single-stage centrifugal compressor demonstrator for a R-290 refrigeration application were presented. The overall process and performance were validated using test results. It was shown that for such small compressors, blade-tip clearance, surface roughness, and heat transfer have a significant influence on the performance and the agreement between test and simulation. It is therefore desirable to minimize these effects during the design process by targeting designs with a comparably high exit blade height and low surface area. For future refrigeration applications, the presented design approach will be extended to two-stage compressor designs. These designs will also focus more on achieving the required map width to cover the wide heating power modulation required for refrigeration applications.
Author Contributions
Conceptualization, R.E.K., S.T. and A.Ç.; methodology, R.E.K. and S.T.; software, R.E.K. and S.T.; validation, R.E.K., S.T. and A.Ç.; formal analysis, R.E.K. and S.T.; investigation, R.E.K. and S.T.; resources, A.Ç.; data curation, R.E.K. and S.T.; writing—original draft preparation, R.E.K., S.T. and A.Ç.; writing—review and editing, R.E.K., S.T. and A.Ç.; visualization, R.E.K. and S.T.; supervision, S.T. and A.Ç.; project administration, S.T. and A.Ç.; funding acquisition, A.Ç. All authors have read and agreed to the published version of the manuscript.
Funding
This research received no external funding.
Institutional Review Board Statement
Not applicable.
Informed Consent Statement
Not applicable.
Data Availability Statement
The original contributions presented in this study are included in the article. Further inquiries can be directed to the corresponding author(s).
Acknowledgments
The authors would like to thank all colleagues at ebm-papst who contributed to this work.
Conflicts of Interest
All authors were employed by the company ebm-papst Mulfingen GmbH & Co. KGaA & Co. KG.
Nomenclature
The following nomenclature is used in this manuscript:
| Roman characters | |
| a | Speed of sound |
| Impeller exit width | |
| c | Chord length |
| Impeller tip diameter | |
| F | Force |
| h | Specific enthalpy |
| Mass flow rate | |
| n | Rotational speed |
| Electric input power | |
| p | Pressure |
| Specific gas constant | |
| Mean roughness depth | |
| s | Specific entropy |
| T | Temperature |
| Impeller tip speed | |
| Volumetric flow rate | |
| v | Specific volume |
| w | Velocity in relative frame |
| Z | Compressibility factor |
| Zbl,pairs | Number of blade pairs |
| Greek characters | |
| Blade tip clearance | |
| Kinematic viscosity | |
| Compressor pressure ratio | |
| Fluid density | |
| Subscripts | |
| 1 | Compressor inlet |
| 2 | Compressor outlet |
| act | Actual conditions |
| ax | Axial |
| CH | Choke |
| DP | Design point |
| ODP | Off-design point |
| ref | Reference conditions |
| s | Isentropic |
| t | Total conditions |
| TD | Turndown |
| tip | Tip span |
| Dimensionless Groups | |
| Specific diameter | |
| Tip speed Mach number | |
| Specific speed | |
| Flow coefficient | |
| Isentropic work coefficient | |
| Chord Reynolds number | |
Abbreviations
The following abbreviations are used in this manuscript:
| CFD | Computational fluid dynamics |
| EU27 | Member states of the European Union |
| GWP | Global warming potential |
| HFC | Hydrofluorocarbons |
| PFAS | Per- and polyfluorinated substances |
| PMSM | Permanent magnet synchronous motors |
| RANS | Reynolds-averaged Navier-Stokes |
| VCR | Vapor compression refrigeration |
| VLD | Vaneless diffuser |
References
- United Nations. Transforming Our World: The 2030 Agenda for Sustainable Development. 2015. Available online: https://sdgs.un.org/2030agenda (accessed on 29 July 2025).
- European Comission. The European Green Deal. 2019. Available online: https://eur-lex.europa.eu/legal-content/EN/TXT/?uri=CELEX:52019DC0640 (accessed on 29 July 2025).
- European Environment Agency. EEA Greenhouse Gases—Data Viewer. Available online: https://www.eea.europa.eu/data-and-maps/data/data-viewers/greenhouse-gases-viewer (accessed on 29 July 2025).
- European Parliament and Council of European Union. Regulation (EU) No. 573/2024. 2024. Available online: https://eur-lex.europa.eu/eli/reg/2024/573/oj (accessed on 29 July 2025).
- Teichel, S.; Karaefe, R.E.; Çokşen, A. Design and testing of a compact, reverse brayton cycle, air (R729) cooling machine. J. Eng. Gas Turbines Power 2024, 147, 081006. [Google Scholar] [CrossRef]
- Wetzel, M. Influence of Fully Miscible Lubrication Oil on Flow Boiling of CO2 Inside Horizontal Evaporator Tubes. Ph.D. Thesis, Karlsruher Institut für Technologie, Karlsruhe, Germany, 2017. [Google Scholar] [CrossRef]
- Schiffmann, J.; Favrat, D. Design, experimental investigation and multi-objective optimization of a small-scale radial compressor for heat pump applications. Energy 2010, 35, 436–450. [Google Scholar] [CrossRef]
- Teichel, S.; Çokşen, A.; Handschuh, P. Compressor design for compact, highspeed electric motors. In Proceedings of the ASME Turbo Expo 2023: Turbomachinery Technical Conference and Exposition, Boston, MA, USA, 26–30 June 2023. [Google Scholar] [CrossRef]
- Karaefe, R.E.; Teichel, S.; Çokşen, A. Design of a Small-Scale, High-Rotational-Speed Centrifugal Compressor Operating with R-290. In Proceedings of the 16th European Turbomachinery Conference, paper no. ETC16-294, Hannover, Germany, 24–28 March 2025; Available online: https://www.euroturbo.eu/publications/conference-proceedings-repository/ (accessed on 29 July 2025).
- DIN EN 14511-2:2023-08; Air Conditioners, Liquid Chilling Packages and Heat Pumps for Space Heating and Cooling and Process Chillers, with Electrically Driven Compressors—Part 2: Test Conditions; German Version. DIN—Deutsches Institut für Normung e.V.: Berlin, Germany, 2023. [CrossRef]
- Balje, O.E. Turbomachines: A Guide to Design Selection and Theory; Wiley: New York, NY, USA, 1981. [Google Scholar]
- Casey, M.V.; Robinson, C.J. A unified correction method for Reynolds number, size, and roughness effects on the performance of compressors. Proc. Inst. Mech. Eng. A J. Power Energy 2011, 225, 864–876. [Google Scholar] [CrossRef]
- Lüdtke, K. Process Centrifugal Compressors: Basics, Function, Operation, Design, Application; Springer: Berlin/Heidelberg, Germany, 2004. [Google Scholar]
- CFturbo GmbH. CFturbo Version 2023 R1.1. 2023. Available online: http://www.cfturbo.com (accessed on 29 July 2025).
- ANSYS, Inc. ANSYS TurboGrid Version 2023 R1. 2023. Available online: https://www.ansys.com/products/fluids/ansys-turbogrid (accessed on 29 July 2025).
- ANSYS, Inc. ANSYS Fluent Version 2023 R1. 2023. Available online: https://www.ansys.com/products/fluids/ansys-fluent (accessed on 29 July 2025).
- ANSYS, Inc. ANSYS CFX Version 2023 R1. 2023. Available online: https://www.ansys.com/products/fluids/ansys-cfx (accessed on 29 July 2025).
- Lemmon, E.W.; Bell, I.H.; Huber, M.L.; McLinden, M.O. NIST Standard Reference Database 23: Reference Fluid Thermodynamic and Transport Properties-REFPROP, Version 10.0, National Institute of Standards and Technology, Gaithersburg, 2018; Available online: https://doi.org/10.18434/T4/1502528 (accessed on 29 July 2025).
- Adams, T.; Grant, C.; Watson, H. A simple algorithm to relate measured surface roughness to equivalent sand-grain roughness. Int. J. Mech. Eng. Mechatron. 2012, 1, 66–71. [Google Scholar] [CrossRef]
- Hunter, J.D. Matplotlib: A 2D graphics environment. Comput. Sci. Eng. 2007, 9, 90–95. [Google Scholar] [CrossRef]
- Bell, I.H.; Wronski, J.; Quoilin, S.; Lemort, V. Pure and pseudo-pure fluid thermophysical property evaluation and the open-source thermophysical property library CoolProp. Ind. Eng. Chem. Res. 2014, 53, 2498–2508. [Google Scholar] [CrossRef] [PubMed]
Disclaimer/Publisher’s Note: The statements, opinions and data contained in all publications are solely those of the individual author(s) and contributor(s) and not of MDPI and/or the editor(s). MDPI and/or the editor(s) disclaim responsibility for any injury to people or property resulting from any ideas, methods, instructions or products referred to in the content. |
© 2025 by the authors. Published by MDPI on behalf of the EUROTURBO. Licensee MDPI, Basel, Switzerland. This article is an open access article distributed under the terms and conditions of the Creative Commons Attribution (CC BY-NC-ND) license (https://creativecommons.org/licenses/by-nc-nd/4.0/).