
“Attention! A Door Could Open.”—Introducing Awareness Messages for Cyclists to Safely Evade Potential Hazards


Abstract
:
1. Introduction
2. Related Work
2.1. Dooring Accidents
2.2. Hazard Notifications
2.2.1. Definition of Hazard Notifications
2.2.2. Hazard Notifications for Cyclists
2.3. Connected Traffic
3. Research Methodology
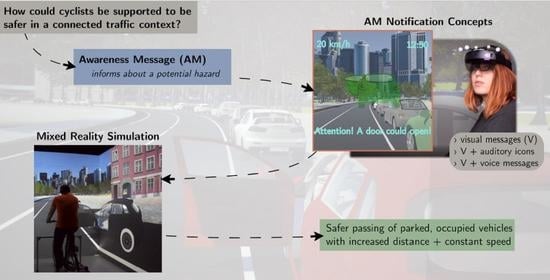
3.1. Awareness Message Concepts
3.1.1. Message Structure and Timing
3.1.2. Visual Representation
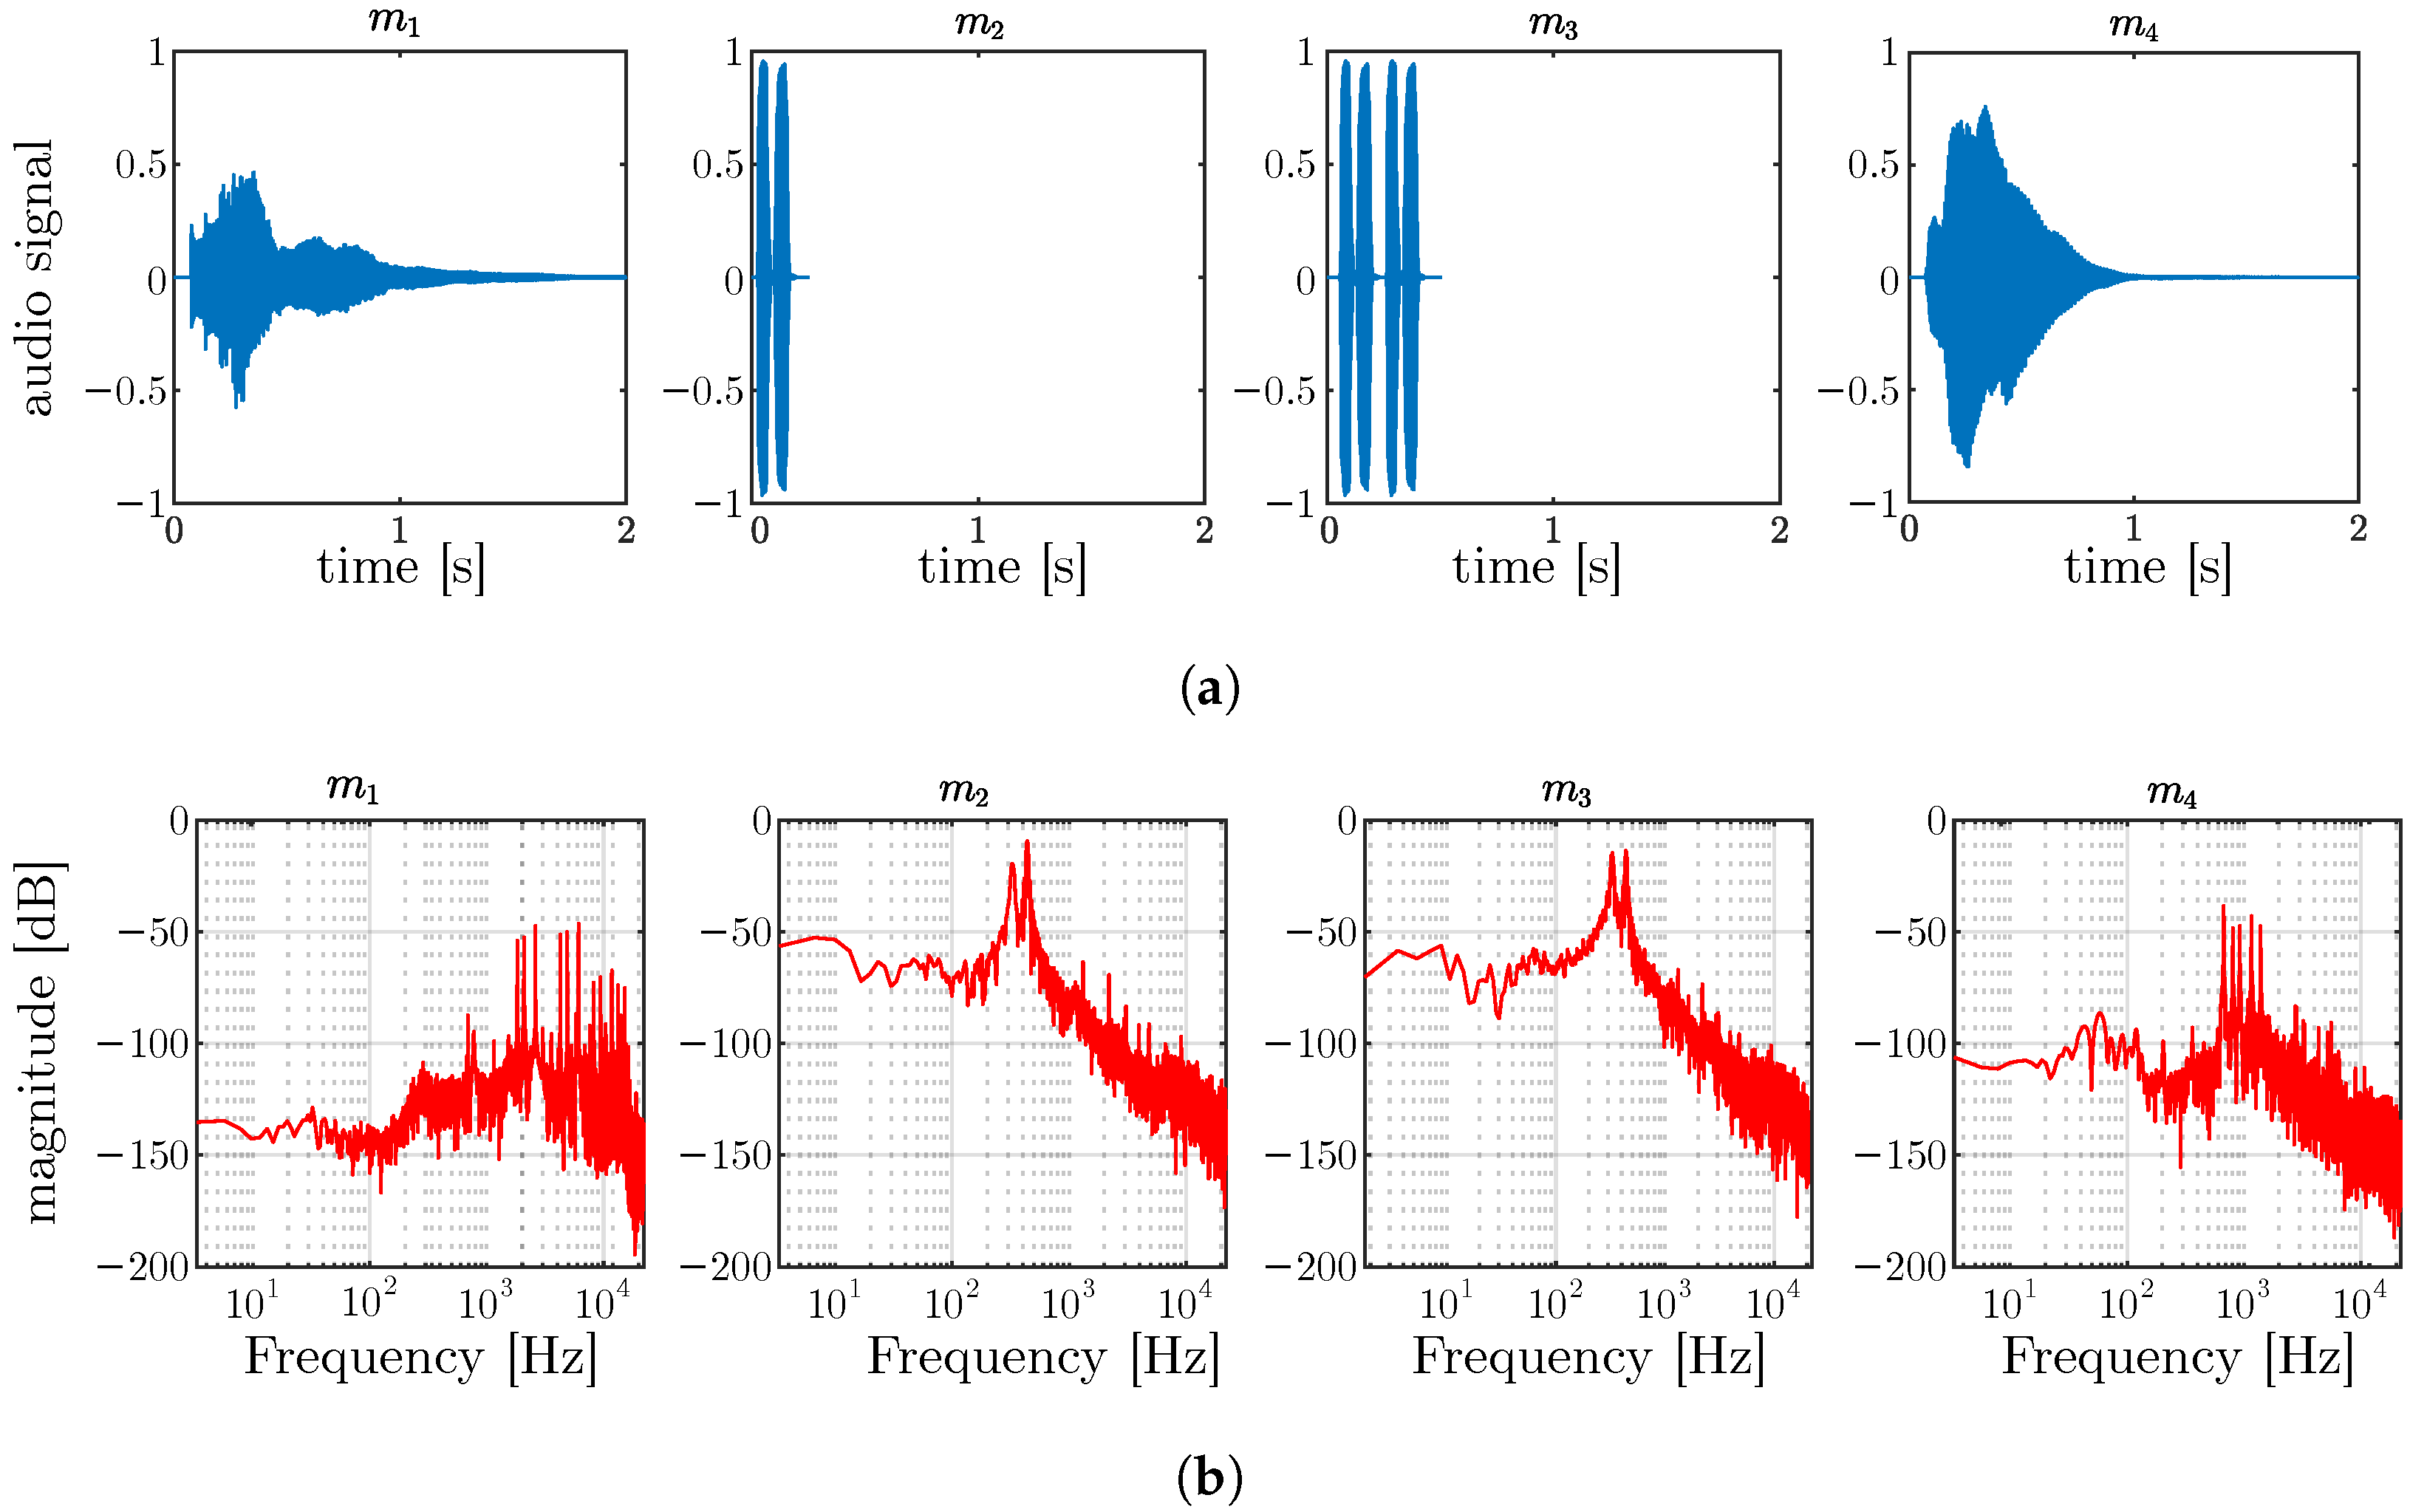
3.1.3. Combination with Auditory Cues
3.2. Hypotheses
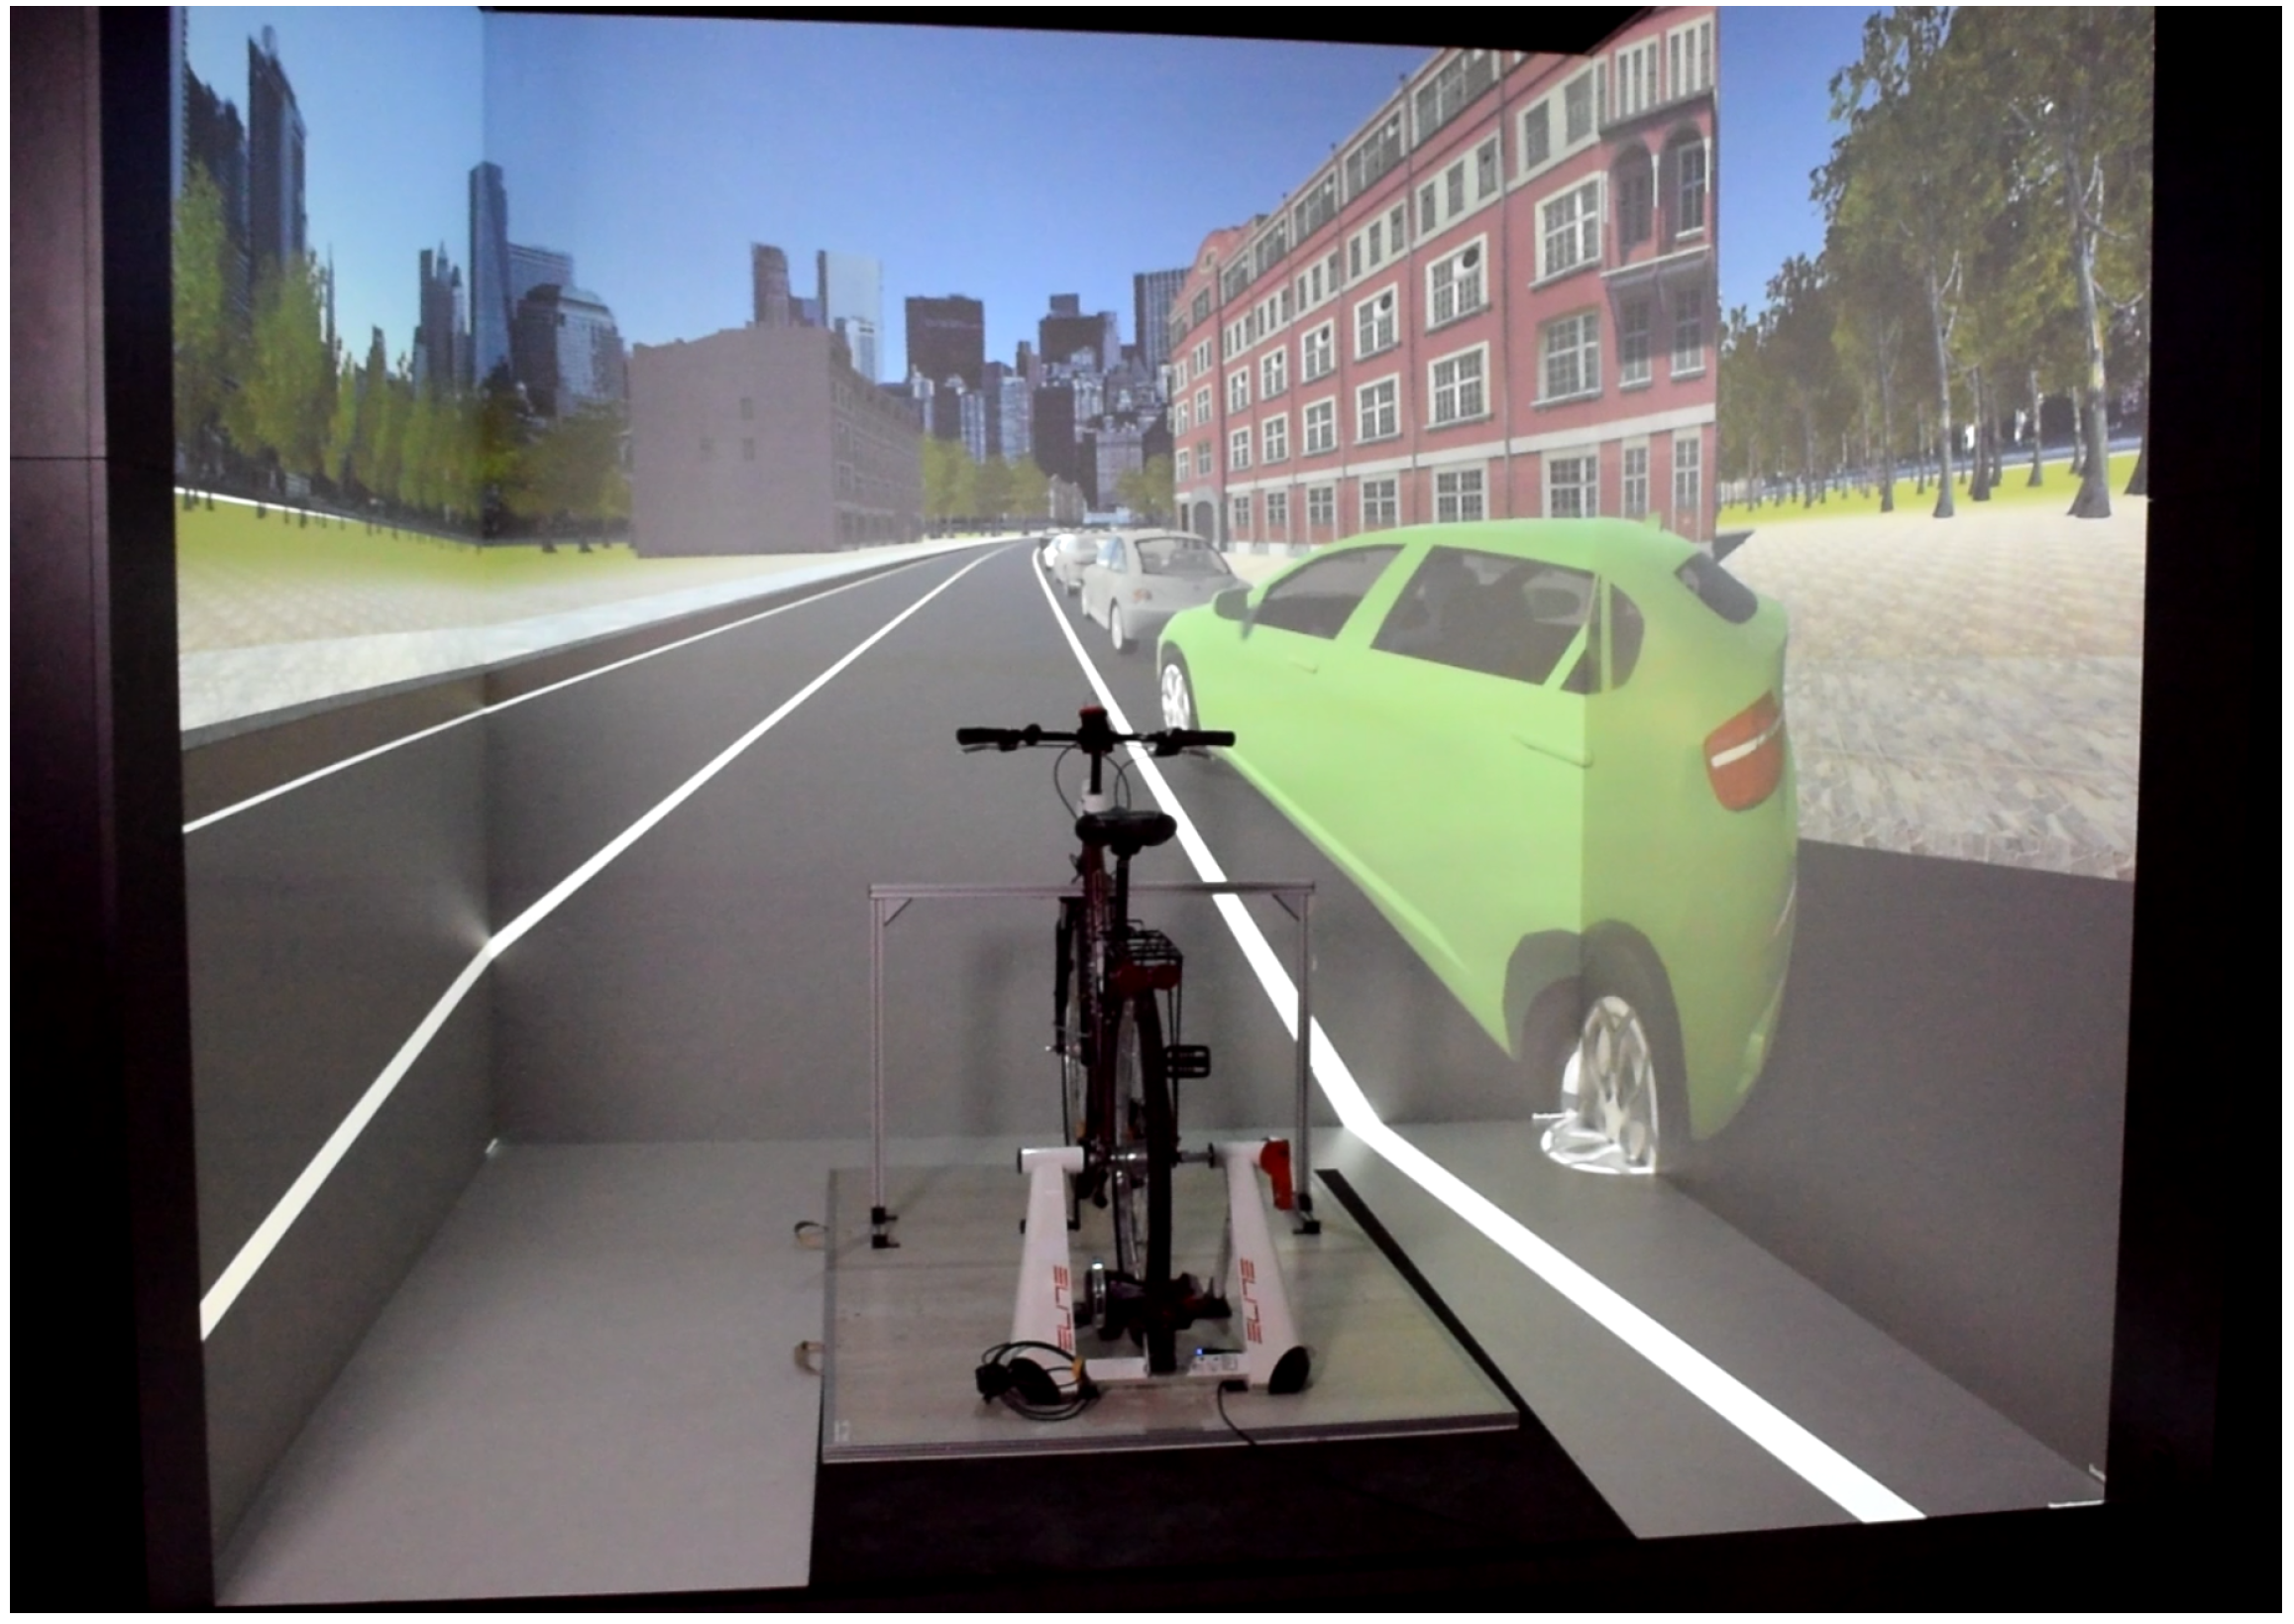
3.3. Apparatus
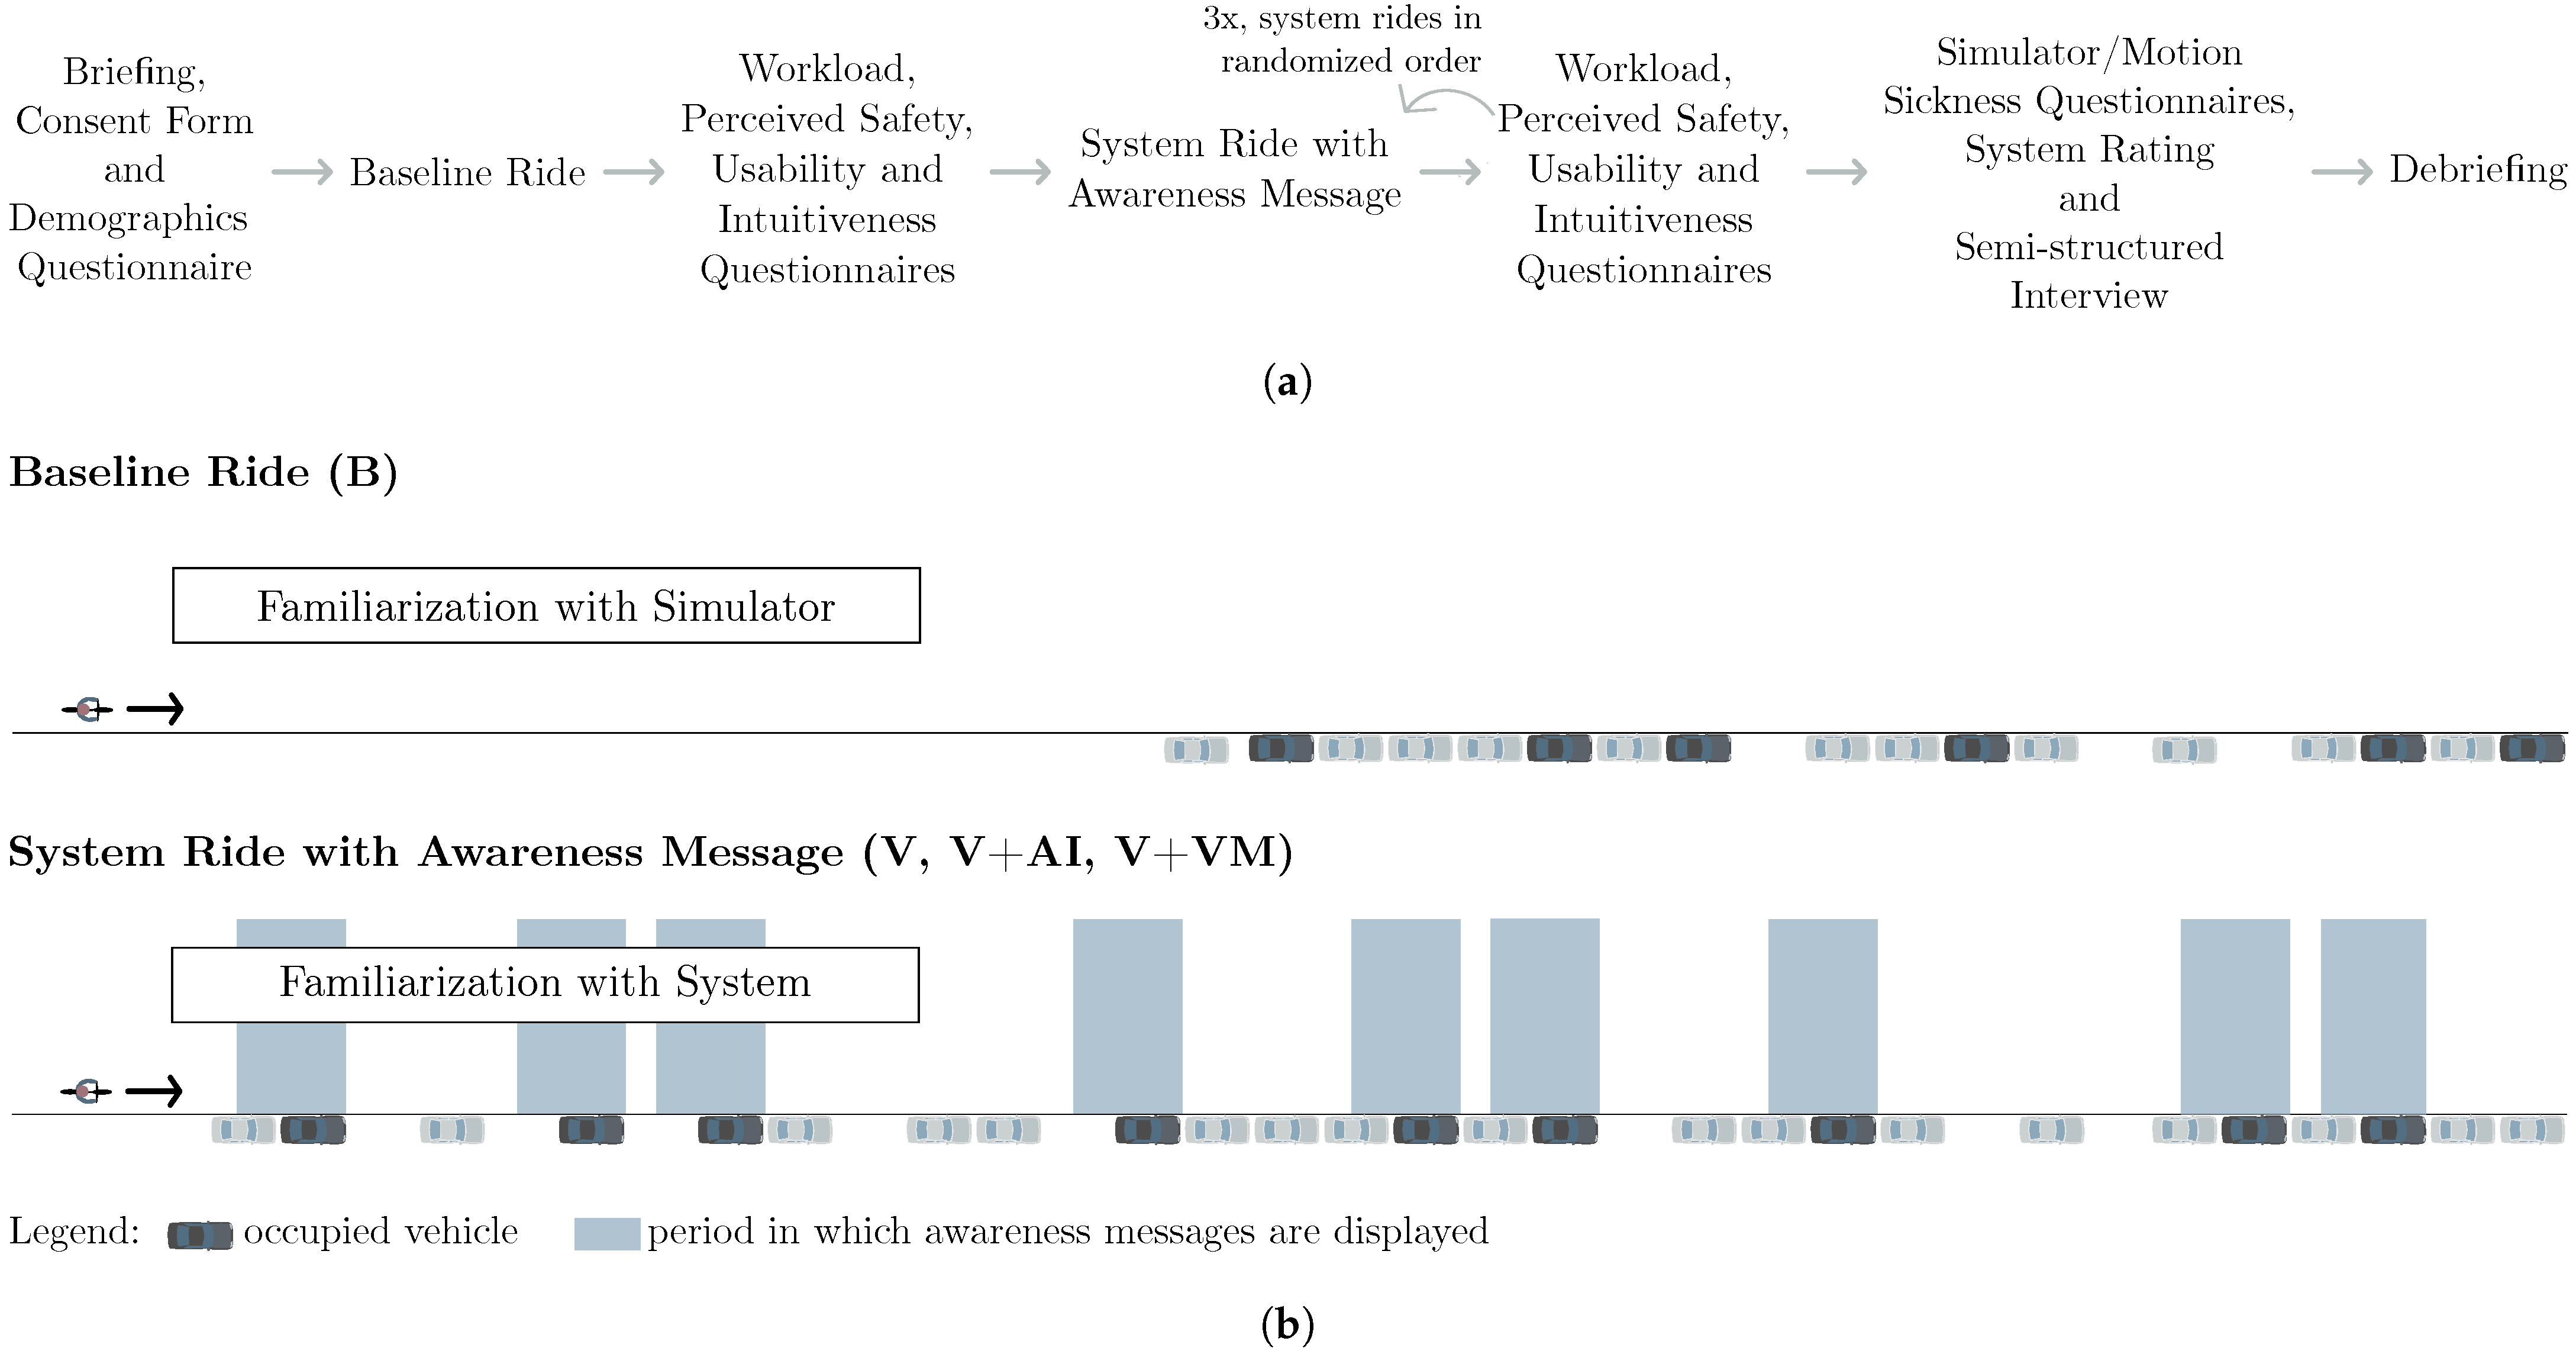
3.4. Track Design and Door Openings
3.5. Questionnaires and Measurements
3.6. Study Procedure
4. Results
4.1. Participants
4.2. Cycling Behavior
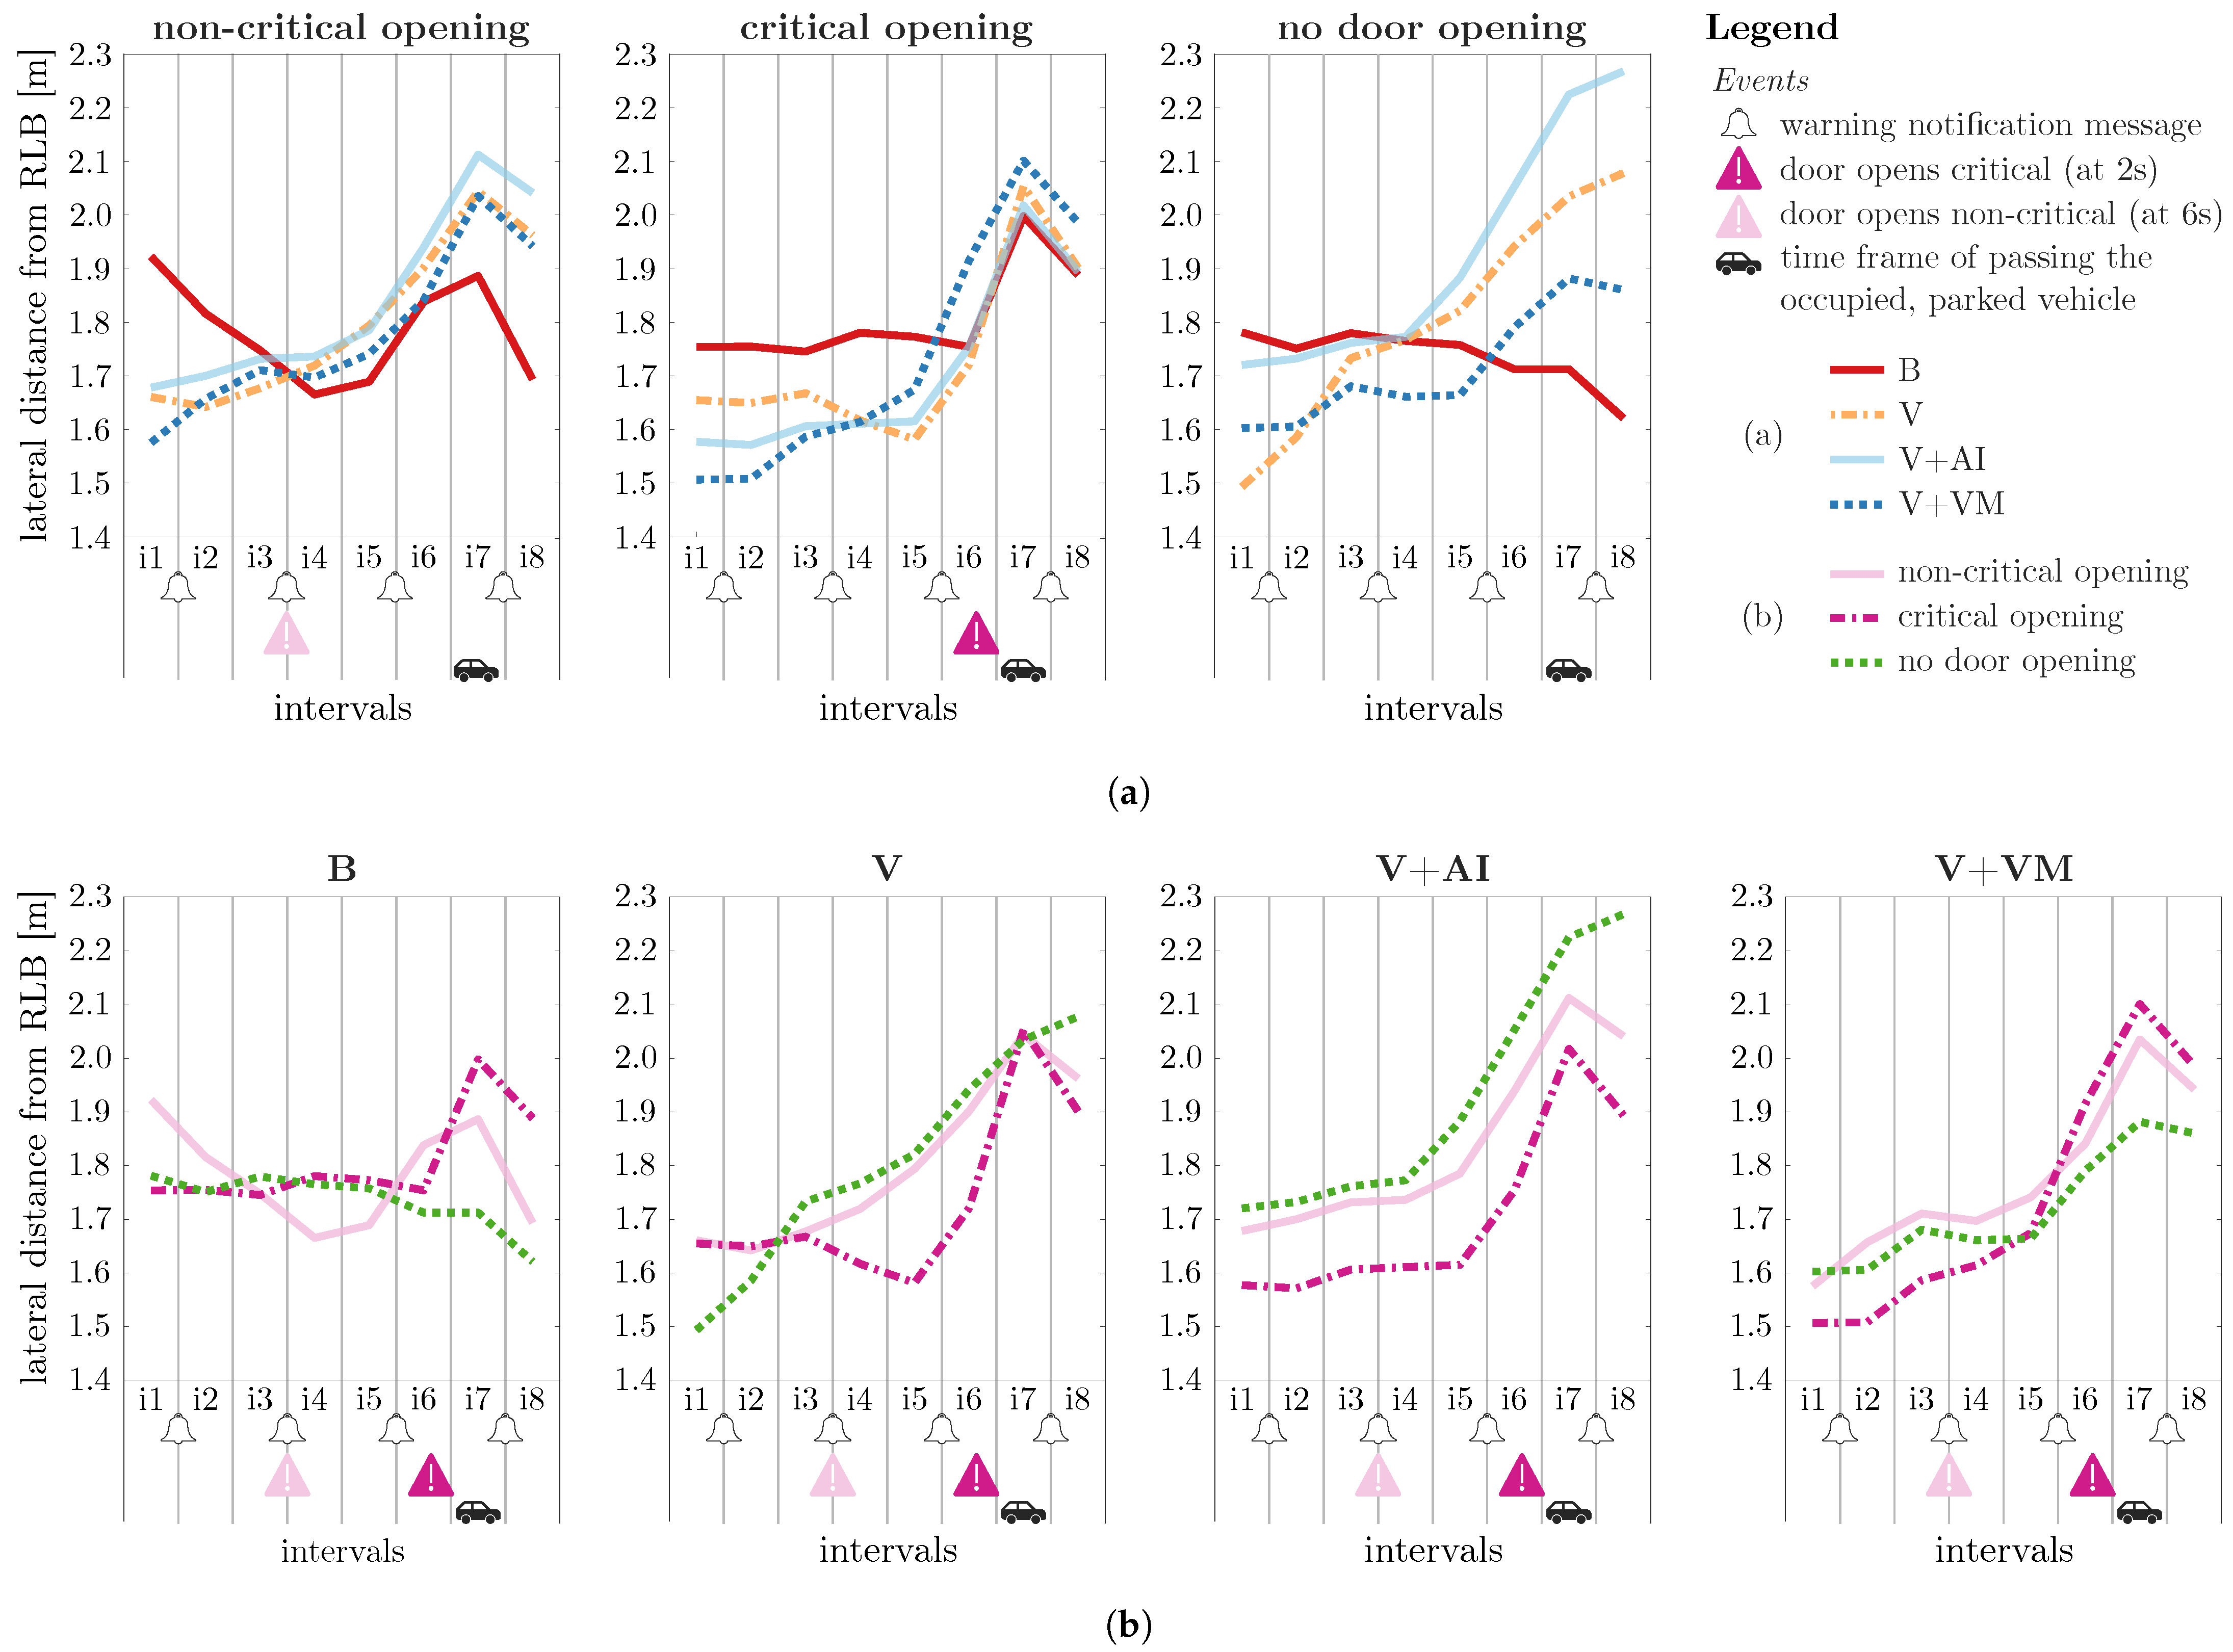
4.2.1. Lateral Position Mapping
4.2.2. Lateral Position during Active Awareness Messages
4.2.3. Standard Deviation of Lateral Position
4.2.4. Cycling Speed
4.3. Motion/Simulator Sickness
4.4. Perceived Safety and Workload
4.5. User Experience and Intuitiveness
4.6. Semi-Structured Interviews
4.6.1. Preferred AM System
4.6.2. Timings of the AMs
4.6.3. Warnings for Multiple Hazard Notifications
4.6.4. Attitude towards Using C-HMDs
5. Discussion
5.1. Impact of Awareness Messages on Cycling Performance
5.2. Perceived Safety and Workload
5.3. Usability of AM Notifications
5.4. Responsibility
5.5. Narrow Bike Lanes
5.6. Effectiveness of Awareness Messages and “False Positives”
5.7. Limitations
5.8. Future Work and Outlook
6. Conclusions
Supplementary Materials
Author Contributions
Funding
Institutional Review Board Statement
Informed Consent Statement
Data Availability Statement
Conflicts of Interest
Abbreviations
| AM | Awareness Message |
| B | Baseline |
| CAVE | Cave Automatic Virtual Environment |
| C-HMD | Cyclist Head-/Helmet-Mounted Display |
| CTAM | Car Technology Acceptance Model |
| HMI | Human Machine Interface |
| ITS | Intelligent Transport System |
| LP | Lane Position |
| MLP | Mean Lateral Position |
| NASA-TLX | NASA Task Load Index |
| RLB | Right Lane Boundary |
| SDLP | Standard Deviation of Lane Position |
| TOST | Two One-Sided Tests |
| TTC | Time to Collision |
| UEQ | User Experience Questionnaire |
| V | Visual Message |
| V + AI | Visual Message and Auditory Icon |
| VRU | Vulnerable Road User |
| V + VM | Visual and Voice Message |
References
- Koglin, T. City Cycling. Eur. Plan. Stud. 2014, 22, 227–228. [Google Scholar] [CrossRef]
- Pucher, J.; Buehler, R. Cycling towards a more sustainable transport future. Transp. Rev. 2017, 37, 689–694. [Google Scholar] [CrossRef] [Green Version]
- Vissers, L.; van der Kint, S.; van Schagen, I.; Hagenzieker, M.P. Safe Interaction between Cyclists, Pedestrians and Automated Vehicles. What Do We Know and What Do We Need to Know? SWOV Institute for Road Safety Research: The Hague, The Netherlands, 2017. [Google Scholar] [CrossRef]
- European Transport Safety Council. How Safe is Walking and Cycling in Europe? PIN Flash Report 38; European Transport Safety Council: Etterbeek, Belgium, 2020. [Google Scholar]
- Lawrence, B.M.; Oxley, J.A.; Logan, D.B.; Stevenson, M.R. Cyclist exposure to the risk of car door collisions in mixed function activity centers: A study in Melbourne, Australia. Traffic Inj. Prev. 2018, 19, 164–168. [Google Scholar] [CrossRef] [PubMed]
- Scholliers, J.; Bell, D.; Morris, A.; Garcia-Melendez, A.B. Potential of ITS to Improve Safety and Mobility of VRUs. In Proceedings of the 10th ITS European Congress, Helsinki, Finland, 16–19 June 2014. [Google Scholar]
- Matviienko, A.; Ananthanarayan, S.; Borojeni, S.S.; Feld, Y.; Heuten, W.; Boll, S. Augmenting Bicycles and Helmets with Multimodal Warnings for Children. In Proceedings of the 20th International Conference on Human-Computer Interaction with Mobile Devices and Services Adjunct, MobileHCI 2018, Barcelona, Spain, 3–6 September 2018. [Google Scholar] [CrossRef]
- von Sawitzky, T.; Wintersberger, P.; Löcken, A.; Frison, A.K.; Riener, A. Augmentation Concepts with HUDs for Cyclists to Improve Road Safety in Shared Spaces. In Proceedings of the Extended Abstracts of the 2020 CHI Conference on Human Factors in Computing Systems, Honolulu, HI, USA, 25–30 April 2020. [Google Scholar] [CrossRef]
- Kaß, C.; Schoch, S.; Naujoks, F.; Hergeth, S.; Keinath, A.; Neukum, A. A Methodological Approach to Determine the Benefits of External HMI During Interactions Between Cyclists and Automated Vehicles: A Bicycle Simulator Study. In Proceedings of the 2nd International Conference on HCI in Mobility, Transport and Automotive Systems, MobiTAS 2020, Copenhagen, Denmark, 19–24 July 2020. [Google Scholar] [CrossRef]
- Deutscher Verkehrsssicherheitsrat. Dooring-Kampagne Geht in die Zweite Runde. Available online: https://www.dvr.de/presse/pressemitteilungen/behalte-beim-aussteigen-deine-tuer-im-griff (accessed on 2 May 2021).
- Jänsch, M.; Johannsen, H.; Otte, D. Investigation of Bicycle Accidents Involving Collisions with the Opening Door of Parking Vehicles and Demands for a Suitable Driver Assistance System. In Proceedings of the IRCOBI, Lyon, France, 9–11 September 2015. [Google Scholar]
- Johnson, M.; Newstead, S.; Oxley, J.; Charlton, J. Cyclists and open vehicle doors: Crash characteristics and risk factors. Saf. Sci. 2013, 59, 135–140. [Google Scholar] [CrossRef]
- European Transport Safety Council. Safety of Pedestrians and Cyclists in Urban Areas; European Transport Safety Council: Etterbeek, Belgium, 1999. [Google Scholar]
- United Nations. Vienna Convention on the Law of Treaties; United Nations: New York, NY, USA, 1969. [Google Scholar]
- Office of the Legislative Counsel, Department of Justice, Government of Newfounland and Labrador. Highway Traffic Act. Available online: https://www.assembly.nl.ca/legislation/sr/statutes/h03.htm#169_ (accessed on 7 May 2012).
- State Government of Victoria. Road Safety Road Rules 2017. Available online: https://www.legislation.vic.gov.au/in-force/statutory-rules/road-safety-road-rules-2017/011 (accessed on 20 July 2012).
- Large, D.R.; Choo, M.; Houghton, R. Validating ‘Dutch Reach’: A Preliminary Evaluation of Far-Hand Door Opening and its Impact on Car Drivers’ Head Movements. In Proceedings of the 12th IEEE International Conference on Semantic Computing, ICSC 2018, Barcelona, Spain, 10–11 October 2018. [Google Scholar]
- Scharfenberger, C.; Chakraborty, S.; Färber, G. Robust Image Processing for an Omnidirectional Camera-based Smart Car Door. ACM Trans. Embed. Comput. Syst. 2012, 11, 1–28. [Google Scholar] [CrossRef]
- Zhu, M.; Han, L.; Liang, F.; Xi, C.; Wu, L.; Zhang, Z. A Novel Vehicle Open Door Safety System Based on Cyclist Detection Using Fisheye Camera and Improved Deep Convolutional Generative Adversarial Nets. In Proceedings of the 2019 IEEE Intelligent Vehicles Symposium (IV), Paris, France, 9–12 June 2019. [Google Scholar] [CrossRef]
- Wegman, F.; Zhang, F.; Dijkstra, A. How to make more cycling good for road safety? Accid. Anal. Prev. 2012, 44, 19–29. [Google Scholar] [CrossRef]
- ISO 18682; Intelligent Transport Systems—External Hazard Detection and Notification Systems—Basic Requirements. ISO: Geneva, Switzerland, 2016.
- ISO 12204; Road vehicles—Ergonomic aspects of transport information and control systems—Introduction to integrating safety critical and time critical warning signals. ISO: Geneva, Switzerland, 2012.
- Garmin Ltd. Varia™ RTL516. Available online: https://buy.garmin.com/de-DE/DE/p/698001#overview (accessed on 31 March 2021).
- Everysight LTD. Raptor AR Smartglasses. Available online: https://everysight.com/de/produkt/raptor-eu/ (accessed on 31 March 2021).
- Engo. Engo Eyewear. Available online: https://engoeyewear.com/ (accessed on 31 July 2021).
- Lujic, I.; de Maio, V.; Pollhammer, K.; Bodrozic, I.; Lasic, J.; Brandic, I. Increasing Traffic Safety with Real-Time Edge Analytics and 5G. In Proceedings of the 4th International Workshop on Edge Systems, Analytics and Networking, EdgeSys 2021, Edinburgh, UK, 26 April 2021. [Google Scholar] [CrossRef]
- Currano, R.; Park, S.Y.; Moore, D.J.; Lyons, K.; Sirkin, D. Little Road Driving HUD: Heads-Up Display Complexity Influences Drivers’ Perceptions of Automated Vehicles. In Proceedings of the ACM Conference on Human Factors in Computing Systems, CHI 2021, Yokohama, Japan, 8–13 May 2021. [Google Scholar] [CrossRef]
- Wintersberger, P.; von Sawitzky, T.; Frison, A.K.; Riener, A. Traffic Augmentation as a Means to Increase Trust in Automated Driving Systems. In Proceedings of the 12th Biannual Conference on Italian SIGCHI Chapter, CHItaly 2017, Cagliari, Italy, 18–20 September 2017. [Google Scholar] [CrossRef]
- Colley, M.; Bräuner, C.; Lanzer, M.; Walch, M.; Baumann, M.; Rukzio, E. Effect of Visualization of Pedestrian Intention Recognition on Trust and Cognitive Load. In Proceedings of the International Conference on Automotive User Interfaces and Interactive Vehicular Applications, AutomotiveUI 2020, Washington, DC, USA, 21–22 September 2020. [Google Scholar] [CrossRef]
- Schwarz, F.; Fastenmeier, W. Augmented reality warnings in vehicles: Effects of modality and specificity on effectiveness. Accid. Anal. Prev. 2017, 101, 55–66. [Google Scholar] [CrossRef]
- Löcken, A.; Golling, C.; Riener, A. How Should Automated Vehicles Interact with Pedestrians? In Proceedings of the 11th International Conference on Automotive User Interfaces and Interactive Vehicular Applications, AutomotiveUI 2019, Utrecht, The Netherlands, 21–25 September 2019. [Google Scholar] [CrossRef]
- Ezzati Amini, R.; Katrakazas, C.; Riener, A.; Antoniou, C. Interaction of automated driving systems with pedestrians: Challenges, current solutions, and recommendations for eHMIs. Transp. Rev. 2021, 41, 788–813. [Google Scholar] [CrossRef]
- Moore, D.; Strack, G.E.; Currano, R.; Sirkin, D. Visualizing Implicit eHMI for Autonomous Vehicles. In Proceedings of the 11th International Conference on Automotive User Interfaces and Interactive Vehicular Applications, AutomotiveUI Adjunct 2019, Utrecht, The Netherlands, 21–25 September 2019. [Google Scholar] [CrossRef]
- Berge, S.H.; Hagenzieker, M.; Farah, H.; de Winter, J. Do cyclists need HMIs in future automated traffic? An interview study. Transp. Res. Part F Traffic Psychol. Behav. 2022, 84, 33–52. [Google Scholar] [CrossRef]
- Bronkhorst, A.W.; Veltman, J.A.; van Breda, L. Application of a three-dimensional auditory display in a flight task. Hum. Factors 1996, 38, 23–33. [Google Scholar] [CrossRef]
- Stevens, C.; Perry, N.; Wiggins, M.; Howell, C. Design and Evaluation of Auditory Icons as Informative Warning Signals; Australian Transportation Safety Bureau: Canberra, Australia, 2006. [Google Scholar]
- Gaspar, J.G.; Brown, T.L.; Marshall, D.C. Examining the interaction between timing and modality in forward collision warnings. In Proceedings of the 7th International Conference on Automotive User Interfaces and Interactive Vehicular Applications, AutomotiveUI 2015, Nottingham, UK, 1–3 September 2015. [Google Scholar] [CrossRef]
- Wickens, C.D. Multiple Resources and Mental Workload. Hum. Factors 2008, 50, 449–455. [Google Scholar] [CrossRef] [Green Version]
- Kim, H.; Wu, X.; Gabbard, J.L.; Polys, N.F. Exploring Head-up Augmented Reality Interfaces for Crash Warning Systems. In Proceedings of the 5th International Conference on Automotive User Interfaces and Interactive Vehicular Applications, AutomotiveUI 2013, Eindhoven, The Netherlands, 28–30 October 2013. [Google Scholar] [CrossRef]
- Blattner, M.; Sumikawa, D.; Greenberg, R. Earcons and Icons: Their Structure and Common Design Principles. Hum.-Comput. Interact. 1989, 4, 11–44. [Google Scholar] [CrossRef]
- Jeon, M. Lyricons (Lyrics + Earcons): Designing a New Auditory Cue Combining Speech and Sounds. In Proceedings of the HCI International 2013—Posters’ Extended Abstracts, Las Vegas, NV, USA, 21–26 July 2013. [Google Scholar] [CrossRef]
- Walker, B.N.; Lindsay, J.; Nance, A.; Nakano, Y.; Palladino, D.K.; Dingler, T.; Jeon, M. Spearcons (speech-based earcons) improve navigation performance in advanced auditory menus. Hum. Factors 2013, 55, 157–182. [Google Scholar] [CrossRef] [Green Version]
- Šabić, E.; Chen, J.; MacDonald, J.A. Toward a Better Understanding of In-Vehicle Auditory Warnings and Background Noise. Hum. Factors 2021, 63, 312–335. [Google Scholar] [CrossRef] [PubMed]
- Freeman, E.; Wilson, G.; Vo, D.B.; Ng, A.; Politis, I.; Brewster, S. Multimodal feedback in HCI: Haptics, non-speech audio, and their applications. In The Handbook of Multimodal-Multisensor Interfaces: Foundations, User Modeling, and Common Modality Combinations; Oviatt, S., Schuller, B., Cohen, P.R., Sonntag, D., Potamianos, G., Krüger, A., Eds.; ACM: New York, NY, USA, 2017; Volume 1, pp. 277–317. [Google Scholar] [CrossRef]
- de Waard, D.; Edlinger, K.; Brookhuis, K. Effects of listening to music, and of using a handheld and handsfree telephone on cycling behaviour. Transp. Res. Part F Traffic Psychol. Behav. 2011, 14, 626–637. [Google Scholar] [CrossRef] [Green Version]
- The Linux Foundation. gRPC: A High Performance, Open Source Universal RPC Framework. Available online: https://www.grpc.io (accessed on 31 March 2021).
- Franke, T.; Attig, C.; Wessel, D. A Personal Resource for Technology Interaction: Development and Validation of the Affinity for Technology Interaction (ATI) Scale. Int. J. Hum.-Comput. Interact. 2019, 35, 456–467. [Google Scholar] [CrossRef]
- Osswald, S.; Wurhofer, D.; Trösterer, S.; Beck, E.; Tscheligi, M. Predicting information technology usage in the car: Towards a car technology acceptance model. In Proceedings of the 4th International Conference on Automotive User Interfaces and Interactive Vehicular Applications, AutomotiveUI 2012, Portsmouth, NH, USA, 17–19 October 2012. [Google Scholar] [CrossRef]
- Venkatesh, V.; Morris, M.G.; Davis, F.D. User Acceptance of Information Technology: Toward a Unified View. MIS Q. 2003, 27, 425–478. [Google Scholar] [CrossRef] [Green Version]
- Hart, S.G.; Staveland, L.E. Development of NASA-TLX (Task Load Index): Results of Empirical and Theoretical Research. Adv. Psychol. 1988, 52, 139–183. [Google Scholar] [CrossRef]
- Knappe, G.; Keinath, A.; Bengler, K.; Meinecke, C. Driving Simulator as an Evaluation Tool—Assessment of the Influence of Field of View andSecondary Tasks on Lane Keeping and Steering Performance. In Proceedings of the the 20th International Technical Conference on the Enhanced Safety of Vehicles (ESV 2007), Lyon, France, 18–21 June 2007. [Google Scholar]
- IBM Corp. IBM SPSS Statistics for Windows. Version 26.0, Released 2019. Available online: https://www.ibm.com/support/pages/downloading-ibm-spss-statistics-26 (accessed on 19 December 2021).
- R Core Team. R: A Language and Environment for Statistical Computing. 2021. Available online: https://www.R-project.org/ (accessed on 19 December 2021).
- Schafer, R. What Is a Savitzky-Golay Filter? [Lecture Notes]. IEEE Signal Process. Mag. 2011, 28, 111–117. [Google Scholar] [CrossRef]
- Lakens, D. Equivalence Tests: A Practical Primer for t Tests, Correlations, and Meta-Analyses. Soc. Psychol. Personal. Sci. 2017, 8, 355–362. [Google Scholar] [CrossRef] [Green Version]
- Kennedy, R.S.; Lane, N.E.; Berbaum, K.S.; Lilienthal, M.G. Simulator Sickness Questionnaire: An Enhanced Method for Quantifying Simulator Sickness. Int. J. Aviat. Psychol. 1993, 3, 203–220. [Google Scholar] [CrossRef]
- Golding, J.F. Predicting individual differences in motion sickness susceptibility by questionnaire. Personal. Individ. Differ. 2006, 41, 237–248. [Google Scholar] [CrossRef]
- Hagenzieker, M.P.; van der Kint, S.; Vissers, L.; van Schagen, I.N.L.G.; de Bruin, J.; van Gent, P.; Commandeur, J.J.F. Interactions between cyclists and automated vehicles: Results of a photo experiment*. J. Transp. Saf. Secur. 2020, 12, 94–115. [Google Scholar] [CrossRef] [Green Version]
- Lees, M.N.; Lee, J.D. The influence of distraction and driving context on driver response to imperfect collision warning systems. Ergonomics 2007, 50, 1264–1286. [Google Scholar] [CrossRef] [PubMed]
- Naujoks, F.; Kiesel, A.; Neukum, A. Cooperative warning systems: The impact of false and unnecessary alarms on drivers’ compliance. Accid. Anal. Prev. 2016, 97, 162–175. [Google Scholar] [CrossRef] [PubMed]
- Wintersberger, P.; Frison, A.K.; Riener, A.; von Sawitzky, T. Fostering User Acceptance and Trust in Fully Automated Vehicles: Evaluating the Potential of Augmented Reality. Presence 2019, 27, 46–62. [Google Scholar] [CrossRef]
- Hancock, P.A.; Billings, D.R.; Schaefer, K.E.; Chen, J.Y.C.; de Visser, E.J.; Parasuraman, R. A meta-analysis of factors affecting trust in human-robot interaction. Hum. Factors 2011, 53, 517–527. [Google Scholar] [CrossRef] [PubMed]
- Geels-Blair, K.; Rice, S.; Schwark, J. Using System-Wide Trust Theory to Reveal the Contagion Effects of Automation False Alarms and Misses on Compliance and Reliance in a Simulated Aviation Task. Int. J. Aviat. Psychol. 2013, 23, 245–266. [Google Scholar] [CrossRef]
- Apasnore, P.; Ismail, K.; Kassim, A. Bicycle-vehicle interactions at mid-sections of mixed traffic streets: Examining passing distance and bicycle comfort perception. Accid. Anal. Prev. 2017, 106, 141–148. [Google Scholar] [CrossRef]
- World Medical Association. World Medical Association Declaration of Helsinki: Ethical principles for medical research involving human subjects. JAMA 2013, 310, 2191–2194. [Google Scholar] [CrossRef] [Green Version]


| Item | Md | IQR | Notes |
|---|---|---|---|
| Familiarity with VR applications | 2 | 4 | |
| Familiarity with computer games | 5 | 3 | |
| Affinity for Technology Interaction | 5 | 1 | Cronbach’s 0.883 |
| Perceived Risk of encountering a door opening | 5.5 | 2 | yes (9) |
| (by previously experienced encounters) | 5 | 1 | no (13) |
| Door Opening Type | |||||||||
|---|---|---|---|---|---|---|---|---|---|
| Non-Critical | Critical | None | Total | ||||||
| Mdn | IRQ | Mdn | IRQ | Mdn | IRQ | Mdn | IRQ | ||
| Condition | B | 0.25 | 0.29 | 0.17 | 0.19 | 0.18 | 0.24 | 0.19 | 0.32 |
| V | 0.20 | 0.57 | 0.24 | 0.50 | 0.18 | 0.69 | 0.22 | 0.69 | |
| V + AI | 0.22 | 0.42 | 0.30 | 0.65 | 0.23 | 0.47 | 0.23 | 0.69 | |
| V + VM | 0.22 | 0.39 | 0.22 | 0.48 | 0.16 | 0.38 | 0.20 | 0.58 | |
| total | 0.23 | 0.62 | 0.22 | 0.66 | 0.18 | 0.70 | 0.20 | 0.70 | |
| Compared Intervals | |||||||||||||
|---|---|---|---|---|---|---|---|---|---|---|---|---|---|
| m(2,3)−m(1,2) | m(3,4)−m(2,3) | ||||||||||||
| NHST | TOST | NHST | TOST | ||||||||||
| Lower | Upper | Lower | Upper | ||||||||||
| condition | t (16) | p | t (16) | p | t (16) | p | t (16) | p | t (16) | p | t (16) | p | |
| B | 0.226 | 1.000 | 8.68 | <0.001 | −8.22 | <0.001 | −8.829 | <0.001 | 40.38 | <0.001 | −58.04 | <0.001 | |
| V | −1.391 | 0.549 | 8.58 | <0.001 | −11.36 | <0.001 | −0.622 | 1.000 | 4.04 | <0.001 | −5.29 | <0.001 | |
| V + AI | −0.943 | 1.000 | 1.24 | 0.351 | −3.12 | 0.009 | 0.301 | 1.000 | 6.33 | <0.001 | −5.73 | <0.001 | |
| V + VM | −0.844 | 1.000 | 5.33 | <0.001 | −7.02 | <0.001 | 0.016 | 1.000 | 4.79 | <0.001 | −4.76 | <0.001 | |
| V | V + AI | V + VM | ||||||
|---|---|---|---|---|---|---|---|---|
| Item/Subscale | Sig. Differences | Mdn | IQR | Mdn | IQR | Mdn | IQR | |
| UEQ | Pragmatic Quality | V + AI > V, V + AI > V + VM | 2.5 | 1.5 | 2.5 | 2.5 | 2.5 | 2 |
| obstructive/supportive | - | 1.5 | 1.5 | 2.5 | 1.5 | 2.5 | 1 | |
| complicated/easy | - | 2.5 | 2.5 | 2.5 | 1.5 | 2.5 | 1 | |
| inefficient/efficient | - | 1.5 | 1.5 | 2.5 | 2.5 | 2.5 | 2 | |
| confusing/clear | - | 2.5 | 0.5 | 2.5 | 2.5 | 2.5 | 2 | |
| Hedonic Quality | V + AI > V, V + VM > V | 1.5 | 2.5 | 2.5 | 2.5 | 2.5 | 2 | |
| boring/exiting | V + AI > V | 0.5 | 2.5 | 1.5 | 2.5 | 1.5 | 2 | |
| not interesting/interesting | V + AI > V, V + VM > V | 1.5 | 2.5 | 2.5 | 2.5 | 2.5 | 2 | |
| conventional/inventive | V + AI > V | 2.5 | 3.5 | 2.5 | 3.5 | 2.5 | 2 | |
| usual/leading edge | - | 2.5 | 2.5 | 2.5 | 1.5 | 2.5 | 2 | |
| Overall Quality | V + AI > V, V + VM > V | 2.5 | 2.5 | 2.5 | 2.5 | 2.5 | 2 | |
| INTUI | Effortlessness | V + AI > V, V + VM > V | 6.5 | 2.5 | 6.5 | 2.5 | 6.5 | 2 |
| Gut Feeling | - | 3.5 | 3.5 | 3.5 | 3.5 | 3.5 | 4 | |
| Intuitiveness | - | 6.5 | 2.5 | 6.5 | 2.5 | 6.5 | 2 | |
Publisher’s Note: MDPI stays neutral with regard to jurisdictional claims in published maps and institutional affiliations. |
© 2021 by the authors. Licensee MDPI, Basel, Switzerland. This article is an open access article distributed under the terms and conditions of the Creative Commons Attribution (CC BY) license (https://creativecommons.org/licenses/by/4.0/).
Share and Cite
von Sawitzky, T.; Grauschopf, T.; Riener, A. “Attention! A Door Could Open.”—Introducing Awareness Messages for Cyclists to Safely Evade Potential Hazards. Multimodal Technol. Interact. 2022, 6, 3. https://doi.org/10.3390/mti6010003
von Sawitzky T, Grauschopf T, Riener A. “Attention! A Door Could Open.”—Introducing Awareness Messages for Cyclists to Safely Evade Potential Hazards. Multimodal Technologies and Interaction. 2022; 6(1):3. https://doi.org/10.3390/mti6010003
Chicago/Turabian Stylevon Sawitzky, Tamara, Thomas Grauschopf, and Andreas Riener. 2022. "“Attention! A Door Could Open.”—Introducing Awareness Messages for Cyclists to Safely Evade Potential Hazards" Multimodal Technologies and Interaction 6, no. 1: 3. https://doi.org/10.3390/mti6010003
APA Stylevon Sawitzky, T., Grauschopf, T., & Riener, A. (2022). “Attention! A Door Could Open.”—Introducing Awareness Messages for Cyclists to Safely Evade Potential Hazards. Multimodal Technologies and Interaction, 6(1), 3. https://doi.org/10.3390/mti6010003