Abstract
Mobility hubs are meeting points for shared and active mobility within the existing public transport system. Despite an extensive public transportation network, private vehicle dependency remains high, indicating a critical need to enhance alternative transport modes. The aim of this study was to investigate public acceptance of smart and green mobility hubs, a crucial parameter for the successful transition from passenger cars to public transport. To achieve this objective, a stated preference survey was developed and distributed to a sample of 152 participants at two stations, namely Voula and Irakleio, that correspond to different public transport modes, tram and metro. Results indicated a generally positive attitude towards the development of green and smart mobility hubs. The survey revealed variations in commuter preferences between the two locations, with green spaces and smart charging benches being highly valued. Ultimately, this research illustrated that well-designed mobility hubs are instrumental in creating efficient, sustainable and livable urban environments, setting a new standard for future urban planning and development. The proposed interventions are expected to substantially contribute to the promotion of sustainable urban mobility in the respective areas and the broader city, enhancing quality of life and reducing the environmental footprint.
1. Introduction
Sustainable urban mobility extends beyond the adoption of zero-emission transportation; it embodies a holistic transformation in transport planning. This approach emphasizes the environmentally, economically and socially equitable movement of people and goods. Such a paradigm shift contributes to improved air quality, better public health, reduced traffic congestion and an overall enhanced urban quality of life.
To begin with, Transit-Oriented Development (TOD) sits at the intersection of urban planning and sustainable mobility [1]. TOD promotes dense, mixed-use developments centered around public transport hubs, fostering urban spaces that are both environmentally sustainable and socially vibrant.
A key innovation in integrated sustainable urban planning is the development of green and smart mobility hubs [2]. These hubs are organized spaces offering eco-friendly transport services and integrating multiple modes of mobility, including public transport, electric bikes, scooters, cars and delivery services, into a single location [3].
A green and smart mobility hub serves as a multi-functional space that integrates various sustainable transport options alongside complementary non-mobility services, catering to the diverse needs of commuters [4]. Mobility hubs are conceptualized and implemented in various ways within the literature, such as multimodal interchanges for traditional transport modes [5] or as centers consolidating shared transport options, primarily car sharing [6].
Within the above framework, the GREENMO project aims to promote the integration of green and inclusive mobility hubs to create greener living areas in the Mediterranean region, addressing the real needs of citizens. The project adopts an integrated, participatory approach that combines both top-down strategies and bottom-up community engagement. Its ultimate objective is to promote low-carbon mobility in urban areas, with a particular focus on reducing the environmental impact of transportation and achieving significant CO2 reductions. This goal will be pursued by supporting public authorities in holistically implementing “mobility hub” initiatives as part of climate change adaptation strategies. Simultaneously, the project emphasizes active engagement with citizens and local communities to identify and address their needs and barriers, encouraging a behavioral shift towards more sustainable and environmentally friendly transport modes.
In line with the primary objective of the GREENMO project (https://greenmo.interreg-euro-med.eu/ (accessed on 18 December 2024)), this study aims to investigate public acceptance of smart and green mobility hubs, a crucial parameter for the successful transition from passenger cars to public transport. To achieve this objective, a stated preference survey was conducted with a sample of 152 participants. The survey was distributed at two stations, namely, Voula, which serves the tram network, and Irakleio, which is part of the metro system. These locations were selected to represent different modes of public transport.
The remainder of this paper is organized as follows: first, a comprehensive introduction is provided, outlining the context and objectives of the study. This is followed by a background section of related work that explores the emergence and implementation of green and smart mobility hubs as a solution to promote sustainable transport and identifies the existing gaps that this research aims to address. The methods utilized and the data collection process are described. Lastly, the findings of the analyses are presented, accompanied by a critical discussion and final conclusions.
2. Related Work
The term “travel behavior” describes how individuals move across space, how and why they move from one place to another and how they use transportation. Travel preferences, on the other hand, describe how people would like to move across space. Travel behavior is typically more limited than travel desires in this regard. It makes sense to think of travel preferences as impacting travel behavior in some way. It is demonstrated how, in the face of resource constraints (e.g., time, money and skills), the preferences of public transportation users influenced their travel behavior through control beliefs [7].
In any case, travel decisions are not always logical because symbolic and emotional elements influence travel behavior even more than instrumental factors in some situations, such as leisure travel [8]. In the study of Anable et al., it is demonstrated that because non-motorized modes score highly on many of the attributes examined in this case, users of these modes seem to rate them as performing the best overall for the commute to work. Respondents believe that walking and cycling meet instrumental and affective requirements just as well as, if not better than, driving a car when evaluating one’s own mode. According to the results, non-motorized modes are thought to score highly on aspects like affordability, flexibility and freedom [8]. Car owners, in contrast, score lower on the most significant affective trait, “no stress”, but only slightly higher on one of the most crucial instrumental attributes, “flexibility”. Similarly, even when asked to rate other means of transportation, drivers do not necessarily give their vehicle the best rating. Once more, walking and cycling frequently receive ratings that are on par with or even higher than this. The most crucial instrumental attribute, “convenience”, is the single exception, which is noteworthy [8].
2.1. Travel Patterns
According to related research, people prefer to drive and have easier access to cities; as a result, smart mobility technologies in cities may need to make investments in driverless cars. In the long run, technology can offer more travel options and more comfortable and sustainable modes of transportation that are better suited to the demands of the population [9].
The demographic relation to travel patterns is also interesting and several research projects have focused on this area [10,11,12]. Given the age range of the respondents, the 18–24 and 25–34 age groups typically choose public transportation and walking. However, the likelihood of individual automobile journeys was higher among respondents aged 35–44 and 45–54. The distribution of the selected modes of transportation was comparable for students (bus, tram and foot) and economically active groups (car) [9].
Another factor that affects travel patterns and travel decisions has been proved to be the economic and educational status of commuters. For instance, car sharing, which is usually offered at a mobility hub, is used quite frequently in more wealthy societies, leading to a reduction in individuals who own cars and encouraging the adoption of more environmentally friendly travel habits [13]. According to Nansubuga and Kowalkowski [14], initially, city managers and urban planners anticipated that car-sharing would make driving more affordable for low-income social groups, including elders and students. Car-sharing is mostly used by highly educated individuals in North America and Europe, but in developing nations, the same demographic prefers automobile ownership [14]. Likewise, ride-hailing, which is another method of transportation gaining ground in many cities, is more commonly used by relatively youthful, well-educated and affluent people. The types of transportation that ride-hailing most frequently replace are taxis, public transportation and private automobiles [15].
It has also been discovered that urban characteristics like diversified land use and the urban environment of stations reflect differences in the mobility patterns of citizens as well as in the generated traffic volumes. There is a strong correlation between daily commute patterns and the characteristics of the destination stations, which highlights the importance of deepening this relation in order to achieve an understanding of travel behaviors and choices [16]. Furthermore, the elements of reliability and frequency are important factors that act as underlying motivation for increasing the modal share of public transport and that influence the travel mode choice of commuters [17].
2.2. Smart and Green Mobility Hubs
As a result of the effects of urban transportation networks, smart mobility has emerged as a focus in sustainability agendas [18]. The combination of the digital revolution and the transportation sector is primarily responsible for the emergence of the idea of smart mobility. Therefore, new technologies, particularly those pertaining to information and communication technology, have been employed to improve the efficiency of transport networks [19].
According to a recent survey’s findings, the main drivers for increasing intelligence in urban mobility may be divided into three categories based on their relationships: technology resources, technical solutions and governance. Additionally, it demonstrated that, out of the 26 drivers identified in the literature, 7 could be regarded as priorities: maintenance, safety, accessibility, walkability, environmentally friendly policies, public policies, urban mobility plans and technological resources [20].
Smart mobility is defined by many as the cornerstone of a smart city and is strongly associated with the transboundary haze (routing, digital transformation systems and forecasts of car traffic) decisions and policies of municipalities that are focused on the tools and innovations of data and communication. According to some academics, smart mobility is the collection of actions that promote traffic flow, whether by bicycle, foot or federal or state transportation, all with the common objective of reducing time, money and environmental costs [21]. Smart mobility, according to other authors [4], focuses on how people can engage with the urban environment in an informed way and stresses integrating technology into urban infrastructure [22].
Many cities around the world are increasingly promoting and implementing alternative modes of transport, such as car sharing, bicycles and scooters, alongside the encouragement of public transport and micro-mobility solutions [23]. These initiatives aim to reduce the reliance on private cars. To streamline access to diverse mobility services and connect various transport modes, the concept of green and smart mobility hubs has been introduced.
Mobility hubs are designed to revolutionize urban mobility by emphasizing efficiency, sustainability and inclusivity. At their core, they embody several key principles that define their functionality and purpose. Firstly, according to Ho and Tirachini [24], multimodality is a foundational feature, enabling the seamless integration of diverse transport modes such as public transit, shared bicycles, scooters, electric vehicles and car-sharing services. This integration allows for efficient and flexible travel, making it easier for commuters to switch between modes based on convenience and necessity. Secondly, green infrastructure plays a pivotal role in these hubs, prioritizing sustainability through the incorporation of green spaces and facilities like electric vehicle charging stations [25]. Such elements significantly reduce the environmental impact of urban transportation and contribute to greener and healthier cities.
Furthermore, digital solutions enhance user experience by employing advanced technologies [26]. Features such as mobile apps for trip planning and payments, real-time information systems and digital kiosks offer users valuable updates and guidance, streamlining their journeys and increasing satisfaction. Finally, social inclusion ensures that mobility hubs are accessible to everyone, including individuals with disabilities and socially vulnerable groups. Geurs et al. [27] revealed that by promoting equitable access to transportation services, hubs can actively reduce inequalities, foster social cohesion and make cities more inclusive.
According to Arnold et al. [28], a mobility hub is a distinct location that provides a variety of interconnected transport options, complemented by upgraded facilities and information services designed to attract and support travelers. In particular, an ideal mobility hub seamlessly combines public transport with shared mobility options such as bicycles and cars, creating a cohesive and efficient transportation network. Additionally, it should include provisions for supplementary infrastructure, such as private vehicle parking, to accommodate diverse user needs. To further enhance its appeal and functionality, a mobility hub can feature non-mobility facilities, such as green spaces, recreational areas, parks, landscaped zones, restaurants, retail shops and parcel collection points, transforming it into a vibrant and versatile space that serves both practical and recreational purposes.
Guidelines for mobility hubs commonly emphasize that hubs should be designed to be accessible to all users. However, the existing literature lacks specific definitions of different user groups and their unique needs. When target groups are mentioned, they often refer broadly to the general population, overlooking the preferences and requirements of distinct demographic segments. Factors such as hub location, pricing policies and available services significantly influence a hub’s accessibility for the entire population. It is crucial to avoid designs that primarily benefit those with pre-existing access to transport or technology, ensuring inclusivity for all users [29].
Moreover, mobility hubs offer numerous social benefits, enhancing the quality of life in urban and regional areas. By promoting public transport and sustainable modes of travel, hubs reduce congestion, improve traffic flow and decrease travel times [30]. Environmentally friendly transport options, including electric vehicles, contribute to lower air pollution levels, improving public health by reducing issues linked to poor air quality [29]. Additionally, Zijlstra et al. [31] demonstrated that encouraging walking and cycling as well as the provision of green spaces and exercise areas can foster better physical and mental health for citizens.
Ku et al. [32] proposed a method to reduce carbon emissions by decreasing passenger car usage through a travel demand management scheme centered on mobility hubs. The study focused on selecting and adjusting locations with scattered transport facilities, including bus stops, subways, public parking lots and gas stations, to develop mobility hubs designed to enhance mobility metabolism. Furthermore, the research presented and evaluated a design incorporating smart mobility and retrofitting of existing facilities within the traditional travel demand modeling framework. In an interesting study conducted by Boulange et al. [33], the relationship between urban design attributes and transport mode choices was examined across multiple transport modes, including walking, cycling, public transport and private motor vehicle use. Results revealed that transport-related walking, cycling, and public transport trips were positively associated with housing diversity scores and gross dwelling density.
It is worth noting that accessibility is a key advantage of mobility hubs, offering solutions for all citizens, including people with disabilities, the elderly and socially vulnerable groups. This inclusivity helps to mitigate social inequalities and promote social cohesion [34]. Geurs et al. (2022) [35] found that improved connectivity can stimulate economic activity, attract investments and generate jobs in areas surrounding mobility hubs.
Interestingly, surveys conducted in three German cities (i.e., Munich, Würzburg and Offenburg) highlighted that the introduction of mobility hubs increased public awareness of shared transport systems and their potential. These studies observed a modal shift, with commuters using carpooling and public transport more frequently [30,36].
The impact of green and smart mobility hubs on society and the economy is influenced by various factors. Demographic characteristics and existing travel habits play an important role in determining the readiness to adopt adaptive mobility systems like these hubs. For instance, public transport and bicycle users have shown early adoption and frequent usage of electromobility services [31,37]. Similarly, Tsouros et al. [34] revealed that frequent car users demonstrated potential interest in carpooling systems.
It should be mentioned that the smarter a mobility hub is, the greater its value becomes for users, resulting in higher utilization rates, enhanced user satisfaction and more significant social impacts. These benefits include decreased car use and ownership, improved accessibility and reduced emissions from road transport. However, the extent to which mobility hubs influence travel behavior is not yet fully understood. Current research lacks clarity on the specific conditions that enable hubs to serve as viable alternatives to car use, thereby enhancing accessibility and equity across the mobility system.
Furthermore, the role of landscaping and the integration of non-motorized services at mobility hubs, along with their impacts on nearby communities, remain underexplored. Investigating these aspects further could help unlock the full potential of mobility hubs as transformative components of sustainable urban and regional transport systems.
The research questions of this paper can be summarized as follows:
RQ1: How would the development of a mobility hub influence the travel behavior of citizens in Irakleio and Voula in Attica? Are they willing to use it once developed in their commuting area?
RQ2: What is the rating assessment of the key elements of a mobility hub that favor or hinder the acceptance of using it and reducing the use of private cars?
RQ3: What is the correlation of these elements and the relevant logistic regression weights of each of them?
3. Materials and Methods
3.1. General Methodology Outline
To fulfill the objectives of this study, a stated preference survey was conducted using questionnaires to evaluate the feasibility and viability of developing and operating smart and green mobility hubs. The theoretical framework underpinning the methodology is outlined below, followed by a detailed explanation of the questionnaire design and a comprehensive description of the stated preference survey.
The methodology of the paper is summarized in the next figure and consists of four steps. Step 1 focuses on the scientific background in the areas of urban travel patterns, smart and green mobility hubs, travel preferences and the theoretical background for the analysis of the questionnaire data. Step 2 identifies the research questions and develops the methodological strategy. Step 3 is the implementation phase, where the questionnaires are collected and the analysis is carried out. Finally, Step 4 is the presentation of the findings, discussion of the results, future work and conclusions (Figure 1).
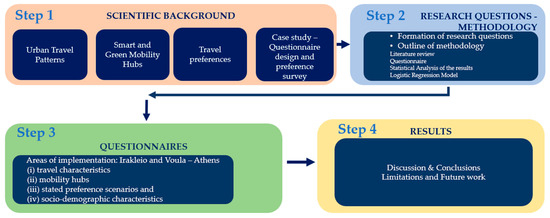
Figure 1.
Methodology outline.
The study focused on two specific areas of implementation within the municipality of Irakleio, Attica, and the municipality of Vari–Voula–Vouliagmeni, Attica, focusing on Voula. Below, maps of the two municipalities are presented (Figure 2a,b).
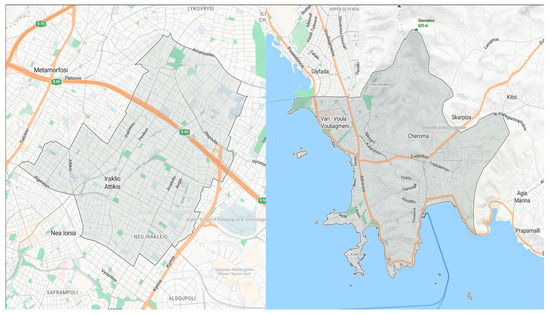
Figure 2.
(left) Map of study area of Irakleio, Attica (extended). (right) Map of study area of Voula (extended).
3.2. Questionnaire Design
The design of the questionnaire was carefully developed to align with the research objectives while ensuring the validity and reliability of the findings deriving from the study [38,39]. Key principles were followed to achieve this, including maintaining neutrality in question phrasing to avoid influencing responses and offering alternatives that allowed participants to freely express their perspectives. Efforts were made to build trust by emphasizing the survey’s credibility and ensuring respondent anonymity, particularly for questions of a personal nature.
To enhance clarity and usability, the questionnaire used simple language and focused on specific issues to minimize misunderstandings. Questions were grouped logically and arranged from the simplest to the most complex in order to create a natural flow and facilitate respondent engagement. The completion time was kept within 5 to 10 min to ensure practicality, with flexibility for respondents completing it at their leisure in designated environments.
Additional measures included incorporating familiar terms and control questions to verify accuracy, avoiding negative framing and using a personal tone to encourage honest responses. The questionnaire’s professional presentation was designed to maximize participation, while open-ended questions were structured for seamless data processing, ensuring responses could be transformed into numerical data for further analysis. This meticulous approach was essential for collecting high-quality and actionable insights.
3.3. Stated Preference Survey
To investigate respondents’ preferences regarding the development of smart and green mobility hubs, a survey was conducted using the stated preference method. A carefully designed questionnaire served as the primary data collection tool, aiming to evaluate hypothetical scenarios not yet implemented in real-world conditions. The stated preference method was well suited for this purpose as it captures preferences within a controlled framework, allowing for the development of mathematical models that describe respondents’ choices. It has become a prominent tool in transportation research due to its ability to manage diverse variables, maintain cost efficiency and provide controlled evaluations. Among the various data collection techniques, questionnaires are the most straightforward and commonly used [40].
On the other hand, the stated preference methods cause a hypothetical bias condition that should not be neglected in the frame of the study [41]. The hypothetical bias emerges from the fact that hypothetical scenarios were examined through the questionnaire to identify commuters’ preferences and perceptions of the likelihood of using a mobility hub once developed in their territory. With the responses being non-binding, it can be assumed that individuals’ input is not necessarily what they would carry out in real-life situations [42].
Data were collected from a sample of 152 individuals aged 18 and older, targeting commuters in the municipalities of Irakleio and Varis–Voula–Vouliagmeni (focusing on the area of Voula), Attica. The questionnaires were administered through face-to-face interviews conducted between 13 June and 20 June 2024, with each session requiring approximately 10 min to complete. Importantly, the survey was conducted anonymously and all data collected were used exclusively for research purposes.
The questionnaire consisted of four parts: (i) travel characteristics, (ii) mobility hubs, (iii) stated preference scenarios and (iv) socio-demographic characteristics. These sections provided comprehensive insights into commuters’ travel behaviors, preferences for mobility hubs and the factors influencing their choices, forming a robust foundation for evaluating the potential of smart and green mobility hubs.
The first part of the questionnaire focused on understanding respondents’ travel habits and preferences, providing baseline data to contextualize their responses in subsequent sections. Participants were asked to identify their primary travel mode (e.g., public transport, private vehicle, bicycle or walking) and the main purpose of their trips, categorized as education, work, leisure or personal commitments. Additional questions addressed the average time and distance of their daily commutes, as well as their weekly travel costs, offering insights into the financial and time-related aspects of their mobility patterns. Respondents also rated the importance of various factors influencing their choice of travel mode, including cost, travel time, flexibility and availability, on a scale ranging from “Not at all important” to “Extremely important”. These ratings highlighted the priorities and trade-offs commuters consider when selecting transportation modes, forming a crucial foundation for assessing their potential receptiveness to smart and green mobility hubs.
The second part familiarized respondents with the concept of green and smart mobility hubs, ensuring a clear understanding of their purpose and functionality, particularly for those unfamiliar with the term. Mobility hubs were defined as well-organized spaces that centralize environmentally friendly transport services, including public transit, shared electric bikes, scooters, carpools, taxi ranks and parcel pick-up services. Additionally, these hubs often feature non-transport amenities such as parks, cafes, comfortable waiting areas and digital kiosks, enhancing the overall user experience. The questionnaire outlined the benefits of mobility hubs, emphasizing their ability to improve travel speed and comfort while contributing to environmental sustainability. Respondents were then asked to evaluate the importance of various transport-related infrastructure (e.g., shared scooters, electric vehicle charging areas) and non-transport services (e.g., green spaces, parcel collection points) to determine the most valued features of a mobility hub. Finally, they provided feedback on their likelihood of using these services and whether they would consider switching their current primary mode of transport to public transit. This section aimed to identify both infrastructure priorities and potential shifts in commuter behavior associated with the implementation of mobility hubs.
The third section of the questionnaire utilized six scenarios based on the stated preference method to explore factors influencing respondents’ choices regarding the use of a smart and green mobility hub. Each scenario presented respondents with two hypothetical options: Situation (A), a public transport station without a mobility hub, and Situation (B), a public transport station integrated with a mobility hub. These scenarios allowed participants to weigh their preferences between the two situations under varying conditions, reflecting real-world trade-offs. The evaluation of preferences was centered around three critical parameters: time, representing the total trip duration, including waiting and travel; cost, capturing the financial expenditure for the journey; and comfort, reflecting the perceived convenience and quality of the travel experience. This section aimed to identify how these factors influence the likelihood of respondents opting for a mobility hub, offering insights into the conditions under which such hubs could become an attractive alternative for commuters.
These parameters, along with their respective values, formed the basis of the comparisons in each scenario. The specific parameter values used in the stated preference scenarios are summarized in Table 1.

Table 1.
Parameters and their corresponding values in the context of the stated preference scenarios.
In this context, each respondent was presented with a hypothetical scenario for a typical 8:00 a.m. commute to central Athens, where they were asked to choose between a public transport station with or without a smart and green mobility hub. The comparison considered parameters such as travel time, cost and comfort, with comfort rated on a scale from 1 (low) to 3 (high). A smart and green mobility hub was described as a well-organized space integrating eco-friendly transport options (e.g., public transport, shared bikes/scooters/cars, taxi stands and parcel pick-up points) alongside non-transport amenities, like greenery, benches and cafes, designed to enhance user experience and promote sustainability. A typical scenario of the stated preference analysis is shown in Table 2.
Table 2.
A typical scenario of the stated preference analysis.
The final part of the questionnaire gathered essential socio-demographic characteristics. Participants provided useful information with regard to their gender, age and educational level. These data were crucial for analyzing differences in preferences and behaviors across various demographic groups. The collected information also contributed to evaluating how demographic factors influence attitudes and choices related to smart and green mobility hubs.
3.4. Theoretical Background of Statistical Analysis
For the statistical analysis, logistic regression was employed. This method was used to estimate the model parameters and identify the factors significantly influencing transport mode choices, which is a common application of logistic regression in transportation studies. Before selecting logistic regression, alternative methods such as linear regression, discriminant analysis, probit and logit models were also considered. However, logistic regression was chosen for its ability to model alternative choice probabilities for discrete dependent variables [43] and its capacity to clearly identify the sensitivity of the parameters under examination [44]. It should be noted that logistic regression was identified as the most suitable method for analyzing the data collected through the stated preference method [45,46,47].
Logistic regression models are versatile and can be applied to both binary and multinomial scenarios. In cases where there are only two possible outcomes, a binary model is used, while multinomial models are employed when more than two alternatives are available. In this research, the binary logistic regression model was selected, as the choices under consideration involved two possible outcomes.
The parameters of the logistic regression model were estimated using the maximum likelihood method. The resulting mathematical model is grounded in random utility theory and begins with the utility function, which expresses the factors influencing the decision in a linear relationship. The probability of making a particular choice is then calculated through a nonlinear transformation of the utility function. Logistic regression can accommodate both binary models and models with multiple alternative choices, making it a flexible and effective tool for various decision-making scenarios.
The methodology involves constructing a linear utility function that represents the event of interest as a function of influencing characteristics. Using this utility function, an appropriate transformation is applied to estimate the probability of the event occurring.
A utility function is defined as a mathematical representation of an individual’s satisfaction with the attributes of a given alternative. For each alternative i within the choice set Cn, the utility function for individual n is expressed as follows:
where Vin = βiXin, βi is the vector of coefficients, Xin is the vector of variable values and εin denotes the stochastic component of the utility, capturing unobserved influences on the choice.
Uin = Vin + εin
The utility function for logistic regression is defined as
where Ui is the utility function of event i; x1,…, xn are the variables representing the characteristics of the problem; α0 is the constant term, accounting for the effects of factors not included as explicit variables in the model; and α1,…, αn are the coefficients of the variables, indicating their relative contributions to the utility.
Ui = α0 + α1x1 + α2x2 + ⋯ + αnxn
The probability of event i occurring is then calculated using the following relation:
4. Results
4.1. Descriptive Statistics
For the purpose of this research, a total of 152 users answered the questionnaire, of which 47% were commuters in the area of Voula and 53% were commuters in the area of Irakleio, Attica.
Figure 3 below presents the regional distribution of responses.
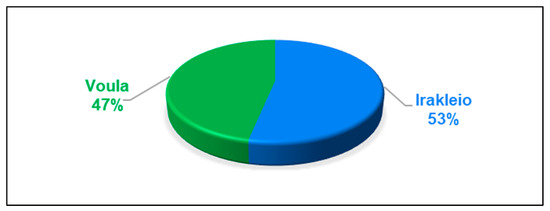
Figure 3.
Distribution of responses by region.
4.1.1. Demographic Characteristics
This section presents the demographic data of survey participants, categorized by gender, age group and educational level. More specifically, regarding gender, 45% of participants were male and 55% were female, indicating a slightly higher female representation in the overall survey. In Voula, however, 62% of participants were male, compared to 38% female, displaying a reverse trend where men predominated. In contrast, Irakleio had a higher proportion of female participants, accounting for 70% of respondents.
The age distribution further revealed notable trends. Among females, 18% were aged 18–30, 14% were 31–45 and 24% were 46–65, demonstrating greater diversity in age groups. For males, the largest percentage fell within the 18–30 age group, while the 31–45 age group had the lowest representation. In Voula, a significant proportion of male participants (35%) were aged 18–30, while females in this area were evenly distributed across the age groups. In Irakleio, the age distribution of females skewed toward older age groups, with 37% aged 46–65. Considering the distribution of the demographic characteristics of the total sample, it can be concluded that the sample was representative.
The basic sample characteristics are presented in Table 3.
Table 3.
Gender and age distribution.
4.1.2. Travel Patterns
This section focuses on the analysis of the travel patterns and preferences of residents in two different areas, Voula and Irakleio. Figure 4 and Figure 5 illustrate the distribution of commuters by main mode and purpose of travel for each area under consideration. It can be observed that in both areas, a high proportion of commuters chose their passenger car for their journeys. In Voula, public transport followed with a significant percentage of use, along with motorcycles. In contrast, Irakleio exhibited a greater reliance on private cars, with low percentages of public transport use and active modes such as bicycles and scooters. This distribution highlights the need for improvements in pedestrian infrastructure and the promotion of alternative transport modes.
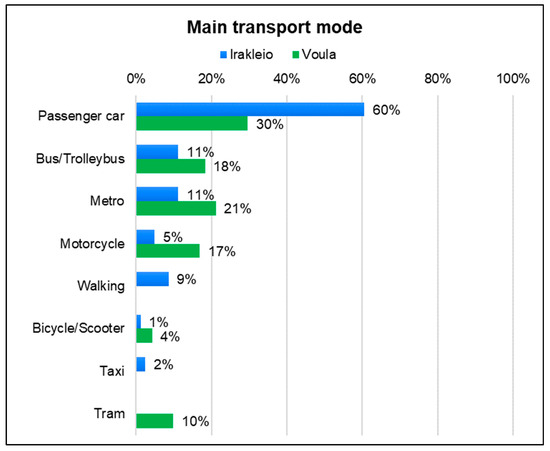
Figure 4.
Main transport mode by region.
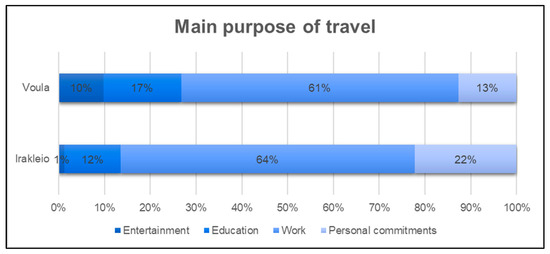
Figure 5.
Main purpose of travel by region.
In terms of the purpose of travel, the primary reason in both Voula and Irakleio was work, accounting for the majority of trips. In Voula, education ranked second with 17%, while in Irakleio, personal commitments followed work with 22%.
Table 4 shows the average time and distance of a typical journey, as well as the weekly cost of travel. In both regions, similar values were observed, with the average distance of a typical journey being around 16 km and the time being around 32 min. The average weekly cost required to travel was around €25.
Table 4.
Average time and distance of a typical journey by region and average weekly costs.
Figure 6 illustrates the average travel time and distance reported by commuters whose primary transport modes were private cars and metro in the Irakleio area and trams in the Voula area. No significant differences in travel times or distances between the two areas were observed, indicating similar commuting patterns across these transport modes.
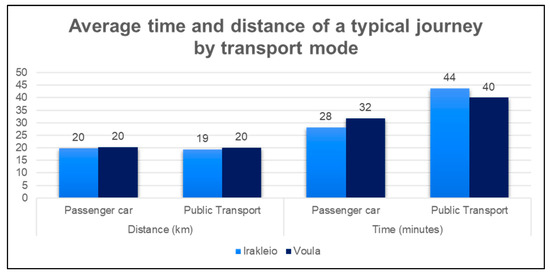
Figure 6.
Average time and distance of a typical journey by transport mode.
Figure 7 depicts the reported importance of characteristics for the choice of transport mode. In Voula, lower percentages of importance for the evaluated characteristics were observed compared to the Irakleio area, suggesting a higher sensitivity among Irakleio commuters when choosing their mode of transport. Specifically, in Irakleio, commuters considered safety and travel time as the most critical factors (3.6/5), while in Voula, availability, reliability and travel time were given priority (2.7/5). A notable observation was the clear difference in priorities, with Irakleio commuters placing greater emphasis on safety, which may indicate concerns over existing conditions, while Voula commuters valued availability and reliability, pointing to the need for better service accessibility.
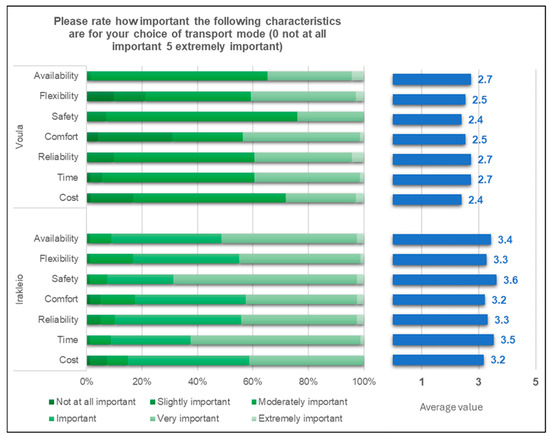
Figure 7.
Importance of characteristics for the choice of transport mode (Average value in blue color).
In summary, travel pattern data revealed significant differences in transport usage and travel purposes between the two areas under study. In Voula, a more balanced distribution was observed among car, public transport and motorcycle use, whereas in Irakleio, car use dominated, with notably lower participation in public transport and active modes such as bicycles and skates. Additionally, the analysis of average travel time, distance and weekly travel costs provided valuable insights for the planning of green and smart mobility hubs. Furthermore, the importance attributed to travel mode factors, such as safety, time and reliability, underscored the need for tailored improvements in mobility infrastructure and services to meet the specific demands of each region (Figure 8).

Figure 8.
Outline of major travel patterns identified.
4.1.3. Assessment of Infrastructures and Transport Modes in Mobility Hubs
This section examines the assessment of various infrastructures and transport modes at mobility hubs located near tram or metro stations in the areas of Irakleio and Voula. The analysis highlights differences in infrastructure priorities and needs between the two areas while also identifying common trends in the perceived importance of specific services and facilities.
The ratings of the importance of different infrastructure and transport services were provided on a scale from 0 to 5, with 5 indicating the highest level of importance. In Irakleio, car charging areas and shared scooter parking spaces were rated as the most important infrastructure, scoring 3.3 out of 5. The bus stop followed with a score of 2.9, while the taxi rank was rated slightly lower at 2.8. Shared bicycles received the lowest score of 2.0, reflecting minimal perceived importance among respondents. On the other hand, in Voula, car charging areas were also considered the most important, scoring 3.1. Shared scooters and the bus stop followed closely with scores of 3.0 and 2.8, respectively. The taxi rank was rated at 2.4 and shared bicycles, similar to Irakleio, received the lowest score of 2.0. Figure 9 presents an overall assessment of infrastructure and transport services at mobility hubs by region.
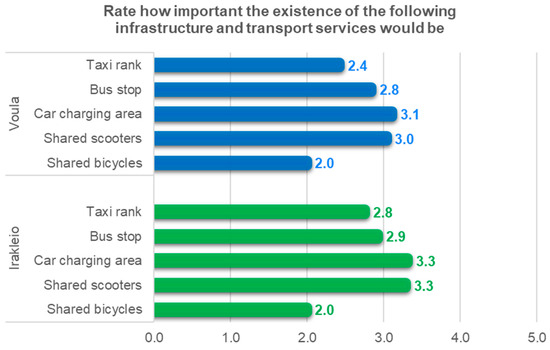
Figure 9.
Assessment of infrastructure and transport services at mobility hubs by region.
Overall, the data revealed some common patterns and differences. In both areas, car charging points and shared scooters near tram or metro stations were considered relatively important. Car charging areas were prioritized slightly higher in Voula compared to Irakleio, while bus stops were rated similarly in both locations. Taxi ranks and shared bicycles, however, were consistently rated as less important infrastructure across both areas. These observations underscore the need for tailored infrastructure improvements that align with the specific preferences and priorities of commuters in each region.
Figure 10 illustrates the perceived importance of various facilities and non-transport services at mobility hubs located near tram or metro stations in Irakleio and Voula. To begin with, in Irakleio, green spaces and smart benches with mobile charging emerged as the most valued facilities, receiving scores of 3.3 and 3.1, respectively. Public information kiosks (info kiosks) were equally rated at 3.1, followed by a café/canteen with a score of 2.9. Parcel collection points were rated 2.7, while children’s playgrounds were consistently rated the lowest, with a score of 2.0, indicating limited perceived importance. Interestingly, in Voula, smart benches with mobile charging and info kiosks were considered the most important services, each scoring 3.1. Green spaces followed closely with a score of 3.0, while the café/canteen was rated at 2.9. Parcel collection points received a lower rating of 2.4 and, similar to Irakleio, children’s playgrounds scored the lowest at 2.0.
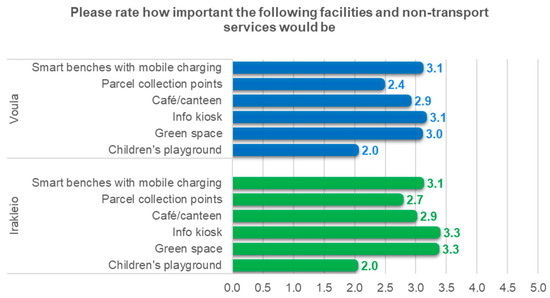
Figure 10.
Assessment of facilities and non-transport services at mobility hubs by region.
It is worth mentioning that in both areas, green spaces and smart benches with mobile charging were seen as highly important facilities, highlighting their broad appeal. However, the specific priorities differed slightly, with info kiosks being more valued in Voula and green spaces and smart benches receiving higher importance in Irakleio. The consistently low rating of children’s playgrounds in both areas suggests they are not considered critical infrastructure for mobility hubs.
With regard to the intention to use services at smart and green mobility hubs, the results revealed a high level of acceptance and interest in both areas. In Voula, an overwhelming 90% of respondents indicated their willingness to utilize these services, demonstrating strong support for the concept. In Irakleio, while slightly lower, the acceptance rate remained significant, with 87% of participants expressing interest. These findings highlight the broad appeal of smart and green mobility hubs and their potential to be widely embraced by commuters in both regions.
Figure 11 depicts the willingness of commuters in Irakleio and Voula to use the services provided by a smart and green mobility hub.
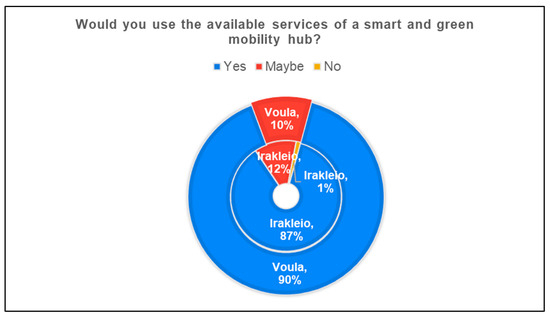
Figure 11.
Intention to use services at smart and green mobility hubs by region.
Concerning the impact of mobility hubs on mode shift to public transport, findings from the stated preference survey demonstrated notable differences between the two areas. In particular, in Voula, 62% of respondents indicated a willingness to switch to public transport (Yes). Only 6% responded negatively (No), while the remaining 32% were undecided (Maybe), reflecting moderate uncertainty. On the contrary, in Irakleio, 46% of respondents expressed a willingness to transition to public transport (Yes). However, a significant 51% were uncertain (Maybe) and only 4% responded negatively (No), indicating slightly greater hesitation compared to Voula.
Thus, it was found that the implementation of a smart and green mobility hub has the potential to encourage a substantial mode shift toward public transport in both areas. Residents of Voula appeared more inclined to adopt public transport, while those in Irakleio exhibited higher levels of uncertainty, as reflected by the larger proportion of “Maybe” responses. These findings provide valuable insights into the varying infrastructure needs and acceptance levels of the two areas, offering guidance for tailoring mobility hub designs to local preferences.
Figure 12 examines the likelihood that the presence of a smart and green mobility hub would motivate residents to shift their primary mode of daily travel to public transport.
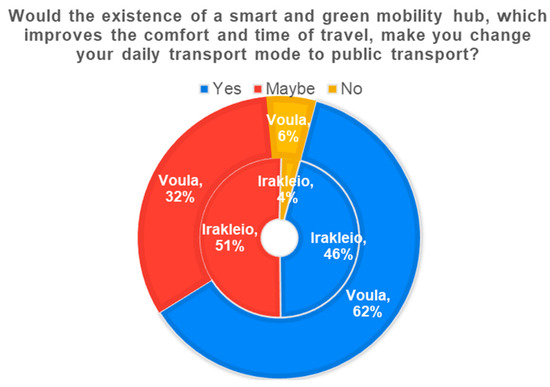
Figure 12.
Impact of mobility hubs on mode shift to public transport by region.
In order to briefly summarize the above results, the following figure shows the most significant findings (Figure 13).

Figure 13.
Assessment of infrastructures and transport modes in mobility hubs.
4.2. Logistic Regression Model
Two binomial logistic regression models were developed in order to analyze the factors influencing the likelihood of using a green and smart mobility hub, should such hubs be implemented at the tram station “Voula” and the metro station “Irakleio”. The models were developed for each area individually. The objective of the analysis was to examine how various factors, including travel time, cost, comfort, primary mode of travel, purpose of travel, perceived importance of flexibility and intention to use green and smart mobility hubs, affect commuters’ decisions to utilize the public transport services available at these stations. To ensure the reliability and accuracy of the regression analysis, a Pearson correlation test was conducted. This test identified relationships between the variables and confirmed that there were no multicollinearity issues, ensuring the reliability and accuracy of the regression analysis.
Table 5 provides the results of the mobility hub usage model for the Irakleio area.
Table 5.
Mobility hub usage model for the Irakleio area in Attica, Greece.
The logistic regression model for the Irakleio area revealed that travel time and travel cost were significant predictors in the model, both showing negative effects on the likelihood of mobility hub adoption. Specifically, the estimate for travel time was −0.047, with a significant p-value of 0.016 and an odds ratio of 0.954, suggesting that for every additional unit of travel time, the likelihood of using the mobility hub decreases. Similarly, travel cost had a stronger negative effect, with an estimate of −0.278, a highly significant p-value of 0.000 and an odds ratio of 0.757, indicating that higher commuting costs significantly reduce the probability of using the hub.
At the same time, comfort of travel, although included in the model, did not have a statistically significant impact on mobility hub usage in Irakleio, with a p-value of 0.582. This suggests that, while comfort may be a relevant factor, it was not decisive for commuters in this area when considering the adoption of a mobility hub. Interestingly, the main transport mode exhibited varying influences. Metro users showed the highest likelihood of adopting mobility hubs, with an estimate of 0.744, a marginal p-value of 0.089 and an odds ratio of 2.105. Tram users also showed a positive, though not statistically significant, tendency toward mobility hub usage (estimate of 0.572, p-value of 0.148, odds ratio of 1.771). Conversely, walking as a primary mode of transport had a significant negative impact, with an estimate of −0.820, a p-value of 0.040 and an odds ratio of 0.440, indicating that pedestrians were less inclined to use a mobility hub compared to car users.
The main purpose of travel did not emerge as a significant determinant for mobility hub usage. However, entertainment-related travel showed a positive trend, with an estimate of 0.475 and a p-value of 0.092, though it fell short of statistical significance. Education-related travel exhibited a negative but non-significant influence.
The intention to use the mobility hub was an important factor in the model. Respondents who were undecided (“Maybe”) about using the hub showed no statistically significant difference compared to those who said “Yes”. However, those who explicitly rejected the idea (“No”) had a lower likelihood of using the hub, though this result was not statistically significant (estimate of −1.550, p-value of 0.235, odds ratio of 0.212).
Finally, the willingness to change the main transport mode to public transport in the presence of a mobility hub was a critical factor. Respondents who answered “Maybe” had a significantly reduced likelihood of adopting the hub, with an estimate of −1.048, a p-value of 0.000 and an odds ratio of 0.351. Similarly, those who responded “No” showed an even lower likelihood, with an estimate of −1.216, a marginally significant p-value of 0.078 and an odds ratio of 0.296.
These findings suggest that in Irakleio, reducing travel time and costs, targeting metro and tram users and encouraging acceptance to public transport adoption are key strategies for increasing the likelihood of mobility hub usage. Conversely, addressing barriers for pedestrians and those hesitant to change their primary mode of travel could further enhance the success of such hubs.
According to Table 6, travel time and cost emerged as significant factors in the logistic model applied, both negatively impacting the probability of mobility hub adoption. Travel time had an estimate of −0.048, a p-value of 0.021 and an odds ratio of 0.953, suggesting that even a small increase in travel time reduces the likelihood of commuters using the hub. Similarly, travel cost showed a strong negative effect, with an estimate of −0.246, a p-value of 0.004 and an odds ratio of 0.782, indicating that higher costs significantly deter potential users. On the other hand, comfort of travel had a positive but statistically insignificant effect, with an estimate of 0.205 and a p-value of 0.124. While comfort may influence commuter preferences, its impact in this model was not substantial enough to draw definitive conclusions.
Table 6.
Mobility hub usage model for the Voula area in Attica, Greece.
The main transport mode revealed diverse effects on mobility hub adoption. Taxi users exhibited the highest likelihood of using the hub, with an estimate of 1.390, a p-value of 0.023 and an odds ratio of 4.016, suggesting that taxi users were more than four times as likely to adopt the hub compared to car users. Conversely, bus/trolleybus users showed a significant negative effect, with an estimate of −0.775, a p-value of 0.019 and an odds ratio of 0.461, indicating a lower probability of hub usage compared to car users. Metro users had a positive but non-significant influence, with an estimate of 0.555 and an odds ratio of 1.741, indicating moderate receptiveness.
Table 6 provides the results of the mobility hub usage model for the Voula area.
As per the main purpose of travel, a significant impact on mobility hub adoption was identified. Education-related travel had a significant negative impact, with an estimate of −0.746, a p-value of 0.034 and an odds ratio of 0.474, suggesting that those traveling for education purposes were less likely to use the hub. Entertainment-related travel showed a negative but non-significant effect, while personal commitments had a positive but non-significant influence.
The importance of flexibility as a parameter for mode choice was a key determinant. Commuters who rated flexibility as “Slightly important”, “Moderately important”, “Important”, or “Very important” showed significantly higher odds of adopting the mobility hub, with odds ratios ranging from 4.945 to 7.228. This underscores the critical role flexibility plays in influencing commuter preferences for mobility hub adoption.
Lastly, the intention to use the mobility hub and willingness to change the primary mode of transport to public transport showed less pronounced effects. Respondents who answered “Maybe” to the intention to use the hub had a reduced likelihood of adopting it, but the result was not statistically significant (estimate of −0.330, p-value of 0.435). Similarly, those hesitant to change their main transport mode showed a lower probability of hub adoption, but the effects were not significant (change line).
These findings suggest that in Voula, targeting taxi users, emphasizing flexibility and addressing barriers such as travel time and costs are critical strategies for increasing the adoption of green and smart mobility hubs. Efforts to engage bus/trolleybus users and those traveling for educational purposes may also be necessary to broaden the hub’s appeal.
5. Discussion
The results of this study echo findings from other research that emphasizes the importance of integrating smart and sustainable mobility solutions into urban transportation systems [48]. For example, Hosseini et al. (2024) [49] discuss how shared electric mobility hubs can scale effectively while offering significant environmental benefits, which aligns with the positive reception of green and smart mobility hubs observed in Voula and Irakleio. Their focus on reducing emissions and improving efficiency strengthens the case for prioritizing environmentally friendly features in mobility hubs. Similarly, Hosseini et al. (2023) [50], along with Hachette and L’hostis [51], highlight the need to optimize shared mobility hubs to meet demand. This reinforces the idea that elements like green spaces and smart charging benches could play a key role in attracting users.
On a broader scale, other studies point out the social benefits of smart urban mobility, illustrating how well-designed hubs can not only improve transportation options but also enhance urban livability [32,52]. This supports our finding that mobility hubs contribute to creating more enjoyable and efficient urban environments. What is more, Gulc and Budna [53] recently added to this by offering a classification framework for smart and sustainable urban mobility, which could help guide future projects tailored to the needs of specific cities.
The role of local context and infrastructure in gaining public support is further reflected in other global examples. Kayisu et al. [54] explore how smart mobility could ease traffic congestion and improve road safety in Kinshasa, Asia. Although the context is different from Europe, their findings resonate with the potential of mobility hubs in addressing urban challenges in the Mediterranean area as well. Similarly, a study from Saudi Arabia [55] highlights how benchmarking can support the development of smart mobility infrastructure, offering valuable insights for expanding mobility hubs in urban areas.
The integration of innovative technologies along with active involvement also plays a significant role in public acceptance. Melo et al. [56] show how embracing public preferences and public participation—such as the use of drones in logistics—can foster trust and enthusiasm, mirroring our finding that accessible and practical technologies, like smart charging benches, are highly valued by commuters. In parallel, the role of continuous engagement and cooperation between various stakeholders of the mobility ecosystem is investigated in another study, which highlights the added value of further expanding the current research with top-down input through surveys to stakeholders as a next important step [57].
Finally, Sinou et al. [58] emphasize the importance of adopting a holistic approach to sustainable urban design in central areas, which, when combined with the study in this paper, leads to the conclusion that mobility hubs should be part of a larger vision that takes environmental, social and cultural factors into account.
Focusing on the study of this paper, it reinforces the growing consensus that green and smart mobility hubs are a vital part of sustainable urban mobility. By prioritizing thoughtful design and responding to public needs, these hubs can significantly improve transportation systems, enhance quality of life, and reduce environmental impacts. Future research should explore these concepts further by examining larger populations, incorporating advanced technologies and evaluating the long-term effects of such hubs on cities and communities.
The results of this study demonstrated the crucial role that travel time, cost and flexibility play in shaping users’ decisions. Specifically, reducing commuting time and costs emerged as key drivers for increasing the likelihood of public transport and alternative travel mode adoption. In addition, the analysis revealed that local transport preferences and conditions heavily influence mobility hub usage. In Voula, commuters relying on taxis and valuing flexibility were particularly receptive to mobility hubs, while in Irakleio, metro users showed a higher inclination toward hub adoption. Conversely, pedestrians in both areas demonstrated lower interest, suggesting the need for improved pedestrian connectivity to hubs.
The study also highlighted the importance of integrating diverse infrastructure and services into mobility hubs to meet user expectations. Amenities such as green spaces, smart benches with charging facilities and digital kiosks were highly valued, reflecting commuters’ preferences for convenience and sustainability. Furthermore, the intention to use hubs and willingness to shift to public transport varied between the two areas, with Voula displaying greater readiness and Irakleio indicating higher levels of uncertainty.
Regarding the logistic regression models developed for the Irakleio and Voula areas, they both revealed significant insights into the factors influencing the likelihood of using green and smart mobility hubs. With regard to travel time and costs, the analysis across the two models demonstrated that travel time and commuting costs had a negative and statistically significant effect on the likelihood of using public transport and alternative travel modes facilitated by smart and green mobility hubs. This finding underscores the importance of reducing travel time and costs to encourage users to adopt these sustainable transport options. The consistent estimates and likelihood ratios across the models highlight the critical role these factors play in influencing commuter decisions. Such interventions could significantly enhance the attractiveness and utility of mobility hubs, particularly in areas like Irakleio, where reliance on private vehicles is higher.
The primary mode of transport showed varying influences across regions. In Voula, taxi users were significantly more inclined to adopt mobility hubs, emphasizing the role of convenience and on-demand transport. Conversely, in Irakleio, metro users displayed higher adoption rates, pointing to the potential of well-integrated public transport systems to drive mobility hub utilization. Interestingly, walking was a less favorable mode in both areas, suggesting a need for enhanced infrastructure to encourage pedestrian connectivity to mobility hubs.
In addition, flexibility emerged as a significant factor influencing mobility hub adoption across all models, with particular importance in Voula. This highlights the value commuters place on adaptability in their mobility options, enabling them to meet diverse needs and circumstances. The high ratings for flexibility underscored its critical role in the success of smart and green mobility hubs, as users prioritize transport systems that can seamlessly integrate into their dynamic routines.
Furthermore, the intention to use mobility hubs played a remarkable role in the Irakleio model, with negative responses such as “Maybe” and “No” significantly diminishing the likelihood of hub adoption. This finding emphasizes the importance of addressing commuter reluctance or skepticism to improve the likelihood of success for these hubs. Clear communication of benefits and enhancements in services may help mitigate this reluctance.
Summing up, the models collectively revealed that travel time, cost, flexibility and the primary mode of transport were critical factors influencing commuters’ decisions to use smart and green mobility hubs. The results provide valuable insights for designing and implementing strategies aimed at encouraging greater use of public transport and promoting alternative travel modes such as cycling, skating and walking. Lastly, it should be noted that improving travel conditions and tailoring mobility hub services to align with commuter preferences and needs can significantly enhance their adoption and usability.
5.1. Limitations
This study has certain limitations that should be acknowledged. Firstly, the stated preference method, while effective at capturing hypothetical scenarios, may not fully reflect real-world behavior. Respondents’ choices in the survey could differ from their actual behavior when faced with similar decisions in real conditions. This limitation underscores the need for cautious interpretation of the findings and further validation through revealed preference studies or pilot implementations of mobility hubs.
The study relies on quantitative data based on the developed stated preference survey. Even though this approach provides a valuable basis for evaluating and quantifying the selected parameters, it may not fully capture the complexity of the topic of travel behavior, habits, attitudes and motivations of the respondents. The study could be broadened in order to delve deeper into personal perceptions and identify potential resistance.
Additionally, the study was geographically limited to two areas in the Attica region, namely Irakleio and Voula. While these locations provided valuable insights, the results may not be generalizable to other regions with different socioeconomic, cultural or transport characteristics. The study could be expanded in order to include a more diverse set of locations and enhance the robustness and applicability of the findings.
Moreover, the sample size of this study, although sufficient for statistical modeling, may limit the detection of great influences and interactions among variables. A larger sample size could provide further and more accurate insights into the heterogeneity of commuter preferences and behaviors.
5.2. Future Reseacrh
Future research should focus on conducting longitudinal studies to observe how actual behavior aligns with stated preferences once mobility hubs are implemented. Additionally, incorporating revealed preference data could provide a more comprehensive understanding of commuter decisions and the factors driving mobility hub adoption.
Expanding the geographical scope of the research to include urban, suburban and rural contexts could offer a broader perspective on mobility hub utility and acceptance. What is more, comparative analyses across different regions could also uncover unique challenges and opportunities, informing more tailored and effective implementation strategies. Future research should also investigate additional factors, such as weather conditions, frequency of travel and car ownership, as these variables may significantly affect the likelihood of mobility hub adoption.
Finally, integrating advanced modeling techniques, such as mixed logit or machine learning approaches (e.g., Random Forests, Discrete Choice Models), could capture complex interactions among variables and provide deeper insights into commuter preferences. Also, integrating qualitative research methods could enrich the findings by incorporating qualitative data. Future studies should also examine the long-term impacts of mobility hubs on urban mobility patterns, environmental sustainability and social equity.
6. Conclusions
This research aimed to explore the acceptance and usage of smart and green mobility hubs. To investigate respondents’ preferences regarding the development of smart and green mobility hubs, a survey was conducted using the stated preference method. In particular, a specially designed questionnaire with four key sections—(a) travel characteristics, (b) mobility hubs, (c) stated preference scenarios and (d) socio-demographic characteristics—served as the main tool to capture users’ preferences and behaviors. The survey targeted a sample of 152 individuals aged 18 and older, residing in the municipalities of Irakleio and Varis–Voula–Vouliagmeni (Voula), Attica.
Overall, the research emphasized the potential of green and smart mobility hubs to serve as transformative elements of sustainable urban mobility. It is important to address the identified challenges and tailor mobility hub designs to the unique challenges of each area. Insights from regional cooperation initiatives, such as adopting green vehicles and fostering sustainable logistics, provide a roadmap for developing policies that ensure long-term environmental responsibility and equitable access across diverse communities [59].
Policymakers can significantly enhance the appeal and effectiveness of such initiatives, contributing to reduced reliance on private vehicles, improved urban connectivity and environmental sustainability. Authorities and governance bodies should prioritize investments in infrastructure that enhances accessibility and connectivity, such as pedestrian-friendly pathways and multimodal transit linkages. In parallel, encouraging public–private partnerships to facilitate the development of advanced facilities, implementing targeted awareness campaigns and financially incentivizing the use of alternative transport modes can further increase the adoption of mobility hubs. Thus, to move towards shaping holistic and valid policy recommendations, “top-down” research is necessary and will take place during the next months by the authors.
Author Contributions
Conceptualization, P.P. and D.P.; methodology, P.P., D.P. and V.A.; software, P.P. and V.A.; validation, D.P. and M.S.; formal analysis, P.P.; investigation, P.P. and D.P.; resources, P.P. and V.A.; data curation, P.P. and V.A.; writing—original draft preparation, P.P.; writing—review and editing, P.P., D.P., V.A. and M.S.; visualization, V.A. and M.S.; supervision, P.P.; project administration, P.P. and V.A.; funding acquisition, P.P. and D.P. All authors have read and agreed to the published version of the manuscript.
Funding
The research was funded by the European Union’s GREENMO project, in the frame of Interreg EuroMED Programme.
Data Availability Statement
The data can be provided upon request.
Conflicts of Interest
The authors declare no conflicts of interest.
References
- Ibraeva, A.; de Almeida Correia, G.H.; Silva, C.; Antunes, A.P. Transit-oriented development: A review of research achievements and challenges. Transp. Res. Part A Policy Pract. 2020, 132, 110–130. [Google Scholar] [CrossRef]
- Bhadragoudar Shivanagouda, L. Stakeholder Perspectives on Mobility Hub Planning for Sustainable Cities: Navigating Their Interests for Accessible, Inclusive, and Eco-Friendly Transportation Solution. Master’s Thesis, Malmö University, Faculty of Culture and Society (KS), Department of Urban Studies (US), Malmö, Sweden, 2024; p. 61. Available online: https://www.diva-portal.org/smash/record.jsf?dswid=-5489&pid=diva2%3A1894907 (accessed on 7 December 2024).
- Joshi, M.; Vaidya, A.; Deshmukh, M. Sustainable transport solutions for the concept of smart city. In Sustainable Energy and Transportation: Technologies and Policy; Springer Nature: Berlin/Heidelberg, Germany, 2018; pp. 21–42. [Google Scholar] [CrossRef]
- Sihvonen, M.; Takala, H. Zero-emission solution for a smart mobility hub. WIT Trans. Ecol. Environ. 2023, 261, 419–427. [Google Scholar] [CrossRef]
- Monzon-de-Caceres, A.; Di Ciommo, F. (Eds.) City-HUBs: Sustainable and Efficient Urban Transport Interchanges; CRC Press: Boca Raton, FL, USA, 2016. [Google Scholar] [CrossRef]
- Weustenenk, A.G.; Mingardo, G. Towards a typology of mobility hubs. J. Transp. Geogr. 2023, 106, 103514. [Google Scholar] [CrossRef]
- Durand, A.; Harms, L.; Hoogendoorn-Lanser, S.; Zijlstra, T. Mobility-as-a-Service and Changes in Travel Preferences and Travel Behaviour: A Literature Review; Ministry of Infrastructure and Water Management: Hague, The Netherlands, 2018. [Google Scholar] [CrossRef]
- Anable, J.; Gatersleben, B. All work and no play? The role of instrumental and affective factors in work and leisure journeys by different travel modes. Transp. Res. Part A Policy Pract. 2005, 39, 163–181. [Google Scholar] [CrossRef]
- Wolnowska, A.E.; Kasyk, L. Transport Preferences of City Residents in the Context of Urban Mobility and Sustainable Development. Energies 2022, 15, 5692. [Google Scholar] [CrossRef]
- Veterník, M.; Gogola, M. Examining of correlation between demographic development of population and their travel behaviour. Procedia Eng. 2017, 192, 929–934. [Google Scholar] [CrossRef]
- Koppelman, F.S.; Pas, E.I. Travel-choice behavior: Models of perceptions, feelings, preference, and choice. Transp. Res. Rec. 1980, 765, 26–33. [Google Scholar]
- Frutos-Bernal, E.; Martin del Rey, A.; Mariñas-Collado, I.; Santos-Martín, M.T. An Analysis of Travel Patterns in Barcelona Metro Using Tucker3 Decomposition. Mathematics 2022, 10, 1122. [Google Scholar] [CrossRef]
- Tarnovetckaia, R.; Mostofi, H. Impact of Car-Sharing and Ridesourcing on Public Transport Use: Attitudes, Preferences, and Future Intentions Regarding Sustainable Urban Mobility in the Post-Soviet City. Urban Sci. 2022, 6, 33. [Google Scholar] [CrossRef]
- Nansubuga, B.; Kowalkowski, C. Carsharing: A systematic literature review and research agenda. J. Serv. Manag. 2021, 32, 55–91. [Google Scholar] [CrossRef]
- Tirachini, A. Ride-hailing, travel behaviour and sustainable mobility: An international review. Transportation 2020, 47, 2011–2047. [Google Scholar] [CrossRef]
- Gan, Z.; Yang, M.; Feng, T.; Timmermans, H.J.P. Understanding urban mobility patterns from a spatiotemporal perspective: Daily ridership profiles of metro stations. Transportation 2020, 47, 315–336. [Google Scholar] [CrossRef]
- Göransson, J.; Andersson, H. Factors that make public transport systems attractive: A review of travel preferences and travel mode choices. Eur. Transp. Res. Rev. 2023, 15, 32. [Google Scholar] [CrossRef]
- Schipper, F.; Emanuel, M.; Oldenziel, R. Sustainable Urban Mobility in the Present, Past, and Future. Technol. Cult. 2020, 61, 307–317. [Google Scholar] [CrossRef]
- Noy, K.; Givoni, M. Is ‘Smart Mobility’ Sustainable? Examining the Views and Beliefs of Transport’s Technological Entrepreneurs. Sustainability 2018, 10, 422. [Google Scholar] [CrossRef]
- Munhoz Maldonado Silveira Alonso, P.A.; da Costa Dias, F.; Kowal Chinelli, C.; Azevedo Guedes, A.L.; Neves dos Santos, J.A.; da Silveira e Silva, W.; Pereira Soares, C.A. Smart Mobility: The Main Drivers for Increasing the Intelligence of Urban Mobility. Sustainability 2020, 12, 10675. [Google Scholar] [CrossRef]
- Bıyık, C.; Abareshi, A.; Paz, A.; Ruiz, R.A.; Battarra, R.; Rogers, C.D.F.; Lizarraga, C. Smart Mobility Adoption: A Review of the Literature. J. Open Innov. Technol. Mark. Complex. 2021, 7, 146. [Google Scholar] [CrossRef]
- Allam, Z.; Newman, P. Redefining the Smart City: Culture, Metabolism and Governance. Smart Cities 2018, 1, 4–25. [Google Scholar] [CrossRef]
- Christensen, H.R.; Breengaard, M.H.; Levin, L. Gender Smart Mobility: Concepts, Methods, and Practices; Taylor & Francis: Abingdon, UK, 2024; p. 164. [Google Scholar]
- Ho, C.Q.; Tirachini, A. Mobility-as-a-Service and the role of multimodality in the sustainability of urban mobility in developing and developed countries. Transp. Policy 2024, 145, 161–176. [Google Scholar] [CrossRef]
- Sewenet, A.D.; Pisano, P. Assess the Role of Green Information Systems (Green IS) for Smart Mobility in Smart Cities: A Case Study Approach. Proceeding Assoc. Inf. Syst. Conf. 2023, 50, 1–2. [Google Scholar] [CrossRef]
- Doost Mohammadian, H.; Rezaie, F. Blue-green smart mobility technologies as readiness for facing tomorrow’s urban shock toward the world as a better place for living (Case studies: Songdo and Copenhagen). Technologies 2020, 8, 39. [Google Scholar] [CrossRef]
- Geurs, K.; Grigolon, A.; Münzel, K.; Gkiotsalitis, K.; Duran-Rodas, D.; Büttner, B.; Kirchberger, C.; Pappers, J.; Ramirez, L.M.; Graf, A.; et al. The Smarthubs integration ladder: A conceptual model for the categorisation of shared mobility hubs. Transp. Rev. 2024, 44, 112–139. [Google Scholar] [CrossRef]
- Arnold, T.; Frost, M.; Timmis, A.; Dale, S.; Ison, S. Mobility hubs: Review and future research direction. Transp. Res. Rec. 2023, 2677, 858–868. [Google Scholar] [CrossRef]
- Fleming, K.L. Social equity considerations in the new age of transportation: Electric, automated, and shared mobility. J. Sci. Policy Gov. 2018, 13, 20. [Google Scholar]
- Miramontes, M.; Pfertner, M.; Heller, E. Contributions of Mobility Stations to sustainable urban mobility–The examples of three German cities. Transp. Res. Procedia 2019, 41, 802–806. [Google Scholar] [CrossRef]
- Zijlstra, T.; Durand, A.; Hoogendoorn-Lanser, S.; Harms, L. Early adopters of Mobility-as-a-Service in the Netherlands. Transp. Policy 2020, 97, 197–209. [Google Scholar] [CrossRef]
- Ku, D.; Choi, M.; Lee, D.; Lee, S. The effect of a smart mobility hub based on concepts of metabolism and retrofitting. J. Clean. Prod. 2022, 379, 134709. [Google Scholar] [CrossRef]
- Boulange, C.; Gunn, L.; Giles-Corti, B.; Mavoa, S.; Pettit, C.; Badland, H. Examining associations between urban design attributes and transport mode choice for walking, cycling, public transport and private motor vehicle trips. J. Transp. Health 2017, 6, 155–166. [Google Scholar] [CrossRef]
- Tsouros, I.; Tsirimpa, A.; Pagoni, I.; Polydoropoulou, A. MaaS users: Who they are and how much they are willing-to-pay. Transp. Res. Part A Policy Pract. 2021, 148, 470–480. [Google Scholar] [CrossRef]
- Geurs, K.; Münzel, K.; Duran, D.; Gkavra, R.; Graf, A.; Grigolon, A.; Hansel, J.; Kirchberger, C.; Klementschitz, R.; Martinez Ramirez, L.; et al. A multidimensional mobility hub typology and inventory. SmartHubs Deliverable D 2.1. 2022. [Google Scholar] [CrossRef]
- Miramontes, M.; Pfertner, M.; Rayaprolu, H.S.; Schreiner, M.; Wulfhorst, G. Impacts of a multimodal mobility service on travel behavior and preferences: User insights from Munich’s first Mobility Station. Transportation 2017, 44, 1325–1342. [Google Scholar] [CrossRef]
- Liao, F.; Correia, G. Deliverable 1.1—State-of-the-Art Related to eHUBS; eHubs Interreg Project: Delft, The Netherlands, 2020. [Google Scholar]
- Yannis, G.; Papantoniou, P.; Papadimitriou, E.; Tsolaki, A. Analysis of preferences for the use of a bicycling sharing system in Athens. In Proceedings of the International Cycling Safety Conference, Hannover, Germany, 15–16 September 2015. [Google Scholar]
- Addington-Hall, J.M. Survey research: Methods of Data Collection, Questionnaire Design and Piloting. In Research Methods in Palliative Care; Oxford Academic: Oxford, UK, 2007; pp. 61–82. [Google Scholar] [CrossRef]
- Bates, J. Econometric issues in stated preference analysis. J. Transp. Econ. Policy 1988, 22, 59–69. Available online: http://www.jstor.org/stable/20052835 (accessed on 18 December 2024).
- Buckell, J.; White, J.S.; Shang, C. Can incentive-compatibility reduce hypothetical bias in smokers’ experimental choice behavior? A randomized discrete choice experiment. J. Choice Model. 2020, 37, 100255. [Google Scholar] [CrossRef]
- Hensher, D.A.; Rose, J.M.; Greene, W. Applied Choice Analysis; Cambridge University Press: Cambridge, UK, 2015. [Google Scholar] [CrossRef]
- Hoffman, S.D.; Duncan, G.J. Multinomial and conditional logit discrete-choice models in demography. Demography 1988, 25, 415–427. [Google Scholar] [CrossRef] [PubMed]
- Hosmer, D.W., Jr.; Lemeshow, S.; Sturdivant, R.X. Applied Logistic Regression; John Wiley & Sons: Hoboken, NJ, USA, 2013. [Google Scholar] [CrossRef]
- Cordingley, L.; Nelson, P.A.; Davies, L.; Ashcroft, D.; Bundy, C.; Chew-Graham, C.; Chisholm, A.; Elvidge, J.; Hamilton, M.; Hilton, R.; et al. Detailed methods and results of the stated preference survey. In Identifying and Managing Psoriasis-Associated Comorbidities: The IMPACT Research Programme; NIHR Journals Library: Southampton, UK, 2022. [Google Scholar] [CrossRef]
- Papantoniou, P.; Mylonas, C.; Spanou, P.; Pavlou, D. Investigation of User’s Preferences on Electric Passenger Cars. In Smart Energy for Smart Transport. CSUM 2022. Lecture Notes in Intelligent Transportation and Infrastructure; Nathanail, E.G., Gavanas, N., Adamos, G., Eds.; Springer: Cham, Switzerland, 2023. [Google Scholar] [CrossRef]
- Jiang, Y.; Zhang, J.; Wang, Y.; Wang, W. Capturing ownership behavior of autonomous vehicles in Japan based on a stated preference survey and a mixed logit model with repeated choices. Int. J. Sustain. Transp. 2019, 13, 788–801. [Google Scholar] [CrossRef]
- Mangiaracina, R.; Perego, A.; Salvadori, G.; Tumino, A. A comprehensive view of intelligent transport systems for urban smart mobility. Int. J. Logist. Res. Appl. 2016, 20, 39–52. [Google Scholar] [CrossRef]
- Hosseini, K.; Choudhari, T.P.; Stefaniec, A.; O’Mahony, M.; Caulfield, B. E-bike to the future: Scalability, emission-saving, and eco-efficiency assessment of shared electric mobility hubs. Transp. Res. Part D Transp. Environ. 2024, 133, 104275. [Google Scholar] [CrossRef]
- Hosseini, K.; Stefaniec, A.; O’Mahony, M.; Caulfield, B. Optimising shared electric mobility hubs: Insights from performance analysis and factors influencing riding demand. Case Stud. Transp. Policy 2023, 13, 101052. [Google Scholar] [CrossRef]
- Hachette, M.; L’hostis, A. Mobility Hubs, an Innovative Concept for Sustainable Urban Mobility? State of the Art and Guidelines from European Experiences. Smart Cities: Social and Environmental Challenges and Opportunities for Local Authorities; Springer: Berlin/Heidelberg, Germany, 2023; pp. 245–278. [Google Scholar] [CrossRef]
- Brzeziński, Ł. Social Aspects of Smart Urban Mobility. Encyclopedia 2024, 4, 864–873. [Google Scholar] [CrossRef]
- Gulc, A.; Budna, K. Classification of Smart and Sustainable Urban Mobility. Energies 2024, 17, 2148. [Google Scholar] [CrossRef]
- Kayisu, A.K.; Mikusova, M.; Bokoro, P.N.; Kyamakya, K. Exploring Smart Mobility Potential in Kinshasa (DR-Congo) as a Contribution to Mastering Traffic Congestion and Improving Road Safety: A Comprehensive Feasibility Assessment. Sustainability 2024, 16, 9371. [Google Scholar] [CrossRef]
- Alanazi, F. Development of Smart Mobility Infrastructure in Saudi Arabia: A Benchmarking Approach. Sustainability 2023, 15, 3158. [Google Scholar] [CrossRef]
- Melo, S.; Silva, F.; Abbasi, M.; Ahani, P.; Macedo, J. Public Acceptance of the Use of Drones in City Logistics: A Citizen-Centric Perspective. Sustainability 2023, 15, 2621. [Google Scholar] [CrossRef]
- Faber, A.; Rehm, S.-V.; Hernandez-Mendez, A.; Matthes, F. Modeling and Visualizing Smart City Mobility Business Ecosystems: Insights from a Case Study. Information 2018, 9, 270. [Google Scholar] [CrossRef]
- Sinou, M.; Skalkou, K.; Perakaki, R.; Jacques, S.; Kanetaki, Z. Holistic Strategies Based on Heritage, Environmental, Sensory Analysis and Mapping for Sustainable Coastal Design. Sustainability 2023, 15, 9953. [Google Scholar] [CrossRef]
- Macedo, E.; Bandeira, J.M. Clean, Smart, and Sustainable Regional Mobility. In Self-Sufficiency and Sustainable Cities and Regions; Routledge eBook: Oxfordshire, UK, 2024; pp. 149–169. ISBN 9781003498216. [Google Scholar]
Disclaimer/Publisher’s Note: The statements, opinions and data contained in all publications are solely those of the individual author(s) and contributor(s) and not of MDPI and/or the editor(s). MDPI and/or the editor(s) disclaim responsibility for any injury to people or property resulting from any ideas, methods, instructions or products referred to in the content. |
© 2025 by the authors. Licensee MDPI, Basel, Switzerland. This article is an open access article distributed under the terms and conditions of the Creative Commons Attribution (CC BY) license (https://creativecommons.org/licenses/by/4.0/).