Abstract
Urban transport is critical in shaping the form and function of cities, particularly the level of automobile dependence and sustainability. This paper presents a detailed study of the urban transport eco-urbanism characteristics of the Stockholm, Malmö, Göteborg, Linköping, and Helsingborg urban regions in southern Sweden. It compares these cities to those in the USA, Australia, Canada, and two large wealthy Asian cities (Singapore and Hong Kong). It finds that while density is critical in determining many features of eco-urbanism, especially mobility patterns and particularly how much public transport, walking, and cycling are used, Swedish cities maintain healthy levels of all these more sustainable modes and only moderate levels of car use, while having less than half the density of other European cities. Swedish settlement patterns and urban transport policies mean they also enjoy, globally, the lowest level of transport emissions and transport deaths per capita and similar levels of energy use in private passenger transport as other European cities, and a fraction of that used in lower density North American and Australian cities. Swedish urban public transport systems are generally well provided for and form an integral part of the way their cities function, considering their lower densities. Their use of walking and cycling is high, though not as high as in other European cities and together with public transport cater for nearly 50% of the total daily trip making, compared to auto-dependent regions with between about 75% and 85% car trips. The paper explores these and other patterns in some detail. It provides a clear depiction of the strengths and weaknesses of Swedish cities in urban transport, some key policy directions to improve them and posits possible explanations for some of the atypical patterns observed.
1. Introduction
Eco-urbanism is a very broad topic that can be approached from many perspectives and the terminology surrounding the subject is equally diverse. Green cities or green urbanism [1,2], eco-cities [3,4], sustainable cities [5], resilient cities [6], regenerative cities [7], biophilic cities [8], low-carbon or carbon-neutral cities [9], and more recently, smart cities [10] are all terms that find their way into the general rubric of eco-urbanism.
Notwithstanding the explosion of different nomenclatures in this field, there are core factors of eco-urbanism that are common to all, some of which are:
- Compact, mixed land uses with elevated densities;
- Multiple sub-centres throughout the city (polycentrism or de-centralised concentration);
- Use of renewable energies;
- Sustainably sourced building materials;
- Local food production and food sourcing nearby;
- Recycling and reuse of organic and non-organic materials;
- Sustainable water management systems (water harvesting, on-site water retention, etc.);
- Greening of urban surfaces using biophilic architecture;
- Minimisation of high capacity road construction, especially freeways;
- Development of extensive and safe pedestrian and cycling facilities;
- Provision of superior public transport systems, especially rail;
- Generous and usable green spaces throughout;
- People-oriented, protected urban spaces, such as squares, pedestrian zones, playgrounds;
- Urban design to encourage walkability.
Clearly, some of these factors are related directly or indirectly to urban mobility and the need to minimise car use in cities to help foster eco-urbanism. Each major period of transport evolution has brought with it different types of city forms and a dominant transport mode. First, there were the “Walking Cities” up to about 1850, which ran entirely on non-motorised modes (walking, animal-drawn vehicles, and, in some cases, water transport). This was followed by “Public Transport Cities” between about 1850 and 1950, during which time trams, trains, and finally buses were introduced into cities, allowing cities to greatly expand in physical size due to increased speed. The current stage in the transport-led evolution of cities is “Automobile Cities” [5].
Across the history of human settlements, it can be argued that the automobile, more than any other vehicular technology, has been the most profound force in reshaping cities and the most destructive in its negative effects on the ecological characteristics of cities [11,12,13]. Some authors have devoted much time and energy to envisioning cities free of an excessive dependence on cars and how to achieve that [14,15,16].
I have suggested that creating eco-cities depends upon 10 key principles for transport and urban planning in the future, which are summarised in Figure 1 [4,17].
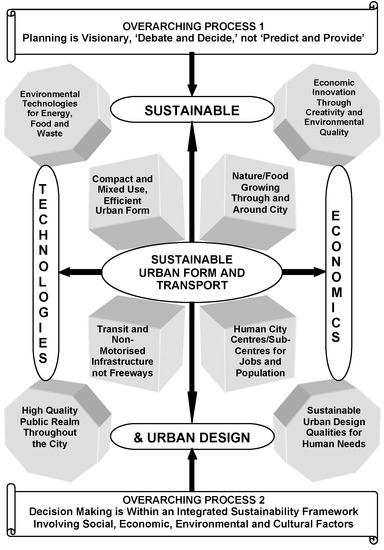
Figure 1.
A conceptual model for eco-cities based on 10 key principles in urban planning, urban transport, urban design, and planning process considerations. Source: [4].
The centre of this simple model suggests that sustainable urban form and transport are at the heart of developing eco-cities. This includes four key factors: Compact and mixed use, efficient urban form; nature and food growing throughout and around the city; transit and non-motorised infrastructure, not freeways; and human city centres and sub-centres for population and job growth. Achieving sustainable operation of the urban planning and transport systems of cities facilitates the achievement of so many other important goals. For example, if less land is consumed for roads and sprawl, local food production within and in the immediate hinterland of a city becomes more feasible. Denser, more clustered building forms are easier to make energy-efficient due to common walls, which result in less exposed building surfaces to dissipate the heating or cooling in individual dwellings. In addition, the heating and cooling in each dwelling are shared through internal walls and floors. Recycling systems are easier to operate due to lower waste collection costs and through residents having deposit points for glass and other materials nearer to home. If fewer roads and less parking are needed, this expands possibilities for more permeable instead of sealed surfaces for better water management.
Around these four key principles are a constellation of another four supportive principles: Environmental technologies for energy, food, and waste; economic innovation through creativity and environmental quality; a high quality public realm throughout the city; and sustainable urban design qualities for human needs.
To achieve these eight principles, it is suggested that two processes are essential: Planning is visionary, “debate and decide”, not “predict and provide”, and decision making is within an integrated sustainability framework involving, social, economic, environmental, and cultural factors.
This paper focuses on the core of Figure 1–how sustainable are the urban forms and transport systems of cities? However, it also touches on key aspects of most of the other factors. Comparing cities to better understand their transport and land use patterns, to gain insights into their strengths and weaknesses, and to deliver policies about how to reduce automobile dependence and improve transport sustainability has a long history in the academic literature [5,11,15,18,19,20,21,22].
Scandinavia is often seen as being rather progressive in many fields, with strong commitments to innovative and green city policies. For example, Copenhagen is known world-wide as being an exemplary city for cycling and trying to reduce car use [23], as well as a focal point of Jan Gehl’s urban design work on creating people-centred cities [24,25].
Stockholm was, in the 1950s, a magnet to planners worldwide who came to see the ground-breaking satellite town concept for places, such as Vällingby, which developed the region based around the new tunnelbana metro rail system. Cervero [26,27] describes how Stockholm transformed itself into a post-war transit metropolis. More recently, Malmö, since the opening of the Øresund bridge, has expanded greatly in its bicycle orientation and quality, perhaps due partly to the closer connection with and influence of Copenhagen [28].
In 2015 Sweden also created K2–Sweden’s National Centre for Research and Education on Public Transport–with the aim of increasing the contribution of public transport to Sweden’s transport task. It is the interest of this organisation in better understanding how urban transport systems work in Sweden that made the research in this paper possible.
This research therefore builds on a long tradition of city comparisons, particularly on the theme of automobile dependence and adds five of Sweden’s most populous cities to the international comparative framework on cities developed by the author and colleagues over the last 40 years. It analyses urban transport and related indicators for the year of 2015 for Stockholm (population 2,231,439), Göteborg (population 982,360), Malmö (population 695,430), Linköping (population 152,966) and Helsingborg (population 137,909). It also compares the characteristics of these Swedish cities to a large sample of other cities in the USA, Canada, Australia, Europe, and Asia. The questions it seeks to answer are:
- (1)
- How do Swedish cities compare in land use, wealth, private, public, and non-motorised transport, as well as other transport-related factors?
- (2)
- Do Swedish cities follow the patterns of European and other cities or are they different?
- (3)
- Are there any policy lessons that can be learned from the comparisons?
To answer these questions, the paper systematically presents the results of the investigation through a series of indicators and discusses each one in turn. It analyses and discusses the results and draws some policy implications. The next section provides the methodology for the paper, followed by the results, then the analysis, discussion, and policy implications, and finally some conclusions.
2. Methodology
Each Swedish city is defined in Table 1 in the way Statistics Sweden defines them, while Table 2 sets out the 35 primary data variables collected for each city and a brief description of what each variable means. Readers can also refer to Kenworthy [29] for a more detailed explanation of the history and methodology of this comparative urban research. Note that for the international comparisons, the results pertain to the years of 2005–2006, but for Swedish cities, the year is 2015. These are the latest updates on this large sample of 41 other cities, which took approximately 7 years to complete.

Table 1.
Definitions of Swedish metropolitan areas in this study.

Table 2.
Detailed description of the primary data variables collected for Swedish Cities.
The validity of the comparisons is mostly not compromised by this 10-year time difference. However, it is explained that with certain variables, such as the metropolitan Gross Domestic Product (GDP), transport deaths, and transport emissions, which can change quite rapidly, the time difference is more significant.
It is important to note that for some variables, the metropolitan area definitions given in Table 1 were modified. For example, metropolitan GDP needs to be calculated on the full functional urban region or “labour market area” (in German, the Arbeitsmarktregion). Also, some public transport services, such as the regional rail, cannot be separated out into smaller areas. In these cases, the population of the larger serviced area is used to calculate per capita figures to ensure that data are not inflated.
Table 3 sets out a guide of what constitutes urban land. Statistics Sweden provides detailed land use inventories for every municipality and county in Sweden on their statistics portal at [30]:

Table 3.
Urban land definition (Item 2, Table 2).
Those categories used for urban land area in Sweden are called “built-up land and associated land”, which consist of:
- Land with one- or two-dwelling buildings;
- Land with multi-dwelling buildings;
- Land used for manufacturing industry;
- Land used for commercial activities and services;
- Land used for public services and public facilities and leisure;
- Land used for transport infrastructure;
- Land used for technical infrastructure;
- Land with agricultural buildings and other buildings.
Careful investigations were made of these land use categories and especially the last one, but in each case, they were found to be comparable to what was used in other cities.
The methodology chosen for this paper to present the results is to compare the five Swedish cities in detail, with both tables and figures showing the values of each variable for these five cities, as well as an average for the five Swedish cities to facilitate comparisons to the other groups of cities. Only averages for the American, Australian, Canadian, and the other European cities, plus the two Asian cities are presented. This was primarily to condense the results of the analysis into a paper of an acceptable length. Readers can refer to [11,15,31] for detailed graphs and tables showing the results for variables on all the other cities.
The metropolitan regions used in this study were: The USA: Atlanta, Chicago, Denver, Houston, Los Angeles, New York, Phoenix, San Diego, San Francisco, and Washington; Canada: Calgary, Montreal, Ottawa, Toronto, and Vancouver; Australia: Brisbane, Melbourne, Perth, and Sydney; Europe: Berlin, Bern, Brussels, Copenhagen, Düsseldorf, Frankfurt, Geneva, Graz, Hamburg, Helsinki, London, Madrid, Manchester, Munich, Oslo, Prague, Stockholm, Stuttgart, Vienna, and Zurich; and Asia: Hong Kong and Singapore.
Urban density is a recurring and unifying theme throughout the paper, with the Swedish cities being compared to the highly auto-dependent metropolitan regions in North America and Australia. Some basic statistical regression analysis using a power function as the line of best fit is used in the discussion section to highlight the somewhat unique cluster of the five Swedish cities on the key two variables of urban density and car use and to use this regression as a predictor of car use for the Swedish cities compared to their actual results. This follows similar regression analyses in many of our other publications [5,15,18].
The study has several limitations. For example, it only compares cities from an aggregate perspective and only for the year of 2015 in the case of the Swedish cities and 2005 or 2006 for the other cities. This impacts some variables more than others and this is explained in the text where relevant. No trends of the data are included, which would have been useful, but which were not available for the Swedish cities due to this being the first time they were included in such comparisons (except for Stockholm) as well as limitations on time and the available funding. For the other cities, 1995 or 1996 and 2005 or 2006 data were consistently available and some analyses of trends have already been made [32].
The data perspectives in this paper are not the only ways that Swedish cities can be viewed in relation to each other and to other cities, and this limitation is partly addressed in the Analysis, Discussion, and Policy Implications section of the paper. Some variables that are included have limitations too, for example, the freeway length. This should ideally be the lane length to indicate capacity. However, even in an age of Geographic Information Systems (GIS) systems, this is an extremely hard, if not impossible, variable to collect consistently across such a large global sample of cities. It was the preferred variable when measuring freeways, but had to be dropped.
3. Results
The results presented here are those that are most pertinent to the eco-urbanism topic and most relevant to answering the research questions. Although Table 2 sets out definitions of all 35 primary variables collected for the study, not all were drawn upon in this paper.
3.1. Land Use, GDP, and Private Transport Infrastructure Characteristics
Table 4 provides a key set of variables on the above three topics.

Table 4.
Land use, GDP, and private transport infrastructure characteristics of Swedish and international cities
3.1.1. Urban Density
Urban density (population divided by urbanised land area, not floor area ratio) is critical in understanding the urban transport characteristics in any city. Low densities are associated with automobile dependence, and higher densities are associated with less automobile dependence and a greater role for public transport, walking, and cycling [18,33]. Although such claims are disputed [34], evidence continues to emerge of density’s fundamental importance in promoting less car use [35].
Swedish urban regions have a low density, averaging less than the larger Canadian cities in 2006 (urban population density of 19.8/ha compared to 25.8/ha) and they are less than half the typical European urban density of 47.9/ha. The Stockholm region has the highest urban density (23.5/ha), while Linköping has a typical US city urban density (13.8/ha). Swedish cities on average have densities at the lower end of the range generally considered necessary for less automobile dependence. We have shown in previous research [36] that urban densities below about 35 persons per ha are associated with steeply increasing levels of car use, but these Swedish cities tend not to follow this norm. These important results on density are referred to in later discussions of the results for other variables and in Section 4 on the Analysis, Discussion, and Policy Implications. Note that the urbanised land area for 2015 from Statistics Sweden was carefully checked for accuracy and compatibility with the urban land area for other cities. There are two categories of land use in Sweden, which could have raised doubts about their low densities relative to other cities, but when checked, they did not. These are namely land for “golf courses and ski pistes” and “land with agricultural buildings and other buildings” (both included in other cities). Even by (incorrectly) taking these two land uses out for Stockholm and Linköping, the highest and lowest density of the Swedish cities, Stockholm would have an urban density of 25.3/ha (instead of 23.5/ha) and Linköping 15.5/ha (instead of 13.8/ha). Figure 2 summarises the results for the cities on urban density.

Figure 2.
Urban density in five Swedish cities (2015) compared to a sample of global cities (2005–2006).
3.1.2. Proportion of Jobs in the CBD
Thomson [37] clearly identified how important the centralisation of work can be in shaping urban transport, especially jobs located in the CBD of cities. The proportion of metropolitan jobs located in the CBDs of Swedish cities shows them to be rather centralised (16.3%), compared to 18.3% in Europe (Figure 3). Swedish cities are the second highest across the city groupings. This generally works in favour of public transport, at least for work-related travel.
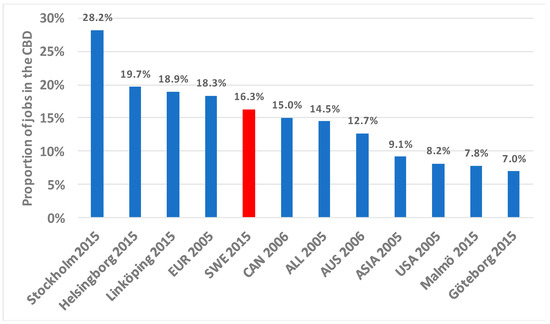
Figure 3.
Proportion of jobs in the CBD in five Swedish cities (2015) compared to a sample of global cities (2005–2006).
3.1.3. Metropolitan Gross Domestic Product (GDP) per Capita
Wealth was measured as metropolitan GDP per capita. The data in Table 4 were calculated for the labour market region of each city (see Table 2). Note that for the purposes of the international comparisons published over many years using my urban comparative data [5,18,22], some of which are contained in the present paper, all financial data were converted to constant 1995 US dollars.
In 2015, Swedish cities were moderately wealthy, averaging $36,393 per capita, which was more than both the Australian ($32,194) and Canadian cities ($31,263) were in 2006. However, the other European cities were generally higher in wealth ($38,683). The global sample in 2005 averaged $37,700. Stockholm, the largest and most important Swedish city, clearly stands out in wealth ($49,271) and in 2015 was higher than the US cities were in 2005, the wealthiest group in the global sample ($44,455). Helsingborg and Linköping, the two smaller Swedish cities in the sample, perhaps unsurprisingly, were the least wealthy of the five Swedish cities (averaging $29,588).
Of course, GDP is one of the variables that does change significantly over time. Therefore, the Australian, Canadian, and European cities’ GDPs by 2015 would likely be significantly higher than that of the Swedish cities in 2015. The two Asian cities are still likely to have lower GDPs per capita than those in Sweden, but they are likely to have caught up significantly.
3.1.4. Road Length per Capita
When all roads are considered, from residential streets to freeways/highways, the Swedish cities are well-endowed, averaging 6.5 m/person. This is less than in Australian cities (7.6 m/person), similar to US cities (6.0) and higher than in Canadian cities (5.4). It is also more than double the European cities with only 3.1 m/person, though this is somewhat to be expected, given the lower densities of the Swedish cities (road length increases as densities decrease due to the commensurate longer roads needed to service development). Again, logically, Stockholm has the least roads (4.7 m/person), while Linköping, the least dense of the Swedish cities, has the most (9.1 m/person).
3.1.5. Freeway Length per Capita
Freeways are a premium road infrastructure and are much more indicative of automobile dependence than roads per se. Freeways have been known for decades to encourage and increase car use [38]. Ideally, freeways should really measure lane-kilometres for a better indication of capacity, but, in practice, as already explained, it is surprisingly difficult to obtain even a linear length of freeways, let alone lane-kilometres. A pattern begins to emerge here in the Swedish cities of a relatively strong orientation to the car. This is despite a comparatively moderate wealth when measured by metropolitan GDP per capita, though it does tend to correlate with the lower densities of Swedish urbanism.
Combined with lower densities, the Swedish cities are well-endowed with freeways, averaging 0.230 m/person, significantly higher than any other group of cities in the global sample. US and Canadian cities had in 2005/6 some 0.156 and 0.157 m/person of freeway, respectively, while the global sample averaged 0.112 m/person or less than half that of the Swedish cities. In keeping with Stockholm’s distinctive features, it also has the least freeway infrastructure (0.138 m/person), while Helsingborg, on a per capita basis, is the highest city in this global sample for freeways. Figure 4 depicts this significant result.
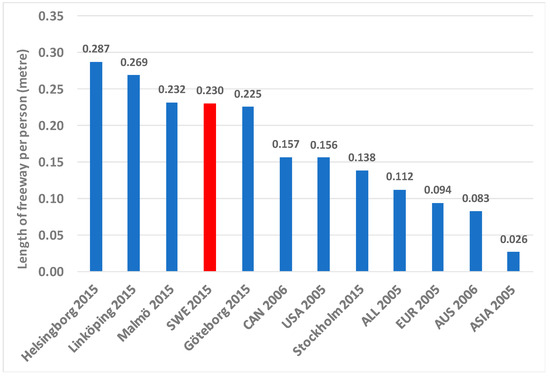
Figure 4.
Freeway linear length per person in five Swedish cities (2015) compared to a sample of global cities (2005–2006).
3.1.6. Parking Spaces per 1000 CBD Jobs
Parking availability and, to a lesser extent, cost are key determinants influencing how likely people are to use cars [39,40]. For trips to the CBD, parking is comparatively limited in Swedish cities, with only an average of 246 spaces per 1000 jobs, theoretically meaning that only about 1 in 4 people working in the CBD would be able to park a car. It is about the same in other European CBDs (248 spaces per 1000 jobs). This also favours public transport, walking, and cycling access to Swedish city centres. Additionally, parking in Swedish cities is greatly below that of all the other regions, apart from the Asian cities (Figure 5).
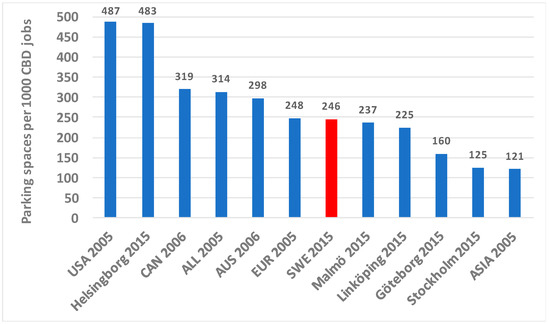
Figure 5.
Parking spaces per 1000 CBD jobs in five Swedish cities (2015) compared to a sample of global cities (2005–2006).
3.1.7. Passenger Cars and Motorcycles per 1000 Persons
Ownership of private vehicles is important in determining car use. So far, Swedish cities in density, roads, and freeways present themselves as being rather auto-oriented. However, in car ownership, interestingly, this picture begins to change.
Figure 6 presents car ownership statistics showing that Swedish cities in 2015 averaged a comparatively modest 423 cars/1000 persons. This is below the averages for all other groups of cities (Australian and American cities were 647 and 640 cars/1000 persons, respectively, and European cities had 463 cars/1000 persons in 2005), and the global sample overall was 512 cars/1000. Only the two large Asian urban regions have less, with a paltry 78 cars/1000. Stockholm has only 398 cars/1000, while the Malmö region has 442/1000. Swedish car ownership is thus in a tight and comparatively modest band between about 400 to 450 cars per 1000 persons. It would be expected that by 2015, the other cities would have increased a little more in car ownership, further emphasising the low result in Sweden. Car usage, a more important factor than car ownership per se, is considered later in the paper.
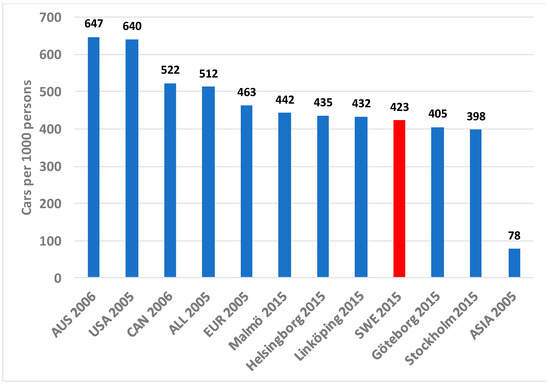
Figure 6.
Car ownership in five Swedish cities (2015) compared to a sample of global cities (2005–2006).
In Swedish cities, like in many other cities in the developed world, motorcycles play a relatively small role in urban transport. Motorcycles per 1000 persons in the five cities averages only 30, (one motorcycle for every 33 people), which is less than in the European cities in 2005 (41), but quite a bit higher than in the US (16), Australia (21), Canada (15), and Singapore and Hong Kong (19). Motorcycle usage is also considered later in the report.
3.1.8. Average Road System Speed
One traditional traffic engineering measure of the effectiveness of any urban road system is its level of service, the key factor being average speed. Table 4 provides an average speed of 37.3 km/h for the Swedish cities, which, with all their freeways, is as expected higher than other European cities (34.3 km/h) and the Asian cities. It is, however, much slower than in North American and Australian cities, which collectively average 46.2 km/h. A more important factor for sustainability and reduced automobile dependence, however, is the relative speed between public and private transport, which is covered later.
3.2. Public Transport Infrastructure and Service
Table 5 provides a set of indicators on public transport infrastructure and service.

Table 5.
Public transport infrastructure and service characteristics of Swedish and international cities.
3.2.1. Public Transport Line Length per Person
This item is the per capita total length of all public transport lines. Table 5 shows that these five Swedish cities have a very high per capita provision of public transport lines, which is by far the highest on average of all cities in the global sample. They have a 77% higher line length per person than the European cities, the next highest in the sample. This suggests that Swedish urban regions make a serious effort to provide their populations with public transport services, but this item does not give an indication of how well-serviced the lines are. A line providing an hourly service is not of great utility compared to a line with a 10-min service. A more detailed analysis would be required to measure the effectiveness of this high public transport line length per person.
3.2.2. Reserved Public Transport Route Length per 1000 Persons
A more revealing item is the extent of reserved public transport routes. This is a route that is fully protected from general traffic and therefore not subject to hold-ups due to congestion. It consists mainly of rail lines, some parts of tram/Light Rail Transit (LRT) systems, and of course busways. Table 5 shows the data by mode in each city. The magnitude of this variable is a measure of the likely quality of public transport services because such routes offer speedier travel and more reliable timetables, and the services operating on them often can compete with the speed of cars, which are frequently stuck in parallel traffic jams. Table 5 suggests that Swedish cities are well-endowed with reserved public transport routes, exceeding by a small margin even that of other European cities. This is mainly achieved by rail systems and less so by bus lanes, except in Göteborg, where bus lanes are more common and represent a higher proportion of the reserved routes than in the other four Swedish cities.
Figure 7 provides an overview of these data showing that Helsingborg and Linköping have the highest provision, while Malmö has the least. It shows the modest density Swedish cities in a much better light than the low density American, Australian, and Canadian cities. Asian cities are also less well-endowed with reserved routes on a per capita basis, but this is partially explained by their high densities.
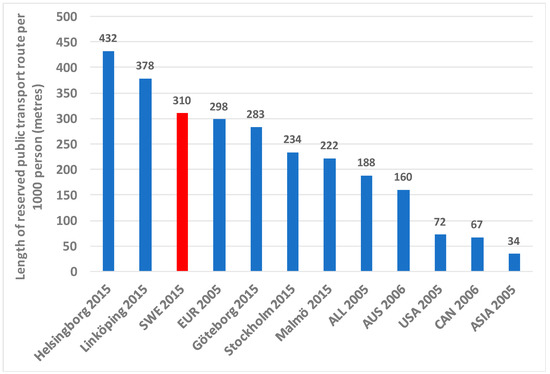
Figure 7.
Reserved public transport route per person in five Swedish cities (2015) compared to a sample of global cities (2005–2006).
Note that it was extremely difficult to assemble data on the bus lane lengths in Sweden. Each municipality controls them and there are further bus lanes provided nationally on larger roads. There is no single repository of this information. The data reported here represent a unique compilation in Sweden as it was collected carefully from 28 municipalities and for bus lanes on national roads from the national level.
3.2.3. Public Transport Seat Kilometres of Service per Person
Seat kilometres of public transport service per person represents a reasonable measure of the extent and capacity of public transport services. Swedish cities again distinguish themselves well (Table 5). Their average level of 6895 seat kilometres per person for all modes combined exceeds even the average European level of 6126 km and is much larger than in Australia, the USA, or Canada. Only Asian cities with their extensive metro systems exceed the Swedish level. Even Linköping, the lowest of the Swedish cities (4647 km), is higher in seat kilometres than the averages for Australia, the USA, and Canada.
Again, this suggests that the inherent disadvantage for sustainable transport of lower density cities in Sweden is at least partially overcome or offset by a very high commitment to providing public transport services, a quite unusual combination, given that it is harder for public transport systems to attract passengers in lower density settings (Figure 8).
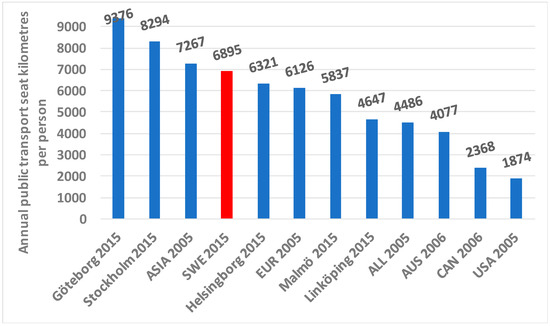
Figure 8.
Annual public transport seat kilometres of services per person in five Swedish cities (2015) compared to a sample of global cities (2005–2006).
3.2.4. Average Public Transport System Speed
Speed-competitiveness in public transport is an important factor in helping to determine public transport use. The relative speed between public and private transport is particularly important [33]. First, the average speeds amongst the public transport systems must be compared. Table 5 contains the speed data by mode and reveals that Swedish cities, overall, have relatively healthy average speeds for their public transport systems (the overall speed of the entire public transport system is weighted by the passenger hours for each mode). At 36.3 km/h, the five Swedish cities have the highest public transport speeds of all cities, ahead of the next highest, the Australian cities, which average 33.0 km/h. The global average here was only 25.1 km/h and the European cities are a little better at 29.8 km/h.
The Swedish cities achieve these high average speeds predominantly because of the high average speed (71.5 km/h) of the suburban/regional rail trains that operate over long distances, with significantly higher speeds than the suburban rail systems in other cities (51.7 km/h for the global average), which mostly operate over smaller distances. However, the Swedish urban bus systems also have the highest speed in the global sample, averaging 27.1 km/h, which is very competitive when compared to the bus system average speeds in all other groups of cities (the range was 23.6 km/h in Helsingborg and 31.3 km/h in Linköping). The global average speed for urban buses was only 21.5 km/h, and the European cities only 21.9 km/h, so Swedish urban bus services clearly operate at healthy speeds compared to other cities.
3.3. Public Transport Use
Table 6 shows public transport use in the cities using two indicators, annual boardings per person, which does not account for travel distances, and annual passenger kilometres per person, which builds in the travel distances by passengers and is an indicator that can be compared to car passenger kilometres.

Table 6.
Public transport use in Swedish and international cities.
3.3.1. Annual Public Transport Boardings per Person
The annual public transport boardings per person is one measure of the usage of public transport. Table 6 shows that on average, these five Swedish cities are only moderate in their use of public transport (195 boardings/person). This is considerably higher, however, than the average usage of public transport in American (67), Australian (96), and Canadian cities (151). On the other hand, European cities in 2005 had 386 boardings per person (or virtually double the Swedish level) and the global sample average was 254 per person. The lower density of these Swedish cities and their generous road and freeway networks probably explain at least some of this lower public transport usage, along with their lower levels of rail service.
The Swedish cities had 114 bus boardings per person while the European cities had 145. Notwithstanding this difference in bus use in favour of European cities, the big distinguishing factor was the use of urban rail modes (trams, light rail, metro, and suburban rail). While European cities had 240 annual boardings on all rail modes, Swedish cities had only 80 or one-third as much. Stockholm, where rail is much more abundant, had 214 rail boardings per person, even though, overall, it is a comparatively low density region (24 persons/ha).
Stockholm has, however, developed at focused and significantly higher densities and mixed land uses around many rail stations on the tunnelbana network throughout the region, where such higher densities (and mixed land uses) support the use of rail [26]. Stockholm’s relatively new and expanding tram/light rail lines are also in areas of high density. The low per capita use of rail in both Malmö, Linköping, and Helsingborg is noteworthy, being lower than even that in the larger US cities (Figure 9).
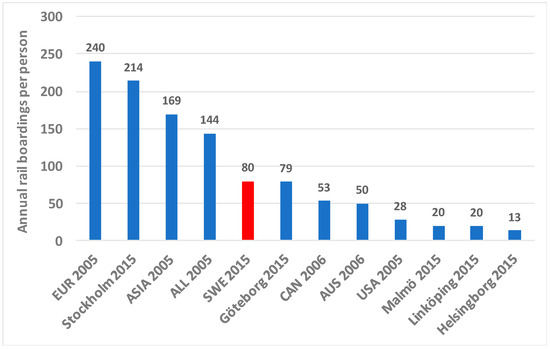
Figure 9.
Annual rail boardings (tram, light rail, metro, and suburban rail) per person in five Swedish cities (2015) compared to a sample of global cities (2005–2006).
3.3.2. Public Transport Passenger Kilometres
When public transport passenger kilometres per capita are examined, a slightly different picture emerges of public transport in Swedish cities. In this, Swedish cities have healthier levels of public transport use, possibly because of their lower densities, requiring longer trips on public transport. So, whereas boardings averaged only 195 per person and were 49% lower than the European cities, passenger kilometres per person averaged 1792 per person in the Swedish cities compared to 2234 in European cities or only 20% less (Figure 10).
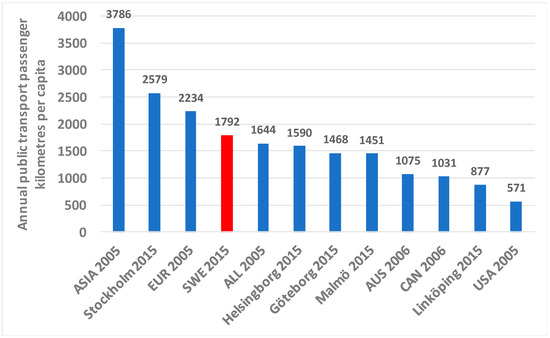
Figure 10.
Annual public transport passenger kilometres per person in five Swedish cities (2015) compared to a sample of global cities (2005–2006).
Table 6 also shows that while rail only constituted 41% of total boardings per capita in the Swedish cities, rail accounts for 54% of the total average per capita public transport passenger kilometres. Unsurprisingly, rail is used to travel longer distances by public transport in Swedish cities. Finally, the data also show that the Swedish cities far exceed the public transport passenger kilometres per capita in the American, Australian, and Canadian cities. Clearly, and despite comparatively low densities, Swedish cities offer public transport systems that account for a lot more travel than in auto-oriented cities and only 20% less than in a large sample of other European cities. Figure 10 displays these results.
3.4. Car and Motorcycle Use and Modal Split
Table 7 provides the annual per capita car and motorcycle use in the cities (passenger kilometres travelled or PKT) and the modal split for all daily trips by all purposes.

Table 7.
Car and motorcycle use and modal split in Swedish and international cities.
It is important to understand the prominence of different transport modes and this is usually best expressed by modal split data from travel surveys (Table 7). The latest of these surveys were gathered from each Swedish city and the percentage of daily trips by non-motorised modes (walking and cycling), public transport, and private transport were collected. Taxis were classed as private transport.
3.4.1. Non-Motorised Modes Modal Share
Despite having cold weather for much of the year, the Swedish cities acquit themselves well in walking and cycling, averaging 27.1% of all daily trips by these modes. The best performing cities were Linköping (33.0%), which probably benefits from its small size and shorter travel distances, and Malmö (31.2%) due to its strong orientation to bikes (mostly in the core parts of its metropolitan region). Stockholm was the lowest of the Swedish cities on this factor with 22.1%, though it is by far the best for public transport (see next section). The Swedish cities were lower than the other European cities for walking and cycling, which were the best globally at 34.5%, but some clearly come close. As shown in Figure 11, compared to every other group, the Swedish cities were the next best for walking and cycling.
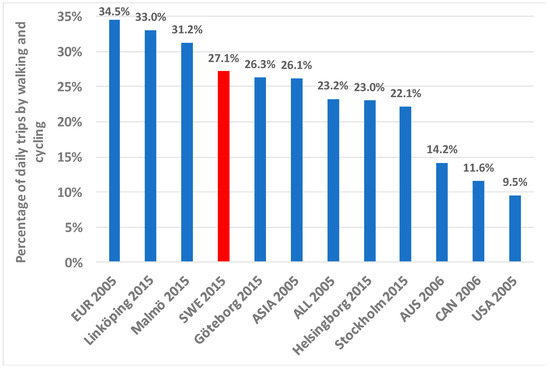
Figure 11.
Percentage of daily trips by non-motorised modes in five Swedish cities (2015) compared to a sample of global cities (2005–2006).
3.4.2. Public Transport Modal Share
Public transport’s share of daily trips in Swedish cities (19.4%) was much better on average than in the American, Australian, and Canadian cities, but was less than the European figure of 22.4% and was less than half of the two Asian cities (46%). The range on the public transport mode share within these five Swedish cities was also large with Linköping, the lowest density Swedish region, having only 9.7% (just a bit more than in Australian cities), while Stockholm reached 31.6%, much higher than the European average and the only Swedish city to achieve this. Globally, the Swedish cities exceeded the average of 16.8%. So again, while not being as good as other European cities, these Swedish cities do comparatively well in public transport measures on a global scale, given their disadvantages of having a low density, high road and freeway provision, and fewer rail systems (Figure 12).
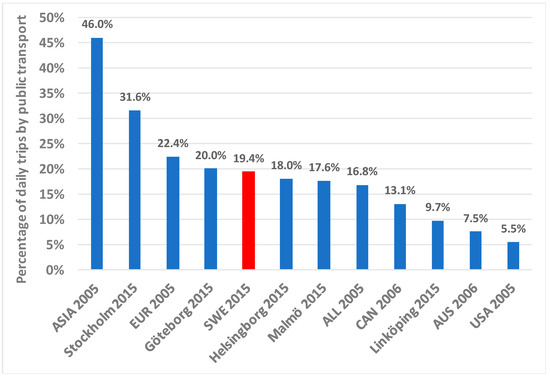
Figure 12.
Percentage of daily trips by public transport in five Swedish cities (2015) compared to a sample of global cities (2005–2006).
3.4.3. Modal Share by Private Transport Modes
This is the corollary of the previous two modal share variables. A little over half of all daily trips (53.5%) in Swedish cities are by private motorised modes. While this is not at the European level of only 43.1%, it is still an enviable modal split globally. American cities have 85% of all trips by private transport, Australian cities have 78%, Canadian have 75%, and the global average was 60% in 2005. Stockholm is clearly the lowest city in private transport with only 46.3%, or much closer to the European level, while Helsingborg experiences 59.0% of daily trips by private modes. Malmö, in 2015, is split equally between the sustainable modes and private transport modes (51.1% private transport). While the trip making level and its split by private transport is important, the actual kilometres of driving by private transport is also critical to understand because it is driving that consumes energy, emits pollution, causes traffic accidents, and affects public spaces in a city.
3.4.4. Car Use
Car use is effectively measured by per capita passenger kilometres of travel, which is a factor that can then be compared to the equivalent for public transport (see later section). Table 7 and Figure 13 show that Swedish cities again revolve around a tight mean for this measure of car use, but, due to the lower car occupancy in Sweden of 1.30 compared to 1.38 in European cities, car use per capita is essentially the same in Sweden as in other European cities. Only the two Asian cities are lower than any of the Swedish cities and the averages for the other groups of cities are all significantly higher than in any Swedish city. The next highest is the Canadian cities at 8495 passenger kilometres per person compared to Swedish cities with only 6751 (some 21% lower). This low result for Swedish cities is discussed further.
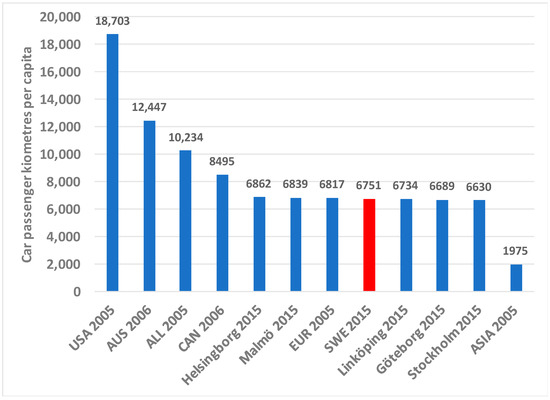
Figure 13.
Annual car use per person (PKT) in five Swedish cities (2015) compared to a sample of global cities (2005–2006).
3.4.5. Motorcycle Use
Swedish cities are low in motorcycle use. On average, they are by far the lowest of all groups of cities, with only Göteborg having an annual motorcycle PKT that essentially equals that in the American and Australian cities (Table 7).
3.5. Private–Public Transport Balance Indicators
Table 8 presents three important indicators of the priority which public transport enjoys in cities.

Table 8.
Private–public transport balance indicators in Swedish and international cities.
3.5.1. Proportion of Total Motorised Passenger Kilometres on Public Transport
This indicator represents public transport’s proportion of total car, motorcycle, and public transport passenger kilometres. Table 8 and Figure 14 show that Swedish cities average a little over 20% in terms of their total motorised mobility by public transport, compared to 24.5% in other European cities. Though this is less from a European perspective, it is much better than in the USA (3.2%), Australia (8.0%), or Canada (11.3%). Furthermore, Stockholm and Göteborg are higher than the European average with 27.8% and 26.7%, respectively. Again, Swedish cities acquit themselves relatively well in overall transport sustainability, though much can still be improved.
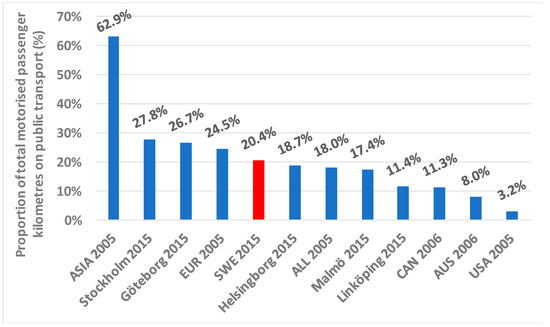
Figure 14.
Proportion of total motorised passenger kilometres on public transport in five Swedish cities (2015) compared to a sample of global cities (2005–2006).
3.5.2. Public versus Private Transport Average Speed
The relative speed between public and private transport (or general road traffic) is an important mode choice factor, since people generally prefer the fastest mode. Figure 15 shows that overall, public transport systems compete very well with cars in Swedish cities. The data suggest a near parity situation, ranging from public transport being 27% faster in Linköping to it being only 79% as fast in Göteborg (most likely because of slower trams). Compared to all groups of cities, including the European cities, Swedish cities do better on this item. European cities’ public transport systems average at 88% as fast as cars and American cities are only 55%, such that their public transport systems do not compete well with cars in terms of speed.
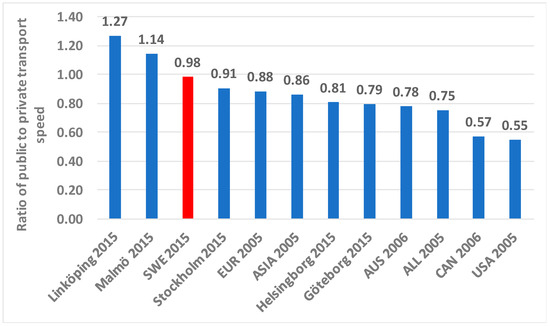
Figure 15.
Relative speed of public transport versus general road traffic in five Swedish cities (2015) compared to a sample of global cities (2005–2006).
3.5.3. Reserved Public Transport Route versus Freeways
One way of measuring the relative commitment in cities to cars versus public transport is through a comparison of their respective highest order transport infrastructure. For cars, this is freeways (Figure 4), and for public transport, it is reserved public transport routes (Figure 7). Table 8 and Figure 16 show the ratio of these two items. They reveal that the five Swedish cities have 1.36 times more reserved public transport route than they do urban freeways. Although this suggests a greater priority to public transport, the value is low in this global sample and only better than the Canadian and American cities. Other European cities have 5.51 times more reserved public transport routes than freeways and the global sample has 3.16 times more. Although Swedish cities have comparatively good busway lengths and regional rail lines, this is unfortunately eclipsed by the extensive freeway systems.
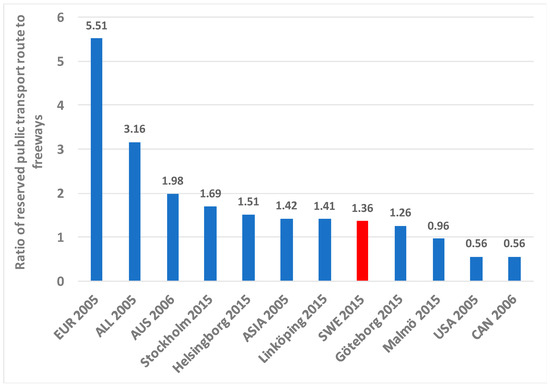
Figure 16.
Ratio of reserved public transport route to freeways in five Swedish cities (2015) compared to a sample of global cities (2005–2006).
3.6. Some Transport Outcomes
Private and public transport energy use, transport emissions, and transport fatalities are important aspects of eco-urbanism in transport (Table 9).

Table 9.
Energy, emissions, and transport fatalities in Swedish and international cities.
3.6.1. Private Passenger Transport Energy Use per Capita
Energy use, with its attendant costs and local environmental impacts, as well as climate change implications, is an important characteristic of urban transport systems. The annual per capita energy use in private motorised passenger transport in Swedish cities was calculated backwards from the comprehensive emissions inventories that exist in Sweden for each municipality [41]. Transport is one of the sectors in these emissions inventories, which is further broken down into its component parts and provides CO2 equivalent emissions, as well as all other transport emissions for each municipality (see next section). CO2 was converted to energy use.
The five Swedish cities in 2015 averaged 15,886 MJ/person, which is virtually the same as the average for the other European cities in 2005 (15,795 MJ). It is close to half the global sample average of 28,301 MJ and dramatically below the American, Australian, and Canadian cities (Table 9). Only the Asian cities as a group have a lesser energy use per person value for private passenger transport (6076 MJ), but they are of course radically denser than Swedish cities. Stockholm consumes the least energy of the Swedish cities, with 12,051 MJ/person, and Linköping, with the lowest density of the five Swedish cities, is the highest (18,124 MJ/person). Swedish cities in 2015 performed comparatively well against other cities in the world, consuming only moderate quantities of energy in this potentially energy hungry sector. Improvements are, however, always possible through less driving and better technology.
3.6.2. Public Transport Energy Use per Capita
The use of energy in public transport systems is important to understand and to compare with its private passenger transport equivalent. Public transport energy use data were obtained from each of the public transport operators based upon the known consumption from fuel payments (Figure 17).
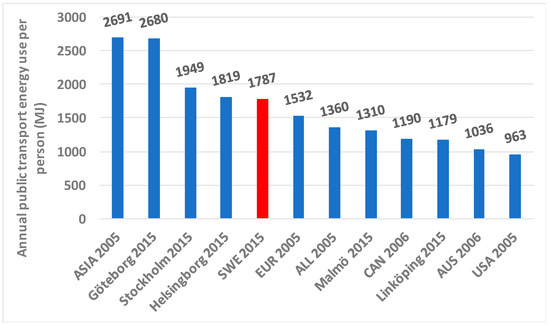
Figure 17.
Annual public transport energy use per person in five Swedish cities (2015) compared to a sample of global cities (2005–2006).
Swedish cities have a slight higher energy use by public transport than the other European cities, and significantly more than in the three auto-oriented groups of cities with their lesser public transport systems. Stockholm, not surprisingly, consumes more energy for public transport, but Göteborg consumes the most per person, being virtually equal to that of the two Asian giants, and Linköping consumes the least, roughly equal to Canadian consumption levels. Compared to private passenger transport energy use, it shows how much less energy public transport consumes and how relatively energy-efficient it is on a per passenger-km basis (see Kenworthy [31].for a full set of data on modal energy efficiencies in global cities).
3.6.3. Transport Emissions per Capita
Air pollution derived from transport systems is a very important source of emissions in urban areas. This research collected the annual emissions of four air pollutants, CO (carbon monoxide), NOx (nitrogen oxides), SO2 (sulphur dioxide), and VHC or VOC (volatile hydrocarbons or volatile organics), and normalised them on both a per person and spatial basis (kg of combined emissions per person and per total ha and urban ha of land).
Swedish cities do extremely well in this factor, averaging only 18 kg per person for the four pollutants combined, compared to the global sample average of 98 kg and the European average of 35 kg per person. The Swedish cities are also vastly better than the American, Australian, and Canadian cities (Figure 18).
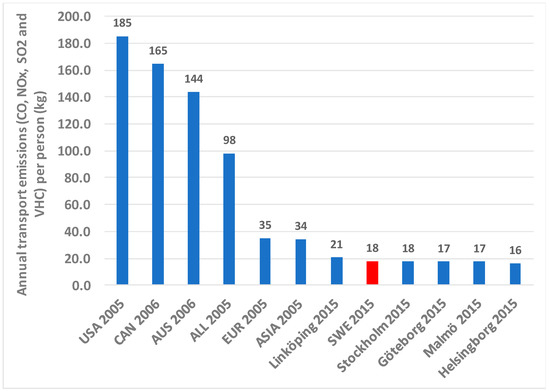
Figure 18.
Annual transport emissions per person in five Swedish cities (2015) compared to a sample of global cities (2005–2006).
It must be noted, however, that emissions from transport tend to be on a significant downwards trajectory due to tighter regulations and automotive technological advances, so it is likely that by 2015, the other cities would have reduced their emissions. The difference between Swedish cities and the rest will likely narrow significantly. Within Sweden, the per capita transport emissions are tightly clustered. Linköping was the highest emitter with 21 kg per person and Helsingborg was the lowest at 16 kg.
The spatial intensity of transport emissions in Swedish cities is very low at only 349 kg per urban ha compared to European cities in 2005 of 1718 kg and the global sample of 2446 kg. Part of the reason is of course the low density of Swedish cities and the larger areas of urban land over which emissions are spread. Overall, this will tend to decrease the direct exposure of populations to air emissions and therefore lower any impacts. Contrastingly, in the Asian cities, where per capita transport emissions are low, the spatial intensity of emissions (5401 kg per urban hectare) is very high due to their very high densities, so population exposure will tend to be much greater. Emissions per total hectare of land follow the same pattern as the urban hectare variable, with Swedish cities being radically lower than all others.
Again, in both these factors, the difference between Swedish cities and the others will diminish as the per capita and per ha figures are very likely to have declined between 2005 and 2015 in the other cities.
3.6.4. Transport Fatalities
A major cost and source of human pain and suffering in cities is the loss of life in urban transport systems. This factor measures the transport deaths in cities using the World Health Organisation’s (WHO) International Classification of Diseases codes (ICD10), which are much more accurate and reliable than police records. They record the cause of death in hospitals in the case of transport accidents up to 30 days afterwards as being attributable to transport reasons. Police records typically only record deaths at the scene of an accident.
The Swedish cities perform excellently, recording a low 1.6 deaths/100,000 compared to 5.5 globally, 3.4 in the European cities, and an average of 7.3 in the American, Australian, and Canadian cities where exposure to automobiles, through sheer usage levels, is the highest (Figure 19).
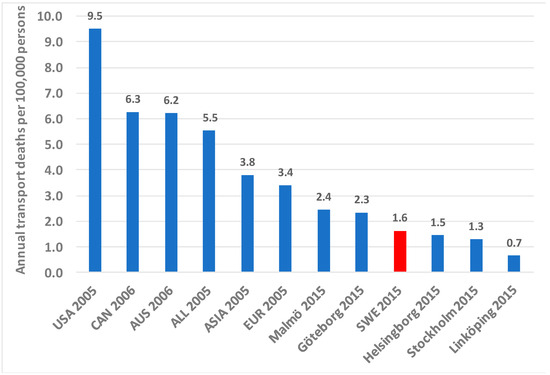
Figure 19.
Annual transport deaths per 100,000 persons in five Swedish cities (2015) compared to a sample of global cities (2005–2006).
Within Sweden, the transport deaths vary, with Malmö having the worst record at 2.4 deaths/100,000 and Linköping the best at only 0.7. Sweden’s national Vision Zero policy appears to have had an impact in reducing transport deaths to the lowest value in this global comparison. This factor, like emissions, will have narrowed as the other cities are also likely to have decreased in terms of transport deaths by 2015.
4. Analysis, Discussion, and Policy Implications
The first and second research questions were: How do Swedish cities compare in land use, wealth, private, public, and non-motorised transport, as well as other transport-related factors? Do Swedish cities follow the patterns of European and other cities or are they different?
The data here suggest that as a group, Swedish cities are somewhat unique and distinguish themselves in particular from other European cities in a number ways. Car use per person is almost identical in car passenger kilometres per person compared to other European cities. Use of cars in Swedish cities is much lower than in the three auto-dependent regions of the USA, Australia, and Canada. This can be seen in the analysis of urban density versus per capita car use. Figure 20 shows the urban density of the global sample of cities regressed with the annual car use per capita (passenger kilometres) using a power function as the line of best fit (see Methodology section). The five Swedish cities are shown in red. It can be clearly seen that the Swedish cities form an outlier, achieving lower car use than is typical in this global sample of wealthy cities at equivalent lower densities.
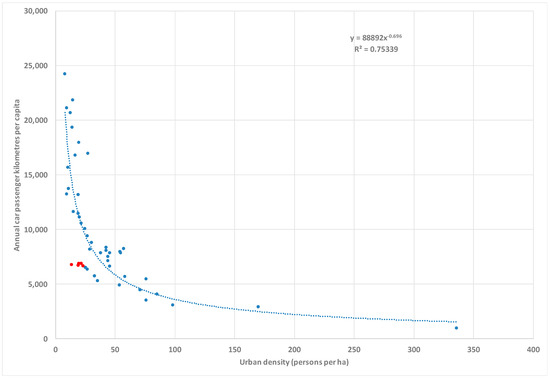
Figure 20.
Annual car passenger kilometres per person versus urban density in a global sample of 48 cities (Swedish cities, 2015 in red, remainder of data, 2005–2006).
Fitting the power equation for the line of best fit (r2 = 0.75) to the average Swedish urban density of 19.8 persons per ha, we obtained a predicted annual PKT per capita of 11,127 km. However, the actual average is 6751 PKT per capita, or 39% lower than would be typical for this density. The performance of public transport, walking, and cycling in the mobility patterns of Swedish urban residents apparently keeps their car use to atypically low values for such low densities and overcomes the auto-dependence inducing effects of high road and freeway provision. The ‘transit leverage effect’ [42]., where one passenger kilometre on public transport replaces multiple passenger kilometres by car, is likely having some effect here [5]. This substitution of car passenger kilometres appears to be primarily related to the trip-chaining behaviour of public transport users for trip purposes that would be otherwise made in individual car journeys.
The theory of urban fabrics possibly also helps to explain some of the results [12]. This theory shows that cities are all made up of different compositions and proportions of walking city fabrics, public transport city fabrics, and automobile city fabrics, the first two of which have much more sustainable mobility patterns. Walking cities, public transport cities, and automobile cities are depicted graphically in Newman and Kenworthy [5].
While Swedish cities do have lower overall densities than is typical of European cities, they also still have significant areas of urban fabric that are either walking or public transport in their orientation, with significantly higher urban densities and mixed land uses. In these areas, public transport is more effective and walking and cycling are more frequently used due to the shorter travel distances required.
There are other ways of investigating in more detail the differences in urban fabric typologies within individual cities, which may further explain why some areas achieve better outcomes in sustainable transport. A particularly useful approach is to use street-based metrics to characterise urban typologies [43]. This approach can distinguish, for example, differences in vegetation in different areas of cities, which can in turn have a significant effect on the attractiveness of neighbourhoods for walking and cycling. It is also useful in depicting in a quantitative way the relationship between streets and buildings.
Two important factors in urban design regarding streets and buildings is the level of horizontal and vertical enclosure, which affects the walking and cycling attractiveness of neighbourhoods, and even the propensity or willingness of people to access public transport stops on foot or by bike. Street metrics can help to reveal this in a systematic and quantitative way. In areas where streets are too wide relative to the height of buildings (bad vertical enclosure), poor walking environments are generally evident. In areas where streets have significant holes in the urban fabric due to, for example, surface parking lots (poor horizontal enclosure), they also detract from walking and cycling [11].
Therefore, urban density per se, while fundamental in determining transport patterns, has numerous mediating factors, such as building heights and volumes, that help determine the experiential quality of both higher and lower densities. In the case of this research on a broad scale comparisons of cities, it was not possible to compare cities on such a detailed basis. However, further research on street metrics might reveal additional supportive reasons why these five Swedish cities achieve an overall lower car use at relatively low densities.
Given the above matters, it is important for readers to have at least some visual appreciation of the character of Swedish urban development and transport systems, which the numbers in this paper can only partially convey. Figures 21 to 29 show key examples of the differences in the urban fabrics for the Stockholm and Malmö metropolitan areas. Figure 21 shows a dense, traditional European five to ten-storey apartment development in Malmö, but with lower density neighbourhoods in the background. It is likely that these denser kinds of areas, which exist in all the Swedish cities to greater or lesser extents, are critical in explaining the relatively high rates of walking and cycling, as well as bolstering public transport use.
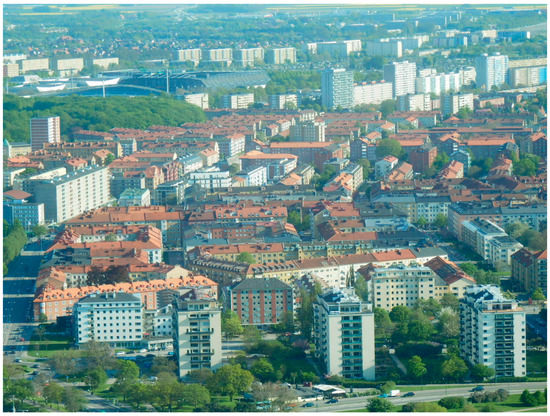
Figure 21.
Walking and public transport-oriented neighbourhoods in Malmö in the foreground, with lower density areas in the distant background. Source: Jeffrey Kenworthy.
Figure 22 reveals the high-quality walking and cycling environments that can occur in such dense areas. A common theme in Swedish urban environments is to link urban development with a relatively good walking and cycling infrastructure. In Stockholm’s satellite towns, such as Vällingby and Kista, pedestrians and cyclists are physically separated from traffic and it is possible to travel between these satellite centres by bike or foot, sometimes through areas of forest or farmland.
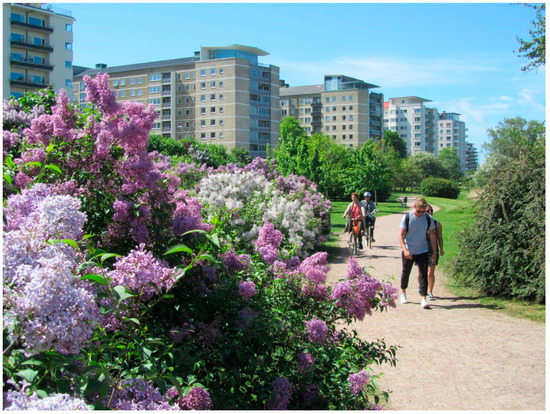
Figure 22.
Quality walking and cycling environments in the inner city of Malmö. Source: Jeffrey Kenworthy.
Figure 23 shows the new West Harbour development in Malmö, which is based strongly around walking and a very good cycleway system. Such redevelopment of brownfield sites, for example, former dockland or industrial areas in cities, is often important in demonstrating new, more sustainable ways of urban development [44]. A significant problem for Malmö’s West Harbour is that it is only served by buses and therefore lacks a clear centre or anchor point based around a rail station to give it more focus and sense of place. Much of the land, which is still vacant and awaiting build-out, is used for parking. This tends to set auto-oriented mobility habits somewhat early, rather than engendering a more positive public transport-oriented mobility culture from the outset.
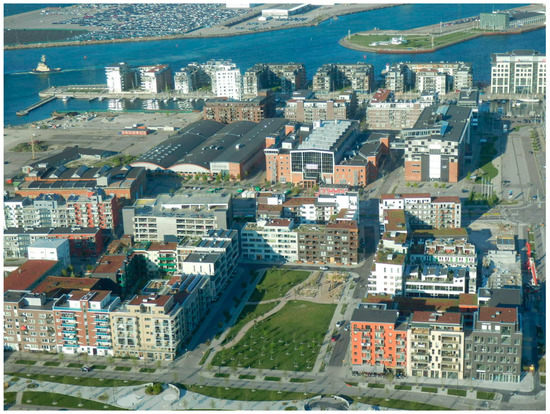
Figure 23.
New urban redevelopment in Malmö’s West Harbour adds a new walking urban fabric, but lacks rail-based transport. Source: Jeffrey Kenworthy.
Figure 24 depicts a much more car-oriented neighbourhood in Lund, which is only served by buses. It does, however, have rather good off-road cycling facilities, especially through farmland and other green areas, which are conducive to safe and attractive cycling that in turn helps to minimise car dependence. Cycling is, however, limited to a degree by a lack of mixed land uses near housing, which is in turn linked to low density. Without a critical mass of population to frequent local amenities, such as shops, medical facilities, and so on, it is not viable to provide them. Based on the author’s own observations and cycling in this area, there is, nonetheless, significant recreational cycling, which, among other things, has health advantages.
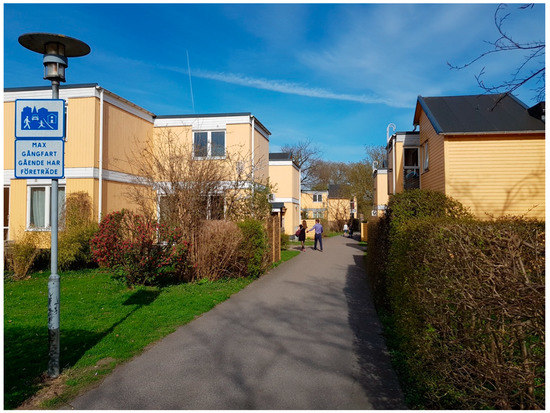
Figure 24.
Lower density style neighbourhood in Lund in the Malmö metropolitan area. Source: Jeffrey Kenworthy.
Figure 25 illustrates how the Stockholm region has a mixture of very high density core areas around tunnelbana stations, which then taper off into much lower density, suburban-style housing areas. One of the original planning ideas for such sub-centres was to achieve a reasonable jobs-housing balance, but in practice, people who live in one sub-centre work somewhere else. The transport problems of this reality are, however, mitigated to a high degree by the excellent way these sub-centres are served by the tunnelbana to the city centre and other sub-centres along the lines, as well as the feeder buses that bring people from lower density areas to the tunnelbana stations [26,27].
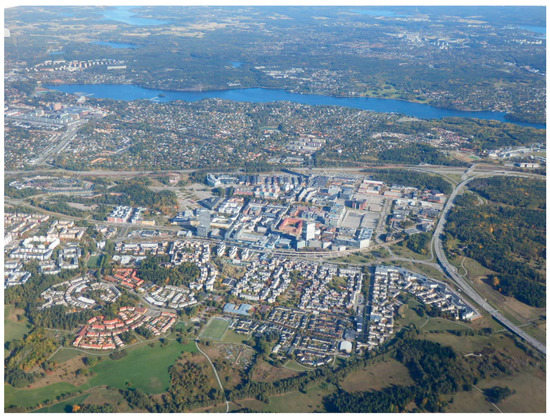
Figure 25.
Kista satellite town in the Stockholm region showing dense, mixed, walkable, and transit-oriented urban forms built at Kista tunnelbana station, but much lower, suburban style development in other areas. Source: Jeffrey Kenworthy.
Figure 26 and Figure 27 show the dense central and inner areas of Stockholm with excellent public transport and walking conditions. Public transport here includes buses, trams, and tunnelbana, as well as regional rail services. The urban fabrics in these areas were created in the walking and public transport city eras and are thus ideally suited to these more sustainable modes. Stockholm has also pedestrianised significant parts of its central area, which makes it very conducive to walking (and cycling), though the winters make these modes much less attractive in colder months.
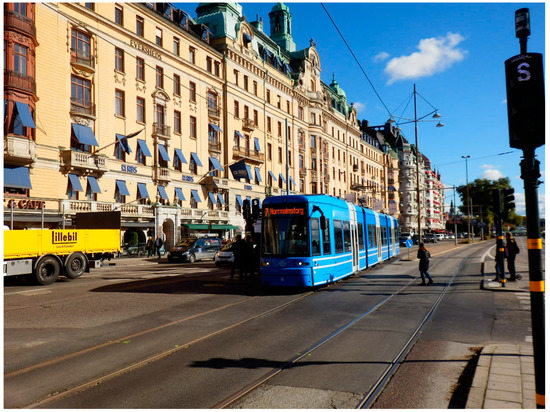
Figure 26.
Stockholm’s old, dense, mixed use inner city based on tunnelbana, surface trams, walking, and cycling. Source: Jeffrey Kenworthy.
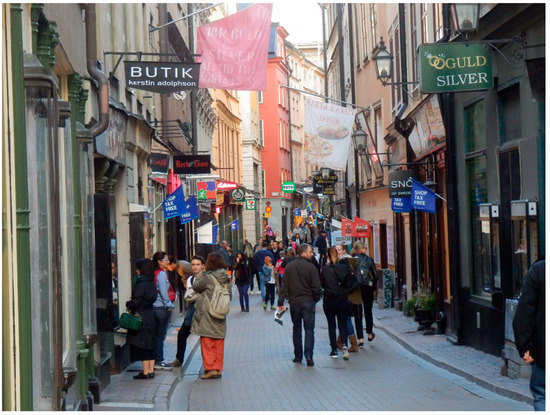
Figure 27.
Stockholm’s old mediaeval city (Gamla Stan) with its strong walking character. Source: Jeffrey Kenworthy.
Figure 28 and Figure 29 show the public transport orientation and walkability of both older satellite towns in Stockholm (Vällingby) and newer neighbourhood developments, such as Hammarby Sjöstad, which is serviced by a new tram line.
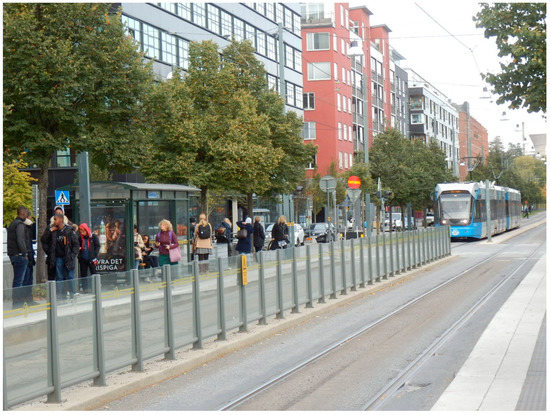
Figure 28.
The new Hammarby Sjöstad walkable neighbourhood in Stockholm built around a tram service. Source: Jeffrey Kenworthy.
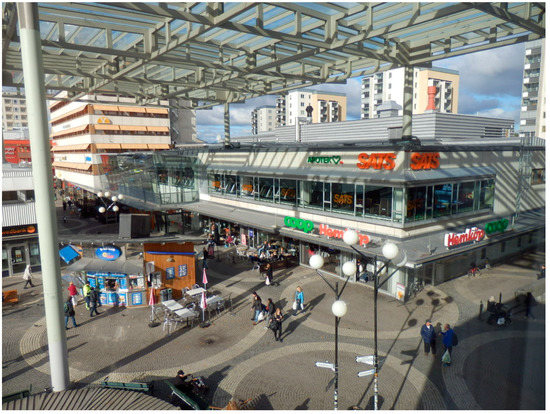
Figure 29.
Vällingby: The original transit-oriented new town in Stockholm built over the tunnelbana. Source: Jeffrey Kenworthy.
In the first case in Figure 28, the new centre is formed linearly into a transit-oriented development (TOD) due to the close spacing of the tram stops. Throughout the neighbourhood there are excellent conditions for walking and cycling, though shopping and other facilities can be some distance away for some residents of the area due to the less than ideal mixing of land uses.
Figure 29 shows a nodal form of TOD due to the much wider spacing of stations along the tunnelbana lines. These sub-centres are separated in some cases by open land with urban development being restricted to well-defined areas. They have a strong profile of increasing density towards the station, both for residential and non-residential development. They are also very well-served by extensive feeder buses, often having large bus interchanges for many different routes located at the stations. Within about 400 metres of these stations, the environments are generally well designed to support pedestrians.
Overall, the urban comparative data on these five Swedish cities suggest that they form an interesting and somewhat unique “cluster” of cities on a global scale, with at times some paradoxical results.
On the one hand, Swedish cities are atypically low in density, and very high in roads and freeways compared to most European cities. However, employment is still rather centralised, with 16.3% of jobs in their CBDs compared to 18.3% in Europe. Swedish cities are the second highest in this factor across the city groupings. This generally works in favour of public transport, at least for work-related travel. Additionally, for trips to the CBD, parking is comparatively limited in Swedish cities with only 246 spaces per 1000 jobs, theoretically meaning that only about one in four people working in the CBD would be able to park a car. It is about the same in other European CBDs (248 spaces per 1000 jobs). This also favours public transport, walking, and cycling access to Swedish city centres.
Other factors working in favour of sustainable transport and eco-urbanism include the fact that Swedish cities have significantly lower car ownership levels than might be expected, lower even than other European cities. Average wealth levels as measured by metropolitan GDP are below typical European levels (though comparable to Australian and Canadian cities in 2006). Despite low densities, Swedish cities have developed relatively well-performing and more extensive public transport systems than many comparable lower density cities.
There seems to be a generalised European cultural factor at work here, such that in Europe, public transport is more accepted and utilised across a wide range of incomes [11]. Swedish cities have generous amounts of public transport lines compared to other cities and the highest amount of reserved public transport route per person in the global sample. Unfortunately, this is offset by the high per capita provision of urban freeways, which leads to a relatively low ratio of reserved public transport to freeways in Swedish cities, thus somewhat offsetting the advantages of their public transport systems. Service provision as measured by seat kilometres is second only to the other European cities, but only by a small margin (5% lower). The average operating speeds for public transport in Sweden seem to be higher than most other cities, which leads also to the best average ratio of public transport system speeds to general road traffic of all groups of cities (0.98, the next closest result being 0.88 in the other European cities).
However, despite some of the above favourable conditions for public transport, Swedish cities on average have much lower per capita public transport boardings than other European cities (roughly half), but at the same time, this is much better than in the more auto-dependent regions in the USA, Australia, and Canada, where densities are also low. This might be expected given the significantly lower density of Swedish cities compared to other European cities, but is somewhat unusual when compared to similarly lower density cities in the USA, Australia, and Canada.
On the positive side, public transport use measured by per capita passenger kilometres is closer to European levels due to the longer distances travelled by public transport in Swedish cities, which again probably relates to low densities. Using total motorised passenger kilometres as a measure, these five Swedish cities on average have a healthy 20.4% of total motorised passenger kilometres on public transport, beaten only by their European neighbours (24.5%) and of course the Asian cities (62.9%). The modal split of daily trips is also just under 50% for public transport, walking, and cycling combined, meaning that the modal share in these five larger Swedish urban regions is pivoted rather equitably between the more sustainable and less sustainable modes. As shown in Figure 21, Figure 22, Figure 23, Figure 24, Figure 25, Figure 26, Figure 27, Figure 28 and Figure 29, Swedish cities have significant areas of urban fabric that are supportive of non-motorised modes and where walking and cycling is high, leading to over 27.1% of daily trips in Swedish cities being completed by these modes, despite a very cold climate. Only the other European cities have more with 34.5%. There are numerous areas in Swedish cities where bicycling is supported with reasonable infrastructure and walking is well catered for too in many areas.
Three key areas of concern for eco-urbanism also perform well in these Swedish cities. Energy use in private passenger transport is commensurate with the other European cities and much lower than in the auto-cities of North America and Australia. The Swedish cities excel in their extremely low transport emissions per capita and per hectare compared to every other region in the world and even the worst Swedish cities are better than the best of the others. Of course, the other data are from 2005–6 so it is expected that the other cities would have been closer to the Swedish cities in 2015, given the large advances in automotive technology and tougher air pollution regulations. Likewise, in transport fatalities per 100,000 persons, Swedish cities are the lowest in the world, and possibly would remain so due to Sweden’s Vision Zero transport deaths policy [45]., even if the other cities were to be updated to 2015.
The third asked research question was: Are there any policy lessons that can be learned from the comparisons? Based on the data here, urban and transport policy for enhanced transport sustainability and better eco-urbanism in Swedish cities could focus on three key areas.
The cities would do well to focus on targeted increases in higher density, mixed use development that is especially linked to expanded and improved public transport. Stockholm is by far the best of the Swedish cities in sustainable transport and although it is still a low-density region, it is bound together by strong and now diverse urban rail networks (light rail, metro, and regional rail), around which very high density, mixed use development has occurred in strong centres throughout the region. Such an approach could be emulated in other Swedish cities.
There is also a need to restrict further development of already abundant freeway and road systems in all Swedish cities and perhaps to consider some focused removal of freeways, especially to help green the cities and improve public spaces. The thought of removing freeways is a radical one and is usually met with claims that the existing traffic will simply flow over everywhere else and cause chaos. However, it has been shown repeatedly that traffic behaves more like a gas than a liquid, adjusting its volume according to the size of the “container” provided (in this case, road capacity) [11,46]. It is thus important in such endeavours to eliminate freeways to provide demonstrative projects of “disappearing traffic” so that other cities can learn from these experiences and feel more confident that such an approach can work. There are numerous examples of freeways that have been successfully removed. The Seattle Urban Mobility Plan in 2008 [47] provides a catalogue of case studies of these projects, such as the Embarcadero and Central Freeways in San Francisco, California and the Harbor Drive Freeway in Portland, Oregon.
However, one of the best examples to date (also included in [47].) is the Cheonggyecheon restoration project in Seoul (Figure 30), which removed 6 km of elevated freeway and surface road carrying collectively 170,000 vehicles per day and created a green river boulevard in their place. The average traffic speed improved in Seoul after the removal of the freeway [11,47]. This project stands as a landmark of both how traffic adjusts to a reduction in high capacity roads and the sheer attractiveness and beauty of the green environments that can replace such traffic corridors.
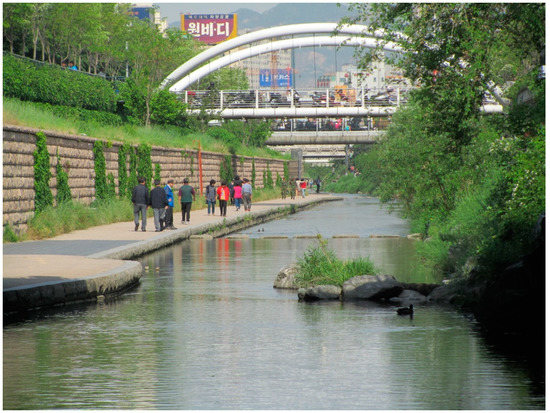
Figure 30.
Seoul’s Cheonggyecheon restoration project after freeway removal, resulting in improved not worsened traffic speed. Source: Jeffrey Kenworthy.
Swedish cities have an over-reliance on bus systems and a need for more extensive urban rail networks, which are critical in developing competitive public transport and achieving a wide range of other environmental, economic, and social goals [48,49]. A major difference between Swedish and European cities generally is that European cities have three times higher rail use and this is a critical distinguishing feature in the lower public transport use in Swedish cities compared to other European cities.
5. Conclusions
Through a wide-ranging investigation of 69 comparative land use, transport, and related indicators, five Swedish cities were investigated in detail for their urban transport based eco-urbanism characteristics. They were shown to form a somewhat unique group of cities in the world with lower densities, but many positive transport features, including only moderate car use.
The strengths of the five investigated Swedish cities lie in the following factors, which imply certain policy responses:
- (1)
- These Swedish cities have low CBD parking per 1000 CBD jobs. Such an advantage can change over time so that there is a need to limit the addition of new parking in the city centres of Swedish cities, which generally means changing parking regulations to require less parking in new non-residential land uses (and residential developments) in recognition of the access advantages of city centres by public transport, walking, and cycling. It is also possible to replace current parking lots and structures with other uses, which in turn could be encouraged with special taxes on CBD parking.
- (2)
- These Swedish cities also have lower levels of car and motorcycle ownership than other cities, but this too can change unless consideration is given to active disincentives to acquiring more cars (and incentives for owning less cars). Incentives can include attractive car-on-demand and car sharing schemes, as well as more bike sharing schemes. All these sharing systems would benefit from electric options (pedelecs in the case of bikes), which are generally more attractive to users. It can also mean considering placing car ownership deterrents, such as Singapore-style Certificates of Entitlement requiring bidding at an auction and paying a substantial sum just for the right to purchase a car [11].
- (3)
- Public transport in these Swedish cities is relatively well-developed and has the multiple advantages of a very high line length and reserved route per person, high seat kilometres per person, and a high average speed, both in absolute terms and in relation to car speeds. It is important to maintain these advantages and one of the key ways is to introduce light rail systems, which are physically segregated from general traffic, such as what Lund (Malmö region) is developing now and Stockholm has been progressively doing over the last decade. Another important aspect is to stop building high capacity roads, which only favour more car traffic.
- (4)
- Walking and cycling in Swedish cities is comparatively high and can be further strengthened by increases in density and mixed land use, especially in sub-centres and through progressive extensions and upgrades to walking and cycling infrastructure. Increasing the use of pedelecs (e-bikes) will extend the range of cyclists, as will better integrating bikes with public transport (bicycle parking at stops and facilitating more bikes on board public transport). Buses are limited in how many bikes they can carry, whereas rail vehicles are less limited, which constitutes another good reason for the provision of more rail in Swedish cities.
- (5)
- Energy use in private passenger transport, the big energy user in the passenger transport sector, is of a typical European medium level in Swedish cities. However, there is scope for further improvement by reducing actual car use and by using less energy intensive automotive technologies. Electric vehicles are one option, but care needs to be taken to consider the embodied energy in electric vehicles, not just the operational use.
- (6)
- Transport deaths are exceptionally low in Swedish cities, at least partly a reflection of Sweden’s Vision Zero national policy. Sweden can further strengthen its already significant global reputation in this field by further improvements in transport safety, and especially by enhancing conditions for vulnerable road users, mainly pedestrians and cyclists of all ages.
- (7)
- Transport emissions per capita are very low in these five Swedish cities, the lowest in the world, and this advantage can be further pressed home by tightening emissions regulations, eliminating diesel use in cities, as is happening in the United Kingdom and Germany at present, and promoting the use of electric vehicles. Care again needs to be taken, however, in not treating electric vehicles as a panacea for the problems of cars in cities.
The two key weaknesses of Swedish cities are their low overall density reflected in the lower levels of public transport use, especially boardings, than other European cities and the relatively low level of rail provision, except in Stockholm and to a lesser degree also in Göteborg. The use of rail in these Swedish cities is very low compared to other European cities and Malmö, Linköping, and Helsingborg are even lower than the larger US cities in this comparison. These problems can be solved simultaneously by densification and intensification through mixed land use in sub-centres (also accompanied by limiting parking) and the linking of new or existing rail services to these centres. The issue of funding for new rail lines is of course important and in this respect, value capture could be productively exploited to achieve more funds for rail investment, as well as providing more incentives for denser development for developers, planning authorities, and transport agencies alike [50].
These five Swedish cities are at very different stages in their evolution, though there are unifying aspects and commonalities, as well as points of departure, as revealed in this international comparison. The value of this international comparison of cities on an aggregate level, as well as comparisons within Sweden itself, was demonstrated and the ability of such research to highlight the strengths and weaknesses of specific cities and the needed policy priorities to improve cities was explained.
Funding
The research reported in this paper was funded by a small grant from K2: Sweden’s National Centre for Research and Education on Public Transport.
Acknowledgments
The author is very grateful to K2 for providing the funding to support this research and the countless individuals in each of the cities who provided the requested data. I am especially grateful to Ms Monika Brunetti, my research assistant and Dr. Helena Svensson in K2 for her support in locating some key data.
Conflicts of Interest
The author declares no conflict of interest.
References
- Beatley, T. Green Urbanism: Learning from European Cities; Island Press: Washington, DC, USA, 2000; 491p. [Google Scholar]
- Beatley, T. Native to Nowhere: Sustaining Home and Community in a Global Age; Island Press: Washington, DC, USA, 2005; 408p. [Google Scholar]
- Register, R. EcoCities: Rebuilding Cities in Balance with Nature; New Society Publishers: Gabriola Island, BC, USA, 2006. [Google Scholar]
- Kenworthy, J. The Eco-City: Ten Key Transport and Planning Dimensions for Sustainable City Development. Environ. Urban. 2006, 18, 67–85. [Google Scholar] [CrossRef]
- Newman, P.W.G.; Kenworthy, J.R. Sustainability and Cities: Overcoming Automobile Dependence; Island Press: Washington, DC, USA, 1999; 442p. [Google Scholar]
- Newman, P.; Beatley, T.; Boyer, H. Resilient Cities: Overcoming Fossil Fuel Dependence; Island Press: Washington, DC, USA, 2017. [Google Scholar]
- Giradet, H. Creating Regenerative Cities; Routledge: London, UK, 2014. [Google Scholar]
- Beatley, T. Biophilic Cities: Integrating Nature into Urban Design and Nature; Island Press: Washington, DC, USA, 2010; 208p. [Google Scholar]
- Kim, K.G. Low-Carbon Smart Cities: Tools for Climate Resilience Planning; Springer: Cham, Switzerland, 2018. [Google Scholar]
- Stimmel, C.L. Building Smart Cities: Analytics, ICT, and Design Thinking; Auerbach Publications: Boca Raton, FL, USA, 2015. [Google Scholar]
- Schiller, P.; Kenworthy, J.R. An Introduction to Sustainable Transportation: Policy, Planning and Implementation, 2nd ed.; Earthscan: London, UK, 2018; 420p. [Google Scholar]
- Newman, P.; Kosonen, L.; Kenworthy, J. Theory of urban fabrics: Planning the walking, transit/public transport and automobile/motor car cities for reduced car dependency. Town Plan. Rev. 2016, 87, 429–458. [Google Scholar] [CrossRef]
- Schneider, K. On the Nature of Cities: Towards Creative and Enduring Human Environments; Jossey-Bass: San Francisco, CA, USA, 1979. [Google Scholar]
- Safdie, M.; Kohn, W. The City After the Automobile: An Architect’s Vision; Westview Press: Boulder, CO, USA, 1998. [Google Scholar]
- Newman, P.; Kenworthy, J. The End of Automobile Dependence: How Cities Are Moving Away from Car-Based Planning; Island Press: Washington, DC, USA, 2015; 273p. [Google Scholar]
- Whitelegg, J. Mobility: A New Urban Design and Transport Planning Philosophy for a Sustainable Future; CreateSpace Independent Publishing Platform (1807): Seattle, WA, USA, 2016. [Google Scholar]
- Kenworthy, J. Ten Key Dimensions for Eco City Development in Theory and Practice. ISOCARP Rev. 2016, 12, 16–47. [Google Scholar]
- Newman, P.W.G.; Kenworthy, J.R. Cities and Automobile Dependence: An International Sourcebook; Gower: Aldershot, UK, 1989; 388p. [Google Scholar]
- Newman, P.W.G.; Kenworthy, J.R. Gasoline consumption and cities: A comparison of US cities with a global survey and its implications. J. Am. Plan. Assoc. 1989, 55, 24–37. [Google Scholar] [CrossRef]
- Newman, P.W.G.; Kenworthy, J.R. Transport and urban form in thirty-two of the world’s principal cities. Transp. Rev. 1991, 11, 249–272. [Google Scholar] [CrossRef]
- Kenworthy, J.R.; Laube, F.B. An International Sourcebook of Automobile Dependence in Cities, 1960–1990; University Press of Colorado: Niwot, CO, USA; Boulder, CO, USA, 1999; 704p. [Google Scholar]
- Kenworthy, J.; Laube, F. The Millennium Cities Database for Sustainable Transport. (CDROM Database); International Union (Association) of Public Transport (UITP): Brussels, Belgium; Institute for Sustainability and Technology Policy (ISTP): Perth, Australia, 2001. [Google Scholar]
- Newman, P.W.G.; Kenworthy, J.R.; Scheurer, J. “Car-Free” Copenhagen: Perspectives and Ideas for Reducing Car Dependence in Copenhagen; Department of Urban Design, Royal Danish Academy of Fine Arts: Copenhagen, Denmark; ISTP, Murdoch University: Perth, Australia, 1997. [Google Scholar]
- Gehl, J. Life Between Buildings: Using Public Space; Island Press: Washington, DC, USA, 1997. [Google Scholar]
- Gehl, J. Cities for People; Island Press: Washington, DC, USA, 2010. [Google Scholar]
- Cervero, R. Sustainable new towns: Stockholm’s rail served satellites. Cities 1995, 12, 41–51. [Google Scholar] [CrossRef]
- Cervero, R. The Transit Metropolis: A Global Inquiry; Island Press: Washington, DC, USA, 1998. [Google Scholar]
- Löfgren, E. Malmö pedals to sixth spot in bicycling world. The Local, 3 June 2015. Available online: https://www.thelocal.se/20150603/malm-pedals-to-sixth-spot-in-bicycling-world(accessed on 22 February 2019).
- Kenworthy, J.R. The good, the bad and the ugly in urban transport: Comparing global cities for dependence on the automobile. In Methods for Sustainability Research; Hartz-Karp, J., Marinova, D., Eds.; Edward Elgar Publishing: Cheltenham, UK, 2017; Chapter 3; pp. 46–62. [Google Scholar]
- Available online: http://www.statistikdatabasen.scb.se/pxweb/en/ssd/START__MI__MI0803__MI0803A/MarkanvBebyggdLnKn/?rxid=7e3e3bb9-3e6f-428f-ae42-adb3a8555030 (accessed on 19 February 2019).
- Kenworthy, J.R. Reducing Passenger Transport Energy Use in Cities: A Comparative Perspective on Private and Public Transport Energy Use in American, Canadian, Australian, European And Asian Cities. In Urban Energy Transition: Renewable Strategies for Cities and Regions, 2nd ed.; Droege, P., Ed.; Elsevier: Amsterdam, The Netherlands, 2018; Chapter 2.1.; pp. 169–204. [Google Scholar]
- Kenworthy, J. Deteriorating or Improving? Transport Sustainability Trends in Global Metropolitan Areas. In Transport Beyond Oil: Policy Choices for a Multi-Modal Future; Renne, J., Fields, W.M., Eds.; Island Press: Washington, DC, USA, 2013; Chapter 14; pp. 244–264. [Google Scholar]
- Newman, P.; Kenworthy, J. ‘Relative speed’ not ‘time savings’: A new indicator for sustainable transport. In Proceedings of the 23rd Australasian Transport Research Forum, Perth, Australia, 29 September–1 October 1999; pp. 425–440. [Google Scholar]
- Newman, P.W.G.; Kenworthy, J.R. Is there a role for physical planning? Counterpoint. J. Am. Plan. Assoc. 1992, 48, 353–362. [Google Scholar] [CrossRef]
- Lewis, S.; Grande del Valle, E. San Francisco’s neighborhoods and auto dependency. Cities 2019, 86, 11–24. [Google Scholar] [CrossRef]
- Newman, P.; Kenworthy, J. Urban design to reduce automobile dependence. Opolis 2016, 2, 35–52. [Google Scholar]
- Thomson, J.M. Great Cities and Their Traffic; Penguin Books: Middlesex, UK, 1977. [Google Scholar]
- Watt, K.E.F.; Ayres, C. Urban land use patterns and transportation energy cost. Presented at the 140th Annual Meeting of the American Association for the Advancement of Science (AAAS), San Francisco, CA, USA, 25 February 1974. [Google Scholar]
- Shoup, D. The High Cost of Free Parking; Routledge: New York, NY, USA, 2011. [Google Scholar]
- Shoup, D. Parking and the City; Routledge: New York, NY, USA, 2018. [Google Scholar]
- Airviro. Available online: http://www.airviro.smhi.se/cgi-bin/RUS/apub.html_rusreport.cgi (accessed on 20 February 2019).
- Neff, J.W. Estimating values of the transit-land use multiplier effect from published Federal Highway Administration and Federal Transit Administration data. In Proceedings of the 54th Annual Transport Research Forum, Doubletree Hotel, Annapolis, Maryland, 21–23 March 2013; pp. 196–212. Available online: http://ageconsearch.umn.edu/bitstream/206949/2/6%20ESTIMATING%20VALUES%20OF%20THE%20TRANSIT%20LAND-USE%20MULTIPLIER%20EFFECT%20FROM%20PUBLISHED.pdf (accessed on 22 February 2019).
- Hermosilla, T.; Palomar-Vázquez, J.; Balaguer-Beser, A.; Balsa-Barreiro, J.; Ruiz, L.A. Using street metrics to characterize urban typologies. Comput. Environ. Urban Syst. 2014, 44, 68–79. [Google Scholar] [CrossRef]
- Marshall, R. Waterfronts in Post-Industrial Cities; Spon Press, Taylor and Francis: London, UK, 2004. [Google Scholar]
- Government Offices of Sweden. Renewed Commitment to Vision Zero: Intensified efforts for transport safety in Sweden. 2016. Available online: https://www.government.se/4a800b/contentassets/b38a99b2571e4116b81d6a5eb2aea71e/trafiksakerhet_160927_webny.pdf (accessed on 10 February 2019).
- Kenworthy, J. Don’t shoot me I’m only the transport planner (apologies to Sir Elton John). W. Transp. Policy Pract. 2012, 18, 6–26. [Google Scholar]
- Seattle Urban Mobility Plan. Case Studies in Urban Freeway Removal. Chapter 6. 2008. Available online: https://www.cnu.org/sites/default/files/Nashville%20Case%20Study%202%20-%20Seattle.pdf (accessed on 21 February 2019).
- Kenworthy, J. An international review of the significance of rail in developing more sustainable urban transport systems in higher income cities. W. Transp. Policy Pract. 2008, 14, 21–37. [Google Scholar]
- Litman, T.A. Rail Transit in America: A Comprehensive Evaluation of Benefits; Victoria Transport Policy Institute: Victoria, BC, Canada, 2004. [Google Scholar]
- McIntosh, J.; Newman, P.; Trubka, R.; Kenworthy, J. Framework for Land Value Capture from the Investment in Transit in Car Dependent Cities. J. Transp. Land Use 2015, 10, 1–31. [Google Scholar] [CrossRef]
© 2019 by the author. Licensee MDPI, Basel, Switzerland. This article is an open access article distributed under the terms and conditions of the Creative Commons Attribution (CC BY) license (http://creativecommons.org/licenses/by/4.0/).