Abstract
Active transportation (AT) has aroused great interest in recent years as it may benefit public health and reduce the dependency on cars. This article aims to summarize recent findings on the relationship between the objectively measured built environment and AT among adults, to examine if different study designs may generate different results, and to provide directions for future research. A systematic literature review of journal articles from different databases was conducted. Fifty-one articles published between 2005 and 2017 were identified, and twelve built environment factors were extracted. The results showed that residential density, land use mix, street connectivity, retail land use, walkability, sidewalk, and access to destinations had a convincing positive relationship with walking for transport. Regarding cycling for transport, while street connectivity and bike lane showed a convincing positive relationship, neighborhood aesthetics and access to destinations showed a convincing negative relationship. Studies that use different analyzed geographic units and different measurements of AT may generate different results, so choosing suitable geographic units and measurement of AT is necessary to reduce the mismatch in the relationships. In addition, we need more longitudinal studies, more studies on cycling for transport, and more studies in countries outside North America and Australasia.
1. Introduction
According to a World Health Organization fact file, lack of physical activity is one of leading risk factors for global mortality; it may also lead to non-communicable diseases such as diabetes, cardiovascular diseases, and cancer, seriously threatening public health [1]. To reduce the health risks of physical inactivity, active transportation (AT) has aroused great interest in recent years [2,3]. AT is any non-motorized travel based on human power, mostly referring to walking and cycling for transport, but also skiing, skateboarding, and using a wheelchair [4]. AT is also called non-motorized transportation, human powered transport, transport-related physical activity, and walking and cycling for utilitarian purposes [5]. Studies have confirmed several health benefits of AT [6,7]. AT has a beneficial impact on weight and cholesterol [8]. Compared with using private cars, walking to work is related to lower probability of obesity, hypertension, diabetes, and mental disorders [9]. Moreover, shifting from car use to AT may reduce air pollution, noise, and congestion [2]. Therefore, AT can be a promising way to facilitate public health [10].
Promoting AT depends on whether the built environment is supportive [1,11]. Previous studies showed that some built environment factors play roles in affecting AT. For example, AT might be related to access to destinations and walking and cycling infrastructure [12]. People are likely to walk or bike when the environment provides the destinations that are easy to access. To examine the relationship between the built environment and AT, an increasing number of studies have started using objective measurements of the built environment, especially using the Geographical Information System (GIS). Using objective measurements can explain the built environment in a more standardized way [13,14], and the research results may better help planners and policy makers to promote AT through the built environment [14]. However, existing empirical studies vary in research designs, such as the differences in study location, targeted population, audit tool, analyzed geographic unit, and study quality. The impact of study designs on the relationship between built environment and AT remains unclear.
For guiding relevant practitioners and future studies, many reviews synthesized existing knowledge about the relationship between built environment and AT. They have found that residential density [15,16,17,18], street connectivity [14,15,16,18], land use mix [14,16,17,18,19], walkability [15,16,19,20] and access to destinations [14,17,19,20] were positively related to AT. However, some of them have provided results that derived from different contexts (e.g., neighborhood, workplace) and different measurements (e.g., objectively measured, perceived) of built environment and AT, and some did not study walking and cycling for transport separately. Few literature reviews analyzed the relationship between built environment and AT in a context-specific and domain-specific manner [15,21]. Moreover, not enough literature reviews have explored the impact of study designs on the relationship between built environment and AT. A review that focuses on the objectively measured neighborhood built environment and AT is helpful to explore the role of the built environment in promoting AT. Therefore, this article aims to answer the following questions: (1) what are the recent findings on the relationship between the objectively measured neighborhood built environment and AT? (2) Do different study designs generate different results? (3) What directions can we provide for future research?
2. Materials and Methods
A systematic literature review method was adopted to synthesize the existing empirical studies. This review follows the guidance of the PRISMA (Preferred Reporting Items for Systematic reviews and Meta-Analyses) statement, which provides a detailed 27-item checklist that ensures a transparent meta-analysis report and systematic literature review [22]. This method was designed originally for clinical fields, but it can be used in other scientific fields [22]. To reduce bias and standardize the reporting of systematic literature reviews, the PRISMA statement is promoted to examine the relationship between the built environment and physical activity [23].
2.1. Search Strategy and Inclusion/Exclusion Criteria
The literature search was conducted across four electronic databases: Web of Knowledge, Scopus, PubMed, and Active Living Research. The publishing time of relevant articles was from January 1990 to March 2017. Articles were required to have been written in English and published in peer-reviewed journals. To ensure the quality of the selected studies, grey literature were not included in the search. Keywords that related to both AT and the built environment were used in title searches of the four databases. Terms, relevant synonyms, and spelling variations used to search for AT included: active transportation, physical activity, walk, cycle, bicycle, bike, commute, travel, and activity; those used to search for the built environment included: built environment, community, neighborhood, urban, metropolitan, street, and environment. In different databases, the search terms were adjusted according to the rules of the relevant databases. According to the PRISMA statement, there are four steps in the selection of publications: identification, screening, eligibility, and inclusion (see Figure 1). Two reviewers searched and selected independently and then discussed together to reach a consensus when finding disagreements or uncertainties.
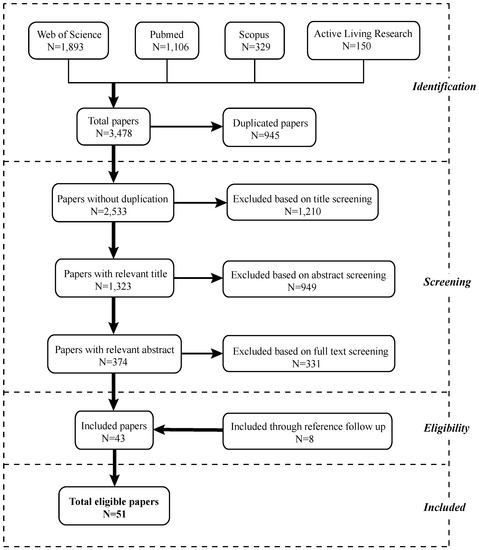
Figure 1.
Flow of literature search process (based on the PRISMA flow diagram).
In the selection of publications, there were four inclusion criteria:
- Objective measurement of the urban neighborhood environment.
- Transport-related physical activity measured with self-reported methods. Self-reported methods are most frequently used in obtaining physical activity data [16]. Therefore, we only focused on studies using self-reported physical activity data and excluded studies using objectively measured physical activity data.
- Mean age of study respondents of between 18 and 65 years old. Studies that solely focused on older adults (>65 years old) were excluded because older adults might have declined mobility [24], which might lead to a different relationship between built environment and AT.
- Quantitative studies with cross-sectional or longitudinal data.
During the full-text screening, 331 articles were excluded for the following reasons: (1) they assessed the urban neighborhood built environment only by perception; (2) the research area contained rural areas; (3) the measurements of physical activity were only related to recreational, moderate to vigorous, or general physical activity; (4) no analysis was made of the relationship between the built environment and AT; (5) articles were based on the same project with similar analysis and results (only one study of each of these was chosen).
After the full-text screening, 43 articles were included. Eight articles were identified from the reference of the included articles and other review studies. Finally, 51 [25,26,27,28,29,30,31,32,33,34,35,36,37,38,39,40,41,42,43,44,45,46,47,48,49,50,51,52,53,54,55,56,57,58,59,60,61,62,63,64,65,66,67,68,69,70,71,72,73,74,75] articles were included for the data extraction and analysis.
2.2. Data Extraction
In the analysis of the relationship between neighborhood built environment factors and AT, AT include walking for transport, cycling for transport and general AT. General AT means that the researchers did not separate walking and cycling when investigating respondents’ AT.
The selection of the neighborhood built environment factors was based on the factors that were objectively measured in the retained 51 publications. Only built environment factors with clear descriptive results in more than one publication were selected. All the included studies used statistics to show their results. Most studies used p-values, with p < 0.05 indicating that the measured built environment factor is significantly related to physical activity. Some studies also chose 95% confidence intervals to determine significance. Finally, a total of twelve factors were selected. These twelve built environment factors include some relevant items that were used in different studies as described in Table 1.

Table 1.
Summary of selected built environment factors.
2.3. Coding of Evidence
To categorize the relationship between AT and built environment factors, a method of evidence coding was used after adaptation from a previous literature review of Van Holle et al. [20]. The degree of the relationship was coded as three levels: unable to get a summary result, possible, and convincing (see Table 2). We only give a summary result to the built environment factor, for which more than four studies reached a conclusion.
Table 2.
Criteria for coding summary results.
2.4. Quality Assessment Criteria
The quality of these selected studies was assessed with a tool named the Effective Public Health Practice Project Quality Assessment Tool (EPHPP) [76,77] and its adapted version used by Grasser et al. [15]. The EPHPP tool has been confirmed to have an excellent agreement for its final grading [78]. It is a suitable tool for assessing the quality of quantitative research with various study designs. Because the majority of the selected studies used cross-sectional data, this assessment tool was adapted to assess four components regarding the studies’ methodological quality: response rate, representativeness, outcome measures, and confounding factors (further description presented in Table 3). Under assessment of confounding factors, self-selection adjustment was added as a criterion, as it might affect the accuracy of the result regarding the relationship between the built environment and physical activity [14,25]. Generally, self-selection means that people who like to be physically active tend to choose to live in a neighborhood that can better support physical activity [25]. In the included studies, self-selection factors contain the respondents’ attitudes towards AT, preference for a more/less walkable neighborhood to live in, and other factors related to psychosocial aspects.
Table 3.
Criteria used in the quality assessment.
3. Results
3.1. Study Characteristics
We extracted several characteristics of included studies (see Table 4). Regarding the year of publication, although the timeframe for the search is from 1990 to 2017, it appears that the earliest year an eligible article was published is 2005 [72]. Fifteen (29.4%) studies were published between 2005 and 2009, and 36 (70.6%) studies were published after 2010, particularly in 2014 and 2016, each year with ten articles. This indicates rapidly increasing interest in this research area in recent years. Regarding the study location, 23 (45.1%) studies were taken in North America, of which 16 were in the United States, and seven were in Canada. Nine (17.6%) studies were conducted in Australia and one in New Zealand. Nine (17.6%) studies were carried out in European countries. Six studies were conducted in Asia and two studies in South America. Two studies were cross-national studies, with one study [62] containing five European countries and the other one [69] containing ten countries from four continents. All the studies examined both male and female subjects. The least number of sample size was 72 [29]. Thirty-one (60.8%) studies have a sample size between 500 and 3000. Twelve (23.5%) studies have a sample size over 5000 respondents.
Table 4.
Summary of study characteristics.
The majority of studies (92.2%) only used cross-sectional data, and four studies [26,27,28,60] used longitudinal data. Twenty-eight (54.9%) studies exclusively focused on walking for transport, and ten (19.6%) studies exclusively focused on cycling for transport. Seven studies examined walking and cycling for transport separately, and six studies examined general AT. The measurements of walking and/or cycling for transport included participation (e.g., respondents reported whether or not they used AT in the last week), frequency (e.g., respondents reported how many times they used AT in the last week), and duration (e.g., respondents reported how much time they spent on AT in the last week).
Regarding the objective measurements of the built environment, GIS technique was widely used (70.6%). Although all these 51 studies have focused on the neighborhood built environment, they used different analyzed geographic units. Twenty-nine (56.9%) studies measured the area within certain distances around each respondent’s home address (e.g., 500 m street network distance around each respondent’s home). Twelve (23.5%) studies used the stable geographical areas (e.g., neighborhoods defined by local administrations, census tracts, or statistical sectors). Eight (15.7%) studies measured the area within certain distances around the neighborhood. For the studies that provided a specific radius for buffer size, the distance ranged from 200 m to 3500 m.
3.2. Results of Quality Assessment
The results of the quality assessment of each study are presented in Table 5. Overall, 22 (43.1%) studies were of strong quality, 21 (41.2%) were of moderate quality, and eight (15.7%) were of weak quality. The majority of studies (68.6%) had an overall response rate above 20%, 12 (23.5%) studies had below 5% or not provided. Only 13 (25.5%) studies claimed to have used a representative sample. Twenty-five (49.0%) studies claimed to have used a valid questionnaire in acquiring AT data. The International Physical Activity Questionnaire (IPAQ) was used widely (33.3%) and has been proved to have acceptable validity and reliability [79]. Twelve studies (23.5%) did not mention the validity and reliability of their self-reported surveys. All the 51 studies have controlled for socioeconomic factors in their statistical analysis. Eighteen (35.3%) studies also controlled for self-selection factors.
Table 5.
Summary of quality assessment results.
In general, studies that focused on walking and general AT were of higher quality than studies that focused on cycling. For the studies that only examined walking for transport, 13 out of 28 studies were of strong quality. For the studies that only studied cycling for transport, only one [59] out of ten studies was of strong quality. Regarding the studies that examined general AT, five out of six were of strong quality.
3.3. Relationship between Neighborhood Built Environment and AT
Among the twelve built environment factors, street connectivity (n = 18) was most frequently reached a conclusion in the included studies, followed by residential density (n = 16), access to destinations (n = 16), and walkability (n = 15). Studies with different levels of quality were all categorized to generate a final summary result, and studies of weak quality were marked with “*” in the following tables.
3.3.1. Walking for Transport
Thirty-five studies examined the relationship between the built environment and walking for transport (Table 6). We found convincing positive relationships between walking for transport and residential density, land use mix, street connectivity, retail land use, walkability, sidewalk, and access to destinations. In addition, we found neighborhood aesthetics was not related.
Table 6.
Summary of relationships between built environment and walking for transport.
3.3.2. Cycling for Transport
Seventeen studies provided results of relationships between cycling for transport and built environment factors (Table 7). Street connectivity and bike lane were most frequently examined, and both were found to have a convincing positive relationship with cycling for transport. Neighborhood aesthetics and access to destinations showed convincing negative relationships.
Table 7.
Summary of relationships between built environment and cycling for transport.
3.3.3. General AT
Only six studies [70,71,72,73,74,75] investigated the relationship between built environment factors and general AT (Table 8). No possible or convincing evidence was concluded because of limited evidence appeared.
Table 8.
Summary of relationships between built environment and general active transportation.
3.3.4. Inconsistent Results from Studies with Different Designs
To examine the impact of study designs on the relationship between built environment factors and AT, a summary of inconsistent results from studies with different designs was showed in Table 9. Two studies [30,64] found inconsistent results when using different analyzed geographic units. Five studies [25,30,42,58,62] found inconsistent results when using different measurements of AT. One study [48] found inconsistent relationships between land use mix and walking to different destinations.
Table 9.
Summary of inconsistent results from studies with different designs.
4. Discussion
4.1. Summary of Evidence
According to the review of 51 studies, we found that most studies examined factors related to walkability and accessibility, and only a few studies examined traffic volume and hilliness. Many factors showed convincing positive relationship with walking for transport, including residential density, land use mix, street connectivity, retail land use, walkability, sidewalk, and access to destinations. Neighborhood aesthetics showed no relationship. Regarding cycling for transport, while street connectivity and bike lane showed a convincing positive relationship, neighborhood aesthetics and access to destinations showed a convincing negative relationship. We were not able to reach a conclusion regarding the general AT because of the limited number of studies.
4.1.1. Comparison of Results between Walking and Cycling for Transport
Regarding the overall results, while street connectivity showed a convincing positive relationship with both walking and cycling for transport, access to destinations and neighborhood aesthetics showed inconsistent results. Particularly, access to destinations showed opposite results between walking and cycling for transport. Two studies [56,61] found that access to public transit services was negatively related to cycling for transport. It is possible that people who have easy access to public transport would choose to use it rather than cycling. Furthermore, neighborhood aesthetics showed no relationship with walking for transport but did show a convincing negative relationship with cycling for transport. It is possible that green space or parks might lead to a long travel distance [67] and unsafe perception of cyclists [55].
Regarding the seven studies [63,64,65,66,67,68,69] that examined both walking and cycling for transport, two studies [65,69] found inconsistent results. Christiansen and colleagues [69] conducted an international comparative study, and they found that intersection density was linearly positively related to cycling for transport, but not linearly related to walking for transport. They suggested that there might be optimum values of built environment factors to better facilitate AT. Van Dyck et al. [65] found that walkability was positively related to walking for transport, but not related to cycling for transport. Overall, we should consider the differences between walking and cycling, and particularly the differences in their relationships with built environment.
4.1.2. Comparison with Existing Literature Reviews
Generally, our study confirmed some results of existing literature reviews [14,15,16,17,18,19,20]: residential density, street connectivity, and land use mix, walkability and access to destinations are positively related to walking for transportation. Our review also found that only a small proportion of studies focused on cycling and general AT, which is in line with existing reviews [15,80]. The more focus on walking is possibly because walking is more popular than cycling as a daily physical activity, especially in North American countries. Even so, we found that more and more studies on cycling were conducted in North America. While only five [53,55,58,60,67] out of 28 studies that took place in North America examined cycling, four [55,58,60,67] out of the five were published since 2014. Moreover, we found that bike lanes were positively related to cycling for transport, which was in accordance with the review of Fraser and Lock [81]. However, the findings of a negative relationship with neighborhood aesthetics and access to destinations (especially public transport) were not in agreement with the reviews of Fraser and Lock and Van Holle et al. [20,81]. Fraser and Lock [81] found that proximity to green space was positively related to cycling for transport. Van Holle et al. [20] found that aesthetics and access to public transport were not related. The inconsistency of the results is probably because only a few studies focused on cycling for transport, which might lead to the unrepresentative and inaccurate results.
4.2. Differences in the Results of Studies with Different Designs
4.2.1. Study Location
While 21 countries were included in the 51 studies, we found it hard to identify the differences in results between different countries because only a small number of studies were conducted outside North America and Australasia. Four studies [35,40,65,66] in Europe found that walkability was positively related to walking for transport, and the results were in agreement with the findings of North America and Australasia studies and a review that focused on European adults [20]. Moreover, although most included studies were conducted in high-income countries, studies from the USA, Australia, and Belgium all confirmed that residents in the neighborhood with a higher level of socioeconomically disadvantage walked more for transport [29,46,66]. It is understandable that residents in the socioeconomically disadvantaged neighborhood might have less access to private cars, thus contributing to a higher level of AT [29,46]. While most studies in the USA found that residential density was positively related to walking for transport, one study found a negative relationship in socioeconomically disadvantaged neighborhoods in Detroit [47]. It is possible that residents in the socioeconomically disadvantaged neighborhood have a higher perception of crime that indicates a modifying influence on the relationship between walking for transport and built environment [47]. However, the geographical and cultural backgrounds in different continents are different, which might affect the relationship between built environment and AT. For instance, European cities tend to have a more compact urban structure, while the majority of cities in the United States have a scattered urban pattern due to the urban sprawl development [20]. Previous studies have found that the use of bicycles in some European countries was ten times greater than the use in America [53,82]. To further identify the differences of built environment relationships with AT in different countries, more empirical studies from different contexts are necessary.
4.2.2. Study Quality
Regarding studies of different quality, studies that were assessed as having weak quality did not show obviously different results with studies of moderate or strong quality. Self-selection, another major concern proposed in previous studies [14,21,25,31], also did not show a strong influence on the relationship between the built environment and AT. Only one study found that, after controlling for the self-selection factor, walkability was not related to the weekly minutes of walking for transport, but it was still positively related to the frequency of walking for transport [42]. Other studies have confirmed that built environment was related to AT even after controlling for self-selection. This finding is consistent with one previous review study [16]. It is promising that several built environment factors may facilitate AT after considering self-selection factors [16]. However, only 18 out of 51 studies examined self-selection factors in this review; future studies need further examine the role of self-selection in affecting the relationship between built environment and AT.
4.2.3. Analyzed Geographic Unit and Different Measurements of AT
Some inconsistent evidence appeared when studies adopted different analyzed geographic units [30,64]. These inconsistencies showed that it remains unclear which geographic unit could measure the relationship between the built environment and walking for transport most accurately. As a result, future studies should be aware that using different analyzed geographic units might lead to different results, and researchers should consider proper geographic units for different built environment factors to explain the relationships accurately.
Two studies in Australia found that walkability had inconsistent relationships with different measurements of walking for transport [25,42]. It is possible that a more walkable neighborhood may encourage more walking episodes and reduce the duration of each episode [42]. Ma and Dill [58] found that access to retail was positively related to the frequency of cycling for transport, but negatively related to the participation in cycling for transport. It is possible that for the people who were not used to cycling, they might choose walking rather than cycling when they live close to destinations, but frequent cyclists might still cycle more if they have higher access to destinations [58]. However, these inconsistencies show that we need to distinguish the different measurements of AT to avoid the mismatch in the relationship between built environment and AT.
4.3. Limitation and Implications for Future Research
4.3.1. Limitation of the Included Studies
The main limitation of the included studies might be that 47 out of the 51 studies only used cross-sectional data, which cannot contribute to the demonstration of a causal relationship between the built environment and physical activity. Regarding the quality of the included studies, we marked “0” in the corresponding categories of quality assessment when some studies did not show the representative of study sample and reliability and validity of AT data. It is possible that some of these studies did use representative samples or reliable and valid AT data but ignored to show the details in their texts. Moreover, there might be a mismatch between neighborhood built environment and AT. For example, several studies measured the neighborhood built environment, but the AT data were referring to the amount of AT that happened both in and outside the neighborhood. It would be more accurate to analyze the relationship between neighborhood built environment and within-neighborhood AT. In addition, only a few studies investigated general AT and cycling for transport, which might lead to limited evidence or biased results in concluding the results regarding general AT and cycling for transport.
4.3.2. Limitation of the Systematic Review
There are several limitations related to the review method. First, to ensure the quality of selected studies, this review only includes articles that were published in peer-reviewed journals. It is possible that some valuable evidence in grey literature was missed. Second, 33 out of the 51 studies were conducted in North American and Australasian countries, and only a few studies took place in Europe, Asia, and South America. This is possibly because this review only searched publications written in English. Given the differences in travel behavior in different geographical contexts, the conclusions of this review may not generalize to different geographic regions [20]. Third, some biases might exist in data extraction process. For instance, some studies conducted several analysis models, but we only selected and summarized the results of the more comprehensive model and linear relationship. Therefore, the results in the summary tables might be slightly different from the conclusion of the original studies.
4.3.3. Implication for Future Research
First, future studies should pay more attention to cycling behavior and cycling environment. Cycling can be a promising way to replace private car use for short trips, and it can be more effective than walking in enhancing health because it is more intensive [10,83].
Second, future studies should figure out that at which geographic unit should different built environment factor be measured to increase the accuracy of the result. For future studies that examine the cycling environment, a larger buffer size is needed as cycling is faster and the travel distance is longer than walking [69]. For instance, a previous study has suggested that a suitable buffer size should be 3 km (a 20-min cycling range) for examining cycling behavior [84].
Third, future studies should further explore the role of self-selection factors and distinguish the differences in the relationship between built environment factors and different measurements of AT.
Fourth, we need more studies in continents other than North America and Australasia and more longitudinal studies to better understand the relationship between the built environment and AT in different contexts.
5. Conclusions
Overall, this review found that several built environment factors were related to walking for transport, even in studies that have controlled for self-selection factors. Factors related to walkability (walkability index, street connectivity, residential density and land use mix), retail land use, sidewalk, and access to destinations were more often found to have a convincing positive relationship with walking for transport. Neighborhood aesthetics showed no relationship. Regarding cycling for transport, street connectivity and bike lane showed a convincing positive relationship. Neighborhood aesthetics and access to destinations showed a convincing negative relationship. The differences in the relationship of built environment with walking for transport and with cycling for transport indicate the need for separating the research on different forms of AT. Moreover, this review found that studies using different analyzed geographic units could generate different results, indicating the need for using more suitable geographic units to explain the relationships accurately. This review also found that built environment factors had inconsistent relationships with different measurements of AT, and future studies should distinguish the different measurements of AT to avoid the mismatch in the relationships between built environment and AT. To increase people’s daily physical activity level and reduce the dependency on cars, it is essential to create a walking and cycling friendly environment. This review may contribute to the understanding of how to promote AT through the built environment and have implications for urban planners and policy makers.
Acknowledgments
This research was supported by the China Scholarship Council (No. 201406010334, No. 201406010335). The authors thank Frank Othengrafen and the anonymous referees for their instructive comments and suggestions on an earlier version of the manuscript.
Author Contributions
Luqi Wang conceived and designed the study; Luqi Wang and Chen Wen performed the data search; Luqi Wang analyzed the data and drafted the manuscript; Chen Wen revised the manuscript; all authors read and approved the final manuscript.
Conflicts of Interest
The authors declare no conflict of interest.
References
- World Health Organization. Physical Activity. Fact Sheet Updated February 2017. Available online: http://www.who.int/mediacentre/factsheets/fs385/en/ (accessed on 17 June 2017).
- Rabl, A.; de Nazelle, A. Benefits of shift from car to active transport. Transp. Policy 2012, 19, 121–131. [Google Scholar] [CrossRef]
- Berglund, E.; Lytsy, P.; Westerling, R. Active traveling and its associations with self-rated health, BMI and physical activity: A comparative study in the adult Swedish population. Int. J. Environ. Res. Public Health 2016, 13, 455. [Google Scholar] [CrossRef] [PubMed]
- Litman, T. Active Transportation Policy Issues. Available online: http://www.vtpi.org/act_tran.pdf (accessed on 12 December 2016).
- Sallis, J.F.; Frank, L.D.; Saelens, B.E.; Kraft, M.K. Active transportation and physical activity: Opportunities for collaboration on transportation and public health research. Transp. Res. Part A Policy Pract. 2004, 38, 249–268. [Google Scholar] [CrossRef]
- Mueller, N.; Rojas-Rueda, D.; Cole-Hunter, T.; de Nazelle, A.; Dons, E.; Gerike, R.; Götschi, T.; Int Panis, L.; Kahlmeier, S.; Nieuwenhuijsen, M. Health impact assessment of active transportation: A systematic review. Prev. Med. 2015, 76, 103–114. [Google Scholar] [CrossRef]
- De Hartog, J.J.; Boogaard, H.; Nijland, H.; Hoek, G. Do the health benefits of cycling outweigh the risks? Environ. Health Perspect. 2010, 118, 1109–1116. [Google Scholar] [CrossRef] [PubMed]
- Schauder, S.A.; Foley, M.C. The relationship between active transportation and health. J. Transp. Health 2015, 2, 343–349. [Google Scholar] [CrossRef]
- Tajalli, M.; Hajbabaie, A. On the relationships between commuting mode choice and public health. J. Transp. Health 2017, 4, 267–277. [Google Scholar] [CrossRef]
- Oja, P.; Vuori, I.; Paronen, O. Daily walking and cycling to work: Their utility as health-enhancing physical activity. Patient Educ. Couns. 1998, 33, S87–S94. [Google Scholar] [CrossRef]
- Marshall, W.E.; Piatkowski, D.P.; Garrick, N.W. Community design, street networks, and public health. J. Transp. Health 2014, 1, 326–340. [Google Scholar] [CrossRef]
- Brownson, R.C.; Hoehner, C.M.; Day, K.; Forsyth, A.; Sallis, J.F. Measuring the built environment for physical activity: State of science. Am. J. Prev. Med. 2009, 36, S99–S123. [Google Scholar] [CrossRef]
- Pont, K.; Ziviani, J.; Wadley, D.; Bennett, S.; Abbott, R. Environmental correlates of children’s active transportation: A systematic literature review. Health Place 2009, 15, 849–862. [Google Scholar] [CrossRef] [PubMed]
- Ewing, R.; Cervero, R. Travel and the built environment: A meta-analysis. J. Am. Plan. Assoc. 2010, 76, 265–294. [Google Scholar] [CrossRef]
- Grasser, G.; van Dyck, D.; Titze, S.; Stronegger, W. Objectively measured walkability and active transport and weight-related outcomes in adults: A systematic review. Int. J. Public Health 2013, 58, 615–625. [Google Scholar] [CrossRef] [PubMed]
- McCormack, G.R.; Shiell, A. In search of causality: A systematic review of the relationship between the built environment and physical activity among adults. Int. J. Behav. Nutr. Phys. Act. 2011, 8, 125. [Google Scholar] [CrossRef] [PubMed]
- Saelens, B.E.; Handy, S.L. Built environment correlates of walking: A review. Med. Sci. Sports Exerc. 2010, 40, S550–S566. [Google Scholar] [CrossRef] [PubMed]
- Saelens, B.E.; Sallis, J.F.; Frank, L.D. Environmental correlates of walking and cycling: Findings from the transportation, urban design, and planning literatures. Ann. Behav. Med. 2003, 25, 80–91. [Google Scholar] [CrossRef] [PubMed]
- Zapata-Diomedi, B.; Veerman, J.L. The association between built environment features and physical activity in the Australian context: A synthesis of the literature. BMC Public Health 2016, 16, 484. [Google Scholar] [CrossRef]
- Van Holle, V.; Deforche, B.; van Cauwenberg, J.; Goubert, L.; Maes, L.; van de Weghe, N.; de Bourdeaudhuij, I. Relationship between the physical environment and different domains of physical activity in European adults: A systematic review. BMC Public Health 2012, 12, 807. [Google Scholar] [CrossRef] [PubMed]
- Ding, D.; Gebel, K. Built environment, physical activity, and obesity: What have we learned from reviewing the literature? Health Place 2012, 18, 100–105. [Google Scholar] [CrossRef] [PubMed]
- Liberati, A.; Altman, D.G.; Tetzlaff, J.; Mulrow, C.; Gøtzsche, P.C.; Ioannidis, J.P.A.; Clarke, M.; Devereaux, P.J.; Kleijnen, J.; Moher, D. The PRISMA statement for reporting systematic reviews and meta-analyses of studies that evaluate health care interventions: Explanation and elaboration. PLoS Med. 2009, 6, e1000100. [Google Scholar] [CrossRef] [PubMed]
- Gebel, K.; Ding, D.; Foster, C.; Bauman, A.E.; Sallis, J.F. Improving current practice in reviews of the built environment and physical activity. Sports Med. 2015, 45, 297–302. [Google Scholar] [CrossRef]
- Rantakokko, M.; Mänty, M.; Rantanen, T. Mobility decline in old age. Exerc. Sport Sci. Rev. 2013, 41, 19–25. [Google Scholar] [CrossRef] [PubMed]
- McCormack, G.R.; Shiell, A.; Giles-Corti, B.; Begg, S.; Veerman, J.L.; Geelhoed, E.; Amarasinghe, A.; Emery, J.H. The association between sidewalk length and walking for different purposes in established neighborhoods. Int. J. Behav. Nutr. Phys. Act. 2012, 9, 92. [Google Scholar] [CrossRef] [PubMed]
- Knuiman, M.W.; Christian, H.E.; Divitini, M.L.; Foster, S.A.; Bull, F.C.; Badland, H.M.; Giles-Corti, B. A longitudinal analysis of the influence of the neighborhood built environment on walking for transportation: The RESIDE study. Am. J. Epidemiol. 2014, 180, 453–461. [Google Scholar] [CrossRef] [PubMed]
- Kamruzzaman, M.; Washington, S.; Baker, D.; Brown, W.; Giles-Corti, B.; Turrell, G. Built environment impacts on walking for transport in Brisbane, Australia. Transportation 2016, 43, 53–77. [Google Scholar] [CrossRef]
- Wasfi, R.A.; Dasgupta, K.; Eluru, N.; Ross, N.A. Exposure to walkable neighbourhoods in urban areas increases utilitarian walking: Longitudinal study of Canadians. J. Transp. Health 2016, 3, 440–447. [Google Scholar] [CrossRef]
- Miles, R.; Panton, L.B.; Jang, M.; Haymes, E.M. Residential context, walking and obesity: Two African-American neighborhoods compared. Health Place 2008, 14, 275–286. [Google Scholar] [CrossRef] [PubMed]
- Lee, C.; Moudon, A.V. Correlates of walking for transportation or recreation purposes. J. Phys. Act. Health 2006, 3, S77–S98. [Google Scholar] [CrossRef] [PubMed]
- Handy, S.; Cao, X.; Mokhtarian, P.L. Self-selection in the relationship between the built environment and walking: Empirical evidence from Northern California. J. Am. Plan. Assoc. 2006, 72, 55–74. [Google Scholar] [CrossRef]
- Pikora, T.J.; Giles-Corti, B.; Knuiman, M.W.; Bull, F.C.; Jamrozik, K.; Donovan, R.J. Neighborhood environmental factors correlated with walking near home: Using SPACES. Med. Sci. Sports Exerc. 2006, 38, 708–714. [Google Scholar] [CrossRef] [PubMed]
- Forsyth, A.; Oakes, J.M.; Schmitz, K.H.; Hearst, M. Does residential density increase walking and other physical activity? Urban Stud. 2007, 44, 679–697. [Google Scholar] [CrossRef]
- Rodríguez, D.A.; Evenson, K.R.; Diez Roux, A.V.; Brines, S.J. Land use, residential density, and walking: The multi-ethnic study of atherosclerosis. Am. J. Prev. Med. 2009, 37, 397–404. [Google Scholar] [CrossRef] [PubMed]
- Sundquist, K.; Eriksson, U.; Kawakami, N.; Skog, L.; Ohlsson, H.; Arvidsson, D. Neighborhood walkability, physical activity, and walking behavior: The Swedish Neighborhood and Physical Activity (SNAP) study. Soc. Sci. Med. 2011, 72, 1266–1273. [Google Scholar] [CrossRef] [PubMed]
- Carlson, C.; Aytur, S.; Gardner, K.; Rogers, S. Complexity in built environment, health, and destination walking: A neighborhood-scale analysis. J. Urban Health 2012, 89, 270–284. [Google Scholar] [CrossRef] [PubMed]
- Karusisi, N.; Thomas, F.; Méline, J.; Brondeel, R.; Chaix, B. Environmental conditions around itineraries to destinations as correlates of walking for transportation among Adults: The RECORD cohort study. PLoS ONE 2014, 9, e88929. [Google Scholar] [CrossRef] [PubMed]
- Sung, H.; Lee, S.; Jung, S. Identifying the relationship between the objectively measured built environment and walking activity in the high-density and transit-oriented city, Seoul, Korea. Environ. Plan. B Plan. Des. 2014, 41, 637–660. [Google Scholar] [CrossRef]
- Jack, E.; McCormack, G.R. The associations between objectively-determined and self-reported urban form characteristics and neighborhood-based walking in adults. Int. J. Behav. Nutr. Phys. Act. 2014, 11, 71. [Google Scholar] [CrossRef] [PubMed]
- Reyer, M.; Fina, S.; Siedentop, S.; Schlicht, W. Walkability is only part of the story: Walking for transportation in Stuttgart, Germany. Int. J. Environ. Res. Public Health 2014, 11, 5849–5865. [Google Scholar] [CrossRef] [PubMed]
- Thielman, J.; Rosella, L.; Copes, R.; Lebenbaum, M.; Manson, H. Neighborhood walkability: Differential associations with self-reported transport walking and leisure-time physical activity in Canadian towns and cities of all sizes. Prev. Med. 2015, 77, 174–180. [Google Scholar] [CrossRef] [PubMed]
- Owen, N.; Cerin, E.; Leslie, E.; DuToit, L.; Coffee, N.; Frank, L.D.; Bauman, A.E.; Hugo, G.; Saelens, B.E.; Sallis, J.F. Neighborhood walkability and the walking behavior of Australian adults. Am. J. Prev. Med. 2007, 33, 387–395. [Google Scholar] [CrossRef] [PubMed]
- Tilt, J.H.; Unfried, T.M.; Roca, B. Using objective and subjective measures of neighborhood greenness and accessible destinations for understanding walking trips and BMI in Seattle, Washington. Am. J. Health Promot. 2007, 21, 371–379. [Google Scholar] [CrossRef] [PubMed]
- Saelens, B.E.; Sallis, J.F.; Frank, L.D.; Cain, K.L.; Conway, T.L.; Chapman, J.E.; Slymen, D.J.; Kerr, J. Neighborhood environment and psychosocial correlates of adults’ physical activity. Med. Sci. Sports Exerc. 2012, 44, 637–646. [Google Scholar] [CrossRef] [PubMed]
- Riva, M.; Gauvin, L.; Apparicio, P.; Brodeur, J.M. Disentangling the relative influence of built and socioeconomic environments on walking: The contribution of areas homogenous along exposures of interest. Soc. Sci. Med. 2009, 69, 1296–1305. [Google Scholar] [CrossRef]
- Turrell, G.; Haynes, M.; Wilson, L.A.; Giles-Corti, B. Can the built environment reduce health inequalities? A study of neighbourhood socioeconomic disadvantage and walking for transport. Health Place 2013, 19, 89–98. [Google Scholar] [CrossRef] [PubMed]
- Wineman, J.D.; Marans, R.W.; Schulz, A.J.; van der Westhuizen, D.L.; Mentz, G.B.; Max, P. Designing healthy neighborhoods: Contributions of the built environment to physical activity in Detroit. J. Plan. Educ. Res. 2014, 34, 180–189. [Google Scholar] [CrossRef]
- Oliver, L.; Schuurman, N.; Hall, A.; Hayes, M. Assessing the influence of the built environment on physical activity for utility and recreation in suburban metro Vancouver. BMC Public Health 2011, 11, 959. [Google Scholar] [CrossRef] [PubMed]
- Koohsari, M.J.; Sugiyama, T.; Shibata, A.; Ishii, K.; Liao, Y.; Hanibuchi, T.; Owen, N.; Oka, K. Associations of street layout with walking and sedentary behaviors in an urban and a rural area of Japan. Health Place 2017, 45, 64–69. [Google Scholar] [CrossRef] [PubMed]
- Larrañaga, A.M.; Rizzi, L.I.; Arellana, J.; Strambi, O.; Cybis, H.B.B. The influence of built environment and travel attitudes on walking: A case study of Porto Alegre, Brazil. Int. J. Sustain. Transp. 2016, 10, 332–342. [Google Scholar] [CrossRef]
- Kelley, E.A.; Kandula, N.R.; Kanaya, A.M.; Yen, I.H. Neighborhood walkability and walking for transport among South Asians in the MASALA study. J. Phys. Act. Health 2016, 13, 514–519. [Google Scholar] [CrossRef] [PubMed]
- Koohsari, M.J.; Owen, N.; Cole, R.; Mavoa, S.; Oka, K.; Hanibuchi, T.; Sugiyama, T. Built environmental factors and adults’ travel behaviors: Role of street layout and local destinations. Prev. Med. 2017, 96, 124–128. [Google Scholar] [CrossRef] [PubMed]
- Dill, J.; Voros, K. Factors affecting bicycling demand: Initial survey findings from the Portland, Oregon, Region. Transp. Res. Rec. 2007, 2031, 9–17. [Google Scholar] [CrossRef]
- Owen, N.; de Bourdeaudhuij, I.; Sugiyama, T.; Leslie, E.; Cerin, E.; van Dyck, D.; Bauman, A. Bicycle use for transport in an Australian and a Belgian city: Associations with built-environment attributes. J. Urban Health 2010, 87, 189–198. [Google Scholar] [CrossRef] [PubMed]
- Rybarczyk, G.; Wu, C. Examining the impact of urban morphology on bicycle mode choice. Environ. Plan. B Plan. Des. 2014, 41, 272–288. [Google Scholar] [CrossRef]
- Zhao, P. The impact of the built environment on bicycle commuting: Evidence from Beijing. Urban Stud. 2014, 51, 1019–1037. [Google Scholar] [CrossRef]
- Foster, C.E.; Panter, J.R.; Wareham, N.J. Assessing the impact of road traffic on cycling for leisure and cycling to work. Int. J. Behav. Nutr. Phys. Act. 2011, 8, 61. [Google Scholar] [CrossRef] [PubMed]
- Ma, L.; Dill, J. Associations between the objective and perceived built environment and bicycling for transportation. J. Transp. Health 2015, 2, 248–255. [Google Scholar] [CrossRef]
- Heesch, K.C.; Giles-Corti, B.; Turrell, G. Cycling for transport and recreation: Associations with the socio-economic, natural and built environment. Health Place 2015, 36, 152–161. [Google Scholar] [CrossRef]
- Zahabi, S.A.H.; Chang, A.; Miranda-Moreno, L.F.; Patterson, Z. Exploring the link between the neighborhood typologies, bicycle infrastructure and commuting cycling over time and the potential impact on commuter GHG emissions. Transp. Res. Part D Transp. Environ. 2016, 47, 89–103. [Google Scholar] [CrossRef]
- Braun, L.M.; Rodriguez, D.A.; Cole-Hunter, T.; Ambros, A.; Donaire-Gonzalez, D.; Jerrett, M.; Mendez, M.A.; Nieuwenhuijsen, M.J.; de Nazelle, A. Short-term planning and policy interventions to promote cycling in urban centers: Findings from a commute mode choice analysis in Barcelona, Spain. Transp. Res. Part A Policy Pract. 2016, 89, 164–183. [Google Scholar] [CrossRef]
- Mertens, L.; Compernolle, S.; Deforche, B.; Mackenbach, J.D.; Lakerveld, J.; Brug, J.; Roda, C.; Feuillet, T.; Oppert, J.-M.; Glonti, K.; et al. Built environmental correlates of cycling for transport across Europe. Health Place 2017, 44, 35–42. [Google Scholar] [CrossRef] [PubMed]
- Kondo, K.; Lee, J.S.; Kawakubo, K.; Kataoka, Y.; Asami, Y.; Mori, K.; Umezaki, M.; Yamauchi, T.; Takagi, H.; Sunagawa, H.; et al. Association between daily physical activity and neighborhood environments. Environ. Health Prev. Med. 2009, 14, 196–206. [Google Scholar] [CrossRef] [PubMed]
- Cervero, R.; Sarmiento, O.L.; Jacoby, E.; Gomez, L.F.; Neiman, A. Influences of built environments on walking and cycling: Lessons from Bogotá. Int. J. Sustain. Transp. 2009, 3, 203–226. [Google Scholar] [CrossRef]
- Van Dyck, D.; Deforche, B.; Cardon, G.; de Bourdeaudhuij, I. Neighbourhood walkability and its particular importance for adults with a preference for passive transport. Health Place 2009, 15, 496–504. [Google Scholar] [CrossRef] [PubMed]
- Van Dyck, D.; Cardon, G.; Deforche, B.; Sallis, J.F.; Owen, N.; de Bourdeaudhuij, I. Neighborhood SES and walkability are related to physical activity behavior in Belgian adults. Prev. Med. 2010, 50, S74–S79. [Google Scholar] [CrossRef] [PubMed]
- Fan, J.X.; Wen, M.; Kowaleski-Jones, L. An ecological analysis of environmental correlates of active commuting in urban U.S. Health Place 2014, 30, 242–250. [Google Scholar] [CrossRef] [PubMed]
- Munshi, T. Built environment and mode choice relationship for commute travel in the city of Rajkot, India. Transp. Res. Part D Transp. Environ. 2016, 44, 239–253. [Google Scholar] [CrossRef]
- Christiansen, L.B.; Cerin, E.; Badland, H.; Kerr, J.; Davey, R.; Troelsen, J.; van Dyck, D.; Mitáš, J.; Schofield, G.; Sugiyama, T.; et al. International comparisons of the associations between objective measures of the built environment and transport-related walking and cycling: IPEN adult study. J. Transp. Health 2016, 3, 467–478. [Google Scholar] [CrossRef] [PubMed]
- Witten, K.; Blakely, T.; Bagheri, N.; Badland, H.; Ivory, V.; Pearce, J.; Mavoa, S.; Hinckson, E.; Schofield, G. Neighborhood built environment and transport and leisure physical activity: Findings using objective exposure and outcome measures in New Zealand. Environ. Health Perspect. 2012, 120, 971–977. [Google Scholar] [CrossRef] [PubMed]
- Frank, L.D.; Sallis, J.F.; Conway, T.L.; Chapman, J.E.; Saelens, B.E.; Bachman, W. Many Pathways from Land Use to Health: Associations between Neighborhood Walkability and Active Transportation, Body Mass Index, and Air Quality. J. Am. Plan. Assoc. 2006, 72, 75–87. [Google Scholar] [CrossRef]
- Hoehner, C.M.; Brennan Ramirez, L.K.; Elliott, M.B.; Handy, S.L.; Brownson, R.C. Perceived and objective environmental measures and physical activity among urban adults. Am. J. Prev. Med. 2005, 28, 105–116. [Google Scholar] [CrossRef] [PubMed]
- De Sa, E.; Ardern, C.I. Associations between the built environment, total, recreational, and transit-related physical activity. BMC Public Health 2014, 14, 693. [Google Scholar] [CrossRef] [PubMed]
- Mäki-Opas, T.E.; Borodulin, K.; Valkeinen, H.; Stenholm, S.; Kunst, A.E.; Abel, T.; Härkänen, T.; Kopperoinen, L.; Itkonen, P.; Prättälä, R.; et al. The contribution of travel-related urban zones, cycling and pedestrian networks and green space to commuting physical activity among adults—A cross-sectional population-based study using geographical information systems. BMC Public Health 2016, 16, 760. [Google Scholar] [CrossRef] [PubMed]
- Feng, J. The built environment and active travel: Evidence from Nanjing, China. Int. J. Environ. Res. Public Health 2016, 13, 301. [Google Scholar] [CrossRef] [PubMed]
- EPHPP. Quality Assessment Tool for Quantitative Studies Dictionary. Available online: http://www.ephpp.ca/PDF/QADictionary_dec2009.pdf (accessed on 12 December 2016).
- Thomas, H. Quality Assessment Tool for Quantitative Studies. Available online: http://www.ephpp.ca/PDF/Quality Assessment Tool_2010_2.pdf (accessed on 12 December 2016).
- Armijo-Olivo, S.; Stiles, C.R.; Hagen, N.A.; Biondo, P.D.; Cummings, G.G. Assessment of study quality for systematic reviews: A comparison of the Cochrane Collaboration Risk of Bias Tool and the Effective Public Health Practice Project Quality Assessment Tool: Methodological Research. J. Eval. Clin. Pract. 2012, 18, 12–18. [Google Scholar] [CrossRef] [PubMed]
- Craig, C.L.; Marshall, A.L.; Sjöström, M.; Bauman, A.E.; Booth, M.L.; Ainsworth, B.E.; Pratt, M.; Ekelund, U.; Yngve, A.; Sallis, J.F.; et al. International physical activity questionnaire: 12-Country reliability and validity. Med. Sci. Sports Exerc. 2003, 35, 1381–1395. [Google Scholar] [CrossRef] [PubMed]
- Cerin, E.; Nathan, A.; van Cauwenberg, J.; Barnett, D.W.; Barnett, A. The neighbourhood physical environment and active travel in older adults: A systematic review and meta-analysis. Int. J. Behav. Nutr. Phys. Act. 2017, 14, 15. [Google Scholar] [CrossRef]
- Fraser, S.D.S.; Lock, K. Cycling for transport and public health: A systematic review of the effect of the environment on cycling. Eur. J. Public Health 2011, 21, 738–743. [Google Scholar] [CrossRef] [PubMed]
- Pucher, J.; Buehler, R. Making cycling irresistible: Lessons from the Netherlands, Denmark and Germany. Transp. Rev. 2008, 28, 495–528. [Google Scholar] [CrossRef]
- Stewart, G.; Anokye, N.K.; Pokhrel, S. What interventions increase commuter cycling? A systematic review. BMJ Open 2015, 5, e007945. [Google Scholar] [CrossRef] [PubMed]
- Moudon, A.V.; Lee, C.; Cheadle, A.D.; Collier, C.W.; Johnson, D.; Schmid, T.L.; Weather, R.D. Cycling and the built environment, a US perspective. Transp. Res. Part D Transp. Environ. 2005, 10, 245–261. [Google Scholar] [CrossRef]
© 2017 by the authors. Licensee MDPI, Basel, Switzerland. This article is an open access article distributed under the terms and conditions of the Creative Commons Attribution (CC BY) license (http://creativecommons.org/licenses/by/4.0/).