Next Issue
Volume 1, September
Previous Issue
Volume 1, March


Urban Sci., Volume 1, Issue 2 (June 2017) – 11 articles

Cover Story (view full-size image): 
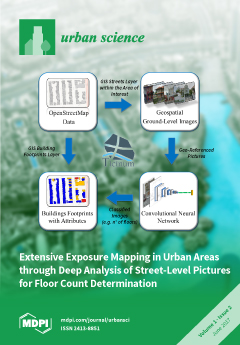
The cover image illustrates urban mapping through street-level images as implemented by Ticinum Aerospace. Starting from a public map of the area of interest, such as an OpenStreetMap layer, the system defines a georeferenced “visit path”, along which street-side building pictures are sought for, and harvested from, publicly accessible repositories. The retrieved georeferenced images are fed into an opportunely trained deep neural network. This latter consequently finds determining features and labels the building according to a given taxonomy, in addition to determining specific parameters such as floor count, resulting in a remarkably enriched GIS layer being output. This paper shows how deep learning enables leveraging on the wealth of available crowdsourced pictures to benefit practical applications including, for example, enhanced exposure models for risk assessment, or real estate valuation. View [...] Read more.
  • Issues are regarded as officially published after their release is announced to the table of contents alert mailing list.
  • You may sign up for e-mail alerts to receive table of contents of newly released issues.
  • PDF is the official format for papers published in both, html and pdf forms. To view the papers in pdf format, click on the "PDF Full-text" link, and use the free Adobe Reader to open them.
Order results
Result details
Select all
Export citation of selected articles as:
524 KiB  
Article
Promoting Crowdsourcing for Urban Research: Cycling Safety Citizen Science in Four Cities
by Colin Ferster, Trisalyn Nelson, Karen Laberee, Ward Vanlaar and Meghan Winters
Urban Sci. 2017, 1(2), 21; https://doi.org/10.3390/urbansci1020021 - 21 Jun 2017
Cited by 15 | Viewed by 5617
Abstract
People generate massive volumes of data on the Internet about cities. Researchers may engage these crowds to fill data gaps and better understand and inform planning decisions. Crowdsourced tools for data collection must be supported by outreach; however, researchers typically have limited experience [...] Read more.
People generate massive volumes of data on the Internet about cities. Researchers may engage these crowds to fill data gaps and better understand and inform planning decisions. Crowdsourced tools for data collection must be supported by outreach; however, researchers typically have limited experience with marketing and promotion. Our goal is to provide guidance on effective promotion strategies. We evaluated promotion efforts for BikeMaps.org, a crowdsourced tool for cycling collisions, near misses, hazards, and thefts. We analyzed website use (sessions) and incidents reported, and how they related to promotion medium (social, traditional news, or in-person), intended audience (cyclists or general), and community context (cycling mode share, cycling facilities, and a survey in the broader community). We compared four Canadian cities, three with active promotion, and one without, over eight months. High-use events were identified in time periods with above average web sessions. We found that promotion was essential for use of the project. Targeting cycling specific audiences resulted in more data submitted, while targeting general audiences resulted in greater age and gender diversity. We encourage researchers to use tools to monitor and adapt to promotion medium, audience, and community context. Strategic promotion may help achieve more diverse representation in crowdsourced data. Full article
(This article belongs to the Special Issue Crowdsourcing Urban Data)
Show Figures

Figure 1

14693 KiB  
Article
Integrated Use of Aerial Photographs and LiDAR Images for Landslide and Soil Erosion Analysis: A Case Study of Wakamow Valley, Moose Jaw, Canada
by Abdul Raouf, Yulu Peng and Tayyab Ikram Shah
Urban Sci. 2017, 1(2), 20; https://doi.org/10.3390/urbansci1020020 - 17 Jun 2017
Cited by 4 | Viewed by 5015
Abstract
Urban parks and open spaces offer a unique setting that can play a vital role in improving health and quality of life in cities and towns, making cities more attractive places to live and work, and connecting residents to nature. Degradation of park [...] Read more.
Urban parks and open spaces offer a unique setting that can play a vital role in improving health and quality of life in cities and towns, making cities more attractive places to live and work, and connecting residents to nature. Degradation of park facilities caused by natural processes or recreational activities requires continuous monitoring for efficient maintenance and management. Identification and continuous monitoring of areas prone to natural hazards such as landslides within an urban park are particularly important for public safety. Traditional techniques for identification and monitoring of such areas involving field surveys, being costly and time-consuming, cannot be used on a regular basis. This research explored the integrated use of aerial photographs and point cloud LiDAR data for identification of areas prone to landslide and soil erosion zones in an urban park and a conservation area known as Wakamow Valley, Moose Jaw, Saskatchewan, Canada. This study used the point cloud LiDAR of 2014 to develop a Digital Elevation Model (DEM) of the area. The accuracy of the DEM was validated through a series of well-distributed ground control points collected through a survey grade handheld GPS device. The areas prone to potential landslides and soil erosion were identified using slope analysis techniques. A typical criterion of areas having a slope greater than 35° was used for classification of potential hazardous zones. Geospatial information including land-cover, land-use, and trail system was extracted from a 2014 aerial photograph to create a base map. It has been estimated that 5.3 km along the banks of the Moose Jaw River and 8 km along the cliff of the canyon-shaped Wakamow Valley are under a possible threat of soil erosion and landslides. This portion of the valley was classified as high-risk for possible landslides and soil erosion. Full article
Show Figures

Figure 1

3394 KiB  
Article
Historic Roots of Modern Residential Segregation in a Southwestern Metropolis: San Antonio, Texas in 1910 and 2010
by Rebecca J. Walter, Nathan Foote, Hilton A. Cordoba and Corey Sparks
Urban Sci. 2017, 1(2), 19; https://doi.org/10.3390/urbansci1020019 - 01 Jun 2017
Cited by 5 | Viewed by 7411
Abstract
This study seeks to understand the historic roots of modern segregation by comparing residential racial patterns in the city of San Antonio over time. The year 1910 is recreated for San Antonio by georeferencing and digitizing historic Sanborn maps and aligning residential structures [...] Read more.
This study seeks to understand the historic roots of modern segregation by comparing residential racial patterns in the city of San Antonio over time. The year 1910 is recreated for San Antonio by georeferencing and digitizing historic Sanborn maps and aligning residential structures with historical census and city directory race data for the head of household. The historical point data are aggregated to the census block level and compared to 2010 householder race data by calculating the two most common dimensions of residential segregation: evenness (dissimilarity and Theil’s index) and exposure (isolation and interaction). The findings reveal that by 1910 San Antonio was already a remarkably segregated city and the original patterns of residential segregation resemble contemporary San Antonio. Particularly, residential racial segregation in the Hispanic concentrated southwestern portion of the city has increased over time resulting in an exceptionally racially divided metropolis. Full article
(This article belongs to the Special Issue Urban Inequality)
Show Figures

Figure 1

1411 KiB  
Article
Metropolitan Innovation in the New Economy
by Gordon Mulligan, Neil Reid and Matthew Lehnert
Urban Sci. 2017, 1(2), 18; https://doi.org/10.3390/urbansci1020018 - 16 May 2017
Cited by 2 | Viewed by 3892
Abstract
This paper analyzes the high-tech economies of 350-plus metropolitan areas across the U.S. during 2010. Attention is given to 20 different production attributes—including the age and education of the workforce, patent production, business startups, per capita productivity of the workers, and the like. [...] Read more.
This paper analyzes the high-tech economies of 350-plus metropolitan areas across the U.S. during 2010. Attention is given to 20 different production attributes—including the age and education of the workforce, patent production, business startups, per capita productivity of the workers, and the like. Multivariate analysis is used to reduce these 20 attributes down to 10 orthogonal dimensions; then the scores on these dimensions are used to identify eight different innovation and entrepreneurial clubs. Basically the exercise deconstructs the metropolitan economies into various parts so that each economy is assigned a signature score on each of the independent factors. High-tech places, which are especially active in both patents and startups, are shown to be more heterogeneous than low-tech places. Moreover, the recent growth and change seen in many metropolitan areas appears to be associated with the incidence of very different factors: population growth has been driven by forces that are different from those that have induced either employment change or productivity growth in those metropolitan areas. Full article
Show Figures

Figure 1

1904 KiB  
Article
A Conceptual Modeling Approach to Health-Related Urban Well-Being
by Malte Von Szombathely, Myriam Albrecht, Dejan Antanaskovic, Jobst Augustin, Matthias Augustin, Benjamin Bechtel, Thomas Bürk, Jana Fischereit, David Grawe, Peter Hoffmann, Giedrius Kaveckis, Anne Caroline Krefis, Jürgen Oßenbrügge, Jürgen Scheffran and K. Heinke Schlünzen
Urban Sci. 2017, 1(2), 17; https://doi.org/10.3390/urbansci1020017 - 12 May 2017
Cited by 19 | Viewed by 7584
Abstract
In cities, social well-being faces obstacles posed by globalization, demographic and climate change, new forms of social organization, and the fragmentation of lifestyles. These changes affect the vulnerability of city societies and impact their health-related urban well-being (UrbWellth). The conceptual model introduced in [...] Read more.
In cities, social well-being faces obstacles posed by globalization, demographic and climate change, new forms of social organization, and the fragmentation of lifestyles. These changes affect the vulnerability of city societies and impact their health-related urban well-being (UrbWellth). The conceptual model introduced in this paper systematizes the relevant variables while considering previous research, and establishes the target value UrbWellth. The model differs from existing approaches mainly in the analytical distinctions it suggests. These allow us to group the relevant urban influence variables into four sectors and enable a more general and abstract consideration of health-related urban relations. The introduction of vulnerability as a filter and transfer function acts as an effect modifier between UrbWellth and the various urban variables. Full article
Show Figures

Figure 1

3304 KiB  
Article
Extensive Exposure Mapping in Urban Areas through Deep Analysis of Street-Level Pictures for Floor Count Determination
by Gianni Cristian Iannelli and Fabio Dell’Acqua
Urban Sci. 2017, 1(2), 16; https://doi.org/10.3390/urbansci1020016 - 10 May 2017
Cited by 19 | Viewed by 5816
Abstract
In order for a risk assessment to deliver sensible results, exposure in the concerned area must be known or at least estimated in a reliable manner. Exposure estimation, though, may be tricky, especially in urban areas, where large-scale surveying is generally expensive and [...] Read more.
In order for a risk assessment to deliver sensible results, exposure in the concerned area must be known or at least estimated in a reliable manner. Exposure estimation, though, may be tricky, especially in urban areas, where large-scale surveying is generally expensive and impractical; yet, it is in urban areas that most assets are at stake when a disaster strikes. Authoritative sources such as cadastral data and business records may not be readily accessible to private stakeholders such as insurance companies; airborne and especially satellite-based Earth-Observation data obviously cannot retrieve all relevant pieces of information. Recently, a growing interest is recorded in the exploitation of street-level pictures, procured either through crowdsourcing or through specialized services like Google Street View. Pictures of building facades convey a great amount of information, but their interpretation is complex. Recently, however, smarter image analysis methods based on deep learning started appearing in literature, made possible by the increasing availability of computational power. In this paper, we leverage such methods to design a system for large-scale, systematic scanning of street-level pictures intended to map floor numbers in urban buildings. Although quite simple, this piece of information is a relevant exposure proxy in risk assessment. In the proposed system, a series of georeferenced images are automatically retrieved from the repository where they sit. A tailored deep learning net is first trained on sample images tagged through visual interpretation, and then systematically applied to the entire retrieved dataset. A specific algorithm allows attaching “number of floors” tags to the correct building in a dedicated GIS (Geographic Information System) layer, which is finally output by the system as an “exposure proxy” layer. Full article
Show Figures

Figure 1

12519 KiB  
Article
Quality of Crowdsourced Data on Urban Morphology—The Human Influence Experiment (HUMINEX)
by Benjamin Bechtel, Matthias Demuzere, Panagiotis Sismanidis, Daniel Fenner, Oscar Brousse, Christoph Beck, Frieke Van Coillie, Olaf Conrad, Iphigenia Keramitsoglou, Ariane Middel, Gerald Mills, Dev Niyogi, Marco Otto, Linda See and Marie-Leen Verdonck
Urban Sci. 2017, 1(2), 15; https://doi.org/10.3390/urbansci1020015 - 09 May 2017
Cited by 65 | Viewed by 11595
Abstract
The World Urban Database and Access Portal Tools (WUDAPT) is a community initiative to collect worldwide data on urban form (i.e., morphology, materials) and function (i.e., use and metabolism). This is achieved through crowdsourcing, which we define here as the collection of data [...] Read more.
The World Urban Database and Access Portal Tools (WUDAPT) is a community initiative to collect worldwide data on urban form (i.e., morphology, materials) and function (i.e., use and metabolism). This is achieved through crowdsourcing, which we define here as the collection of data by a bounded crowd, composed of students. In this process, training data for the classification of urban structures into Local Climate Zones (LCZ) are obtained, which are, like most volunteered geographic information initiatives, of unknown quality. In this study, we investigated the quality of 94 crowdsourced training datasets for ten cities, generated by 119 students from six universities. The results showed large discrepancies and the resulting LCZ maps were mostly of poor to moderate quality. This was due to general difficulties in the human interpretation of the (urban) landscape and in the understanding of the LCZ scheme. However, the quality of the LCZ maps improved with the number of training data revisions. As evidence for the wisdom of the crowd, improvements of up to 20% in overall accuracy were found when multiple training datasets were used together to create a single LCZ map. This improvement was greatest for small training datasets, saturating at about ten to fifteen sets. Full article
(This article belongs to the Special Issue Crowdsourcing Urban Data)
Show Figures

Graphical abstract

2862 KiB  
Article
At a Crossroads: Investigating Automobility and Its Implications for Local Urban Transport Policy Design
by Mike Hynes
Urban Sci. 2017, 1(2), 14; https://doi.org/10.3390/urbansci1020014 - 05 May 2017
Cited by 9 | Viewed by 5863
Abstract
More people than ever before are living in urban settlements, increasing competition for living space, employment, food, water, and energy. Urbanisation poses many challenges, most notably meeting the basic health and well-being needs of inhabitants. One of the key challenges faced is the [...] Read more.
More people than ever before are living in urban settlements, increasing competition for living space, employment, food, water, and energy. Urbanisation poses many challenges, most notably meeting the basic health and well-being needs of inhabitants. One of the key challenges faced is the increase in transport-related energy consumption and its negative economic, environmental, and social consequences. Cities and towns are complex spatial structures supported by transport systems, and automobility dominates many urban planning decisions. Such approaches to transportation and land use patterns favour and promote car use, providing inadequate alternatives or more sustainable modes of transport such as public transport, cycling, and walking. However, automobility is now deemed unsustainable, and moves toward more sustainable modes of transport are both necessary and essential to improving the quality of life for all citizens. This study seeks to determine levels of automobility thinking and attitudes to transportation in Galway, a small city on the west coast of Ireland, and provides an innovative, quantitative measure of reliance on this single mode of transport. Results indicate people who live in the city are not as car dependent as its rural hinterlands, although this is seldom reflected in local authority and regional transport approaches and decision-making. Full article
Show Figures

Figure 1

6169 KiB  
Article
An Urban “Mixity”: Spatial Dynamics of Social Interactions and Human Behaviors in the Abese informal Quarter of La Dadekotopon, Ghana
by Seth Asare Okyere, Stephen Kofi Diko, Miyuki Hiraoka and Michihiro Kita
Urban Sci. 2017, 1(2), 13; https://doi.org/10.3390/urbansci1020013 - 14 Apr 2017
Cited by 12 | Viewed by 9220
Abstract
Informal settlements form part of the socio-spatial landscape of urban areas. Yet little is known about their spatial aspects, compared to the social aspects. With global attention on sustainable cities and inclusive urban planning, there is a need to pay attention to the [...] Read more.
Informal settlements form part of the socio-spatial landscape of urban areas. Yet little is known about their spatial aspects, compared to the social aspects. With global attention on sustainable cities and inclusive urban planning, there is a need to pay attention to the spatial dynamics of human behavior and interactions as they have ramifications for the sustainable planning and design of informal spaces. Using observation and mapping, this paper emphasizes the spatial dynamics of social interactions and human behavior in the indigenous settlement of the Abese quarter of La Dadekotopon, Ghana. Spatially, the study identifies a hierarchical, irregular, and open system of roads and alleys that support residents’ everyday life. An “urban mixity” pattern of human behavior exists in the quarter, which denotes the social and physical use of informal urban spaces by residents to fulfill different needs at various times of the day. This creates lively urban spaces within the quarter. The location and physical characteristics, microclimate, and residents’ needs have contributed to this kind of informal urban spaces. This paper argues for planning and design improvement that integrate, rather than supplant, existing local physical characteristics, social interactions and human behaviors to maintain local identity and sustain urban life. Full article
Show Figures

Figure 1

4831 KiB  
Article
Modeling Determinants of Urban Growth in Conakry, Guinea: A Spatial Logistic Approach
by Arafan Traore and Teiji Watanabe
Urban Sci. 2017, 1(2), 12; https://doi.org/10.3390/urbansci1020012 - 10 Apr 2017
Cited by 14 | Viewed by 6441
Abstract
The main objective of the present study was to integrate a logistic regression model (LRM), a geographic information system (GIS) and remote sensing (RS) techniques to analyze and quantify urban growth patterns and investigate the relationship between urban growth and various driving forces. [...] Read more.
The main objective of the present study was to integrate a logistic regression model (LRM), a geographic information system (GIS) and remote sensing (RS) techniques to analyze and quantify urban growth patterns and investigate the relationship between urban growth and various driving forces. Landsat images from 1986, 2000, and 2016 derived from the TM, ETM+, and OLI sensors respectively were used to simulate an urban growth probability map for Conakry. To better explain the effects of the drivers on the urban growth processes in the study area, variables for two groups of drivers were considered: socioeconomic proximity and physical topography. The results of the LRM using IDRISI Selva indicated that the variables elevation (β7 = 1.76) and distance to major roads (β4 = 0.67) resulted in models with the best fit and the highest regression coefficients. These results indicate a high probability of urban growth in areas with high elevation and near major roads. The validation of the model was conducted using the relative operating characteristic (ROC) method; which result exhibited high accuracy of 0.89 between the simulated urban growth probability map and the actual one. A land use/land cover (LULC) change analysis showed that the urban area had undergone continuous growth over the study period resulting in an extent of 143.5 km2 for the urban area class in 2016. Full article
Show Figures

Figure 1

847 KiB  
Article
Influence of Urban Multi-Criteria Deprivation and Spatial Accessibility to Healthcare on Self-Reported Health
by Pablo Cabrera-Barona
Urban Sci. 2017, 1(2), 11; https://doi.org/10.3390/urbansci1020011 - 30 Mar 2017
Cited by 6 | Viewed by 4053
Abstract
Self-reported health is considered a health outcome related to neighborhood characteristics. This study analyzes the influence of urban multi-criteria deprivation and spatial accessibility to healthcare on individual self-reported health from a case study carried out in the city of Quito, Ecuador. A multi-criteria [...] Read more.
Self-reported health is considered a health outcome related to neighborhood characteristics. This study analyzes the influence of urban multi-criteria deprivation and spatial accessibility to healthcare on individual self-reported health from a case study carried out in the city of Quito, Ecuador. A multi-criteria deprivation index and two alternative scenarios of this index were generated. A gravity-based measure of spatial accessibility to healthcare was also calculated. The neighborhood effects of deprivation measures and spatial accessibility to healthcare on individual self-reported health were evaluated by applying multilevel models. Significant neighborhood effects were found in two of the three applied multilevel models. This study contributes evidence of neighborhood effects on health outcomes, and can support urban planners and policy-makers in the reduction of urban health-related inequalities. Full article
Show Figures

Figure 1

Previous Issue
Next Issue
Back to TopTop