5.2. The Eight Broad Types
All of the seven Type 1 cities are iconic Sunbelt economies. These metropolitan areas are small in population size (the average was 369 K in 2010) and rich in amenities, and the residents of these places—like Prescott, AZ and Naples, FL—are often talented and educated although they tend to be older if not retired. Naples’ population, for example, has 48.5% of its population who are over 65 years of age and older [
67]. Therefore, entrepreneurship is limited (as most industries are population-serving), there is hardly any patent production, and there is almost a complete absence of high value-added industry. As
Table 4 indicates these cities all have high housing costs and they score low on metropolitan ambience and education but high on recreation. Again, using the example of Naples, the metropolitan area has high location quotients in sectors such as arts, entertainment and recreation (3.33), real estate rental and leasing (1.68), and accommodation and food services (1.45) [
68].
Another 77 cities were classified as Type 2 economies. These places are even smaller in size (average 297 K) and they also significantly underperform the national metropolitan average in all aspects of innovation. Forty-five of these places, including Green Bay, WI and Flint, MI, are located in the Snowbelt and 32 others, including Shreveport, LA and Waco, TX, are located in the Sunbelt. These places score low on Factors 1 (−0.87) and 5 (−0.43) and high on Factor 8 (0.81), indicating that their workforces are old and their various industries are generally unproductive. These cities also score very low on such attributes as ambience, education, and recreation although housing is generally very affordable. However, there are a few anomalies—the twin city of Champaign-Urbana, IL being perhaps the best example—where places are remarkably creative even though they largely focus on low-tech activities.
The Type 3 economies are more numerous and somewhat larger (average 456 K) in size. While these 121 places generally perform a little better on the main innovation dimension, Factor 1 (−0.26), they exhibit weakness across nearly all the other factors, and they invariably have a deficiency in talented workers and rates of entrepreneurship and patent production that are below the national average. As in the prior cases the per capita GDP is low. However, there is some evidence given in Factor 8 (−0.72) of recent growth in the youthful workforces of such places. These cities are spread across the entire nation although nearly 72% are located in the Snowbelt. The cluster includes many declining industrial centers (Buffalo, NY; Scranton, PA; and Dayton, OH) and a mixture of both minor and major service centers (El Paso, TX; St Louis, MO: and Knoxville, TN). Buffalo, Scranton, Dayton and St, Louis are all examples of so called shrinking cities whose populations are 55.4%, 47.5%, 46.2% and 63.2% below their peak populations respectively. Minneapolis, MN is the main anomaly here because that city is known to exhibit significant innovation; again that place is a metropolitan area comprised of two rather different twin cities.
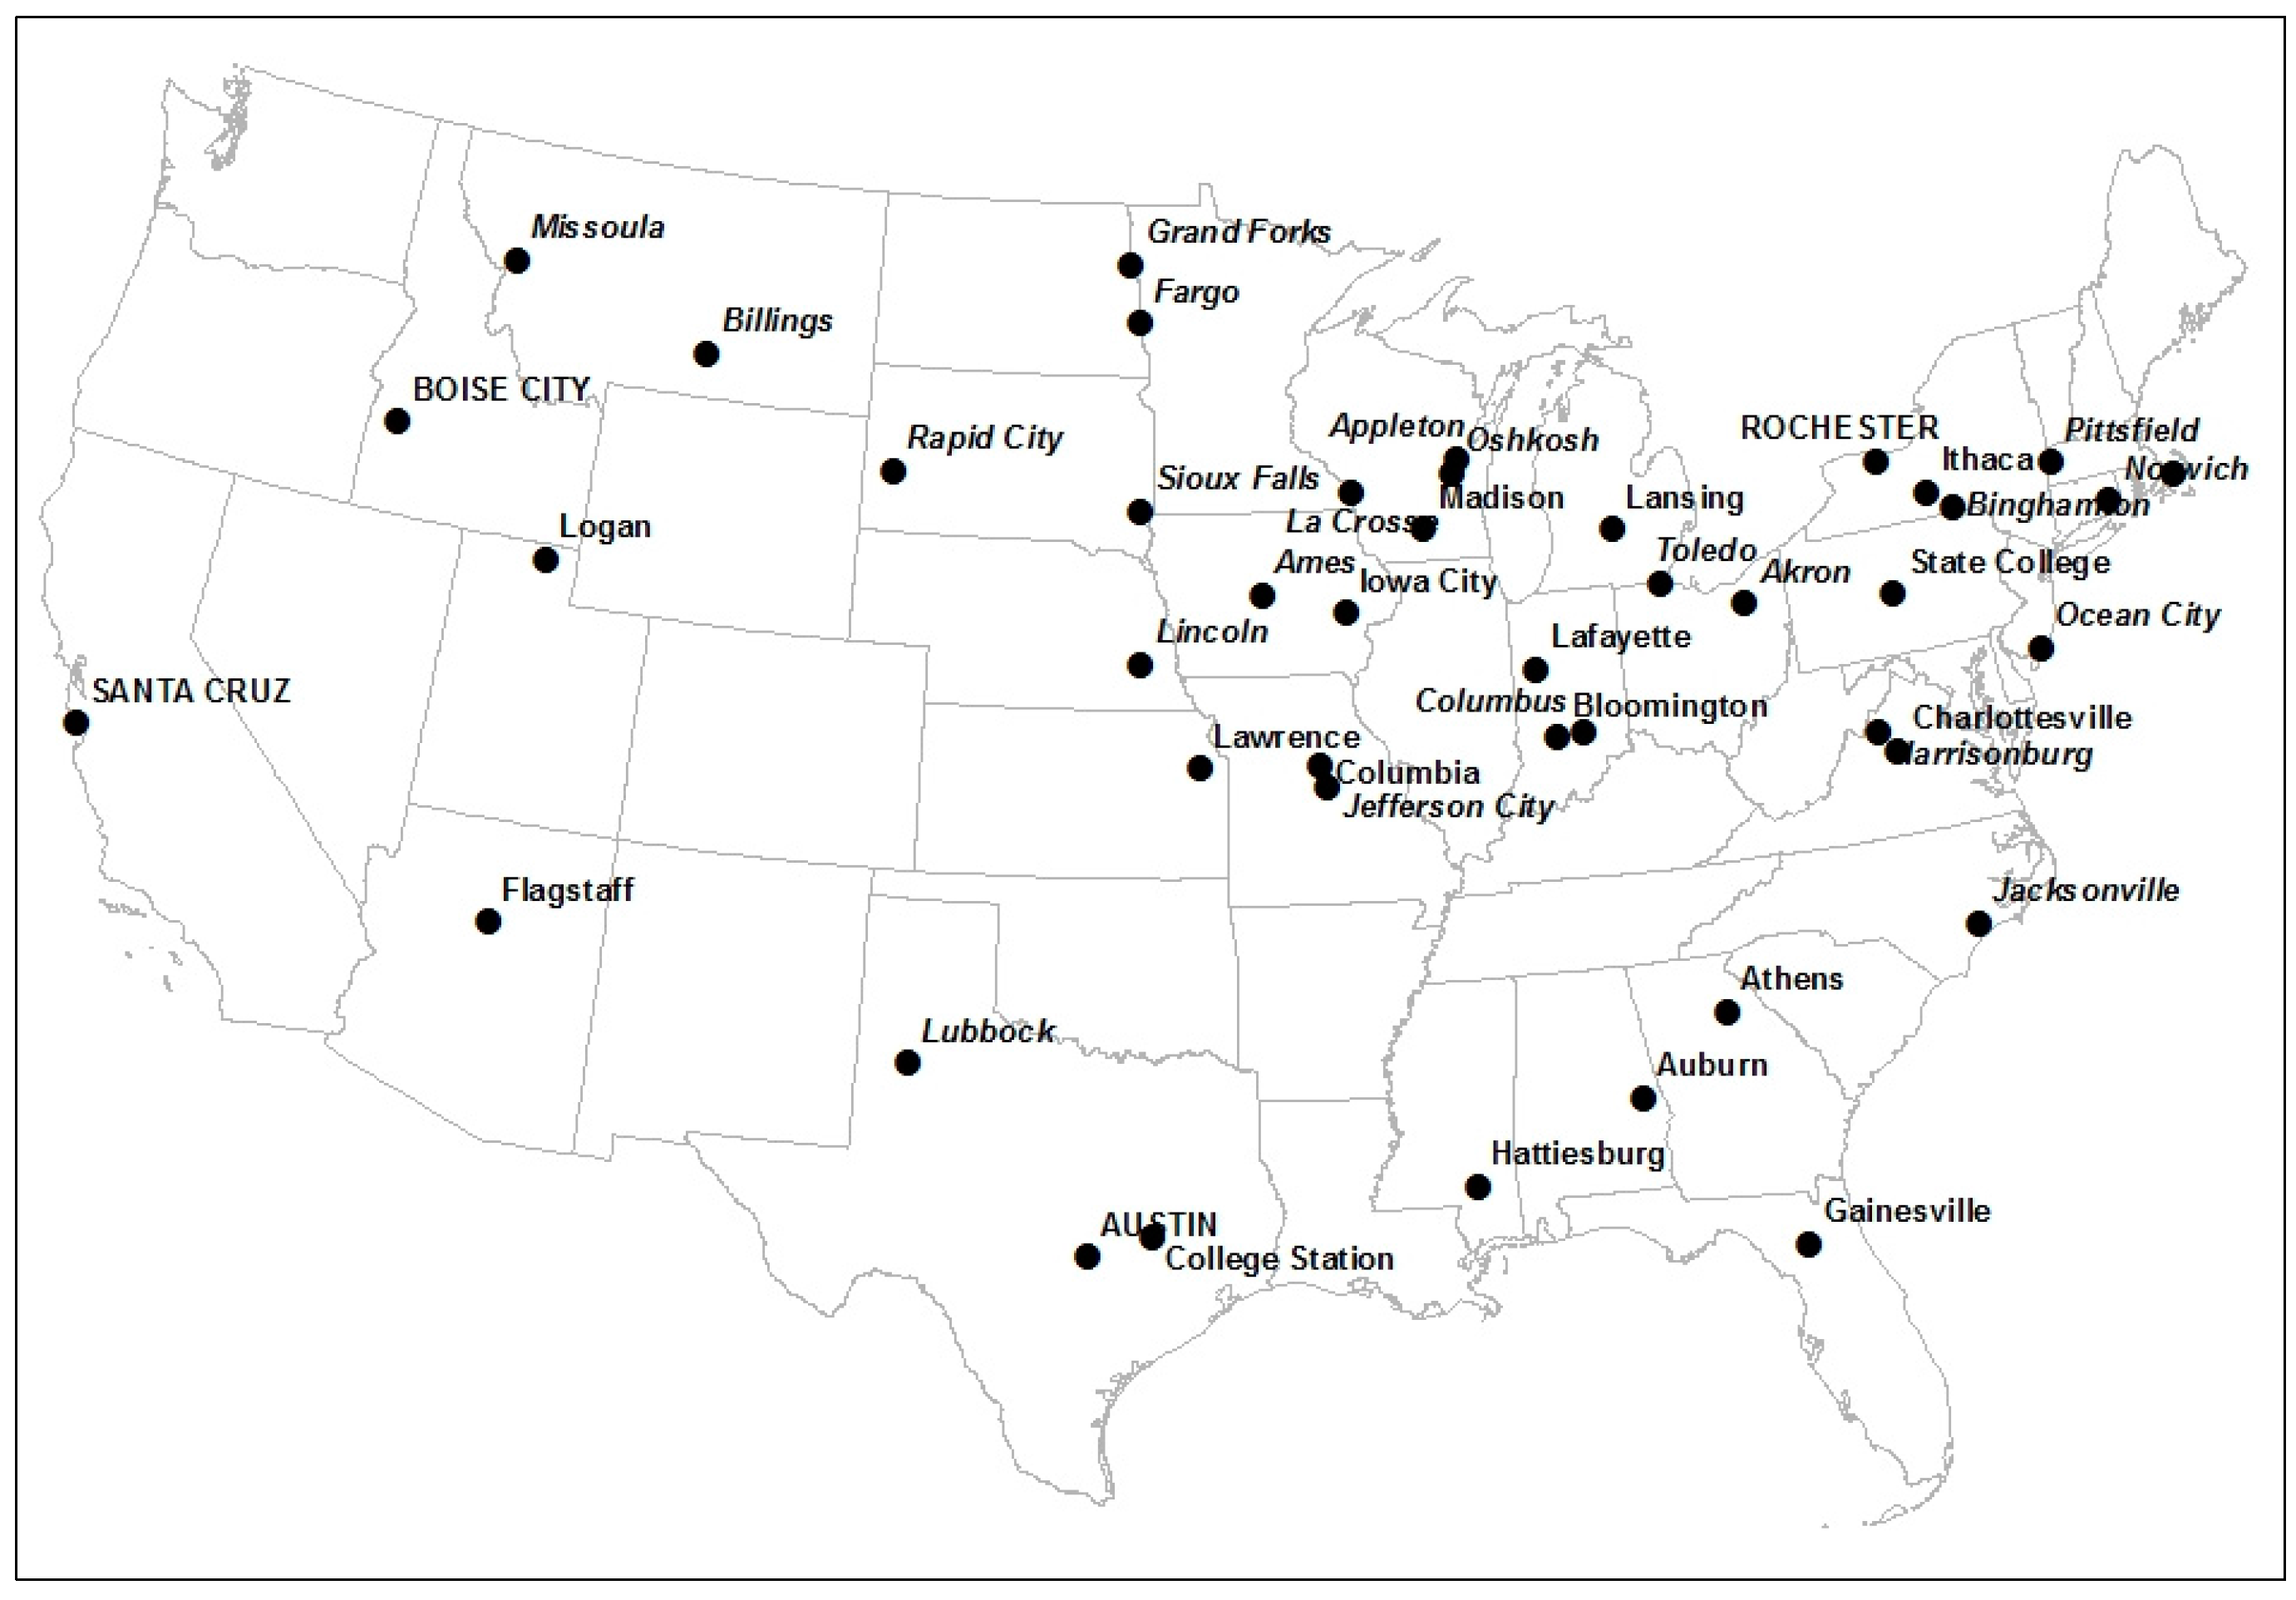
The Type 4 economies are the smallest of the eight types in terms of average population size (278 K) and some four-fifths of this group can be found in the nation’s Snowbelt (see the map in
Figure 1). These places score fairly strongly on Factors 1 (0.77) and 5 (0.56) but they score very weakly on several other dimensions, especially Factor 10 (−0.98). Therefore, while these cities have young, innovative workers and high-wage industries, the entrepreneurial aspects of these metropolitan economies are often either weak or in decline. Type 4 places scored strongly on ambience and education, exhibit low crime rates, and are often found in locations with poor natural amenities (
Table 4). A large proportion of these places are either old industrial cities (like the prior group) in the Rustbelt or small cities with thriving research universities. A second stage factor analysis divided these 44 places into three groups: Type 4.1 having 23 members, Type 4.2 having 17 members, and Type 4.3 having only 4 members. Although all three groups perform modestly on the innovation index, there is significant differentiation in other aspects of their economies. Type 4.3 cities clearly outperform the other two Types in both entrepreneurship and patent production and, in fact, their workforces constitute an average of the other two Types in terms of talent and age. Here the Type 4.1 cities are much older and much less talented than the Type 4.2 cities. Moreover, the cities in the first group are marginally stronger in entrepreneurship while the cities in the second group are marginally stronger in patent production. Type 4.1 includes several industrial cities like Toledo, OH and several important regional service centers like Jacksonville, FL and Lincoln, NE; Type 4.2 includes numerous places with large research universities including Gainesville, FL, State College, PA, and Madison, WI; and Type 4.3 includes several high-tech hubs like Austin, TX and Boise, ID.
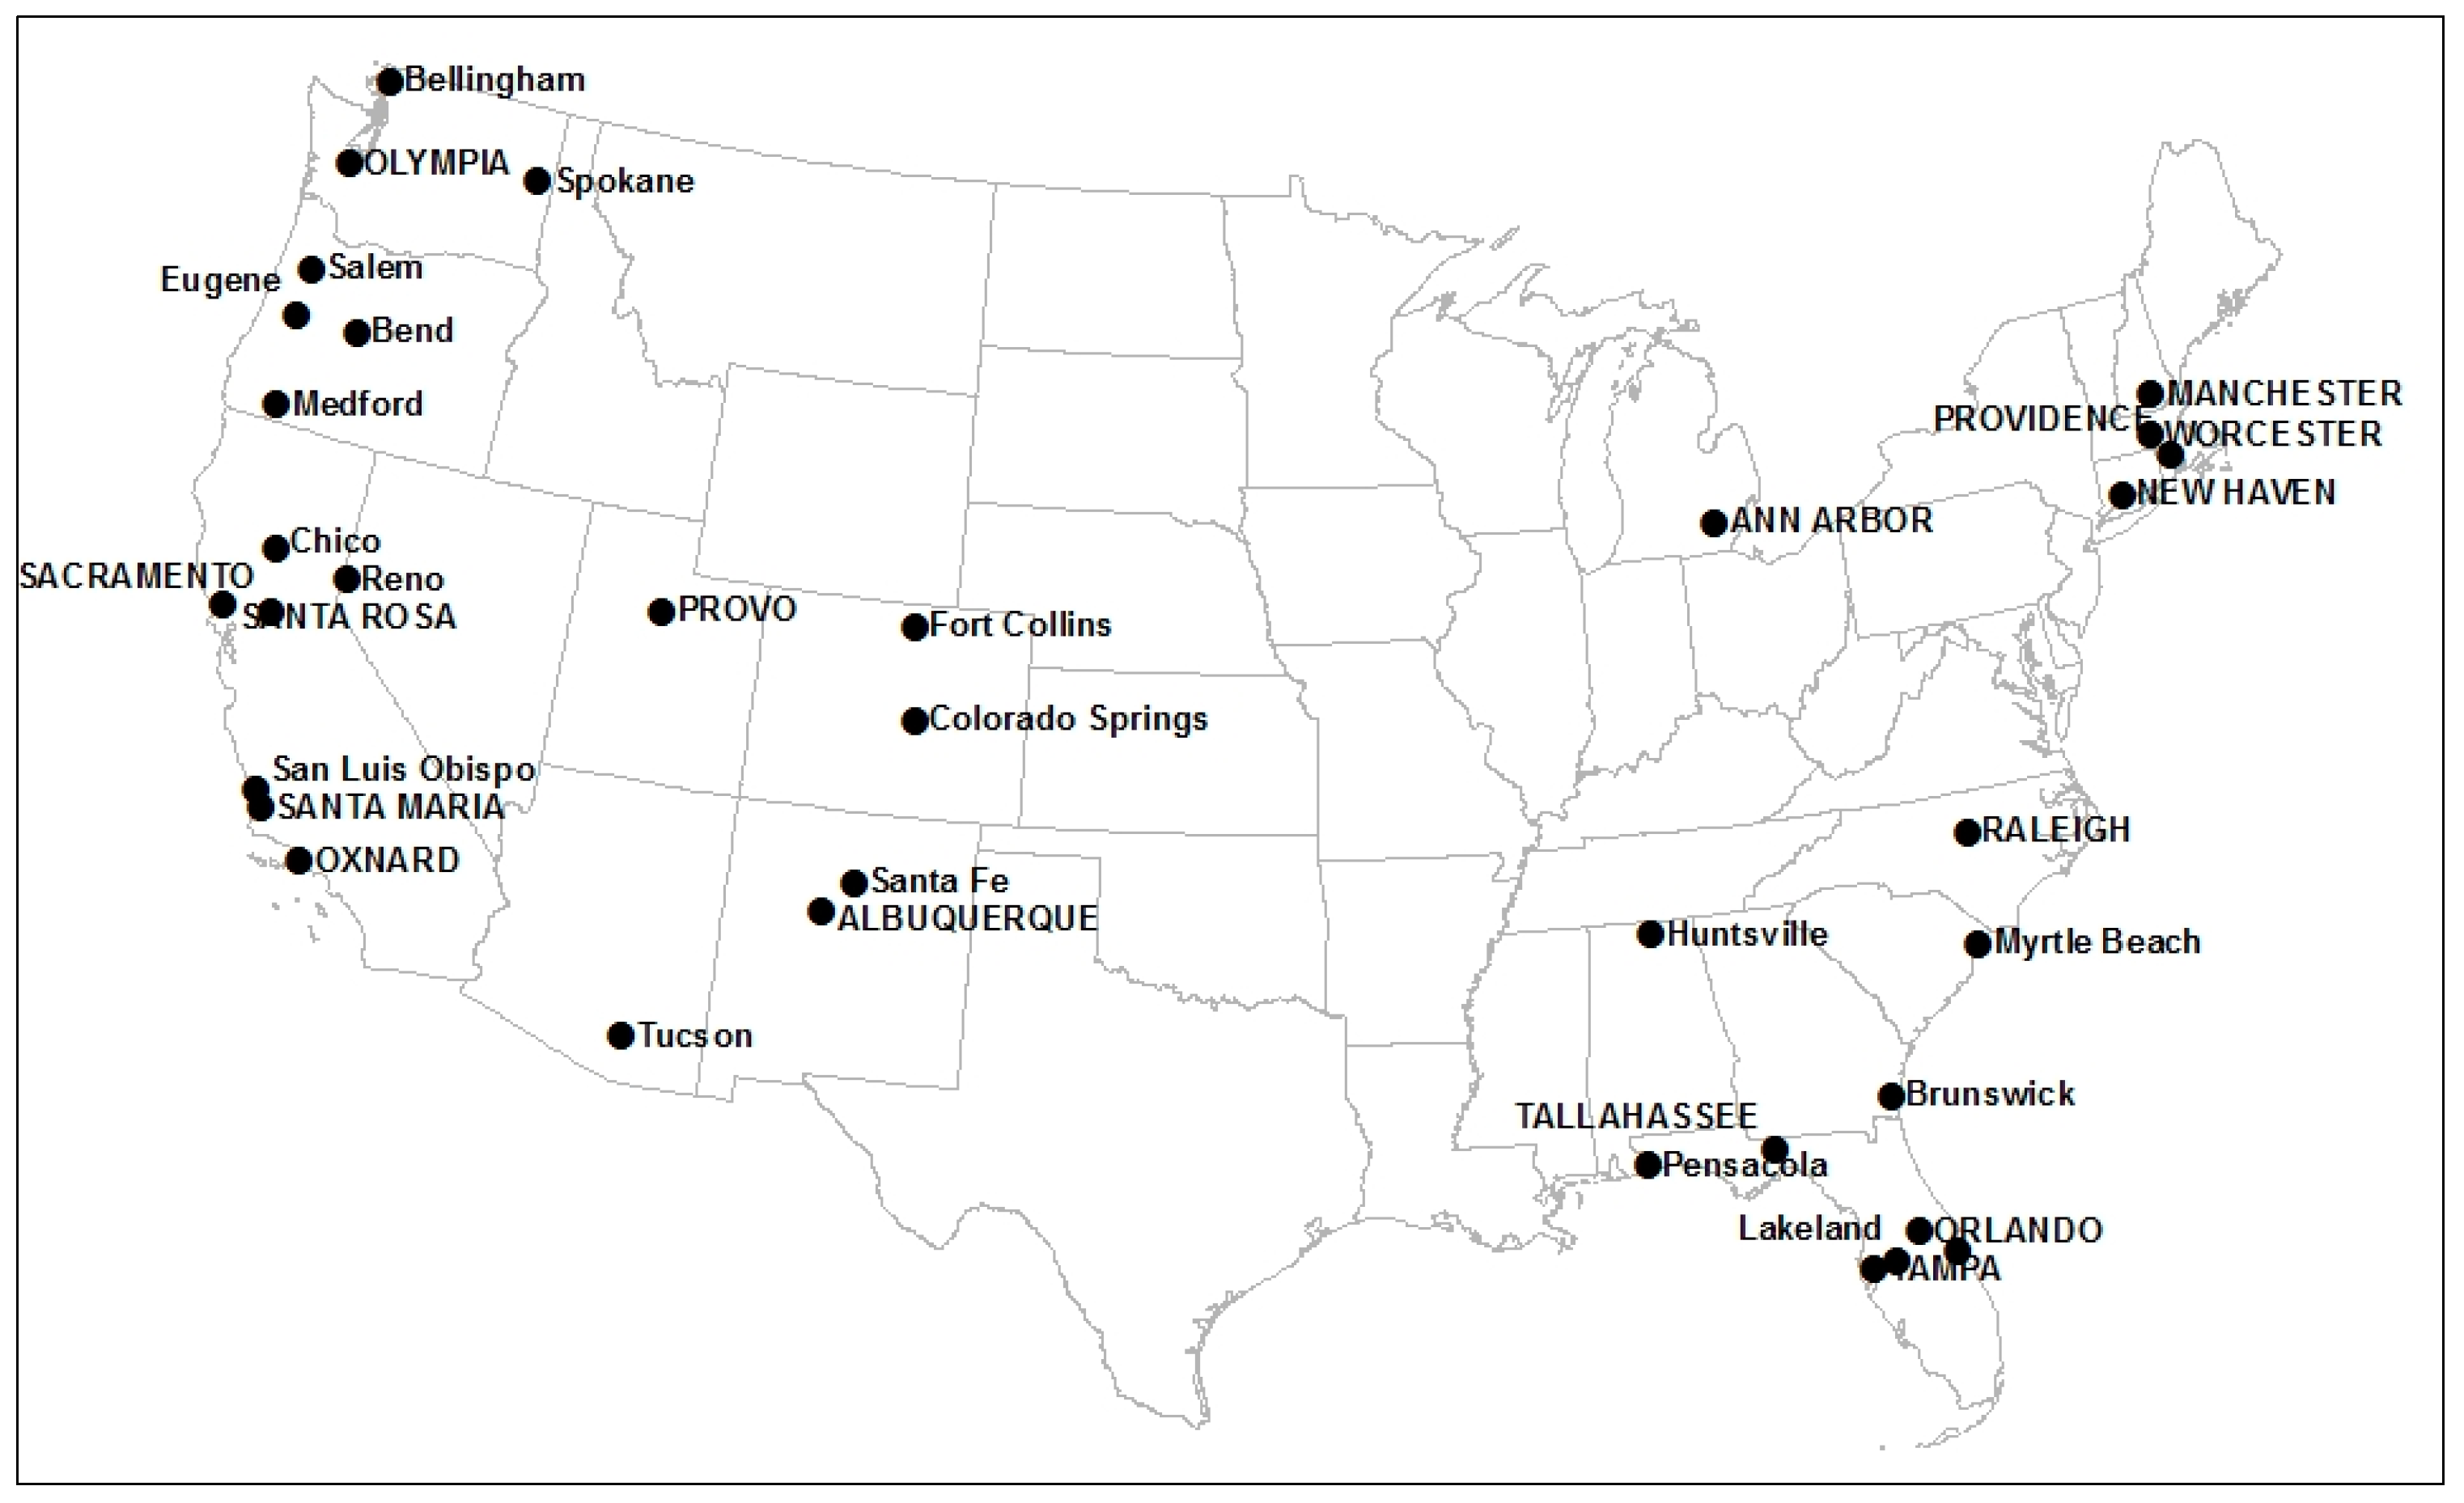
Type 5 is comprised of 35 metropolitan areas that exhibit superior talent and innovation activity in Factor 1 (0.94) and high levels of entrepreneurial activity in Factor 9 (0.80), but suffer low per capita productivity (−0.63) and, according to Factor 3 (−0.37), have experienced some decline in those entrepreneurial levels. These places, whose average population size (670 K) is more than twice that of the cities in Type 4, are distributed approximately evenly between the Snowbelt and Sunbelt states (
Figure 2). As a general rule these mid-sized cities score very well on most metropolitan attributes, especially climate and ambience, so their housing costs are relatively high. The second-stage factor analysis distinguished between one group of 19 cities, having older workers, from a second group of 16 cities, having much younger workers. Here the cities in the second group scored much higher on per capita patent production and marginally higher on entrepreneurship than those in the first group. The Type 5.1 places include Tucson, AZ, Santa Fe, NM, and Fort Collins, CO, and the Type 5.2 places include Albuquerque, NM, Provo, UT, and Tampa, FL. As a whole these cities have more diversified economies than those of Type 4 but once again many metropolitan economies continue to be dominated by a major university or research institute.
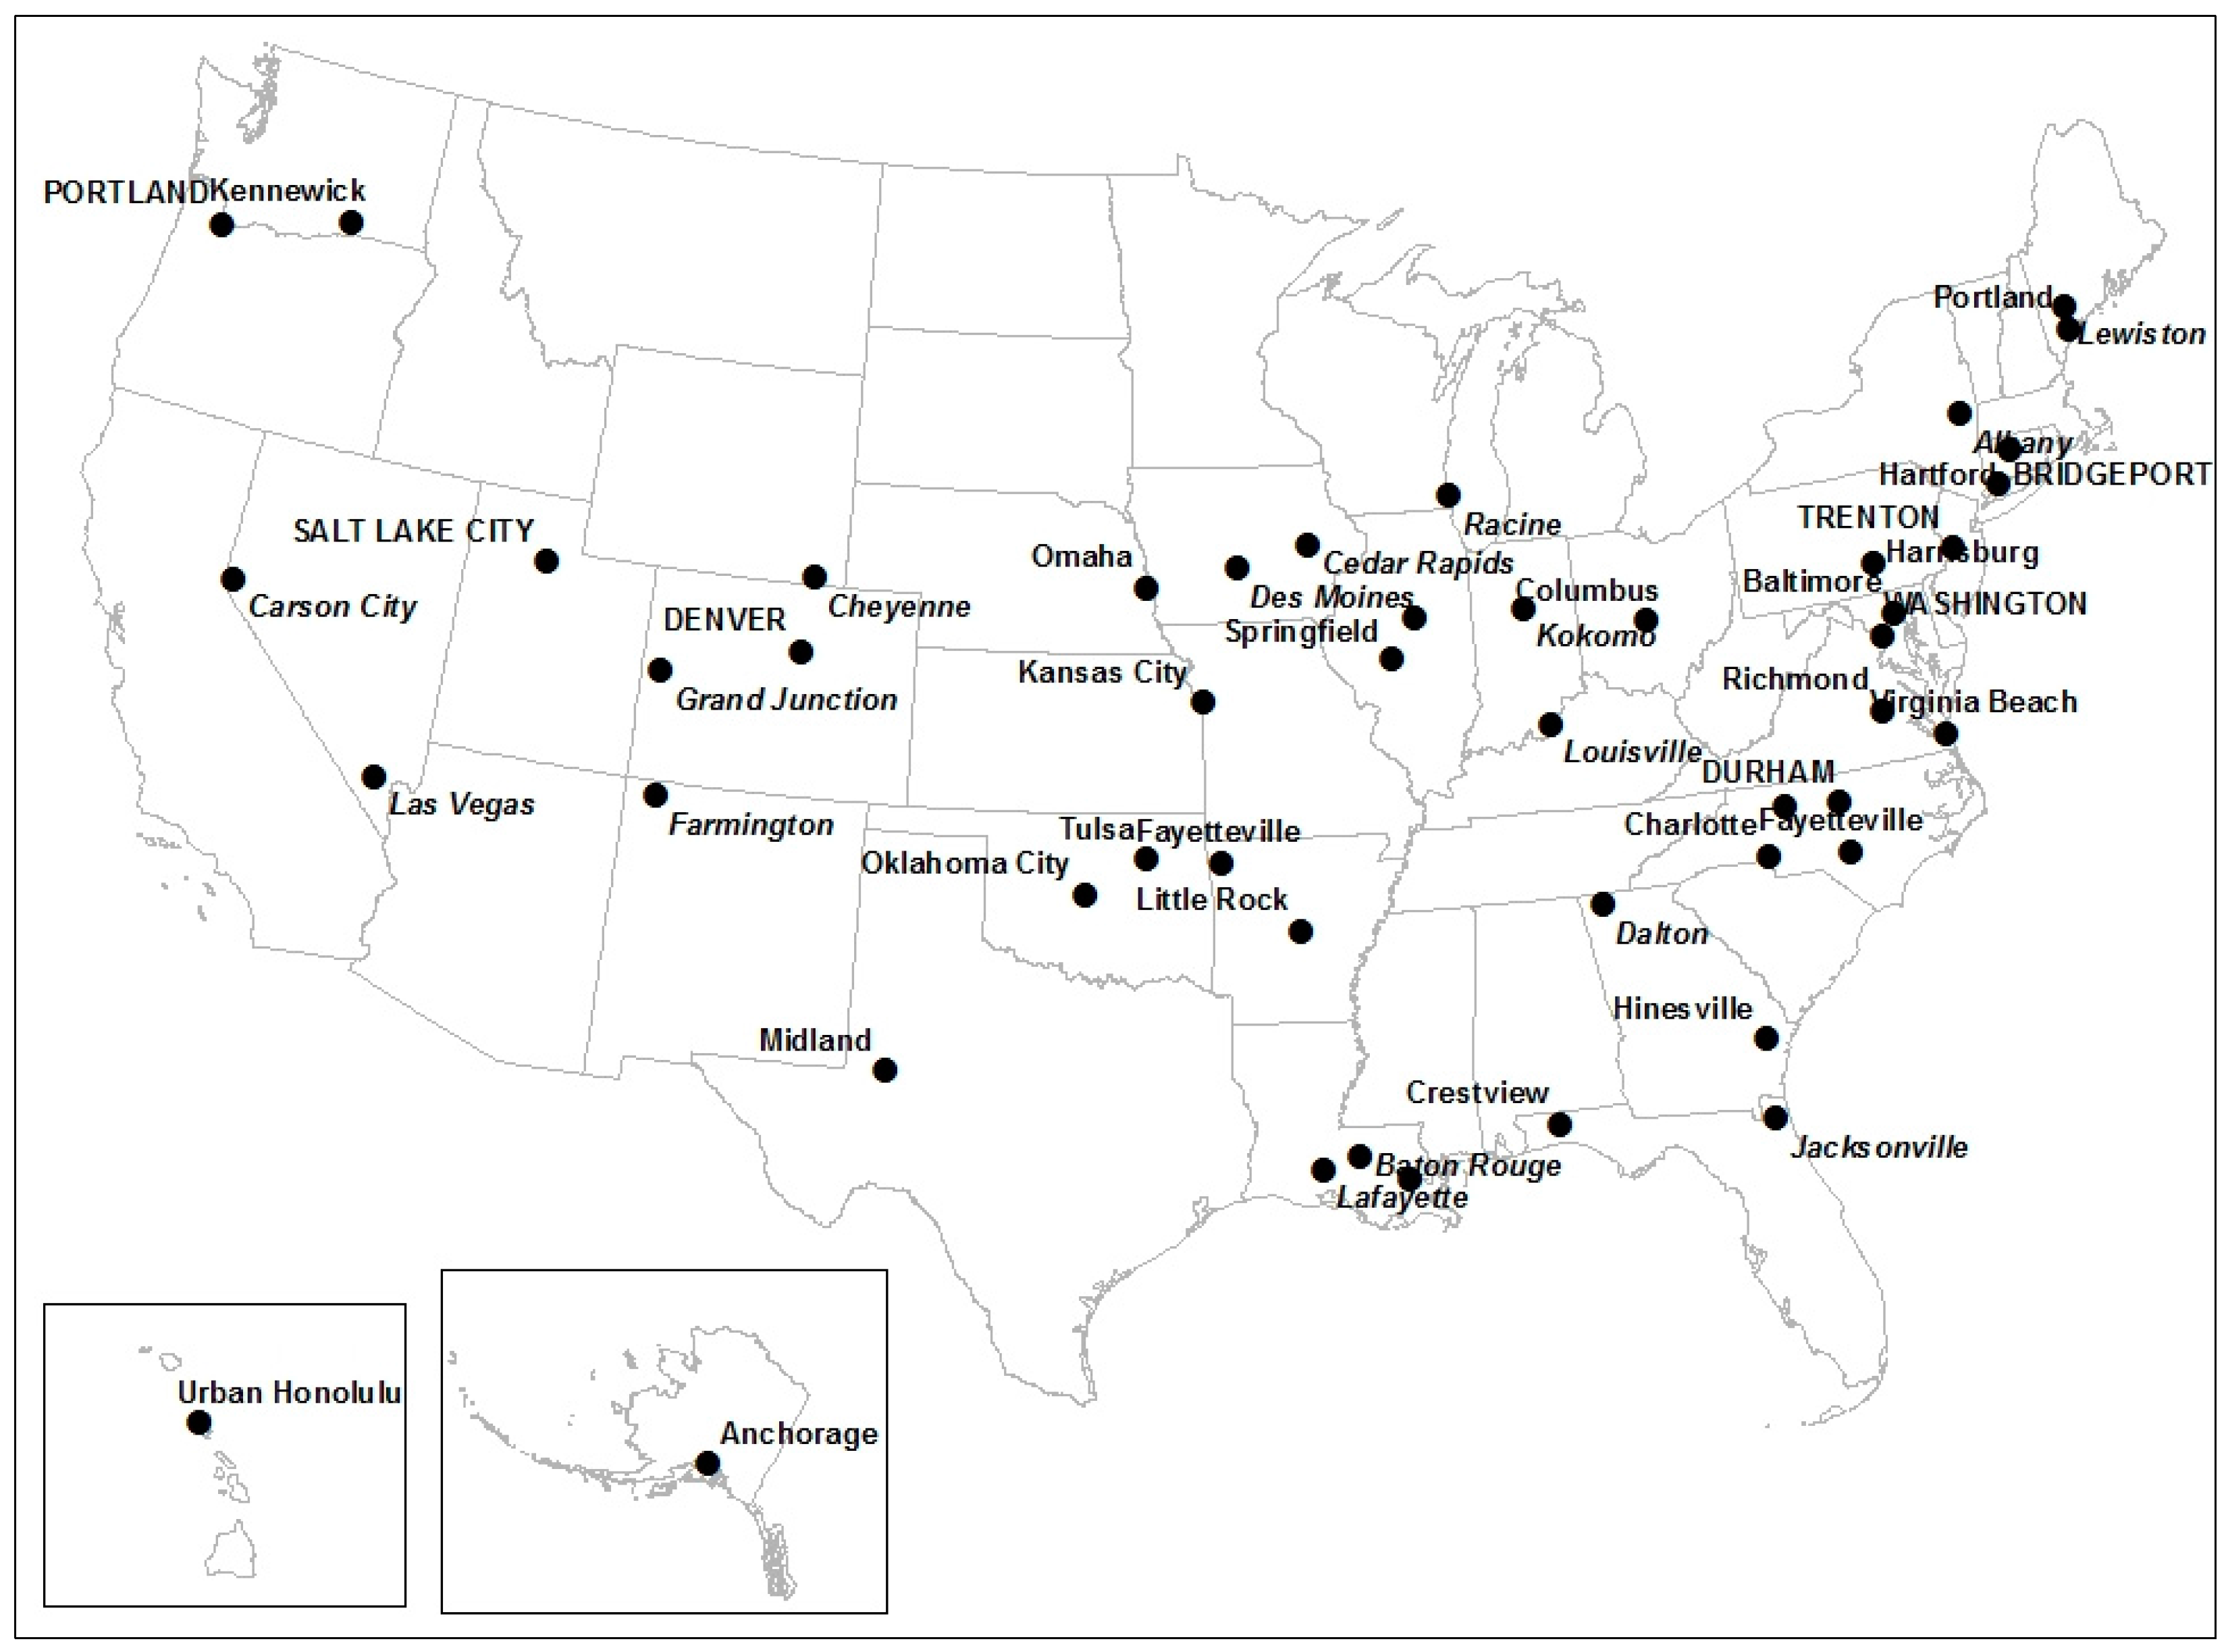
There are 48 Type 6 economies that score moderately high on Factor 1 (0.21), somewhat higher on Factors 3 (0.64) and 5 (0.66), and very high on Factor 10 (1.15). These cities are generally quite large (average 931 K); they enjoy productive industries with high wages, contain a lot of human talent, and are ascending in entrepreneurship. Most (some 77%) of these cities are situated in the Snowbelt and, in general, these places rate highly on ambience, education, health, and transportation (
Figure 3). The second-stage factor analysis identified three different subtypes. Type 6.1 is comprised of 16 places having older workers that are slightly more productive in both entrepreneurship and patents than the 25 places allocated to Type 6.2. The remaining 7 Type 6.3 cities have much younger workforces that are nearly twice as productive as the other 41 cities in both entrepreneurship and patents. The Type 6.1 cities include Cheyenne WY and Las Vegas NV, the Type 6.2 cities include Baltimore, MD and Kansas City, and the Type 6.3 cities include Denver, CO and Portland, OR.
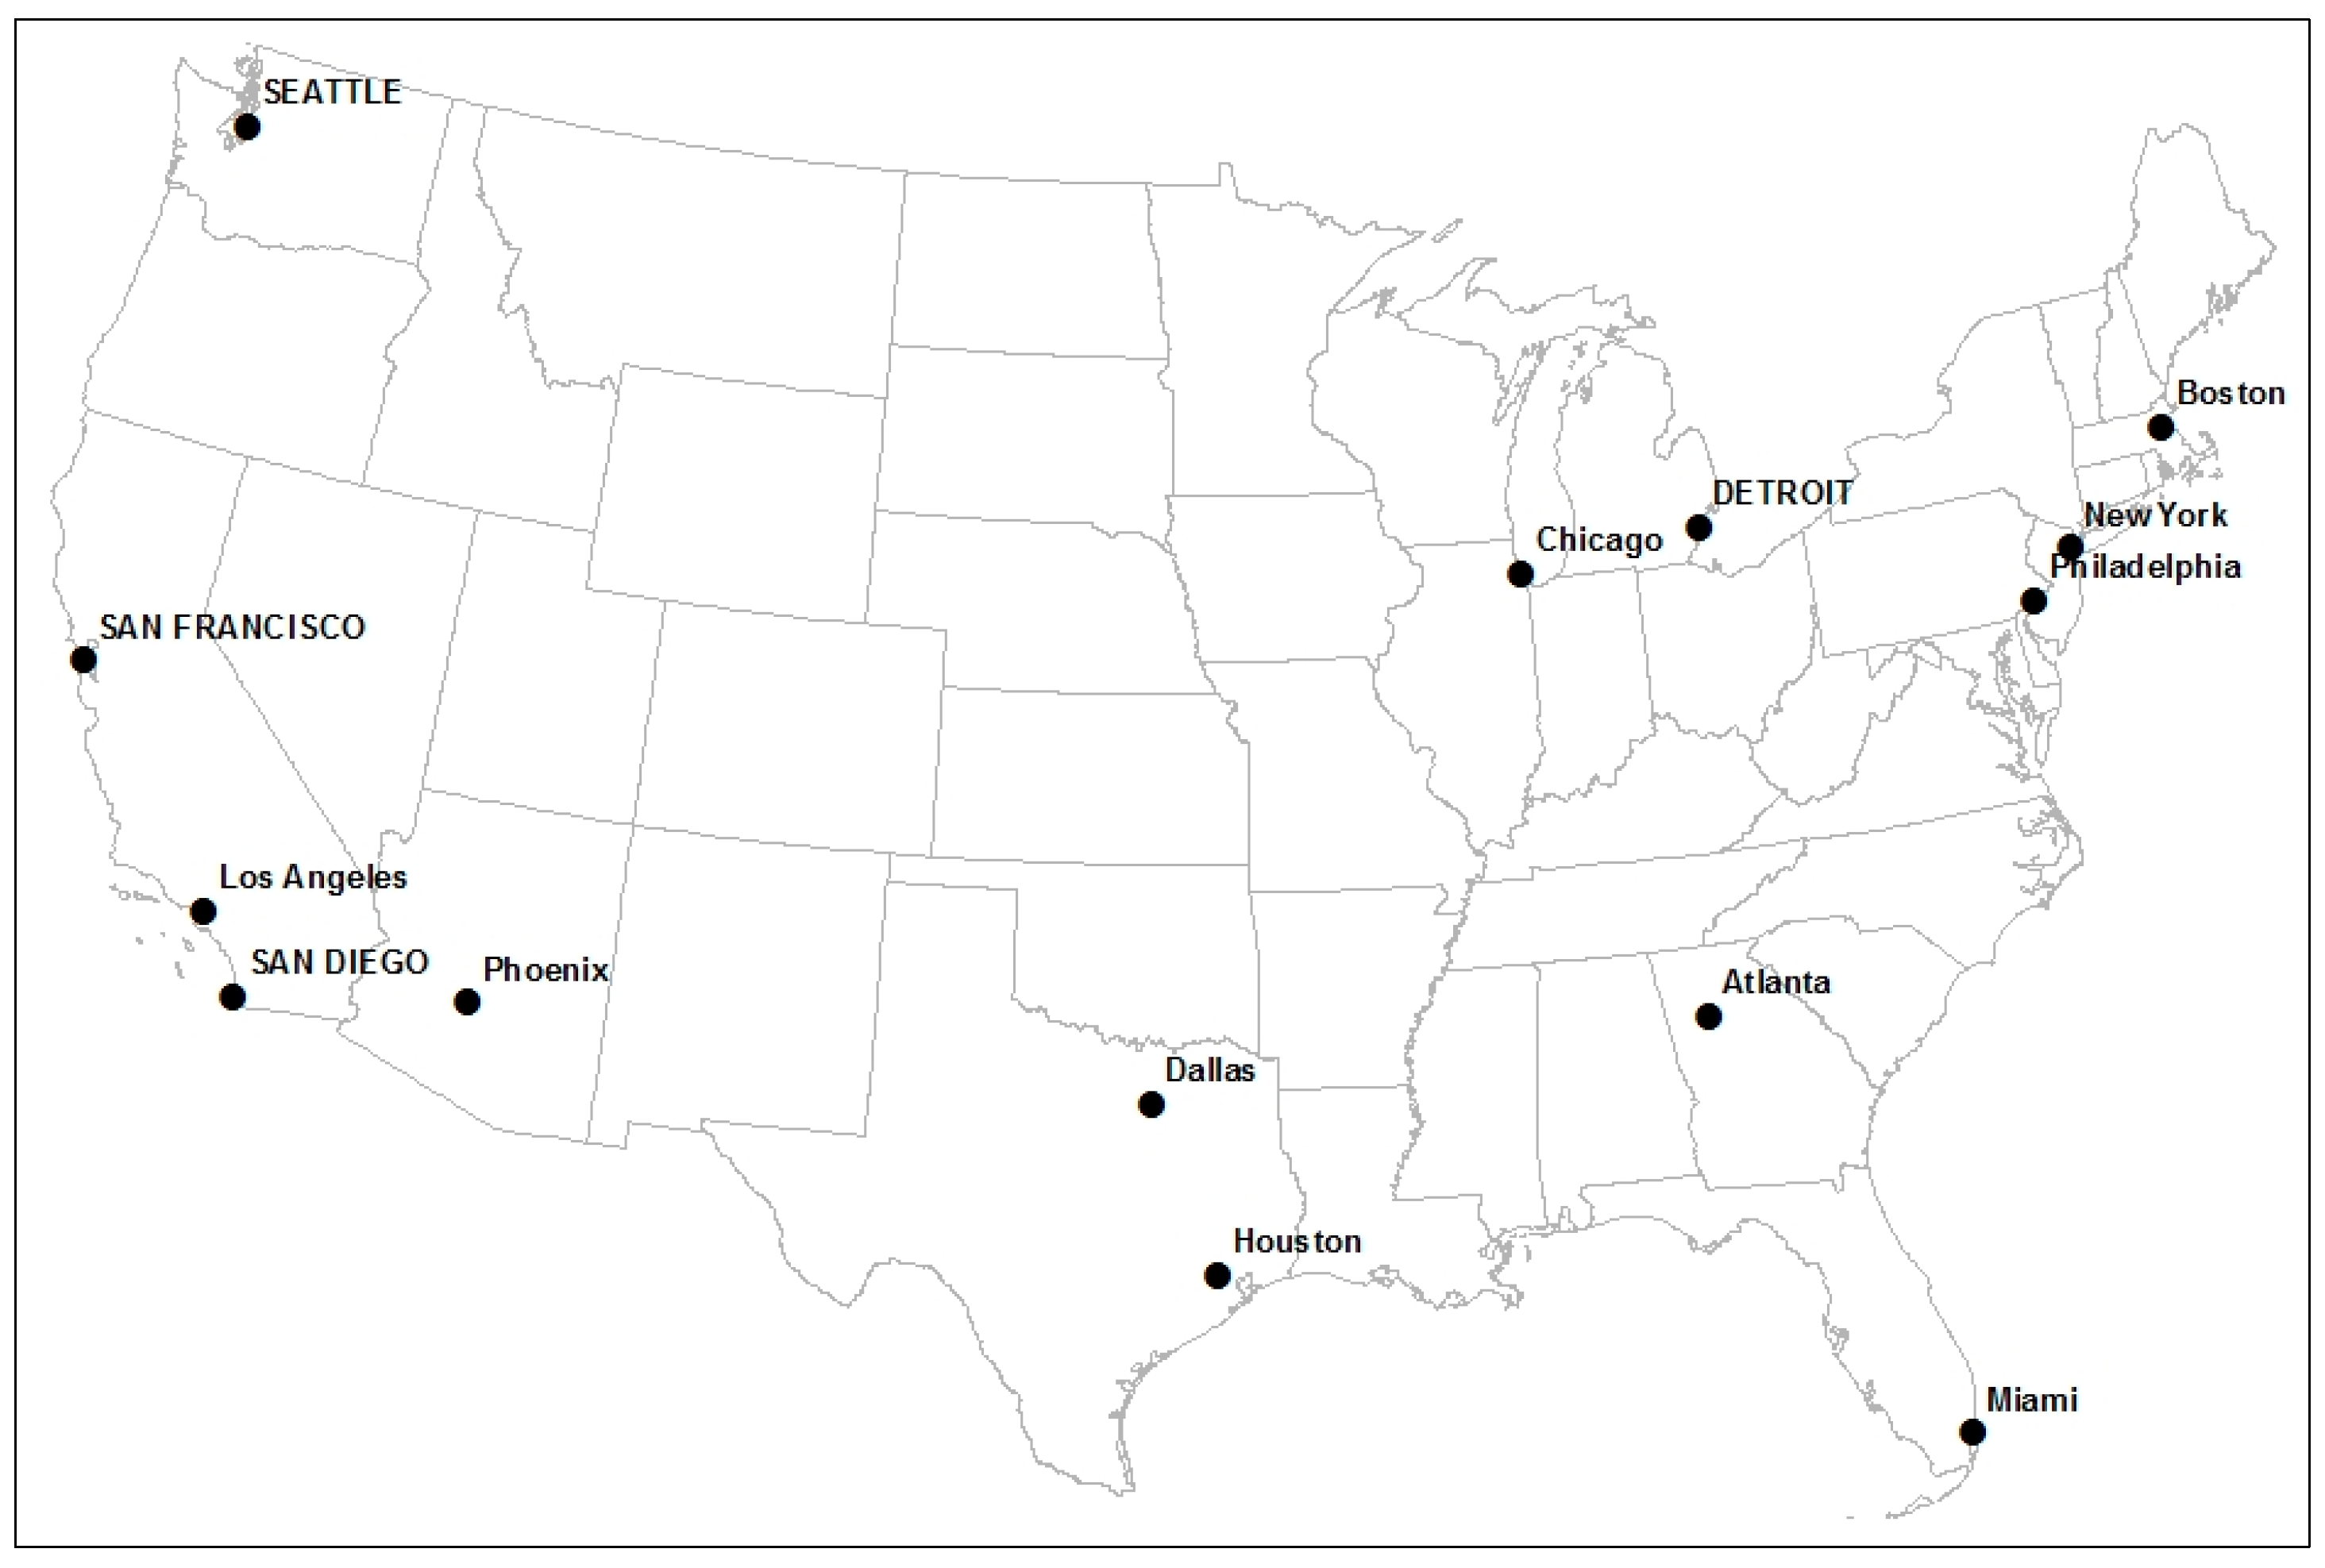
Fourteen metropolitan areas comprise the cluster of Type 7 economies. These cities are generally very large in population size (average 6795 K) and they are spread across the entire national landscape: 6 of these places are located in the Snowbelt and 8 in the Sunbelt (
Figure 4). On average these places score fairly strongly on Factors 1 (0.47), 6 (0.43), and 10 (0.34) but their most characteristic feature is a very high score on Factor 4 (3.72). These cities have very large pools of talented, educated workers and they perform strongly in both entrepreneurial activities and patent production. They generally score very high on all metropolitan attributes except for crime and housing costs (
Table 4). The second-stage factor analysis divides these large powerhouses into 10 Type 7.1 and 4 Type 7.2 economies. The second group has somewhat younger workers that are both more entrepreneurial and more productive in patents than workers in the first group. The Type 7.1 cities include New York, Chicago, IL, and Los Angeles, CA while the Type 7.2 cities include Seattle, San Diego, CA, and San Francisco. Both of the great Texan rivals, Dallas and Houston, are members of the first group. Detroit, MI is a member of the second group and this anomaly occurs because a remarkable amount of startup and patent activity takes place outside the limits of the city proper. Start-up activity in Detroit has been facilitated by the New Economy Initiative, a
$100 million fund that supports entrepreneurial ventures, particularly those that are women and minority owned. Since its inception in 2007 the fund has helped start 1600 companies that have created 17,000 jobs in and around Detroit [
69].
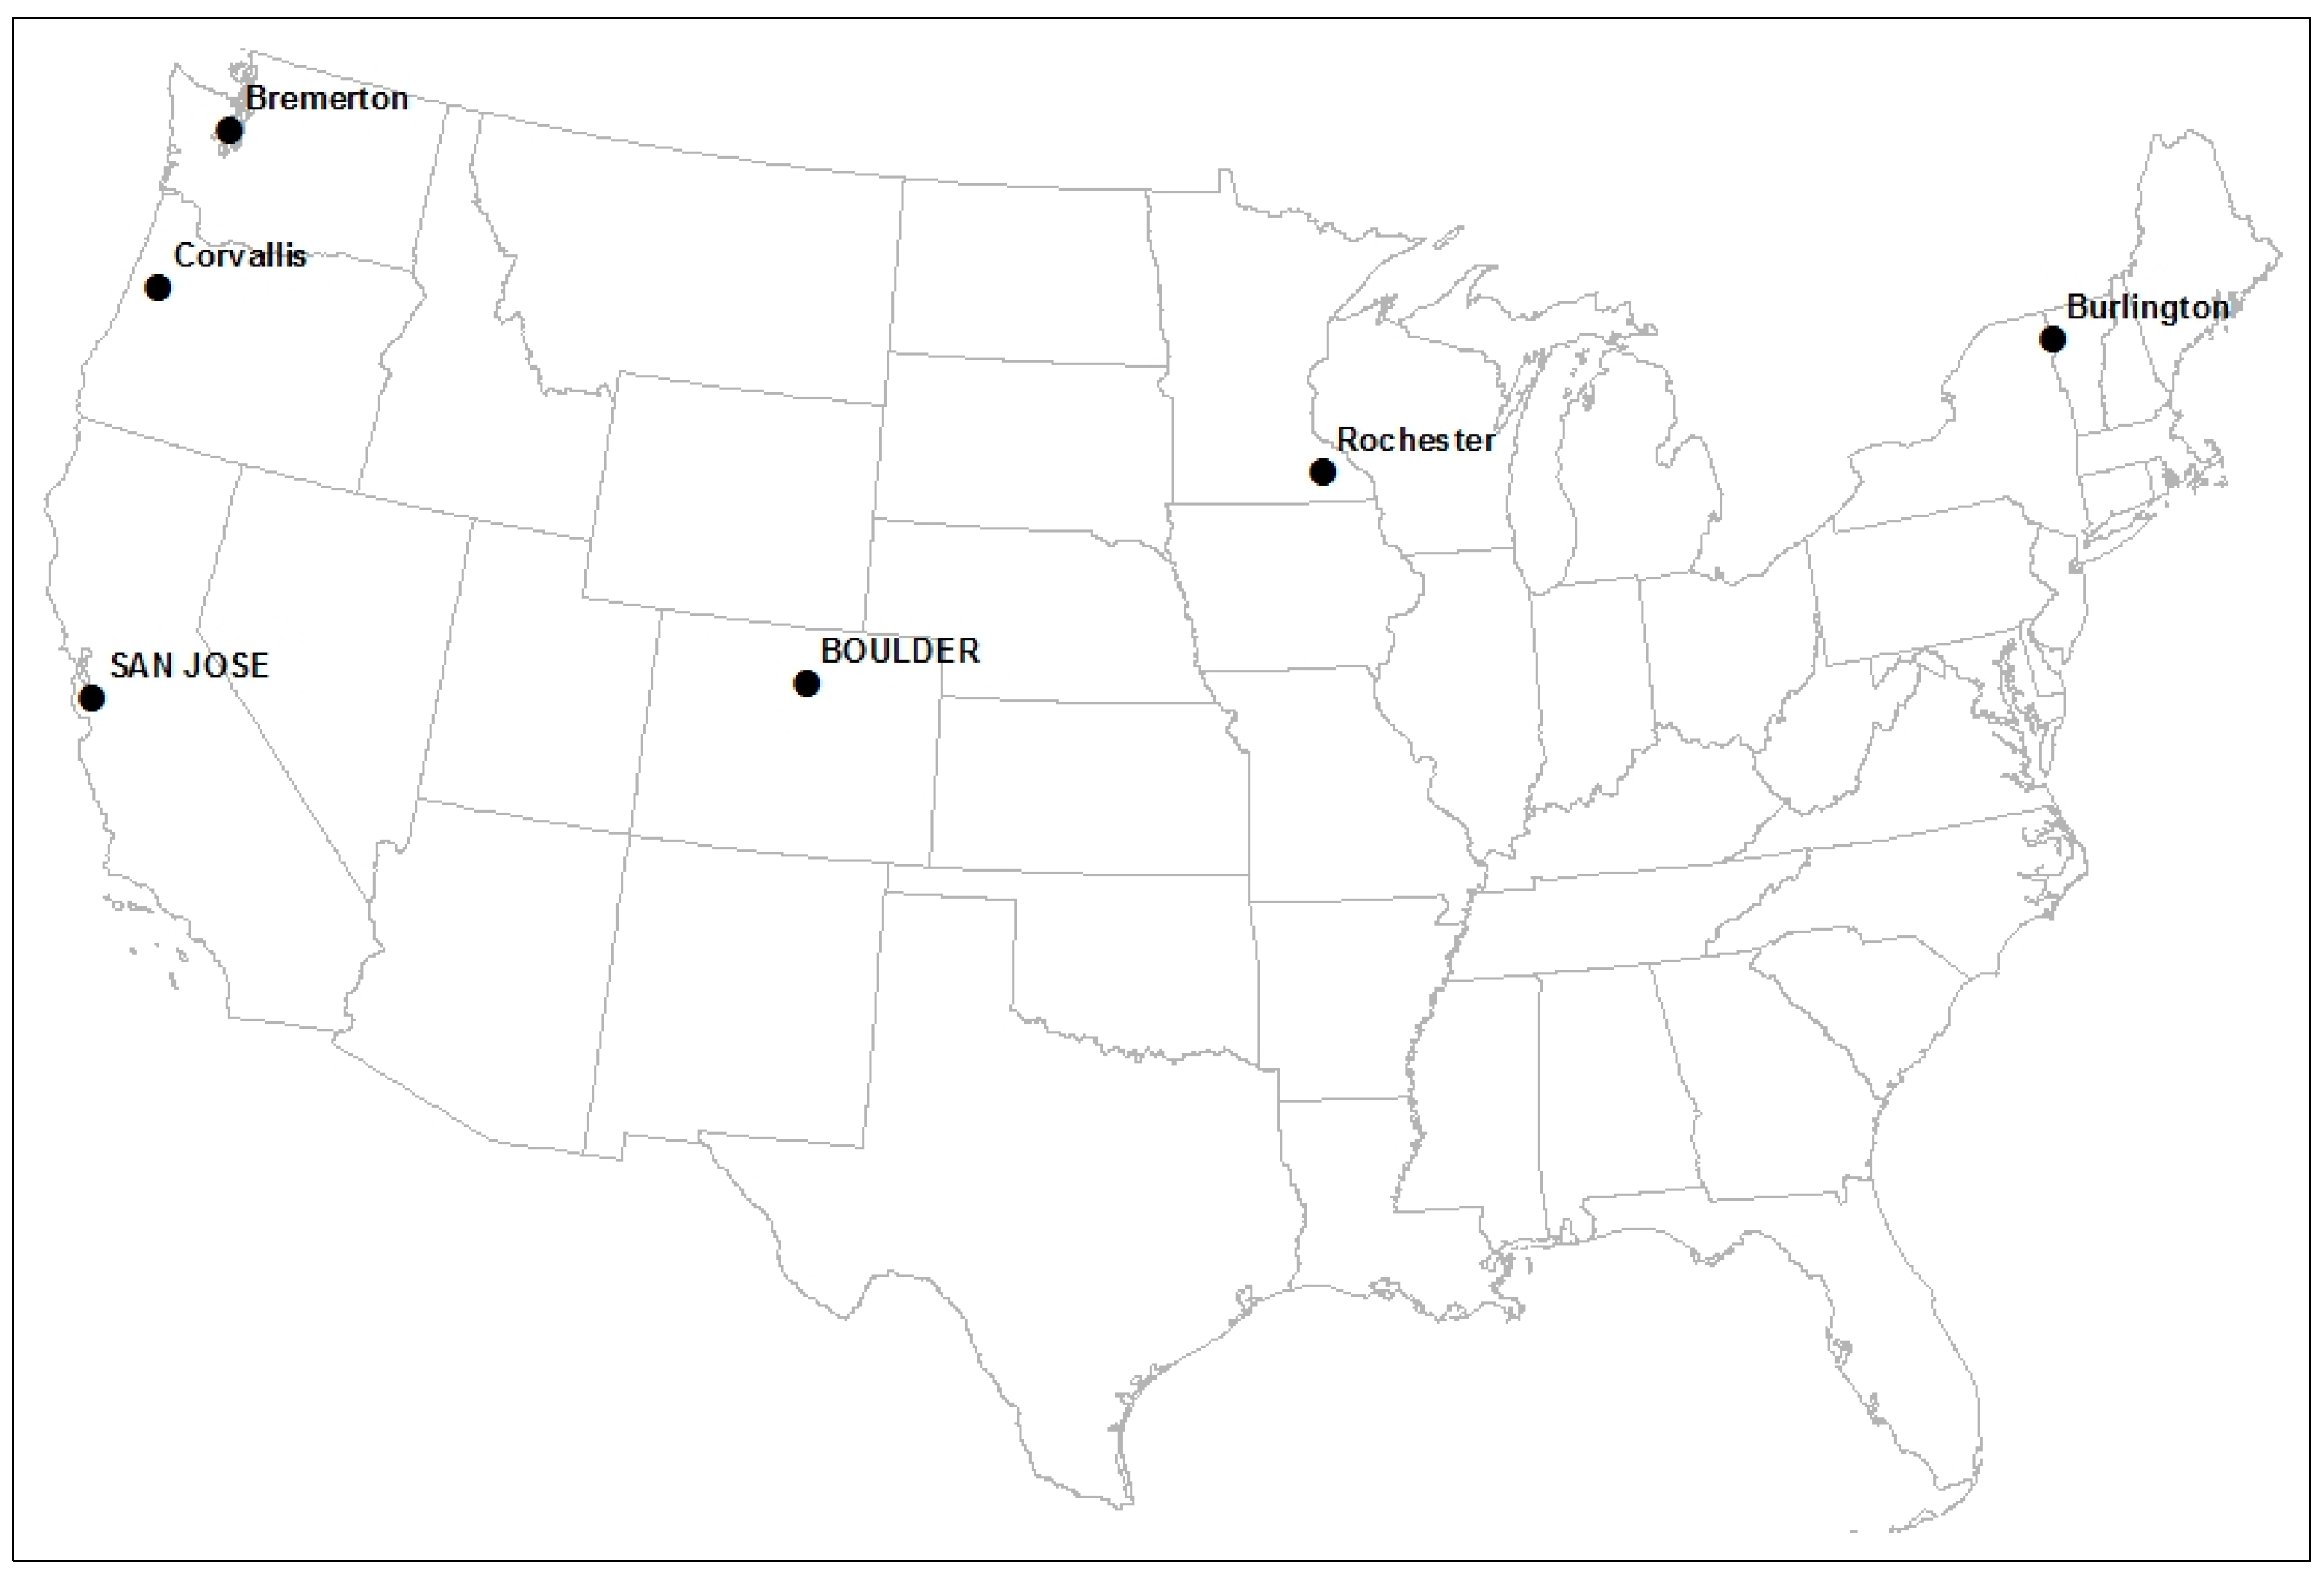
Finally, the Type 8 cities include the nation’s most successful metropolitan economies in both innovation and entrepreneurship. These 6 places have a moderate population size (average 482 K) and exhibit modest positive scores on several of the underlying factors; however, remarkable average scores are seen for Factor 2 (5.12) and Factor 7 (2.83). Therefore, these places not only exhibit high amounts of patent production and entrepreneurship but their activities are expanding in both spheres of innovative activity. Not surprisingly, all 6 of these metropolitan economies are seen on the top-35 list shown in
Table 2. Here the second-stage analysis separated out the two high-fliers—Boulder and San Jose (Type 8.2)—from the remaining group of 4 cities comprised of Bremerton, WA, Burlington, VT, Corvallis, OR, and Rochester, MN (Type 8.1). This happens because Boulder has very high scores on both F2 and F9 and San Jose has an extremely high score on F2 (but negative on F9), indicating that both patents and entrepreneurship are of great importance to both economies. These 8 highly productive cities are found mostly in the nation’s western states (
Figure 5) and they enjoy high scores in education, crime, and climate (
Table 4). The Type 8 places are much smaller than those in Type 7 so housing costs are lower and many big-city amenities in the areas of recreation and health are missing.
