Article

Formation of Fe Nanoparticles by Ion Implantation Technique for Catalytic Graphitization of a Phenolic Resin

Department of Advanced Functional Materials Research, National Institutes for Quantum and Radiological Science and Technology (QST), Takasaki 370-1292, Japan
*
Author to whom correspondence should be addressed.
Quantum Beam Sci. 2020, 4(1), 11; https://doi.org/10.3390/qubs4010011
Submission received: 27 December 2019 / Revised: 20 January 2020 / Accepted: 1 February 2020 / Published: 12 February 2020
(This article belongs to the Special Issue Quantum Beams Applying to Innovative Industrial Materials)

Abstract

:
Ion implantation technique was employed to introduce iron nanoparticles (Fe NPs) into a carbon precursor polymer with the aim of forming of a graphitic nanostructure through catalytic graphitization by the introduced Fe NPs. A phenolic resin was implanted by 100 keV Fe+ ions with ion fluence of 1 × 10¹⁴–1 × 10¹⁶ ions/cm2 at ambient temperature under vacuum, and subsequently heat-treated at 800 °C in a nitrogen gas atmosphere. It was found that the particle size of Fe NPs could be controlled in the range of 5–30 nm by the Fe+ ion fluence. Additionally, it was found that a nanosized turbostratic graphite structure with mean interlayer distance of 0.3531 nm, which is consisted of shell-like carbon layers and intricately distorted carbon layers, was formed around the Fe NPs. The ion implantation technique is one of the advantageous ways to introduce size-controlled fine metal NPs which are effective for the formation of graphitic nanostructure from a carbon precursor polymer.

1. Introduction

Carbon materials, which have excellent strength, electric conductivity, chemical stability, heat resistance, and so on, have been used in many industrial fields; they are used as carbon fiber reinforced plastics for sports, automobiles, and aircrafts, and as electrodes and catalyst supports for fuel cells and batteries. Furthermore, the carbon materials recently have been extensively studied as platinum-alternative catalysts since J. Ozaki et al. reported that the carbon materials containing nitrogen (N-doped carbon) exhibited a catalytic activity for an oxygen reduction reaction (ORR; O2 + 4H+ + 4e → 2H2O) which is comparable to that in platinum-catalysts [1]. The origin of the catalytic activity for the ORR has been studied and reported as follows [2,3,4,5,6,7]:
(1)
The formation of a graphitic nanostructure such as shell-like structure consisted of warped graphene layers, and/or a turbostratic graphite structure consisting of the hexagonal carbon layers piled up randomly or uniformly in a part;
(2)
Incorporation of nitrogen atoms into the graphitic structure as pyridinic nitrogen and/or quaternary nitrogen.
The N-doped carbon catalysts are often synthesized from various carbon precursor polymers such as furan resins, phenolic resins, cyanate ester resins, polyimides, and so on [1,3,8,9]. In most cases, transition metal compounds of Fe, Co, and Ni are added to the carbon precursor polymers in order to synthesize the N-doped carbon catalysts at relatively low temperature range of 800–1000 °C. The added metal compounds produce metal nanoparticles (NPs) during the heat treatment, and the NPs play the role of a catalyst for the formation of the graphitic nanostructure. Such an effect is referred as “catalytic graphitization” [10,11,12,13,14,15,16]; carbon atoms are dissolved and precipitated through the melt metal NPs to form the graphitic structure during the heat treatment. In the catalytic graphitization process, the obtained graphitic structure depends on the size of metal NPs: the turbostratic graphite structure is obtained in the case of the particle size of around 20 nm, and graphite structure, above several tens nm. However, the particle size distribution after the carbonization in the reports is ranging from 20 to several tens nm in most cases. This suggests that the ORR-inactive graphite structure is preferred to form than the ORR-active turbostratic graphite structure. In order to form the turbostratic graphite structure in high efficiency, it is considered to be useful to control the particle size below 20 nm.
Here, we propose metal ion implantation into a carbon precursor polymer as a method to introduce metal NPs with controlling the particle size below 20 nm. Since the ion implantation technique is based on a bottom-up process, and has high selectivity of ion species and high controllability of accelerating energy (depth) and ion fluence (concentration), it is expected to be advantageous for the formation of size-controlled metal NPs. So far, many reports about the introduction of metal NPs into polymeric materials have been published [17,18,19,20,21]. In many cases, the aim of the introduction of metal NPs is to fabricate functionalized nanocomposites of polyimide (PI), poly(methyl methacrylate) (PMMA), poly(ethylene terephthalate) (PET), poly(ether ether ketone) (PEEK), and so on: Au, Ag, and Cu NPs for the functionalization of optical plasmon resonance, transition metal NPs, superparamagnetic and ferromagnetic properties. The size of metal NPs ranges from a several nanometers to several tens of nanometers with the ion fluence of 1 × 10¹⁶–1 × 10¹⁷ ions/cm2 in many reports. In these cases, high ion fluence above 1 × 10¹⁶ ions/cm2 is necessary in order to form the metal NPs directly in the polymers [17,18,19,20,21]. On the other hand, we examined a process in which metal ions are implanted with relatively low ion fluence into a polymer, and then, the implanted polymer is heat-treated at 800 °C to form metal NPs and a graphitic nanostructure simultaneously. The concept of our process is the following:
(1)
Crosslinking of the carbon precursor polymer due to high energy deposition;
(2)
Reduction reaction of metal ions (M+) with secondary electrons (e) generated in the carbon precursor polymer (M+ + e → M);
(3)
Formation of metal NPs during the heat treatment after the implantation;
(4)
Catalytic graphitization of the carbon precursor polymer by the formed metal NPs;
In this work, a phenolic resin, a carbon precursor polymer, was implanted by 100 keV Fe+ ions and carbonized by heat treatment at 800 °C. The formation of Fe NPs and carbonization of implanted phenolic resin were investigated.

2. Materials and Methods

2.1. Materials and Ion Implantation

A novolac-type phenolic resin (PhR; PSK-2320, GUN EI Chemical Industry, Gunma, Japan) was used as a carbon precursor polymer. The chemical formula and density of the PhR is (C6H5(OH)CH)n and 1.302 g/cm3, respectively. A methanol solution of the PhR was bar-coated on a silicon wafer and dried to obtain a film with thickness of about 5 µm. The PhR film was implanted by Fe+ ions at ambient temperature (between room temperature and 50 °C, not controlled) under vacuum with implantation conditions of 100 keV, 2 µA/cm2, 1.5 × 1.5 cm2, and 1 × 10¹⁴–1 × 10¹⁶ ions/cm2 for accelerating voltage, beam current density, implantation area, and ion fluence, respectively. After implantation, the PhR film/silicon wafer was immersed in methanol in order to exfoliate the implanted part by removing the non-implanted part. The exfoliated sample was heat-treated at 800 °C for 1h in a nitrogen gas atmosphere.
As a reference sample, a blend of PhR and FeCl3 was prepared by means of mixing of solution and subsequent drying. The amount of FeCl3 was controlled to obtain the concentration of 0.35 and 2.1 wt% as Fe. The obtained blends were heat-treated similarly to the ion implanted sample.

2.2. Measurements and Analyses

Fourier transform infrared (FT-IR) spectra were measured by the KBr method (Shimadzu, IRAffinity-1S, Kyoto, Japan). Thermogravimetric analyses (TGA) were conducted from room temperature to 800 °C under helium gas flow with heating rate of 5 °C/min (Rigaku, Thermo plus TG8120, Tokyo, Japan). For transmission electron microscopic (TEM) observation, the samples were ground in an agate mortar, and then ethanol was added to the mortar [22]. The suspension was dropped on a TEM grid and dried for the TEM observation (JEOL, JEM-2100F, accelerating voltage of 200 keV, Tokyo, Japan). In order to observe the cross section of sample, the sample was embedded in an epoxy resin and sliced by an ion milling machine with 6 and 3 keV Ar+ ions (JEOL, CRYO ION SLICER IB-09060CIS). The distribution of Fe atoms in the sample was investigated by combination of scanning transmission electron microscope (STEM) and energy dispersive X-ray spectroscopy (EDS) (JEOL, JED-2300T). The particle size was measured from the TEM images. The particle was approximately represented as an oval shape, and the lengths in long side and short side were measured and averaged. The measurements were conducted for at least 50 particles. The interlayer distance of carbon layers was also measured by using Digital Micrograph software (GATAN, Inc., Pleasanton, CA, USA). The scale was calibrated by the lattice spacing of Au (100). The measurements were conducted at least 15 different points and the obtained values were averaged. Raman spectra of the samples after heat treatment at 800 °C were measured by micro-Raman spectrometer (Horiba, LabRAM HR Evolution, Kyoto, Japan) using Nd:YVO4 laser (Showa Optronics, JMC-17, Tokyo, Japan), operating at 532 nm with power of 10 mW and spot size of about 2 µm. The spectra were recorded after calibration using a silicon wafer. The obtained Raman spectrum was fitted by Voigt function with setting five peaks, referring to a report by A. Sadezky et al. [23]: G-band (1584 cm−1; ideal graphitic lattice), D1-band (1340 cm−1; disordered graphitic lattice and/or graphene layer edges), D2-band (1620 cm−1; defects on surface graphene layer), D3-band (1500 cm−1; amorphous carbon phase), and D4-band (1200 cm−1; polyene (C-C, C=C) structure). The fitting was conducted for three spectra of each samples, and the results were averaged.

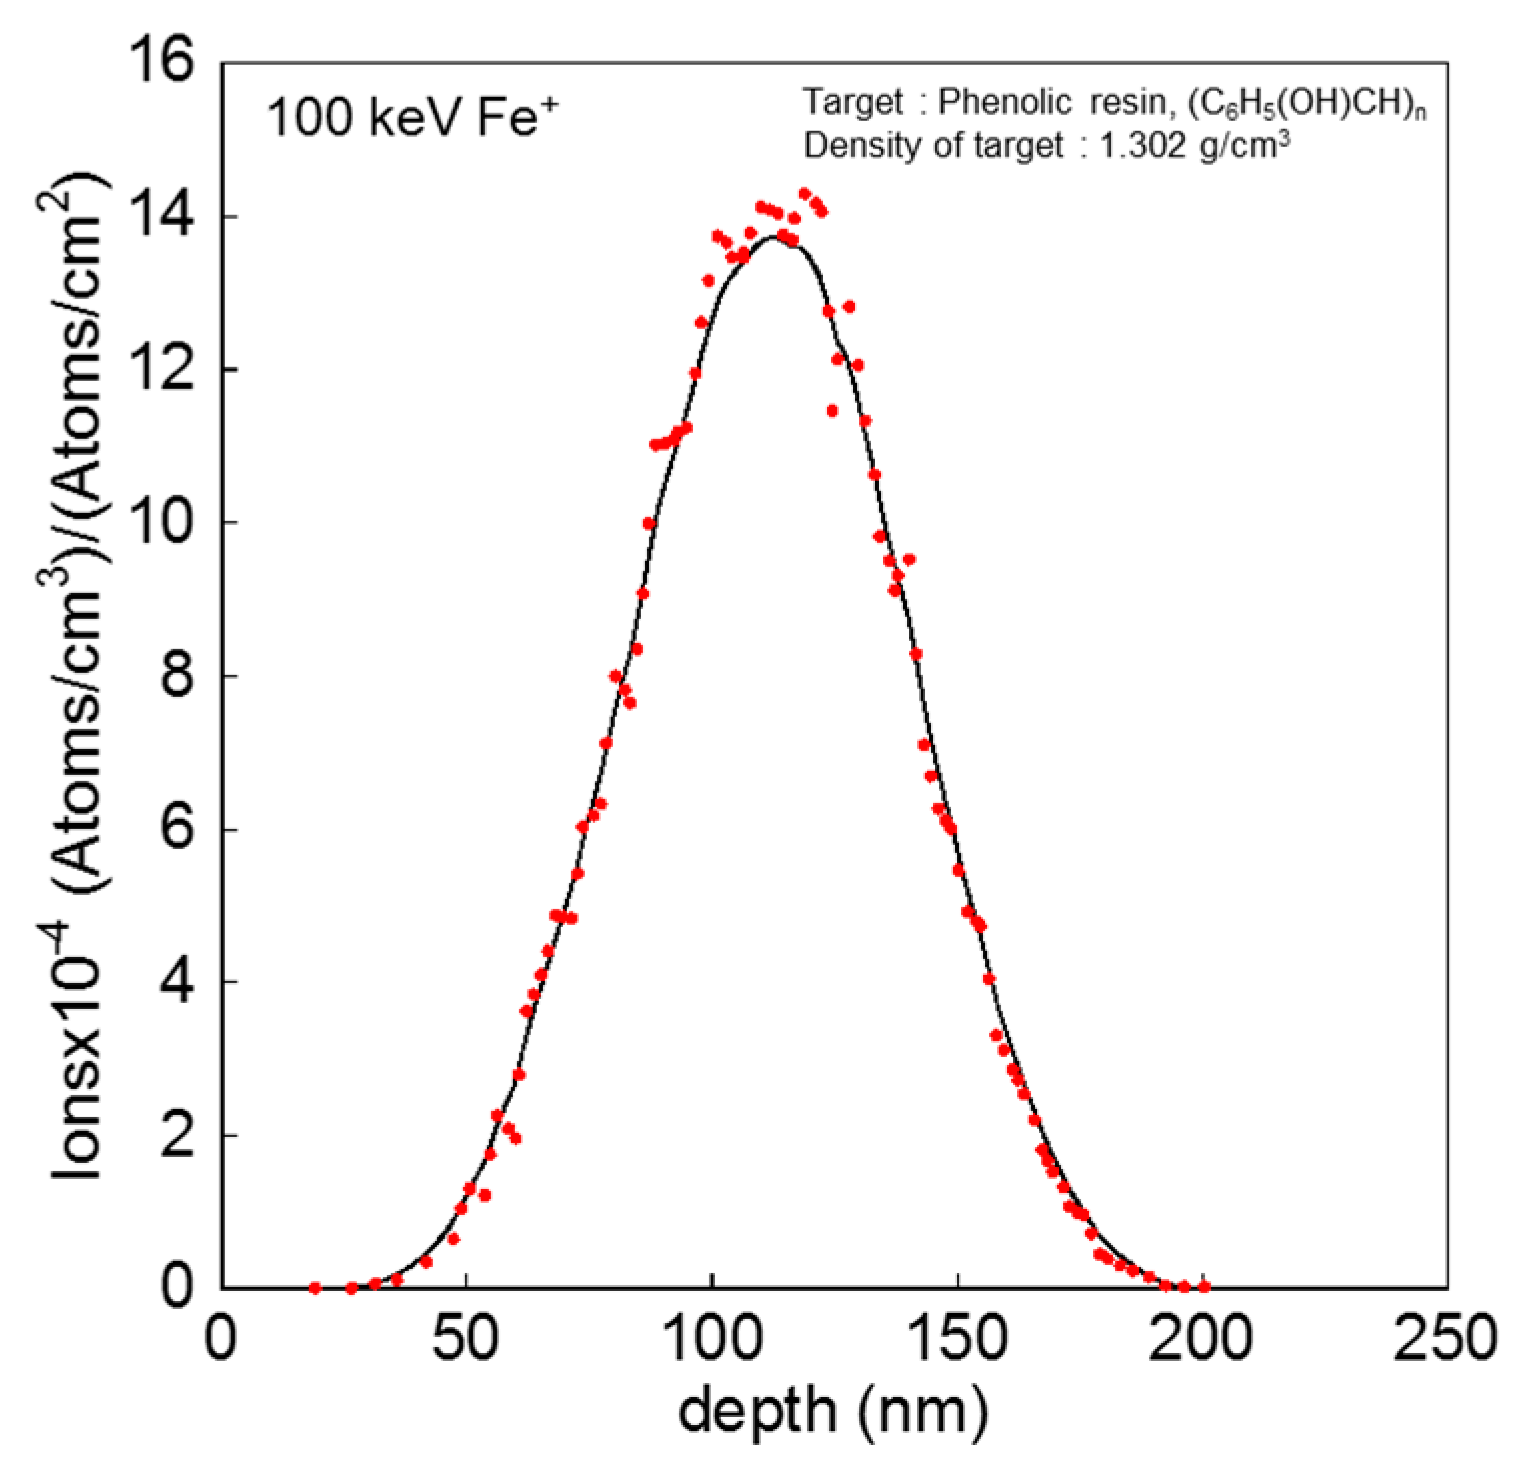
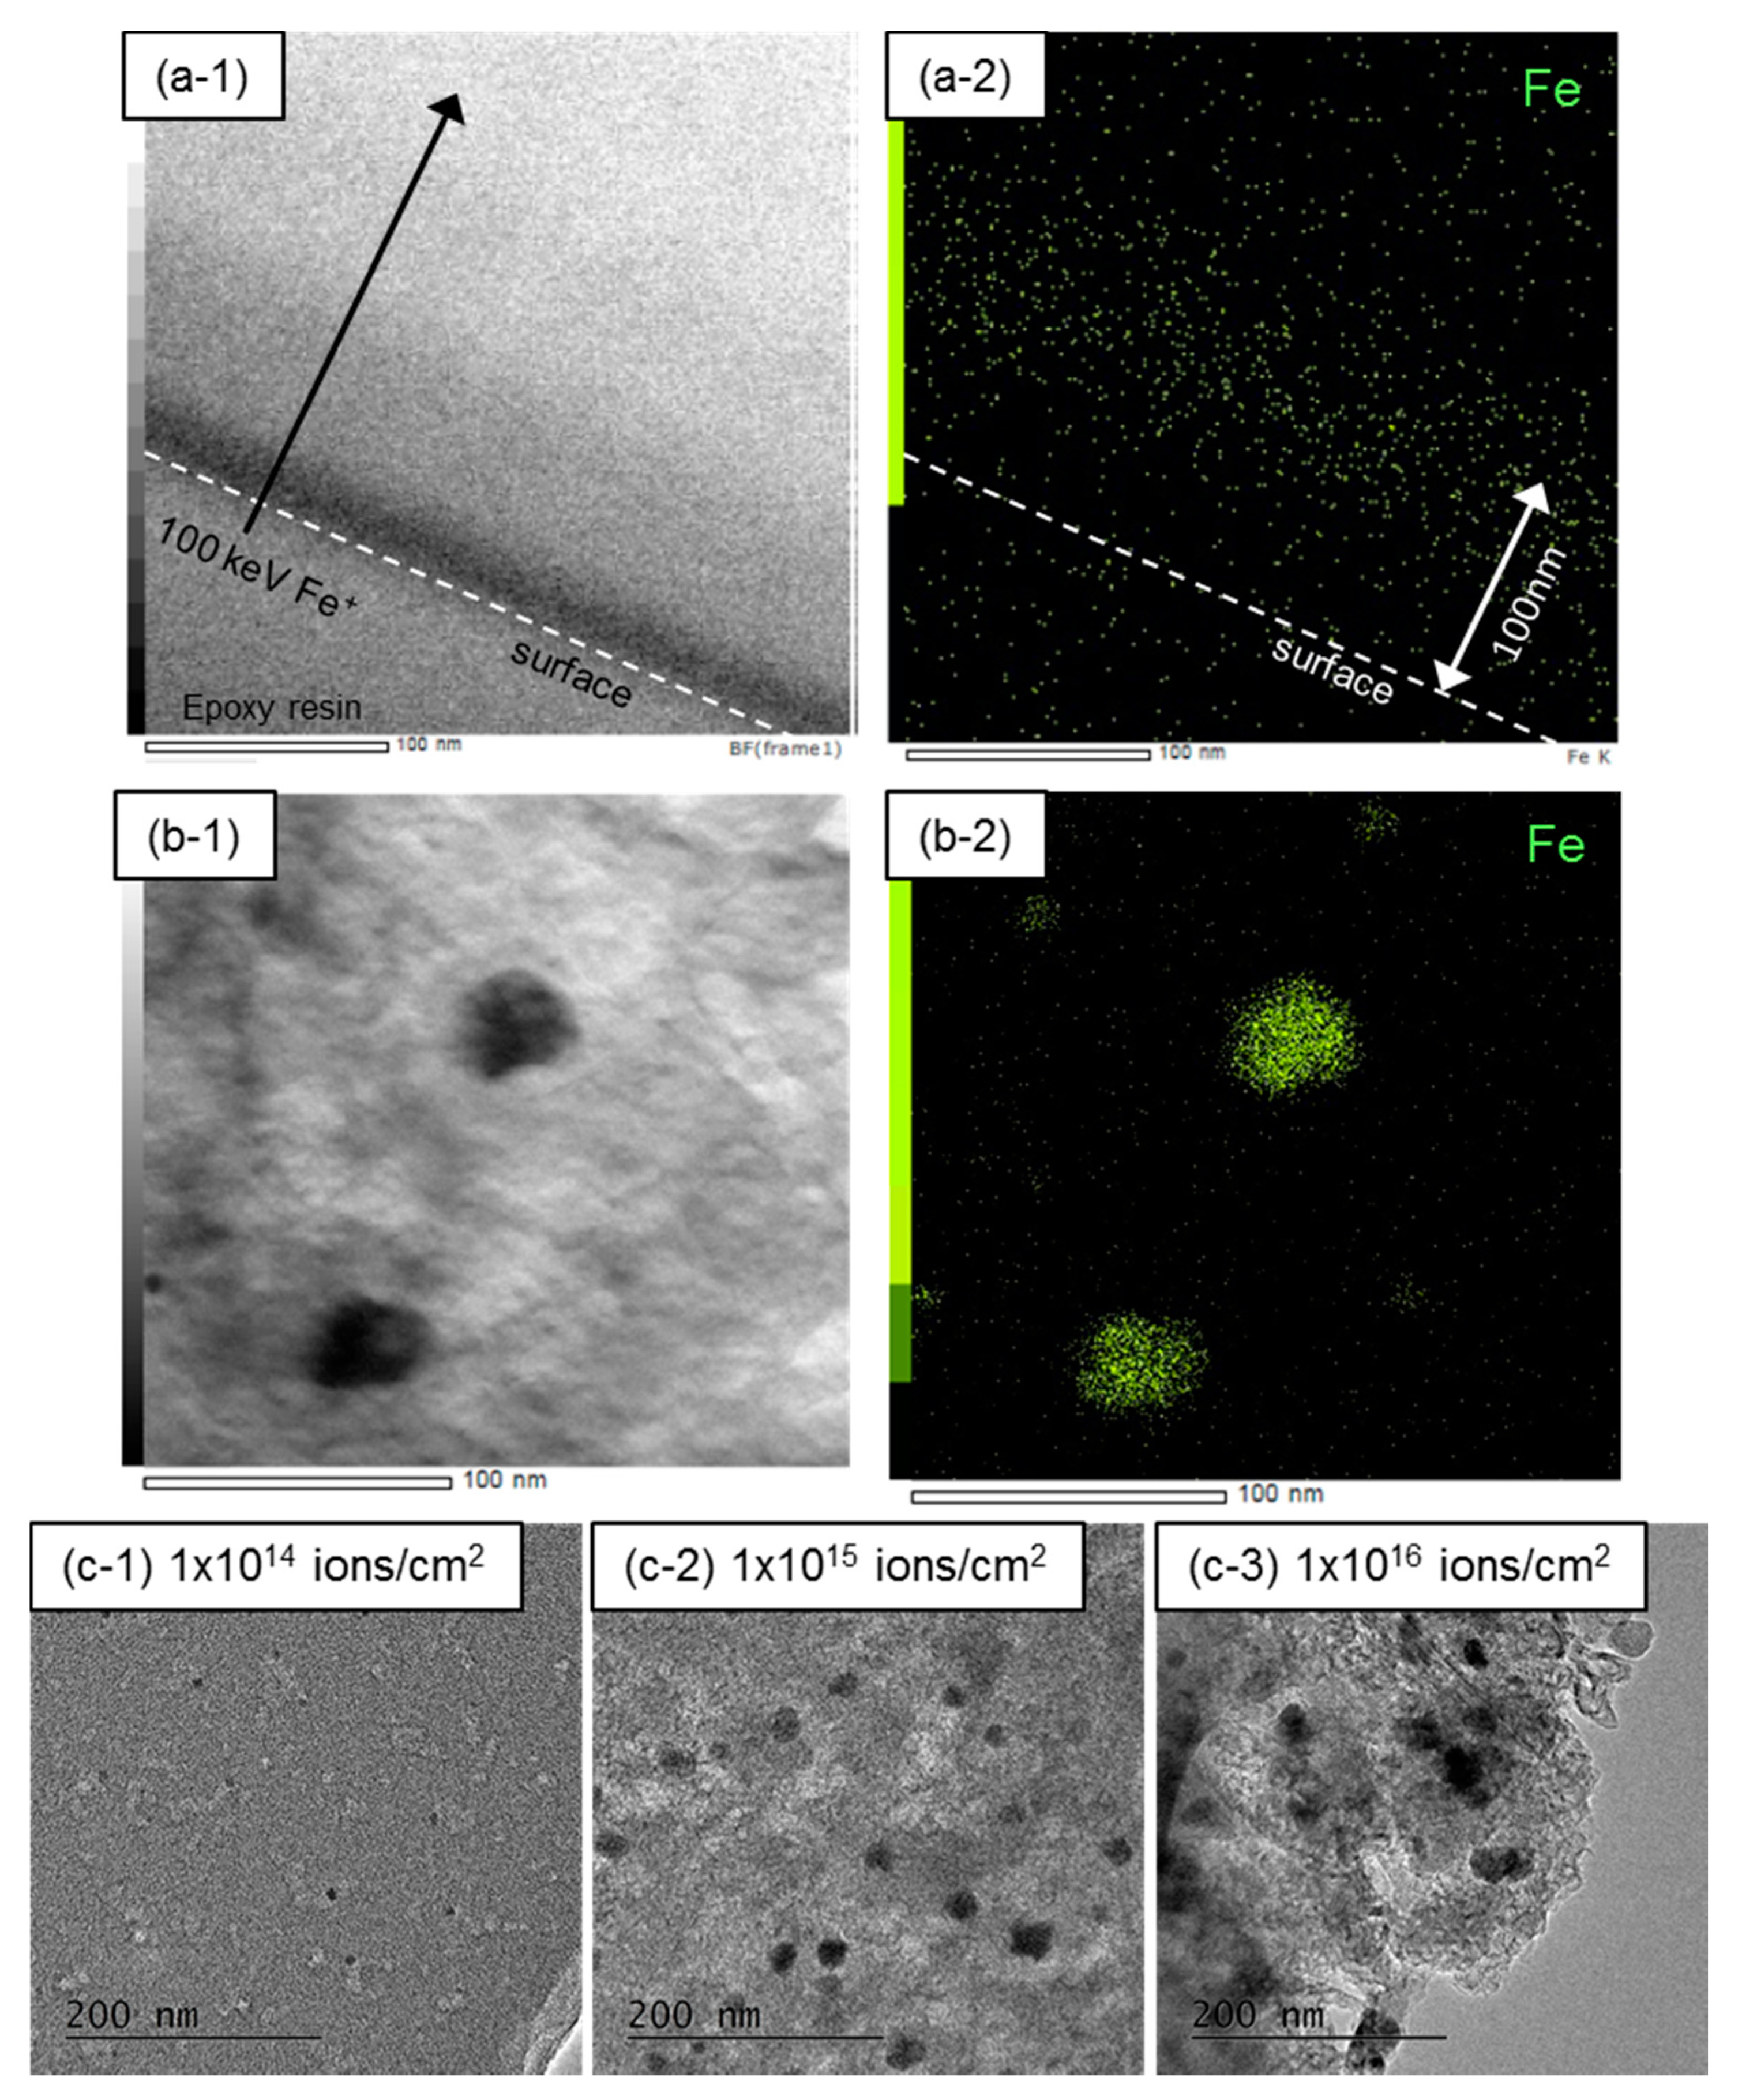
3. Results and Discussion

Prior to the experiment, the penetration depth and distribution of 100 keV Fe+ ions into PhR was estimated by the Stopping and Range of Ions in Matter (SRIM) code (ver. SRIM 2013.00) [24] in order to calculate Fe concentration in the PhR after ion implantation (Figure 1). The distribution of Fe+ ions showed a peak at about 120 nm in depth and maximum penetration depth of 200 nm. In the implanted part with area of 1 × 1 cm2 and depth of 200 nm, the concentration of Fe atom in the PhR was estimated as 0.035, 0.35, and 3.5 wt% for the ion fluence of 1 × 10¹⁴, 1 × 10¹⁵, and 1 × 10¹⁶ ions/cm2, respectively. In the synthesis of N-doped carbon catalysts mentioned in the Introduction section, the polymers and metal compounds are often mixed in a solution with typical concentration of 2–5 wt% as metal. Thus, it is possible to introduce the metal component by the ion implantation technique with similar concentration to the conventional blending method.
Figure 2 shows FT-IR spectra of PhR before and after the Fe+ ion implantation. In the case of the non-implanted sample, characteristic absorption peaks were observed at 3340 cm−1 (OH stretching), 1607, 1593, and 1506 cm−1 (C=C vibration in benzene ring), 1360 cm−1 (–OH bending), 1231 cm−1 (C–C–O asymmetric stretching), 1103 cm−1 (C–O–C asymmetric stretching), 819 cm−1 (C–COH asymmetric stretching of phenol), and 755 cm−1 (C–H bending in benzene ring, out-of-plane) [25,26]. After the Fe+ ion implantation, the peak intensity of –OH and C–H decreased drastically with increasing ion fluence, and a new absorption peak emerged at 1650 cm−1, as shown by a dashed line in the figure. This peak is assigned as C=C vibration in the benzene ring (polymeric), and is caused by the formation of a network structure due to the crosslinking of molecules in the PhR. Such network structure makes PhR insoluble to the solvent so that the implanted part can be exfoliated. A similar effect was found in the case of the 50 keV N+ ion implantation into the PhR [27], indicating that the crosslinking of molecules in the PhR is caused by high energy deposition of accelerated ions. Furthermore, the formation of the network structure in the PhR influences the behavior of thermal decomposition (Figure 3). The TGA curves for the ion-implanted samples exhibited gradual decreasing of the weight at around 400 °C comparing with the TGA curve for the non-implanted sample. The carbon yield at 800 °C was 37.0, 45.2, 58.3, and 67.4% for the non-implanted sample and implanted samples with 1 × 10¹⁴, 1 × 10¹⁵, and 1 × 10¹⁶ ions/cm2, respectively. This increase in the carbon yield is higher than the added concentration as Fe by the ion implantation (0.035–3.5 wt%), therefore, the enhanced carbon yield is attributed by the formation of network structure due to high energy deposition of 100 keV Fe+ ions.
Since it is well known that iron is oxidized easily, the Fe introduced by the ion implantation would be oxidized because the samples were handled in the air after implantation. However, the oxidized Fe is considered to be reduced to metallic Fe during heat treatment where the reducing gases hydrogen, methane, and carbon monoxide evolve from the PhR above 400 °C [28]. Figure 4 shows the results of TEM observation of the 100 keV Fe+-implanted PhR before and after the heat treatment at 800 °C in N2. According to the result of cross-sectional STEM-EDS measurement (Figure 4a), introduced Fe atoms were found to be distributed mainly at the depth of around 100 nm from the surface, as predicted by the SRIM calculation (Figure 1). However, no Fe NPs were found in the sample just after the ion implantation. After the heat treatment, the Fe NPs became to be recognized as black contrast in the TEM image, which were confirmed by the STEM-EDS measurement (Figure 4b). After the heat treatment at 800 °C, the particles size of Fe NPs became large with an increase in the ion fluence as shown in Figure 4c.
The relationship between the ion fluence and mean particle size of formed Fe NPs is shown in Figure 5a. The mean particle size of Fe NPs increased almost linearly with the increase in the ion fluence: 7.6, 12.8, 19.6, and 26.4 nm for 1 × 10¹⁴, 5 × 10¹⁴, 1 × 10¹⁵, and 1 × 10¹⁶ ions/cm2, respectively. This result suggests that the particle size is controllable in the range of 5–30 nm under the conditions of this work. On the other hand, the mean particle size of Fe NPs obtained from the blend of PhR and FeCl3 hardly changed by the Fe concentration between 0.35 and 2.1 wt%; it was almost constant at about 34 nm. This is caused by the Fe NPs obtained from the FeCl3-blended sample containing large particles with the size over 50 nm (Figure 5b). According to the particle size distribution, the Fe NPs with small particle size and narrow size distribution can be introduced by the ion implantation technique.
There is a report by A. Moisala et al. that the melting temperature of Fe NPs is lowered with decreasing particle size; the melting temperature becomes about 800 °C if the particle size is 8 nm while the melting temperature of Fe bulk is 1536 °C [29]. In the case of ion implantation with fluence of 1 × 10¹⁵ ions/cm2 and heat treatment at 600 °C, the mean particle size of Fe NPs was 5.9 ± 1.4 nm. Referring to the report above, the particle size of Fe NPs which is melt at 600 °C is estimated to be 6 nm, therefore, the Fe NPs formed in the PhR can be melt at 600 °C. Additionally, the implanted PhR is under thermal decomposition at 600 °C as seen in the result of TGA (Figure 3). These indicate that the requirement for the catalytic graphitization is satisfied. According to this indication, it is expected that the turbostratic graphite structure is formed in high efficiency at low temperature because the Fe NPs obtained by ion implantation include fine particles.
Figure 6 shows the fine structure of the carbon material obtained from the PhR with the ion implantation of 1 × 10¹⁵ ions/cm2 and the heat treatment at 800 °C. The shell-like carbon layers (Figure 6a) and intricately distorted carbon layers (Figure 6b) were formed around the Fe NPs (Fe NPs are lacking in Figure 6b). They are formed by the catalytic graphitization of PhR due to the introduced Fe NPs. In the case of formation of intricately distorted carbon layers, the Fe NPs might move around in the PhR matrix; a similar carbon structure has been reported as a bamboo-like carbon structure [12]. As shown in Figure 6c, the mean interlayer distance was 0.3531 ± 0.0057 nm which is wider than that of a highly oriented pyrolytic graphite (HOPG) crystal, 0.3390 ± 0.0008 nm. It has been reported that the turbostratic graphite structure has wider interlayer distance than that of graphite crystal [10,30,31]; therefore, the observed shell-like carbon layers and intricately distorted carbon layers can be referred to as the turbostratic graphite structure. On the other hand, it has been reported that the warped turbostratic graphite structure is essential for the N-doped carbon to exhibit ORR activity [2,3,4,7]. Thus, it is important to fabricate the turbostratic graphite structure in high efficiency in order to obtain the N-doped carbon catalyst with higher performance.
Figure 7 shows the Raman spectra of Fe+-ion-implanted PhR after the heat treatment at 800 °C. Two peaks of the G-band (ideal graphite: 1584cm−1) and D-band (disordered graphite: around 1340 cm−1) were found in the Raman spectra. The D-band consisted of four components [23]: D1-band (disordered graphite lattice and/or crystal edges: 1340 cm−1), D2-band (defect of surface graphene layer: 1620 cm−1), D3-band (amorphous carbon phase: 1500 cm−1), and D4-band (polyene (C–C, C=C bonds) structure: 1200 cm−1). The D1-band is attributed by the shell-like carbon layers and intricately distorted carbon layers as observed in the TEM images (Figure 6). The Raman spectrum was peak-separated by the five components and the proportion of peak area was compared (Figure 7b). With increasing ion fluence, the proportion of D3- and D4-components decreased and the proportion of D1-component increased inversely; these changes resulted in the sharpening of the D-band peak in the Raman spectrum. This behavior suggests that amorphous components were converted to graphitic components by the catalytic graphitization that is promoted by increasing in the ion fluence. Such promotion of carbonization was found even in the case of the ion implantation with 1 × 10¹⁴ ions/cm2 (0.035 wt% as Fe) where the Fe NPs with mean particle size of 7.6 nm was formed after the heat treatment at 800 °C.
Here, the carbonization behavior was compared between the carbon materials obtained by ion implantation (1 × 10¹⁵ ions/cm2, equal to 0.35 wt% as Fe) and the FeCl3-blending method (0.35 wt% as Fe). The result of FeCl3-blending is shown as purple bars in Figure 7b. In the case of FeCl3-blending, the proportion of lower D3- and D4-components and higher G-component were found than those in the case of ion implantation (shown as red bars in Figure 7b). This result indicates that the formation of graphite structure was promoted by the Fe NPs with large particle size over 50 nm in the case of FeCl3-blending (Figure 5b). Conversely, the Fe NPs with small particle size introduced by ion implantation suppress the formation of the graphite structure and induce the formation of turbostratic graphite structure. Based on these results, the formation of graphitic nanostructure may be controlled by the particle size of introduced Fe NPs; it is important to introduce fine Fe NPs into the PhR in order to fabricate the graphitic nanostructure which contains greater amounts of the turbostratic graphite structure.

4. Conclusions

In this work, the ion implantation technique was examined to introduce size-controlled Fe NPs into a carbon precursor polymer with the aim of fabricating a graphitic nanostructure through catalytic graphitization. The following concluding remarks were obtained:
(1)
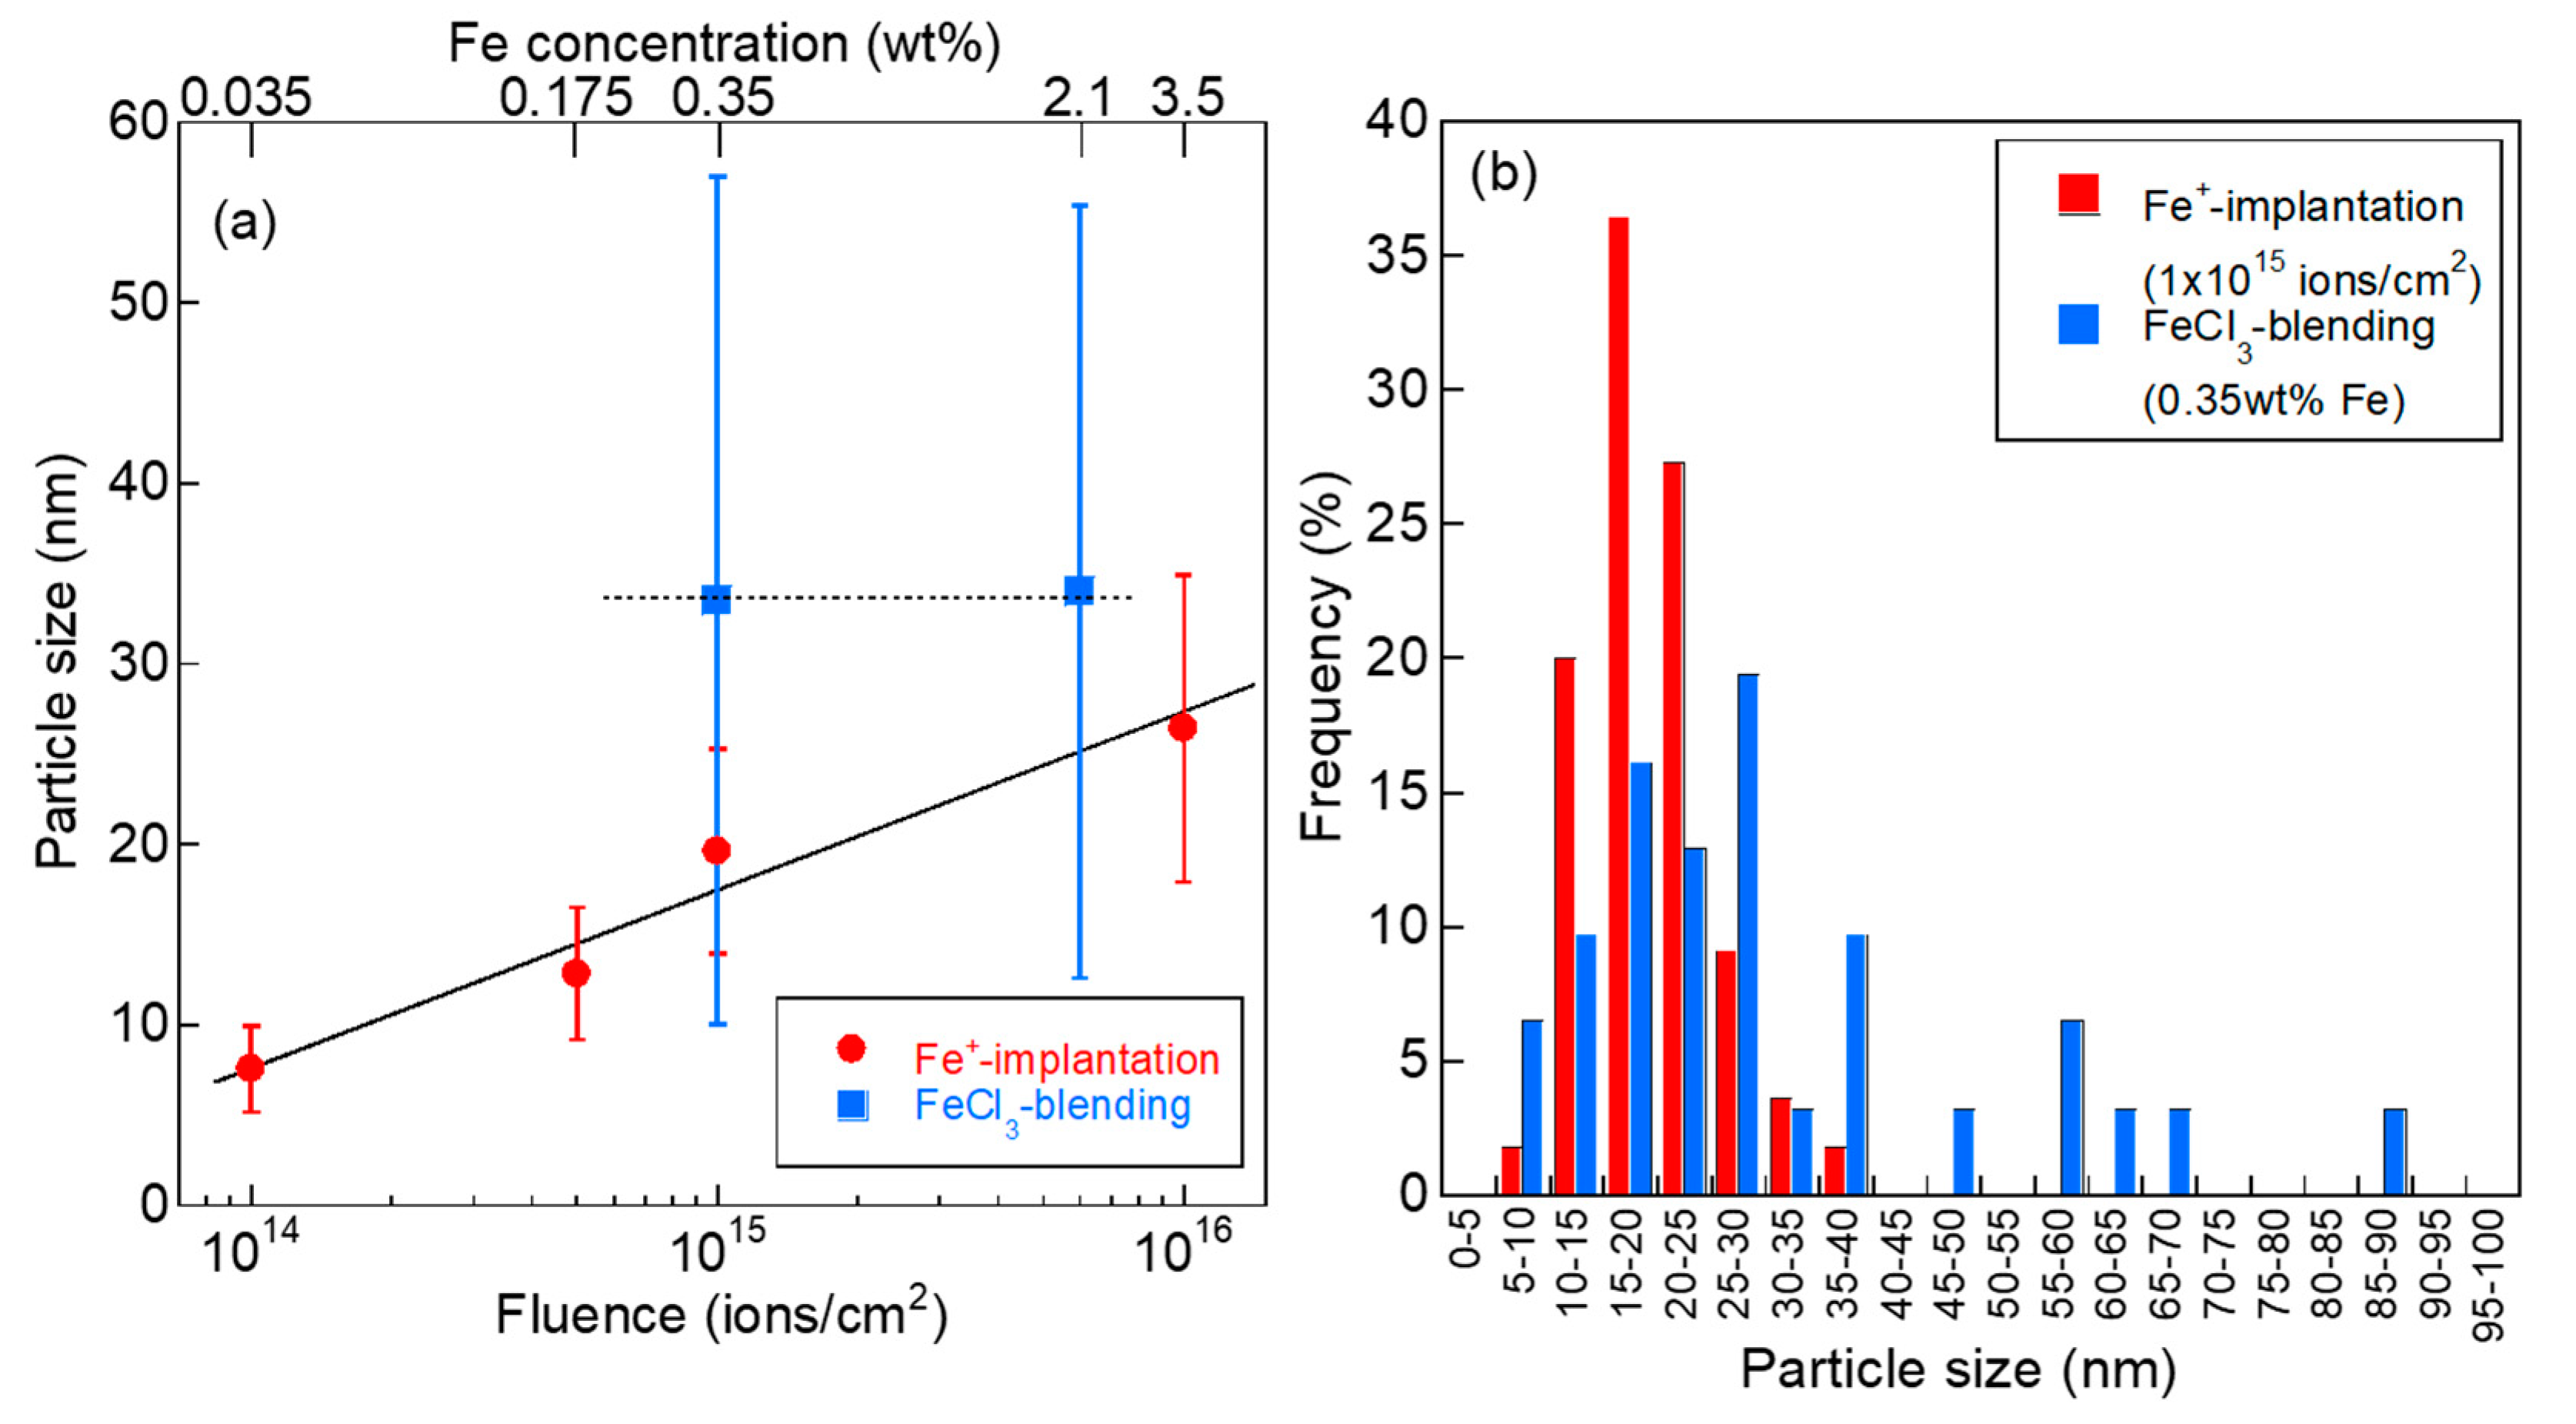
The mean particle size of Fe NPs could be controlled in the range of 5–30 nm by the ion fluence of 1 × 10¹⁴–1 × 10¹⁶ ions/cm2. Because the mean particle size of Fe NPs could not be controlled in the case of the FeCl3-blended PhR, it can be concluded that the ion implantation technique is one of the advantageous ways to introduce fine metal NPs.
(2)
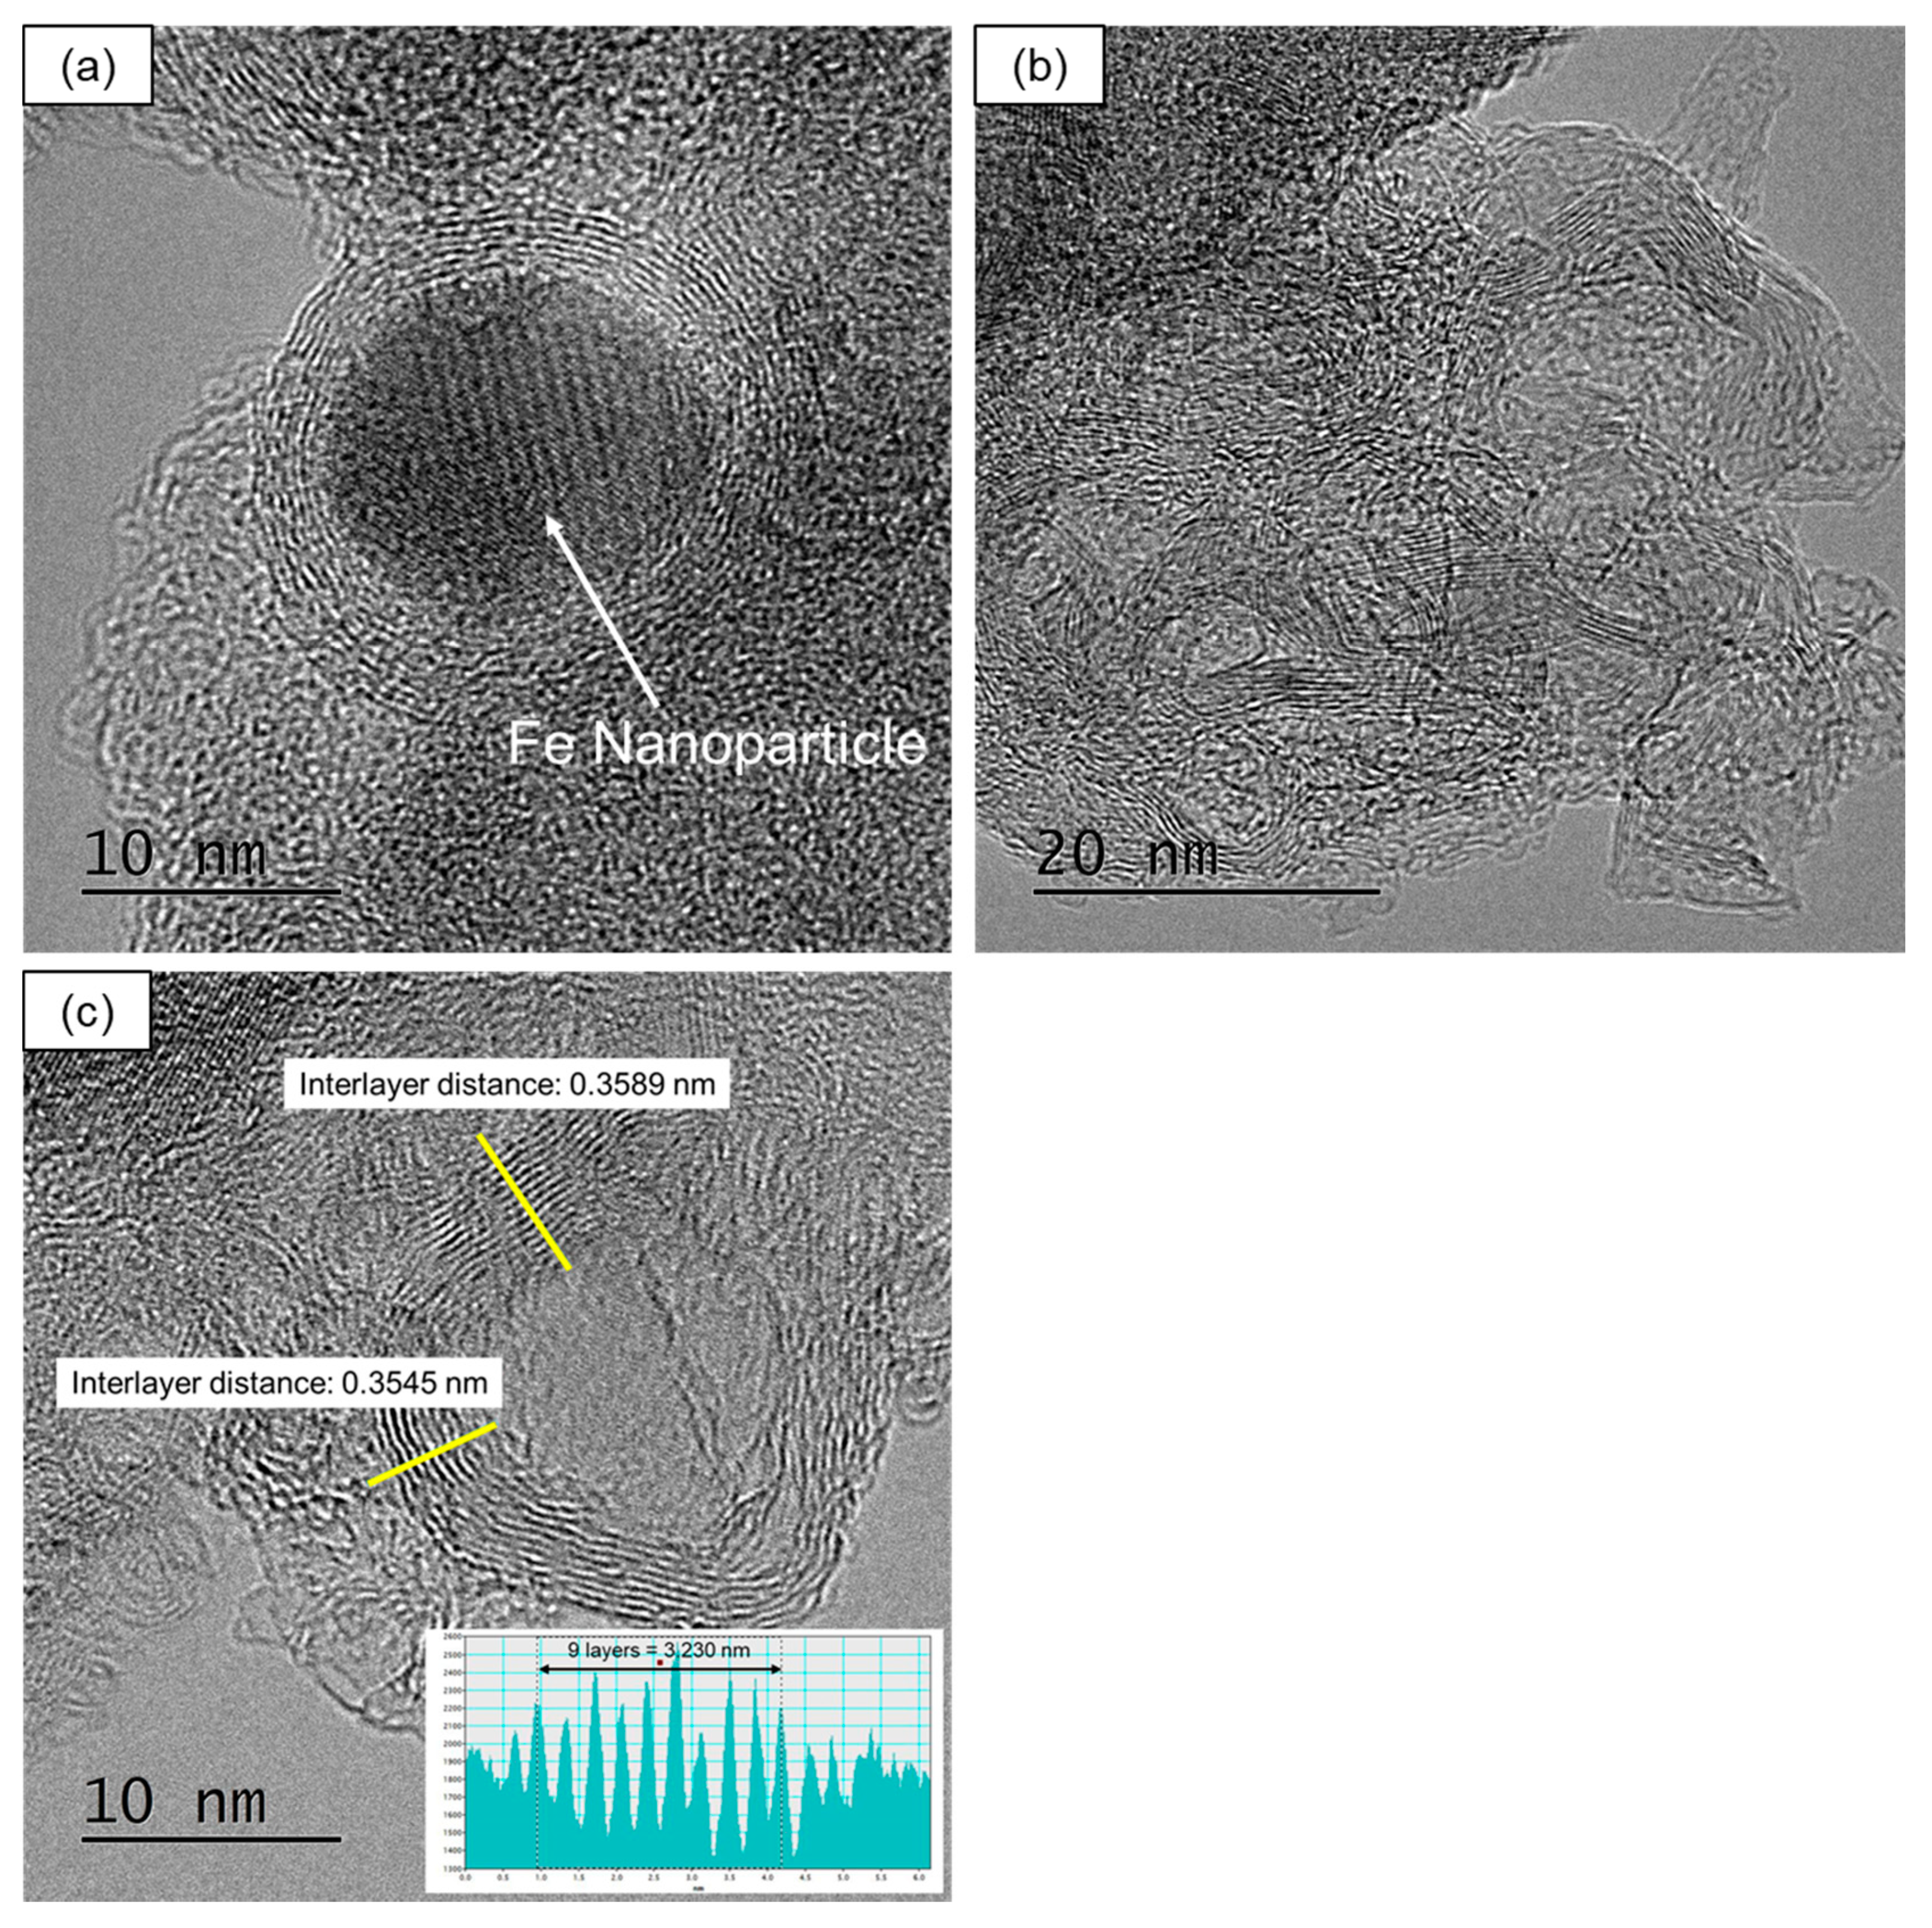
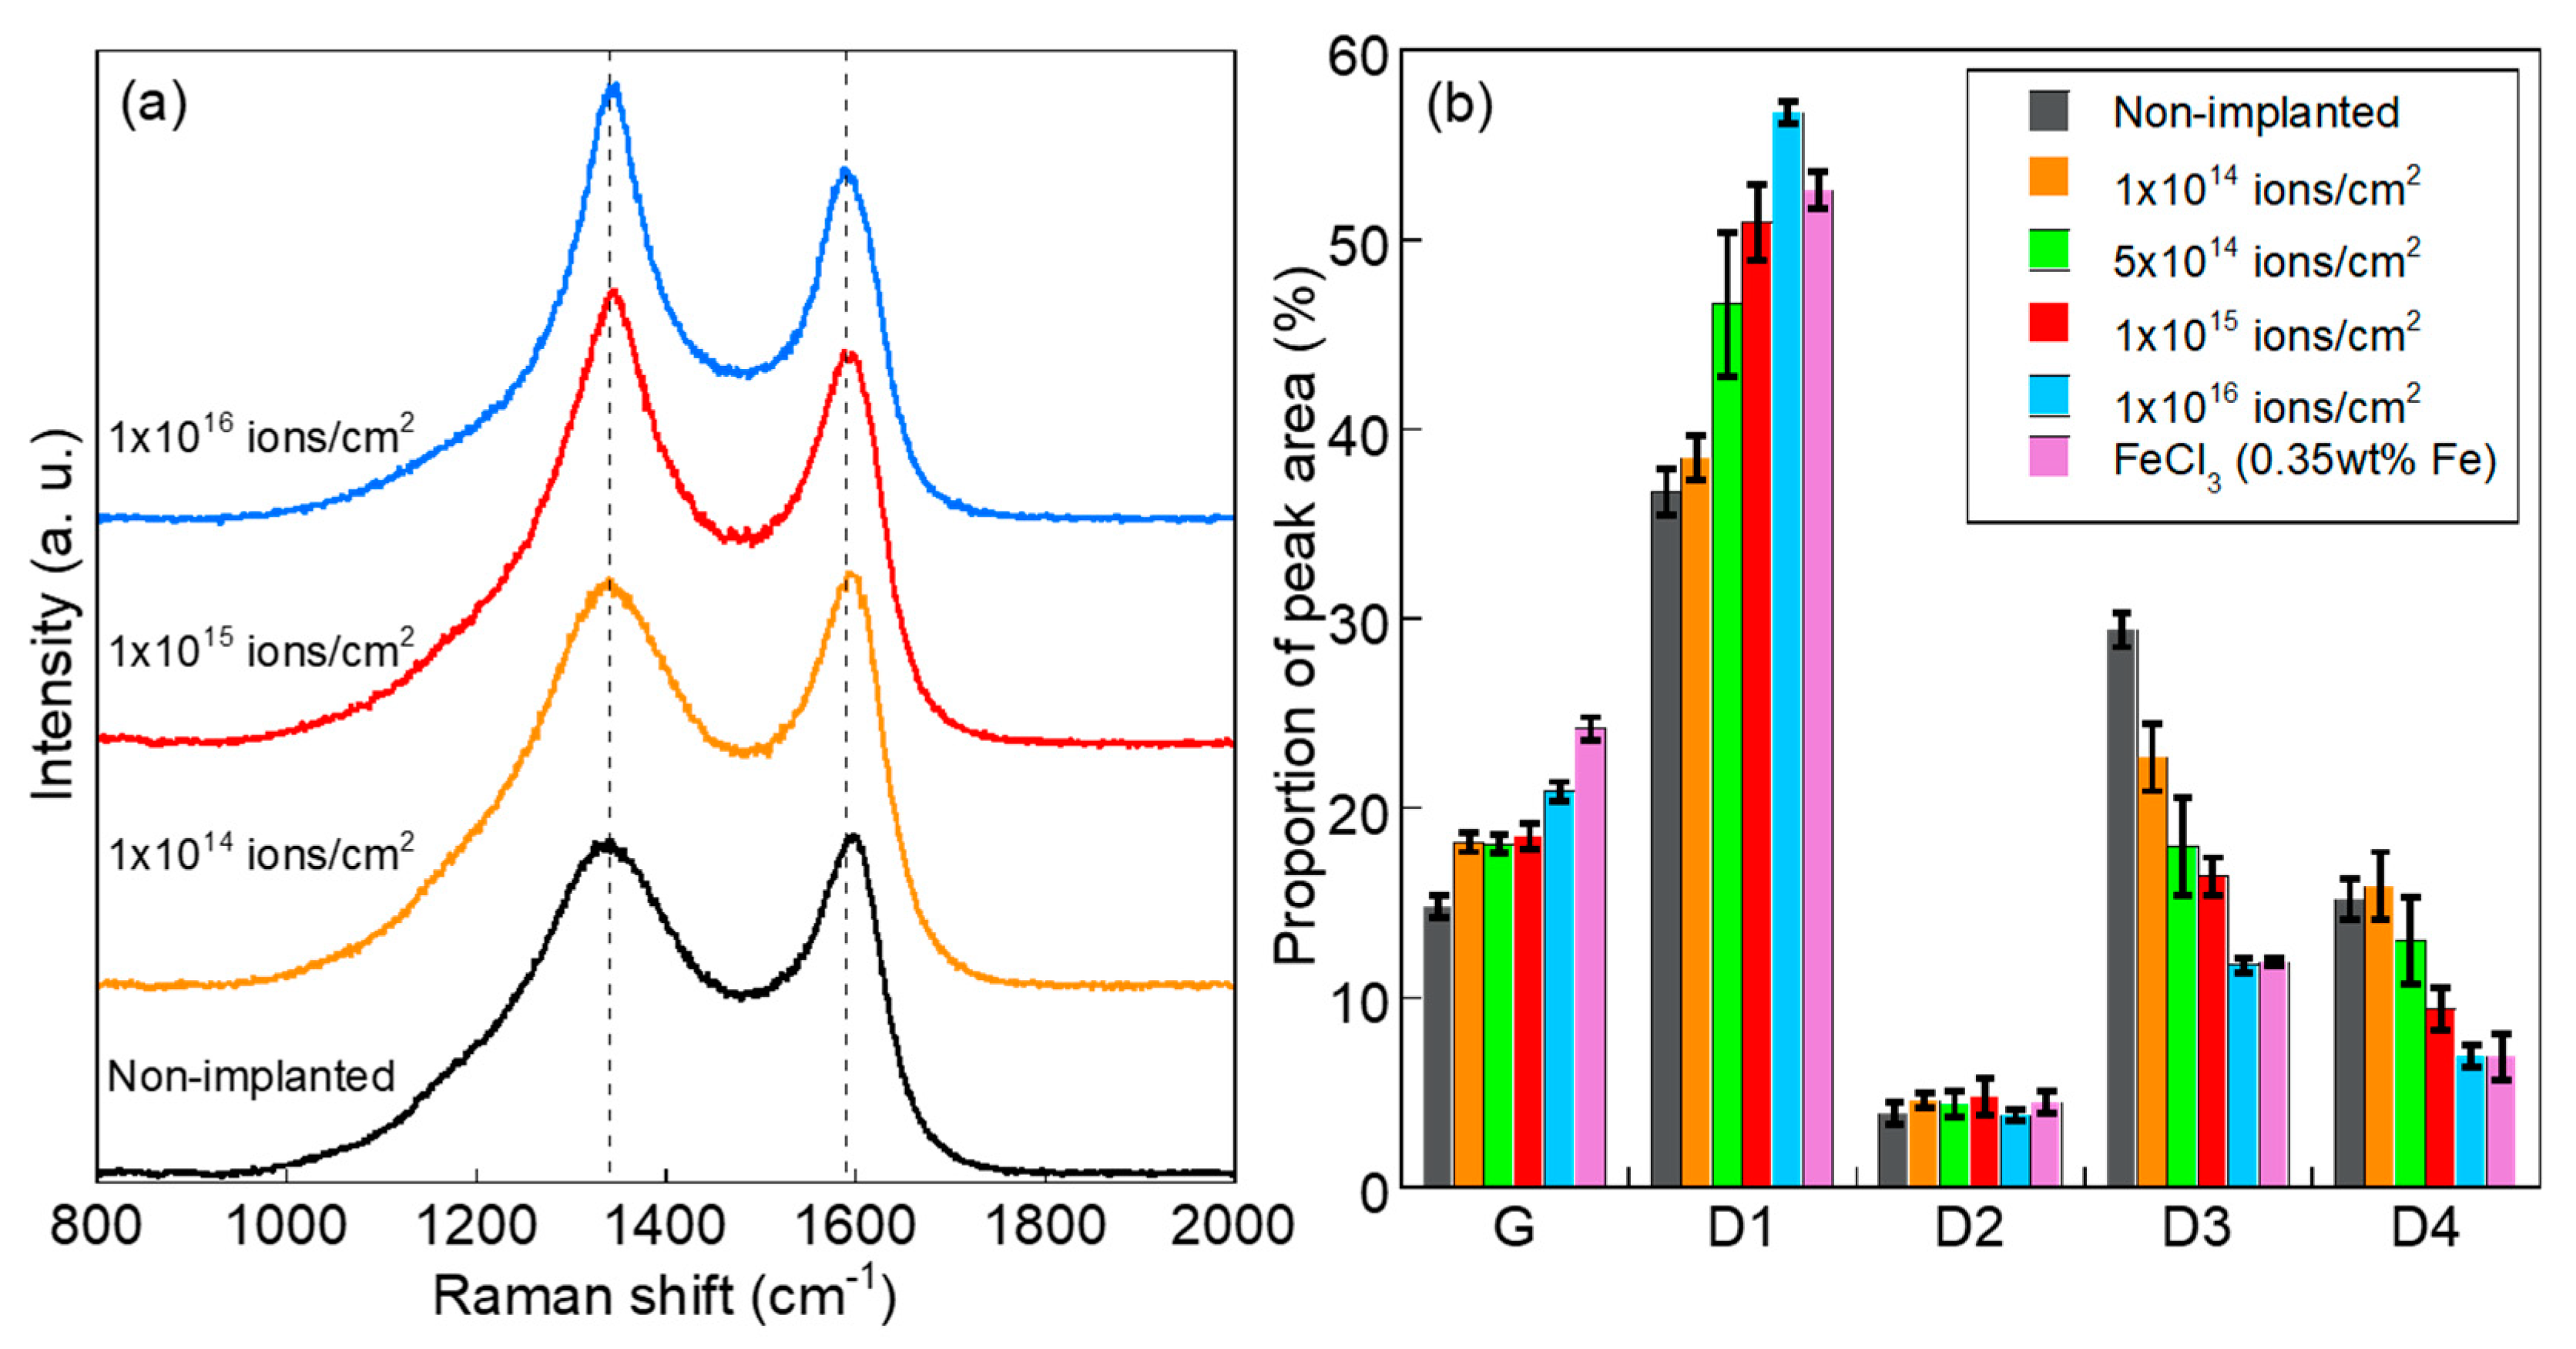
The turbostratic graphite structure with shell-like carbon layers and intricately distorted carbon layers was formed by the heat treatment of Fe+-implanted PhR at 800 °C. The peak analyses of Raman spectra revealed that carbonization at 800 °C was promoted even in the case of ion implantation with the ion fluence of 1 × 10¹⁴ ions/cm2 (0.035 wt% as Fe). Compared with the conventional FeCl3-blending method (0.35 wt% as Fe), the fine Fe NPs introduced by the ion implantation (1 × 10¹⁵ ions/cm2, 0.35 wt% as Fe) suppress the formation of graphite structure and induce the formation of turbostratic graphite structure.
According to the results above, it was found that it is important to introduce fine metal NPs in order to form the turbostratic graphite structure in high efficiency from a carbon precursor polymer. Additionally, the spatial distribution of metal NPs is also an important factor for the formation of turbostratic graphite structure. By controlling the particle size, size distribution, and spatial distribution of introduced metal NPs, it is expected to be possible to control the obtained graphitic nanostructure (graphite/turbostratic graphite), that would be useful to improve the performance of N-doped carbon catalysts.

Author Contributions

Conceptualization, A.I.; methodology, A.I. and S.Y.; investigation, A.I.; writing—original draft preparation, A.I.; writing—review and editing, S.Y., M.S., T.Y., and Y.M.; supervision, Y.M.; project administration, Y.M. All authors have read and agreed to the published version of the manuscript.

Funding

This work was financially supported by JSPS KAKENHI Grant Number 18K11938.

Acknowledgments

The authors thank Chihiro Suzuki for help in TEM observation.

Conflicts of Interest

The authors declare no conflict of interest.

References

  1. Ozaki, J.; Tanifuji, S.; Furuichi, A.; Oya, A. Enhancement of oxygen reduction activity by carbonization of furan resin in the presence of phthalocyanines. Carbon 2006, 44, 1324–1326. [Google Scholar] [CrossRef]
  2. Ozaki, J.; Tanifuji, S.; Furuichi, A.; Yabutsuka, K. Enhancement of oxygen reduction activity of nanoshell carbons by introducing nitrogen atoms from metal phthalocyanines. Electrochim. Acta 2010, 55, 1864–1871. [Google Scholar] [CrossRef]
  3. Kannari, N.; Ozaki, J. Formation of uniformly and finely dispersed nanoshells by carbonization of cobalt-coordinated oxine-formaldehyde resin and their electrochemical oxygen reduction activity. Carbon 2012, 50, 2941–2952. [Google Scholar] [CrossRef]
  4. Ozaki, J.; Imashiro, Y. Carbon Alloy catalysts for polymer electrolyte fuel cells: Exploration of materials and understanding of mechanisms. Electrochemistry 2015, 83, 319–325. [Google Scholar] [CrossRef] [Green Version]
  5. Guo, D.; Shibuya, R.; Akiba, C.; Saji, S.; Kondo, T.; Nakamura, J. Active sites of nitrogen-doped carbon materials for oxygen reduction reaction clarified using model catalysts. Science 2016, 351, 361–365. [Google Scholar] [CrossRef]
  6. Ning, X.; Li, Y.; Ming, J.; Wang, Q.; Wang, H.; Cao, Y.; Peng, F.; Yang, Y.; Yu, H. Electronic synergism of pyridinic- and graphitic-nitrogen on N-doped carbons for the oxygen reduction reaction. Chem. Sci. 2019, 10, 1589–1596. [Google Scholar] [CrossRef] [PubMed] [Green Version]
  7. Takigami, M.; Kobayashi, R.; Ishii, T.; Imashiro, Y.; Ozaki, J. Warped graphitic layers generated by oxidation of fullerene extraction residue and its oxygen reduction catalytic activity. Beilstein J. Nanotechnol. 2019, 10, 1391–1400. [Google Scholar] [CrossRef] [PubMed]
  8. Choi, C.H.; Park, S.H.; Woo, S.I. N-doped carbon prepared by pyrolysis of dicyandiamide with various MeCl2·xH2O (Me = Co, Fe, and Ni) composites: Effect of type and amount of metal seed on oxygen reduction reactions. Appl. Catal. B Environ. 2012, 119–120, 123–131. [Google Scholar] [CrossRef]
  9. Muthukrishnan, A.; Nabae, Y.; Hayakawa, T.; Okajima, T.; Ohsaka, T. Fe-containing polyimide-based high-performance ORR catalysts in acidic medium: A kinetic approach to study the durability of catalysts. Catal. Sci. Technol. 2015, 5, 475–483. [Google Scholar] [CrossRef]
  10. Oya, A.; Marsh, H. Phenomena of catalytic graphitization. J. Mater. Sci. 1982, 17, 309–322. [Google Scholar] [CrossRef]
  11. Maksimova, N.I.; Krivoruchko, O.P.; Mestl, G.; Zaikovskii, V.I.; Chuvillin, A.L.; Salanov, A.N.; Burgina, E.B. Catalytic synthesis of carbon nanosturctures from polymer precursor. J. Mol. Catal. A Chem. 2000, 158, 301–307. [Google Scholar] [CrossRef] [Green Version]
  12. Zhao, M.; Song, H. Catalytic graphitization of phenolic resin. J. Mater. Sci. 2011, 27, 266–270. [Google Scholar] [CrossRef]
  13. Kodama, Y.; Sato, K.; Suzuki, K.; Saito, Y.; Suzuki, T.; Konno, T.J. Electron microscope study of the formation of graphitic nanostructures in nickel-loaded wood char. Carbon 2012, 50, 3486–3496. [Google Scholar] [CrossRef]
  14. Wang, J.; Deng, X.; Zhang, H.; Zhang, Y.; Duan, H.; Lu, L.; Song, J.; Tian, L.; Song, S.; Zhang, S. Synthesis of carbon nanotubes via Fe-catalyzed pyrolysis of phenolic resin. Phys. E Low-Dimens. Syst. Nanostruct. 2017, 86, 24–35. [Google Scholar] [CrossRef]
  15. Yu, J.; Zhao, H.; Zhang, H.; Li, J.; Ding, X. Growth of carbon nanofibers in phenolic resin for carbon-contained refractory using different catalysts. J. Nanomater. 2017, 2017, 4826785. [Google Scholar] [CrossRef]
  16. Rastegar, H.; Bavand-vandchali, M.; Nemati, A.; Fard, F.G. Catalytic graphitization behavior of phenolic resins by addition of in situ formed nano-Fe particles. Phys. E Low-Demens. Sys. Nanostruct. 2018, 101, 50–61. [Google Scholar] [CrossRef]
  17. Stepanov, A.L. Optical properties of metal nanoparticles synthesized in a polymer by ion implantation: A review. Tech. Phys. 2004, 49, 143–153. [Google Scholar] [CrossRef]
  18. Popok, V.N. Ion implantation of polymers: Formation of nanoparticulate materials. Rev. Adv. Mater. Sci. 2012, 30, 1–26. [Google Scholar]
  19. Boldyryeva, H.; Umeda, N.; Plaksin, O.A.; Kishimoto, N. High-fluence implantation of negative metal ions into polymers for surface modification and nanoparticle formation. Surf. Coat. Technol. 2005, 196, 373–377. [Google Scholar] [CrossRef]
  20. Mailinsky, P.; Mackova, A.; Hnatowicz, V.; Khaibullin, R.I.; Valeev, V.F.; Slepicka, P.; Svorcik, V.; Slouf, M.; Perina, V. Properties of polyimide, polyetheretherketone and polyethyleneterephthalate implanted by Ni ions to high fluences. Res. Sect. B Beam Interact. Mater. At. 2012, 272, 396–399. [Google Scholar] [CrossRef]
  21. Salvadori, M.C.; Teixeira, F.S.; Sgubin, L.G.; Cattani, M.; Brown, I.G. Surface modification by metal ion implantation forming metallic nanoparticles in an insulating matrix. Appl. Surf. Sci. 2014, 310, 158–163. [Google Scholar] [CrossRef]
  22. Williams, D.B.; Carter, C.B. Transmission Electron Microscopy, A Textbook for Material Science; Plenum Press: New York, NY, USA, 1996. [Google Scholar]
  23. Sadezky, A.; Muckenhuber, H.; Grothe, H.; Niessner, R.; Pöschl, U. Raman microspectroscopy of soot and related carbonaceous materials: Spectral analysis and structural information. Carbon 2005, 43, 1731–1742. [Google Scholar] [CrossRef]
  24. Ziegler, J.F. The Stopping and Ranges of Ions in Matter, SRIM 2013 Software. Available online: www.srim.org (accessed on 4 February 2020).
  25. Poljanšek, I.; Krajnc, M. Characterization of Phenol-Formaldehyde Prepolymer Resins by In Line FT-IR Spectroscopy. Acta Chim. Slov. 2005, 52, 238–244. [Google Scholar]
  26. Renda, C.G.; Bertholdo, R. Study of phenolic resin and their tendency for carbon graphitization. J. Polym. Res. 2018, 25, 241. [Google Scholar] [CrossRef]
  27. Idesaki, A.; Sugimoto, M.; Yamamoto, S.; Yamaki, T. Effect of ion implantation on a precursor polymer for synthesis of carbon material with catalytic performance. Ceram. Trans. 2018, 264, 33–40. [Google Scholar]
  28. Yamashita, Y.; Ouchi, K. A study on carbonization of phenol-formaldehyde resin labelled with deuterium and 13C. Carbon 1981, 19, 89–94. [Google Scholar] [CrossRef]
  29. Moisala, A.; Nasibulin, A.G.; Kauppinen, E.I. The role of metal nanoparticles in the catalytic production of single-walled carbon nanotubes—A review. J. Phys. Condens. Matter 2003, 15, S3011–S3035. [Google Scholar] [CrossRef]
  30. Warren, B.E. X-ray diffraction study of carbon black. J. Chem. Phys. 1934, 2, 551–555. [Google Scholar] [CrossRef]
  31. Biscoe, J.; Warren, B.E. An X-ray study of carbon black. J. Appl. Phys. 1942, 13, 364–371. [Google Scholar] [CrossRef]
Figure 1. Distribution of Fe+ ions in the phenolic resin calculated by the Stopping and Range of Ions in Matter (SRIM) code.
Qubs 04 00011 g001
Figure 2. Fourier transform infrared (FT-IR) spectra of the phenolic resin before and after the implantation of 100 keV Fe+.
Qubs 04 00011 g002
Figure 3. Thermogravimetric analysis (TGA) curves of the phenolic resin before and after the implantation of 100 keV Fe+.
Qubs 04 00011 g003
Figure 4. Results of transmission electron microscopic (TEM) observation of the 100 keV Fe+-implanted phenolic resin before and after the heat treatment at 800 °C in N2: (a) cross-sectional observation of the sample just after the implantation: (a-1) Scanning transmission electron microscope (STEM) image and (a-2) energy dispersive X-ray spectroscopy (EDS) mapping of Fe; (b) observation of the ground sample after the heat treatment (ion fluence of 1 × 10¹⁵ ions/cm2): (b-1) STEM image and (b-2) EDS mapping of Fe; and (c) observation of the ground sample after the heat treatment with different ion fluence: (c-1) 1 × 10¹⁴ ions/cm2, (c-2), 1 × 10¹⁵ ions/cm2, and (c-3) 1 × 10¹⁶ ions/cm2.
Qubs 04 00011 g004
Figure 5. Particle size of formed Fe NPs in the obtained carbon materials with the ion implantation and the FeCl3-blending: (a) mean particle size and (b) particle size distribution.
Qubs 04 00011 g005
Figure 6. TEM images of the obtained carbon materials with the ion implantation (1 × 10¹⁵ ions/cm2): (a) shell-like carbon layers, (b) intricately distorted carbon layers, and (c) typical results of measurement of interlayer distance.
Qubs 04 00011 g006
Figure 7. Raman spectra of the obtained carbon materials with the ion implantation: (a) Raman spectra with different ion fluence and (b) proportion of peak area obtained by the peak separation.
Qubs 04 00011 g007

