Article

Comparative Analysis of Soft Clay Improvement Using Ordinary and Grouted Sand Columns with Geosynthetic Reinforcement

by
Mohammed Y. Fattah
1,*,
Muthanna A. Al-Khafaji
1,
Makki K. Mohsen
1 and
Mohamed Hafez
2
1
Civil Engineering Department, University of Technology, Baghdad 10056, Iraq
2
Department of Civil Engineering, Faculty of Engineering, FEQS, IU University, Nilai 71800, Malaysia
*
Author to whom correspondence should be addressed.
Infrastructures 2025, 10(3), 62; https://doi.org/10.3390/infrastructures10030062
Submission received: 29 December 2024 / Revised: 26 January 2025 / Accepted: 4 March 2025 / Published: 13 March 2025

Abstract

Soft clay soil is known for its high compressibility and low bearing capacity, making it one of the most challenging soil types. Sand columns and sand layers reinforced with geosynthetics are effective techniques to enhance the performance of foundations built on soft clay. Stone or sand columns improve load-bearing capacity by utilizing the natural lateral confinement of the soil. However, in very soft soil, a significant design challenge arises due to bulging in the stone columns, as the surrounding soil may not provide adequate confinement to support the required load capacity. This issue has been addressed by grouting the columns, resulting in highly stable and solid structures. Additionally, the grouting pressure enhances frictional resistance and fills any voids within the soil, contributing to increased overall stability. In the current study, soil improvement methods using ordinary sand columns and grouted sand columns were investigated and then compared with adding sand layers with geogrid reinforcement. The study demonstrated that grouted sand columns improved the bearing capacity by 90% over untreated clay. With geogrid reinforcement, sand columns achieved a 180% increase, while grouted columns with geogrid reinforcement reached a 260% improvement. Increasing the thickness of reinforced sand (H/B = 1.5) further raised capacity improvements to 300% for ungrouted and 420% for grouted columns.

1. Introduction

As global populations expand and the demand for infrastructure and services grows, the availability of suitable land for construction has become increasingly limited. However, in many regions, soft soil presents significant challenges, as it lacks the strength required for conventional shallow foundations. To cost-effectively address these limitations, stone columns and geosynthetic reinforcement have emerged as highly adaptable techniques for enhancing soil stability on-site. These methods are particularly valued for their affordability, straightforward application, climate forcing and construction efficiency. The use of reinforced sand layers and stone columns has been shown to substantially improve foundation performance in soft clay soils [1].
When grouting technology is integrated with stone columns, it significantly enhances soil stability and addresses some limitations associated with stone columns alone. While the individual applications of stone columns, geosynthetic reinforcement, and soil grouting have been well documented, the combined use of all three techniques remains largely unexplored.
Ambily and Gandhi [2] described experimental and finite-element analyses conducted to investigate the behavior of stone columns with the soil’s shear strength, the angle of internal friction of the stones, and the distance between the stones.
Numerous attempts have been made to improve the behavior of conventional stone columns. Structural elements such as sleeves, discs, and others have been introduced to interact with backfill material [3]. Furthermore, it has been shown that using additives such as cement, lime, and asphalt can effectively enhance the performance of stone columns [4].
Fattah et al. [5] and Ali et al. [6] examined the failure stress resulting from various types of reinforcement on long floating and end-bearing single and group columns with and without reinforcement.
In geotechnical engineering, grouting is a technique used to improve the properties of soil, especially unstable soils. This method entails injecting materials like cement, chemical resins, or a combination of chemicals into the soil via pipes to reduce permeability, improve its strength, and increase stability [7]. The types of grouting differ based on the material used and the properties of the targeted soil [8,9].
A prevalent application of grouting is strengthening foundations and large structures, including dams and bridges. Grouting enhances the soil’s capacity to support substantial loads and diminishes the probability of differential settlements [10]. Additionally, grouting is employed in subterranean construction endeavors, such as tunnels, to regulate groundwater infiltration and avert soil collapse during excavation [8]. The procedure is based on several methods, such as high-pressure grouting, employed when considerable structural alterations in the soil are necessary, and permeation grouting, which attempts to fill big gaps [7]. In many different engineering contexts, grouting is a versatile and successful way to improve weak soils.
The research gap lies in the limited studies addressing the interaction between grouted sand columns and geogrids for improving bearing capacity and reducing settlement in soft clay soils in order to get resilient buildings. While most studies have focused on the use of each technique separately, this study is unique in its approach of combining both techniques.
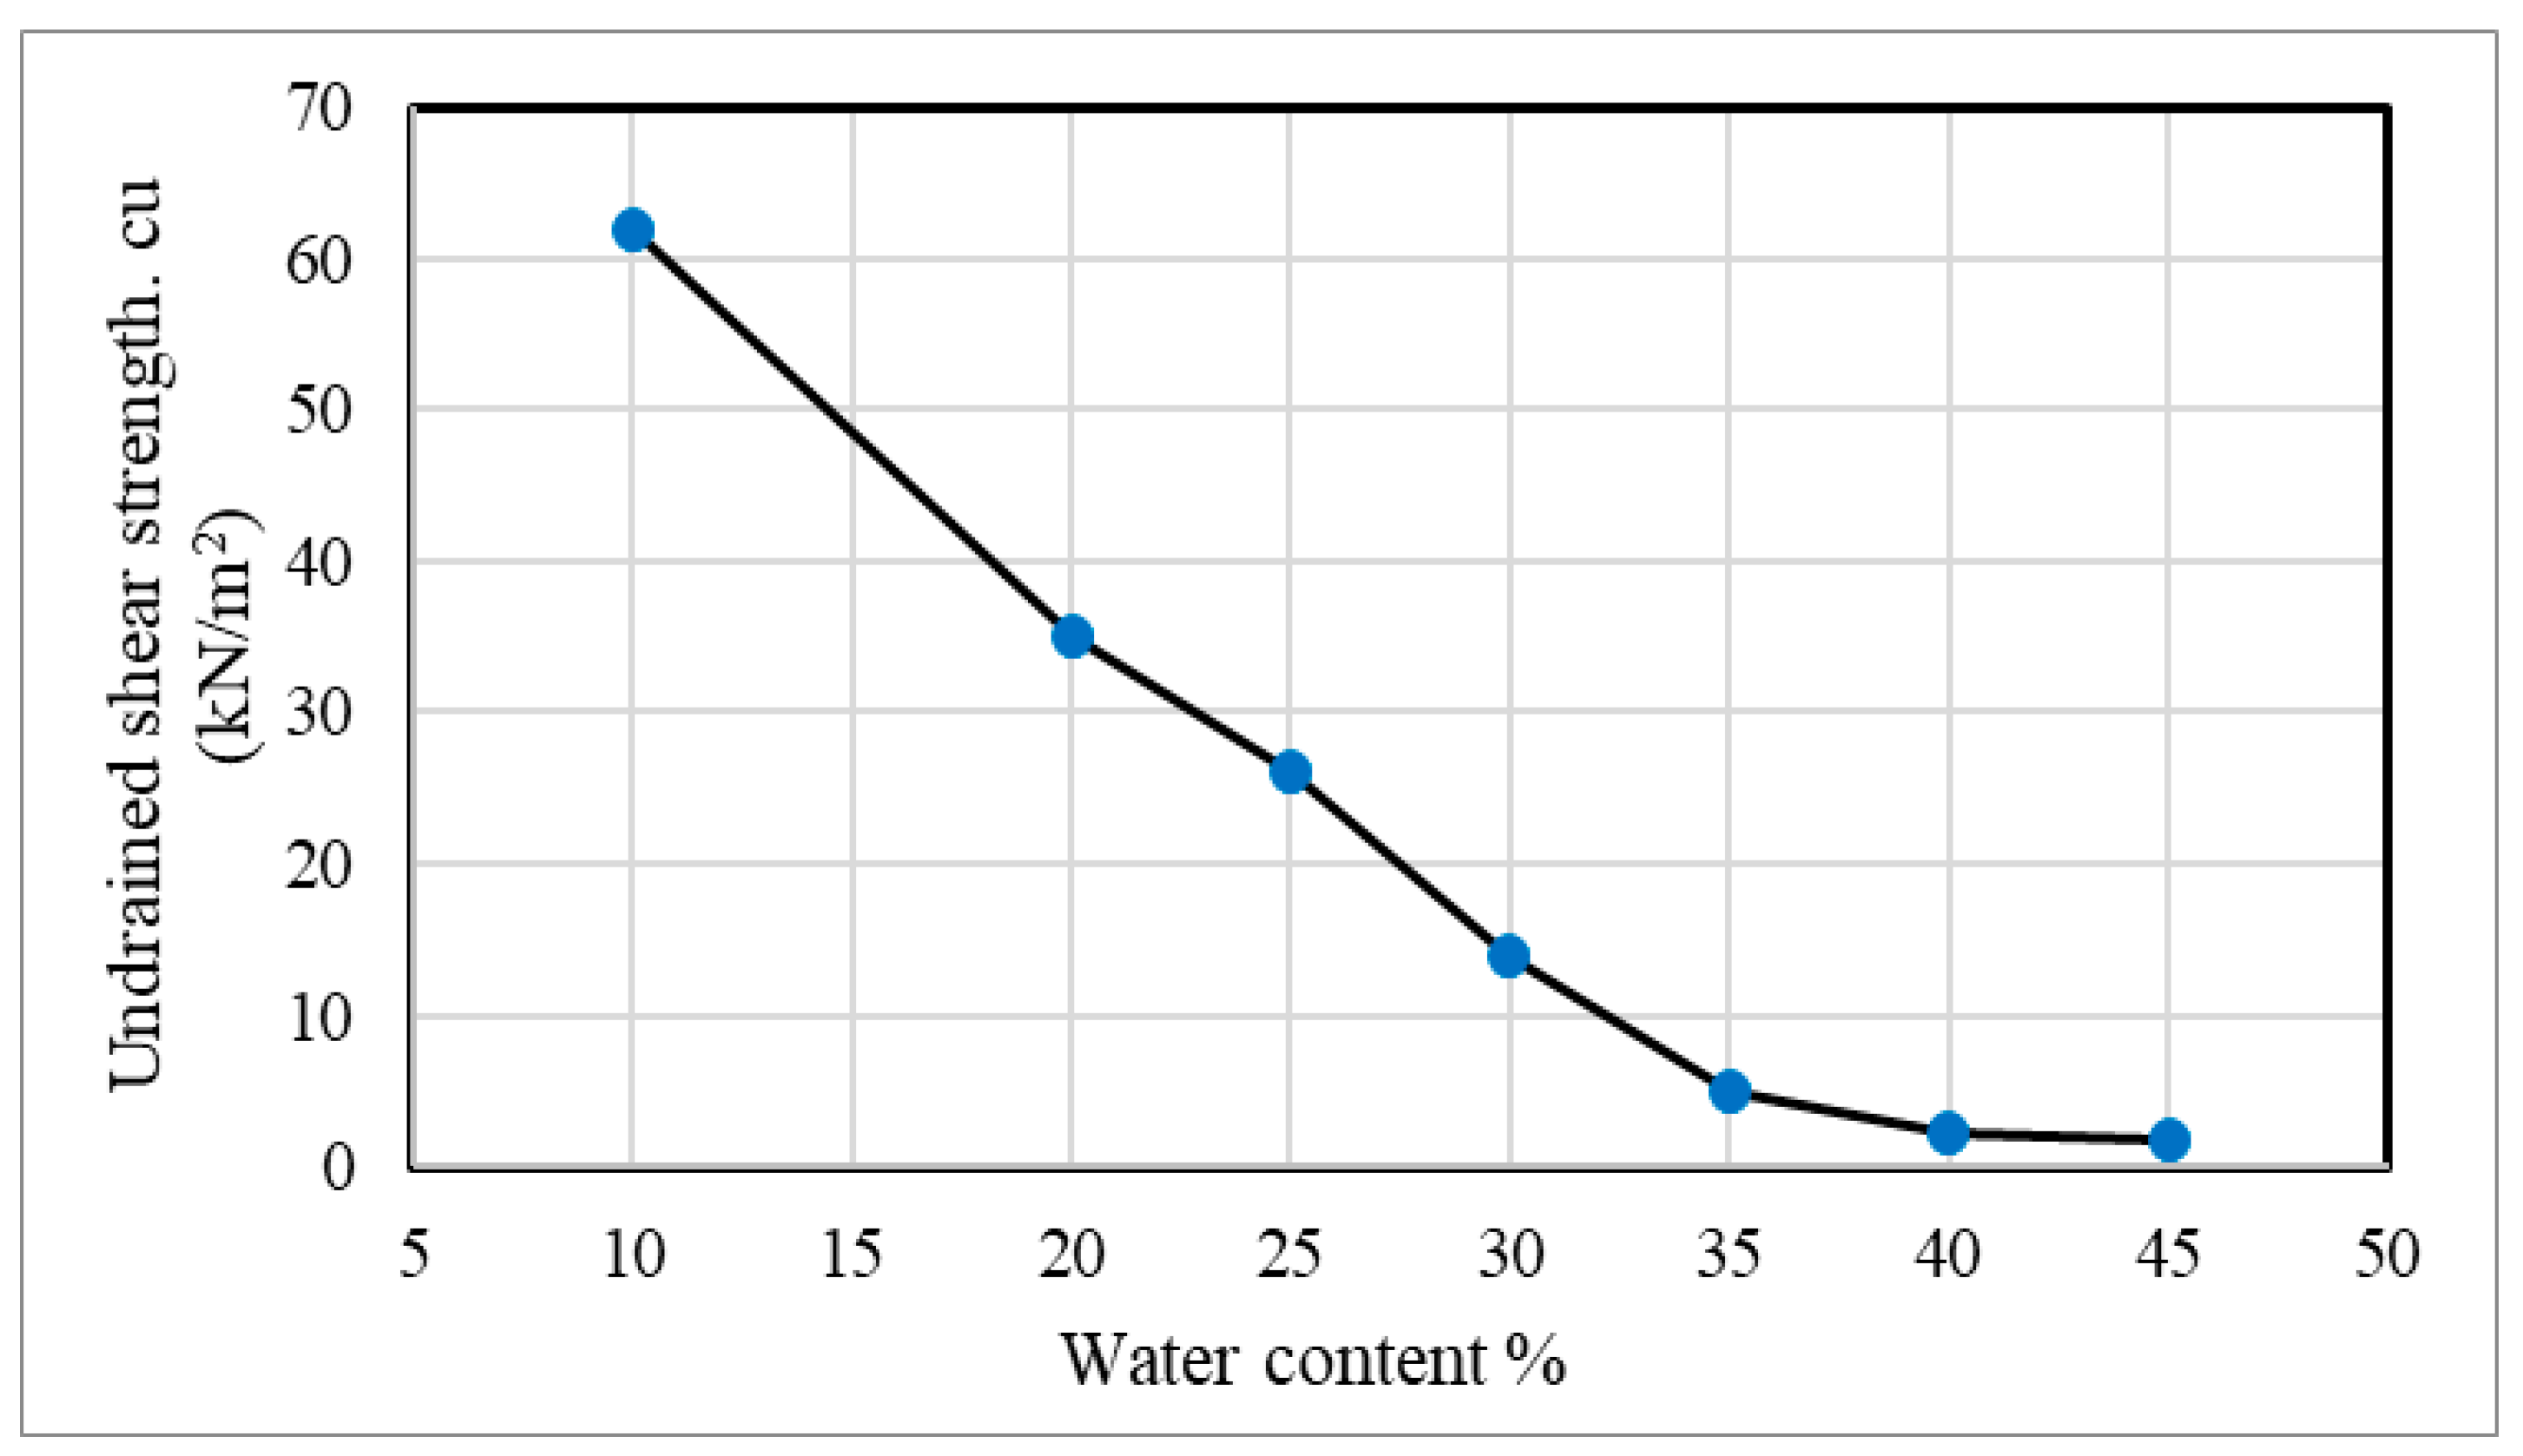
Based on the existing literature, the objective of the current study is to compare various soil improvement methods, including ordinary sand columns, grouted sand columns, and sand layers reinforced with geogrids. An experimental investigation was carried out on a soft clay bed with an undrained shear strength of 14 kPa to gain a deeper understanding of the load behavior.

2. Experimental Investigation

2.1. Material Properties

Natural clay soil that was accessible locally was used to prepare the clay subgrades. Soil properties, such as chemical and physical ones, are compiled in Table 1.
In this study, dry sand was utilized as a cushion layer. The physical properties of the sand were determined using standard methods, with the results shown in Table 2. According to the Unified Soil Classification System, the sand is categorized as poorly graded (SP). Figure 1 illustrates the particle size distribution of both sand and clay.
The engineering properties of the geogrid used in each test are shown in Table 3, which is based on data provided by the manufacturer.

2.2. Materials for Grouting

To meet the objectives of this study, sulfate-resistant Portland cement was used in the grout mixture. The properties of the cement are listed in Table 4. MasterGlenium 51 was added as a superplasticizer to enhance the grout’s fluidity, significantly reduce water content, provide high early strength, and increase durability.

2.3. Model and Grouting System

The axial load is applied using a hydraulic jack system, as depicted in Figure 2a,b. In this study, a steel square footing with dimensions of 100 × 100 mm and a thickness of 25 mm was utilized. The steel container measured 700 × 700 mm with an 800 mm depth. Based on Boussinesq’s method [15], this container size was deemed suitable for the footing size and load distribution range. The method suggests that, at a depth of 3.2 B or less, the load impact on the soil is minimal. Given that the load under the footing is equal to qo (0.05), the box dimensions are appropriate for both the footing and load distribution range. Additionally, the pressure bulb analysis shows that at a distance of 1.5 B from the footing center, the ratio of q/qo = 0.05, further validating the selected dimensions (700 × 700 × 800 mm). Constructed of 6 mm steel plates, the container was reinforced laterally with mild steel angles to maintain rigidity during testing.
To measure the footing settlement under static load, an LVDT was employed, while a computer system was used to automatically scan and record data.
The grouting system, specifically designed and constructed for this study, is illustrated in Figure 3. It comprises three main components: First, a grout chamber with a capacity of 20 L, which includes a grouting mixer for thoroughly blending the grout at a constant speed of 60 to 400 revolutions per minute. A wing attachment aids in achieving a uniform mix and prevents sedimentation during pumping (see Figure 3). Second, an air compressor with a pneumatic air regulator provides the necessary pressure to the grouting system. Lastly, a stainless steel cement grouting nozzle, 300 mm in length and 5 mm in diameter, is equipped with a tapered end for smooth insertion into the sand and has 40 small 1 mm diameter holes that allow the grout to disperse evenly into the sand. The nozzle, as shown in Figure 3, also features a cap with an 80 mm outer diameter to prevent grout leakage outside the column [16]. A valve is included to ensure accurate and controlled grouting.

2.4. Model Preparation

Laboratory testing was conducted on soft clay with an undrained shear strength of cu = 14 kPa. In a series of lab tests, remolded soil samples with varying water contents were used to determine the amount of water necessary to achieve this strength level. It was found that a 30% water content corresponded to cu = 14 kPa, as shown in the water content and cu graph in Figure 4. At this water content, the bulk unit weight (γb) was approximately 18.7 kN/m3. All tests were performed with a 30% water content. To ensure uniform moisture distribution, the wet soil was tightly sealed in polyethylene bags for one day before use. Mixing was done using a 120 L mixer. The moist clay was then layered in the container at 40 mm per layer, with any trapped air carefully removed using a 100 × 100 mm wooden tamper. Finally, the soil was covered with polyethylene to retain moisture, and a wooden board, sized to nearly match the soil bed’s surface area (700 × 700 mm), was placed on top.
Following the recommendation of [3], the clayey soil bed was subjected to a setting pressure of 5 kPa for 48 h to recover part of its strength. Additionally, undisturbed soil samples were obtained from various test bed locations using thin-walled cylinder samplers, and their properties were assessed. Besides sample collection, vane shear tests were performed at multiple points across the soil bed.

2.5. Construction of Floating Sand Columns and Grouted Columns

To properly install floating sand columns, an S/D ratio of 2.5 was used, with the guide plate positioned according to a specific spacing pattern. It has been observed that increasing the spacing between sand columns reduces the bearing pressure on the foundation. When the spacing decreases from 3.5 D to 2.5 D, the bearing capacity shows a significant increase, with only minor gains thereafter. Thus, the optimal spacing between sand columns is 2.5 D, or equivalent to 0.625 times the footing diameter [17,18]. Experimental studies by [19] indicate that the bearing capacity of composite soil improves with an increase in column length. However, this improvement becomes negligible once the column length exceeds six times its diameter. Therefore, a length-to-diameter ratio of L/D = 6 was selected.
After preparing the soil bed, the construction of the floating sand columns commenced immediately. Each sand column was installed with a spacing of 2.5 times its diameter, a diameter of 25 mm, a length-to-diameter ratio of (L/D = 6), and an area replacement ratio as (the portion of the soil that the stone column has replaced) that equaled 0.1256. The area replacement ratio (as) can be written as follows:
a s = A s A s + A c
where As = the area of a stone column’s cross-section, and Ac = the area of the clay soil surrounding the sand column.
A steel pipe was inserted into the bed at a predetermined depth, perpendicular to the surface. Using a hand-operated helical steel auger slightly smaller than the pipe’s inner diameter, clay was extracted from inside the steel pipe. As shown in Figure 5, the pipe was then carefully removed. Sand was added for the floating columns using a funnel, filling each pit to a unit weight of 15.3 kN/m3 (Dr = 15%). With a known size and density, a uniform weight of sand was maintained for all columns across all tests.
Cement mixture preparation: For the grouting process, water–cement mixtures with a w/c ratio of 1 were used, as recommended by [20,21]. Initial trial tests showed that grout penetration into soil samples was not achievable with a w/c ratio below 0.7, even with the addition of a superplasticizer. Additionally, it was observed that effective diffusion could not be achieved if the w/c ratio was significantly increased. Therefore, the optimal w/c ratio range was found to be between 0.7 and 1.0.
After adding water to the grout chamber, MasterGlenium 51 superplasticizer at 2% of the dry cement weight was added to reduce grout viscosity and prevent particle clumping, resulting in a low water-to-cement ratio [20,22]. Cement was then introduced into the mixture, and the grout chamber was securely sealed. The slurry was mixed for five minutes at 350 rpm using a mixer. Following this, the air compressor valve was opened, allowing air to enter the chamber at a pressure of 10–20 kPa [23,24]. The pneumatic air regulator was used to adjust the chamber’s pressure as needed.
The grouting tube was then inserted precisely into the bottom of the sand column, after which the grouting valve was opened to begin the injection process until completion. Upon finishing the grouting operation, the chamber and pipes were flushed with jetted water to prevent cement from hardening inside the pipes. The model was then covered with polyethylene and left to cure for three days. Figure 5c illustrates the sand columns after the grouting process was completed.

2.6. Setting up Sand Beds Reinforced with a Geogrid

Once the grouted columns were constructed, a sand bed, or sand blanket, was placed atop the soft clay and reinforced with a geogrid. The sand bed was formed by layering and compacting dry sand to achieve a relative density of 70%.
Before conducting model tests with geogrid reinforcement, it is essential to determine the values of H/B, u/B, N, b/B, and h/B to optimize the improvement in ultimate bearing capacity. Previous research on surface foundations over sand beds with multiple reinforcement layers has shown that, for specific values of h/B, N, and b/B, the bearing capacity increases with u/B and reaches its maximum at an optimal u/B ratio [23,25,26,27]. In a 2015 study by Asakereh and Ahmadi, it was found that increasing the depth of reinforcement significantly enhanced the bearing capacity. As u/B rises, the bearing capacity ratio (BCR) initially increases, peaking when the reinforcement depth reaches half the footing width (u/B = 0.5).
According to prior studies, the ideal vertical spacing between geogrid layers in multi-layer reinforced sand is h/B = 0.25 [26]. An experimental study on geotextile-reinforced earth slabs by [28] tested square footings on sand, demonstrating that BCR declined as u/B increased and that bearing capacity did not significantly improve beyond three reinforcement layers, corresponding to an influence depth of d = 1B. For u/B, h/B, and b/B ratios of 0.5, 0.25, and 3, respectively, only a minimal BCR improvement was noted, with further increases in the reinforcement length ratio (b/B) beyond three layers, and with u/B and h/B ratios of 0.25 each.
In all cited studies, the bearing capacity ratio (BCR) was consistently higher in reinforced soils compared to unreinforced soils.
Based on these findings and the study’s footing width (B = 100 mm), the following parameters were selected for the current tests: u/B = 0.5, h/B = 0.25, b/B = 3, H/B = 1 and 1.5, and N = 2. Figure 6 provides a schematic diagram of the laboratory setup.
The drill hammer is attached to a 300 × 300 × 5 mm steel plate, forming the vibratory compactor, as shown in Figure 7a, to achieve the target relative density and ensure consistent compaction across the model. For each compaction step, a 50 mm layer of sand, corresponding to a predetermined weight, is added to the steel container. With a selected relative density of 70%, as previously specified, the necessary weight, unit weight, and sand volume to reach this density are pre-calculated. The geogrid is then placed at the designated depth and width. Upon completing the final layer, the top surface is leveled and smoothed to achieve a flat surface. The model’s upper surface is subsequently positioned to make contact with the square footing. The geogrid reinforcement used in this setup is shown in Figure 7b.
As outlined in Table 5 in the test series, this study involved conducting seven experimental model tests. In each test, footing settlement was permitted to reach 40 mm before unloading. A computer system was utilized to continuously record data on load and deformation throughout the testing process.

3. Results and Discussion

The primary aim of this laboratory study was to compare the effects of various key elements on bearing capacity enhancement, including reinforcing layers, sand beds, and grouted sand columns. In all model tests, failure was defined, following Terzaghi (1947) as cited by [29], as the stress needed to produce a settlement equal to 10% of the model footing width.
The bearing capacity ratios (BCRs) for various values of H/B ratios across all model tests under different reinforcement conditions are summarized in Table 6. It is calculated as the ratio of the bearing capacity (q) of reinforced soil (qreinforced) to that of unreinforced soil (qunreinforced) at specific s/B ratios, where s/B represents the footing settlement to footing width ratio and the BCR represents the percentage improvement ratio, providing a clear indication of the efficiency of the reinforcement technique used, which can be represented by the equation below:
B C R = q r e i n f .   _   q u n r e i n f . q u n r e i n f . × 100
Additionally, the settlement reduction ratio (St/Sunt)—the ratio of settlement in treated soil to that in untreated soil under the same applied pressure—is used to demonstrate the reduction in settlement achieved by the model tests.

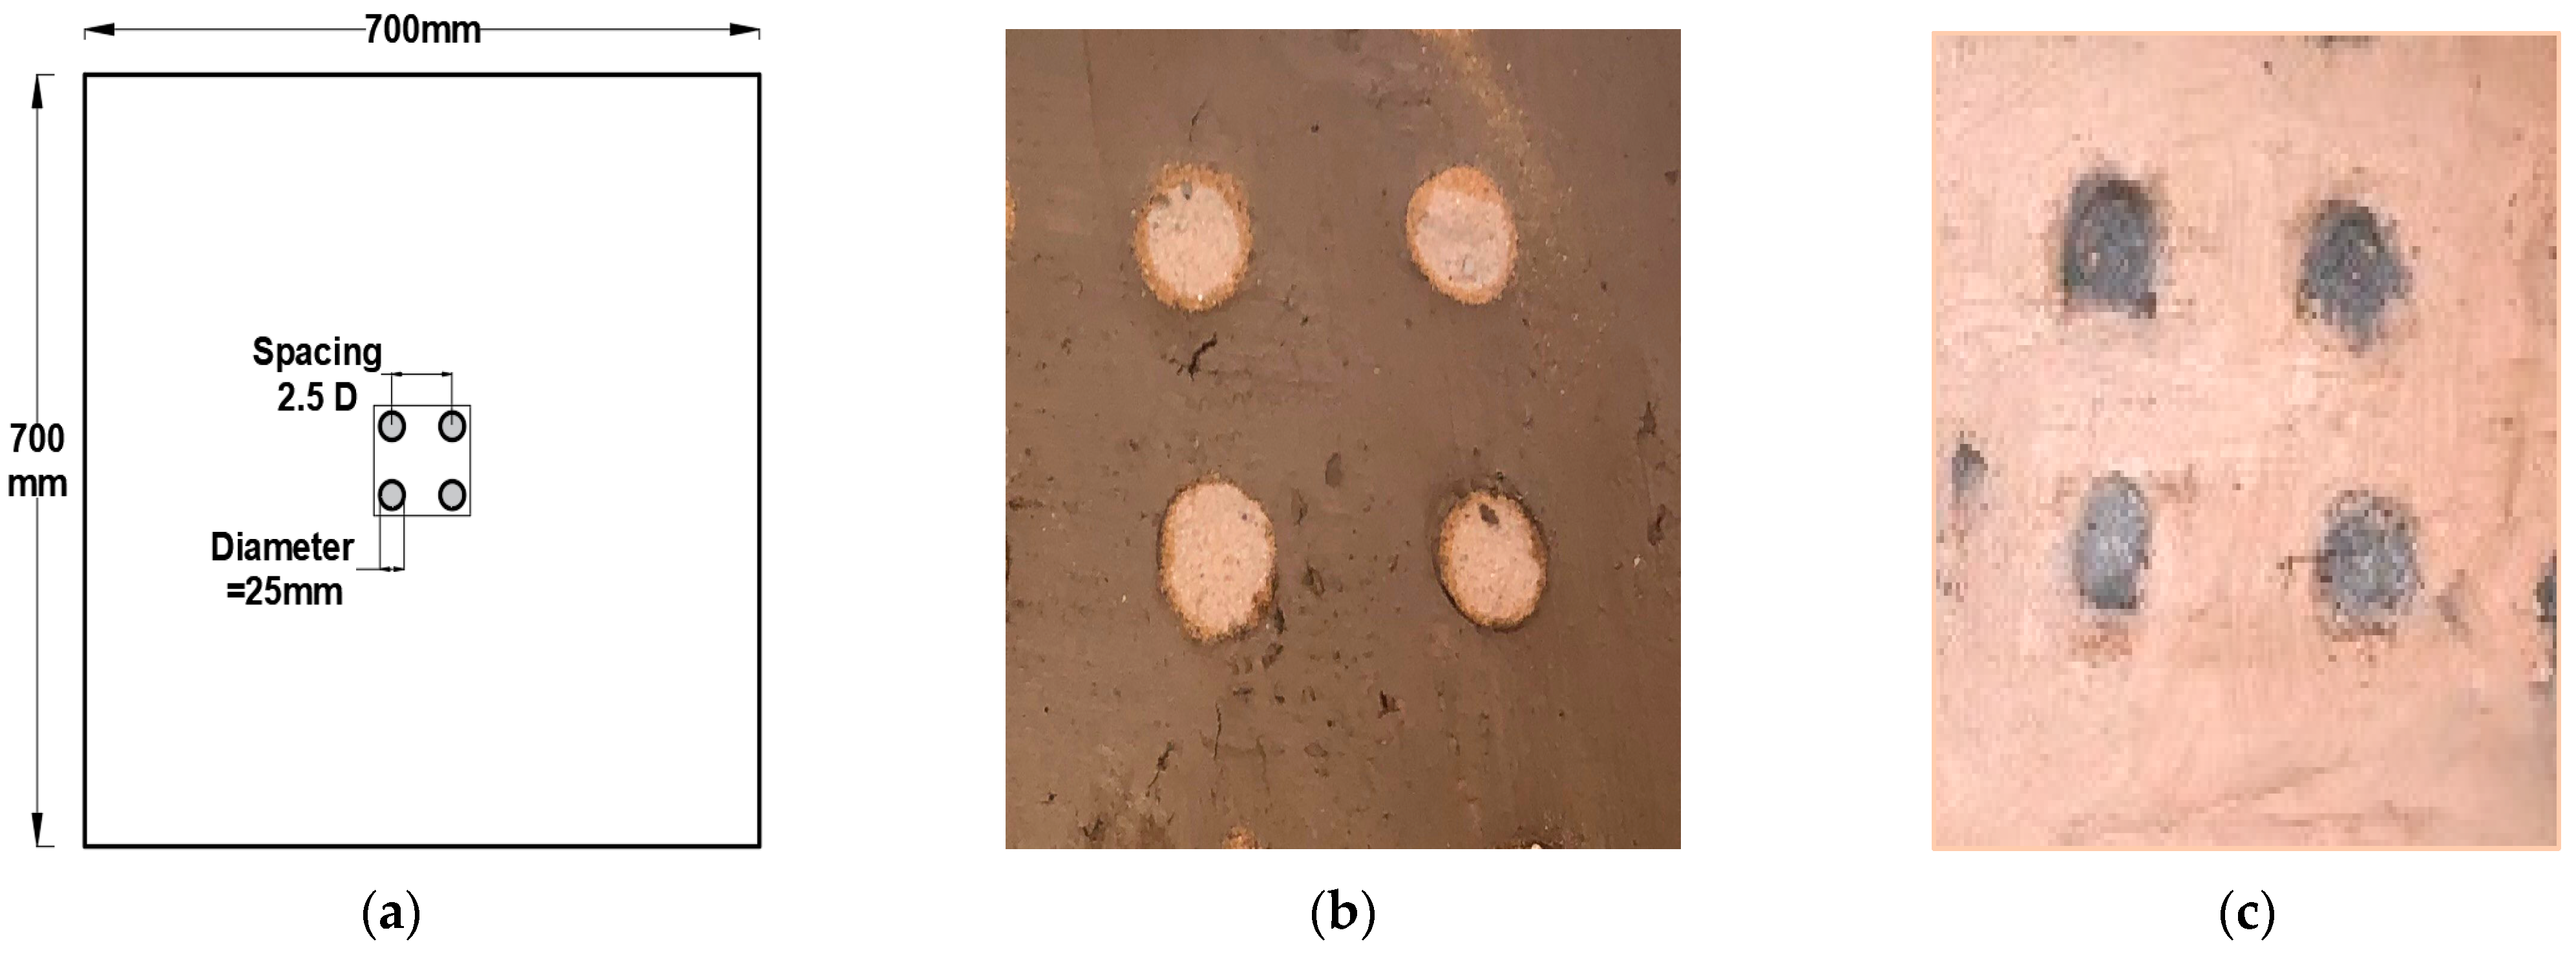
3.1. Effect of a Group of Four Floating Sand Columns (4SC), Grouted and Non-Grouted, Without a Sand Blanket

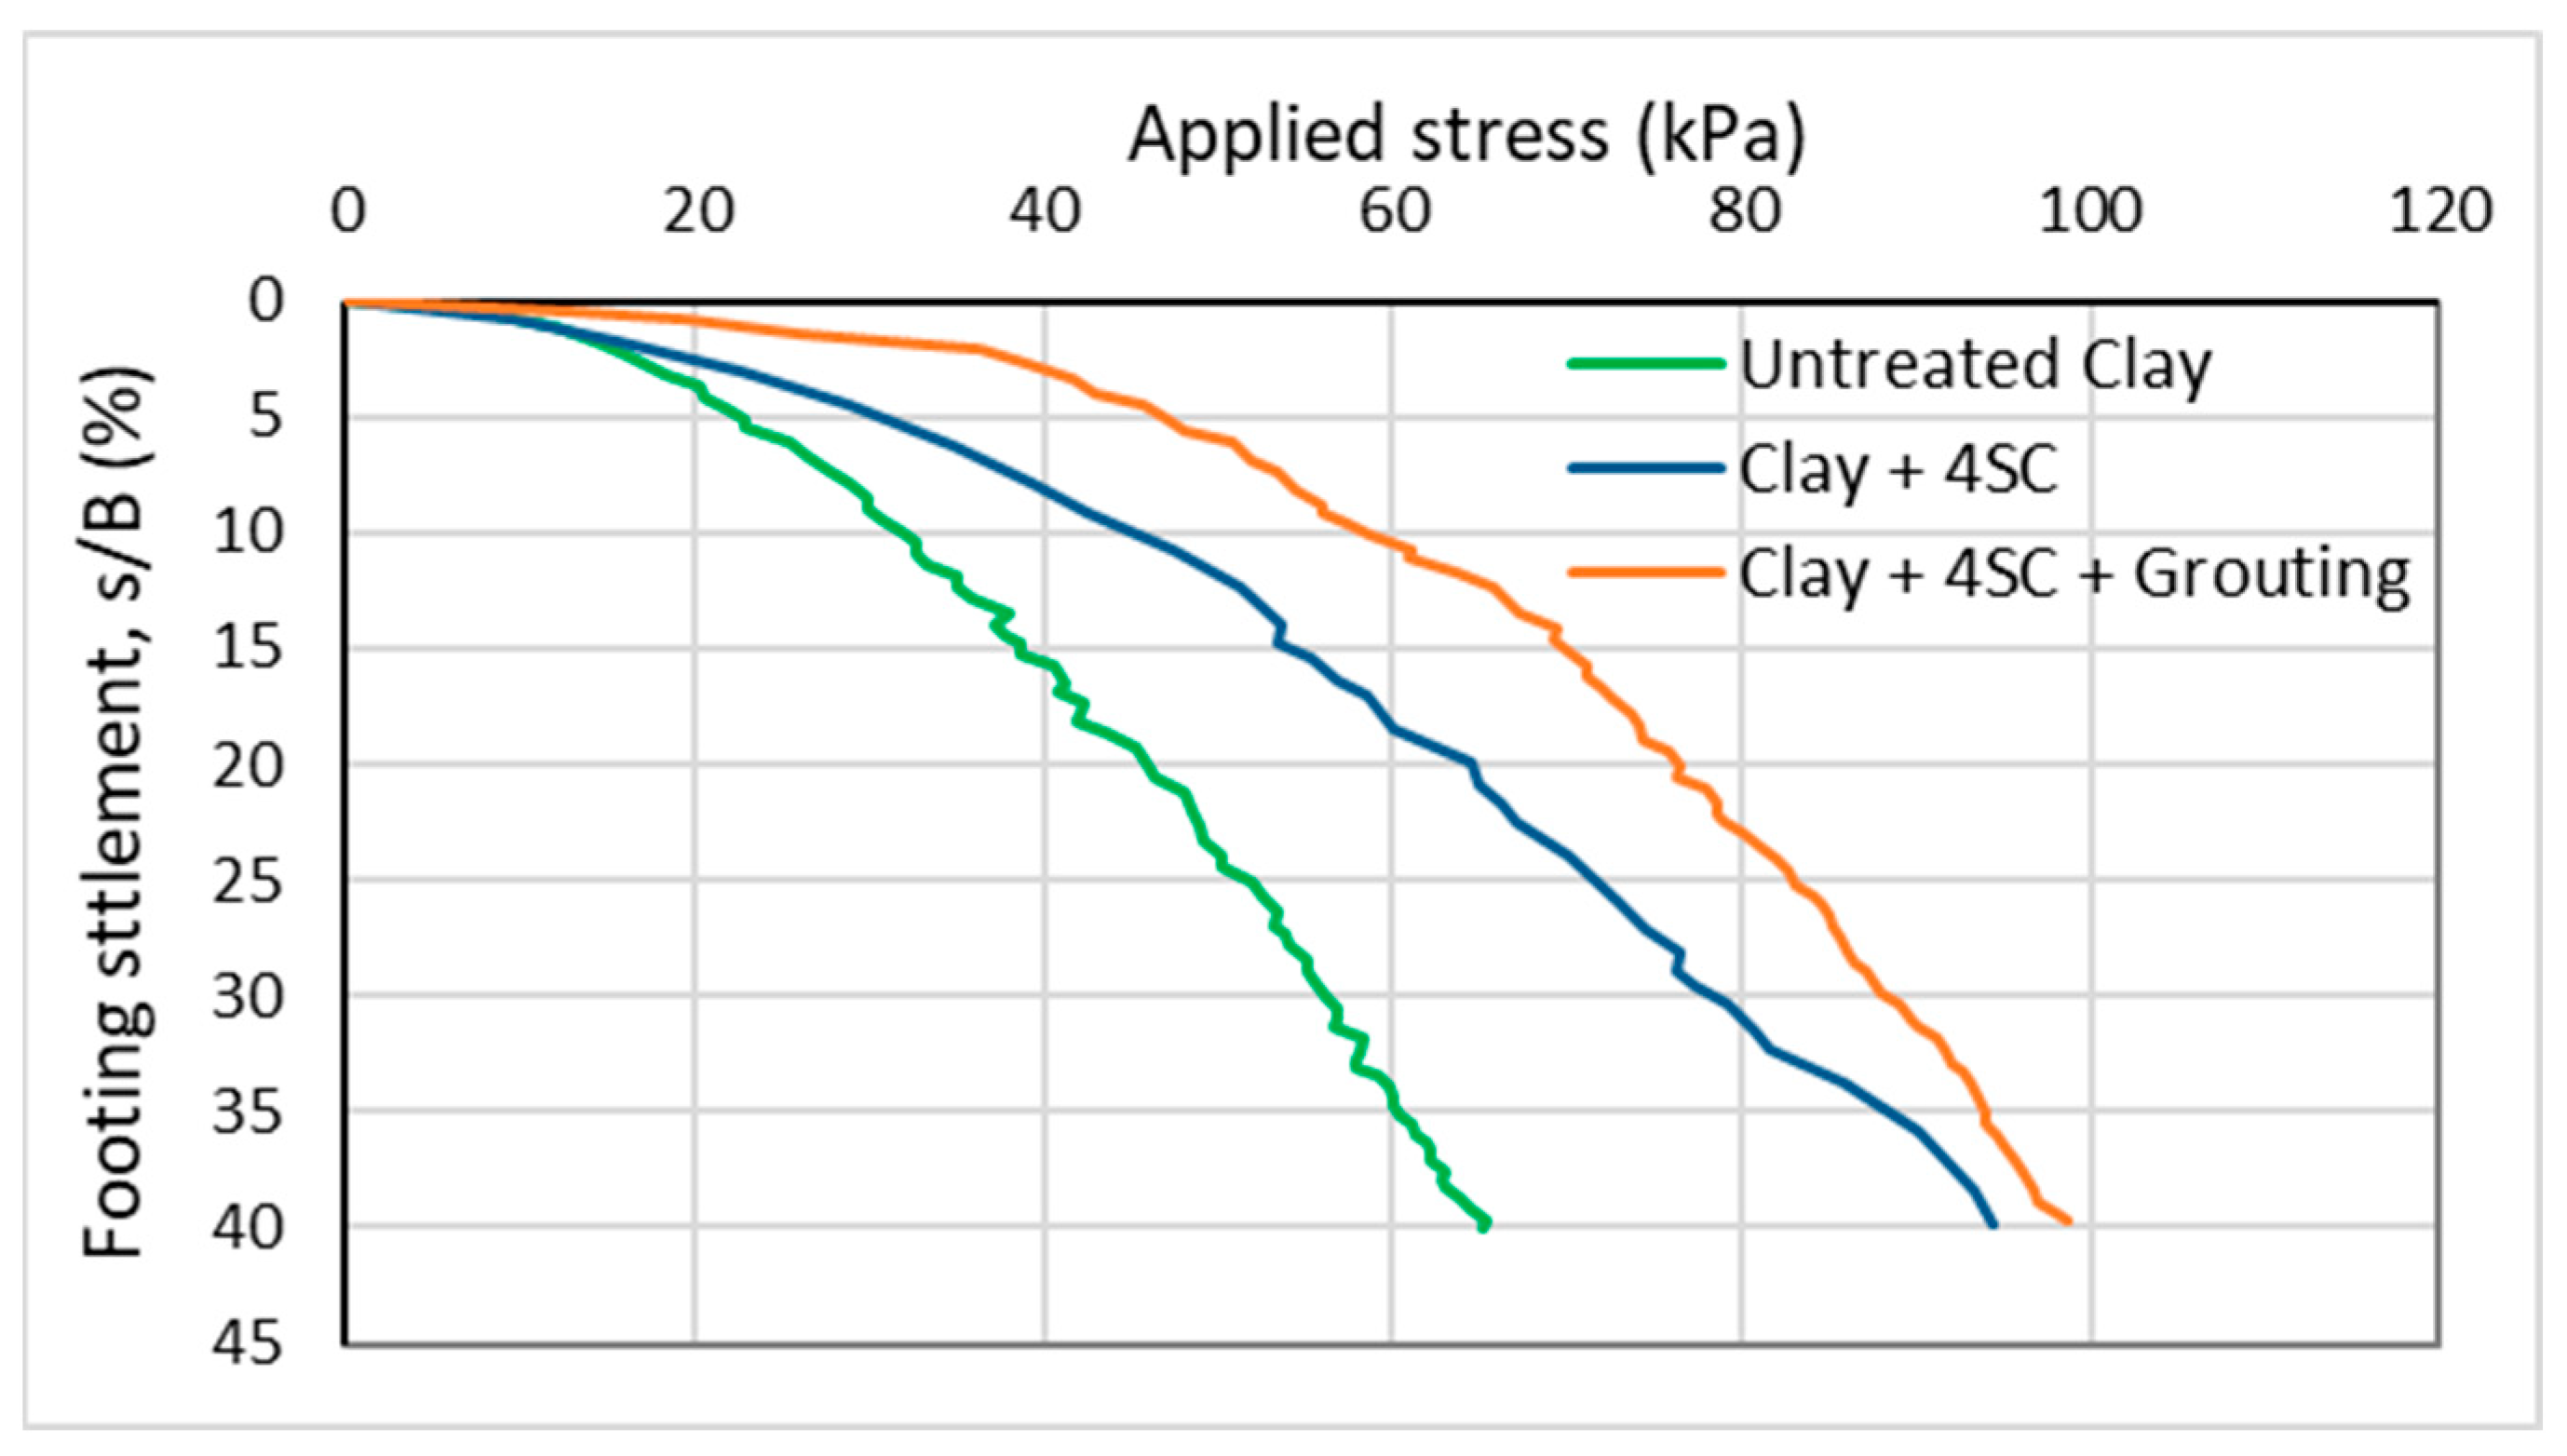
Figure 8 shows the relationship between the applied surface pressure (q) and footing settlement (s/B) (%) for model tests on untreated clay, sand columns, and grouted sand columns.
For the untreated clay bed, the pressure–settlement response shows a steady increase in slope without a clear peak, with a bearing pressure at failure of 31 kPa, equivalent to a 10% settlement ratio (s/B).
In the next model, four floating-type sand columns were constructed on a saturated soil bed with a spacing ratio of S/D = 2.5, positioned directly beneath a footing (100 mm × 100 mm) and tested under compressive loading. The bearing capacity at failure reached 47 kPa, compared to 31 kPa for untreated clay, indicating a 50% improvement in bearing capacity, as illustrated in Figure 9. This improvement can be attributed to the sand columns’ ability to distribute loads over a broader area, reducing direct pressure on the clay soil, enhancing compression resistance, and decreasing settlement. The columns act as “control elements” in deformation, transferring portions of the load to greater depths within the clay, thereby relieving pressure on the softer layers.
In this experiment, no sand blanket was placed between the foundation and the sand columns, so the columns relied solely on their inherent properties to distribute pressure and minimize settlement. Although the absence of a blanket might impact the uniformity of load distribution, the results indicated that the columns still provided substantial improvement in the soil’s bearing properties.
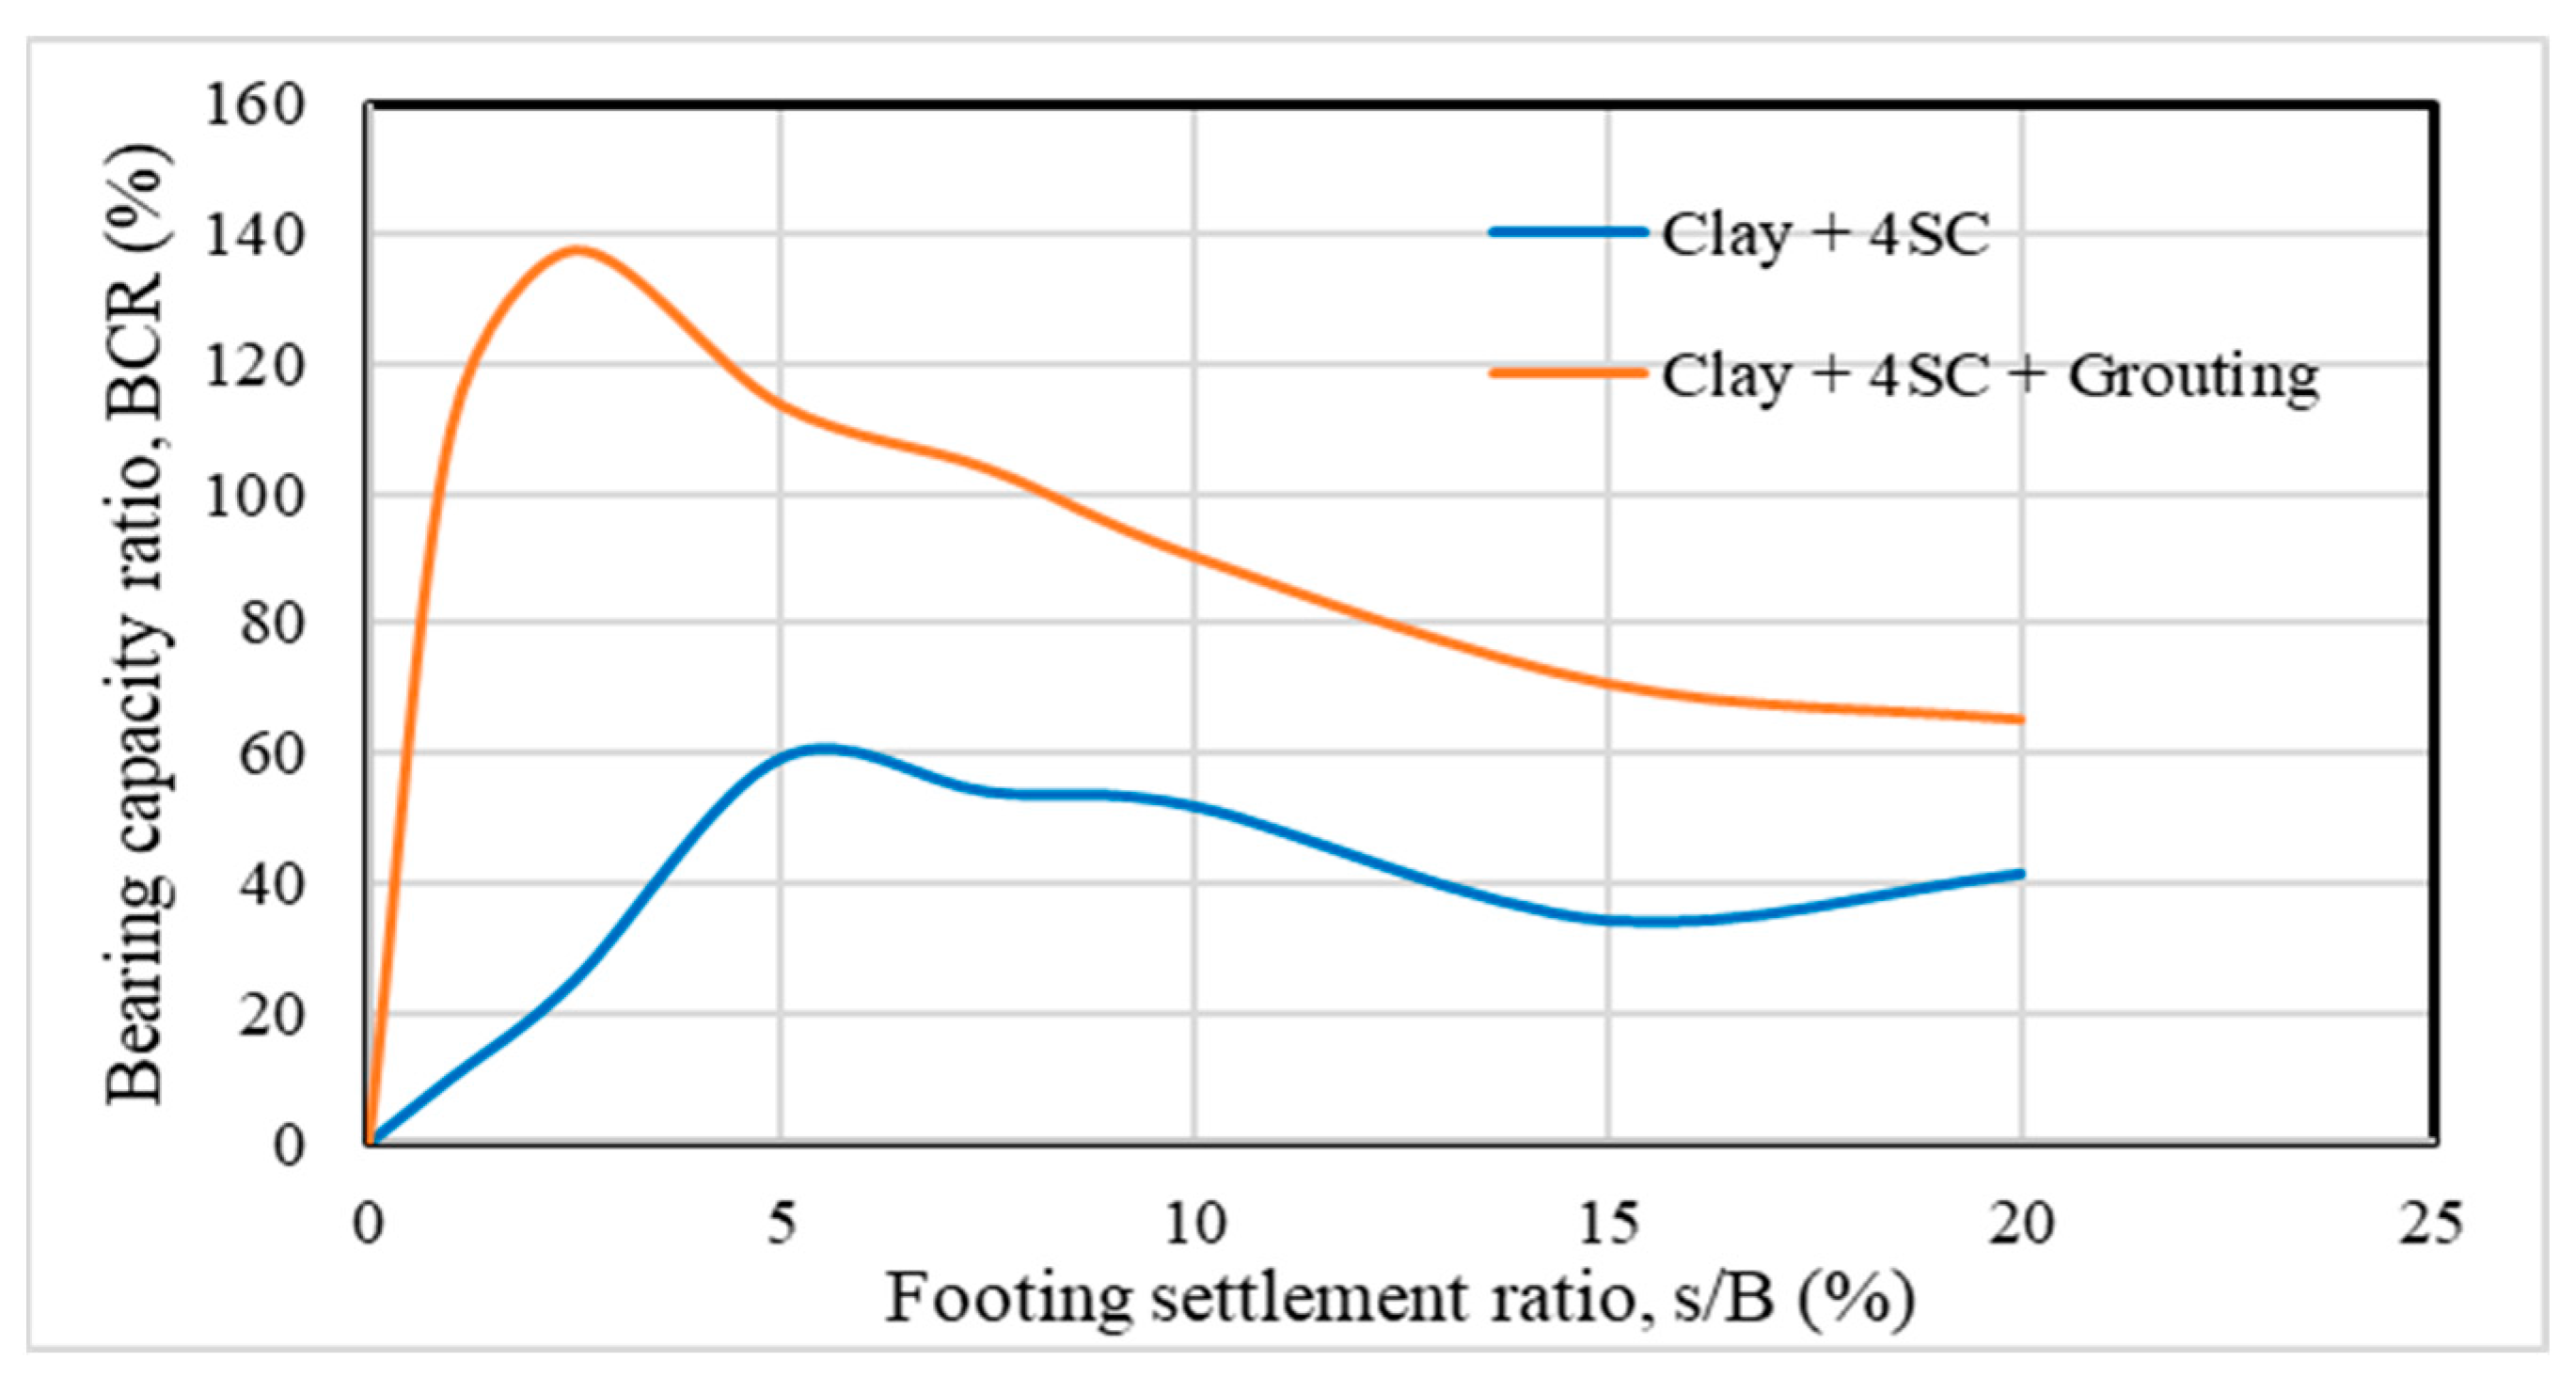
A third test was conducted using four floating sand columns grouted with cement. These columns were also positioned beneath a footing (100 mm × 100 mm) and tested under compressive loading. The bearing capacity at failure for soil treated with grouted columns reached 59 kPa, achieving a BCR of 90%, as shown in Figure 9. This improvement was achieved solely by the grouted sand columns positioned directly beneath the footing, without the addition of a sand blanket layer, demonstrating further enhancement in soil improvement. 
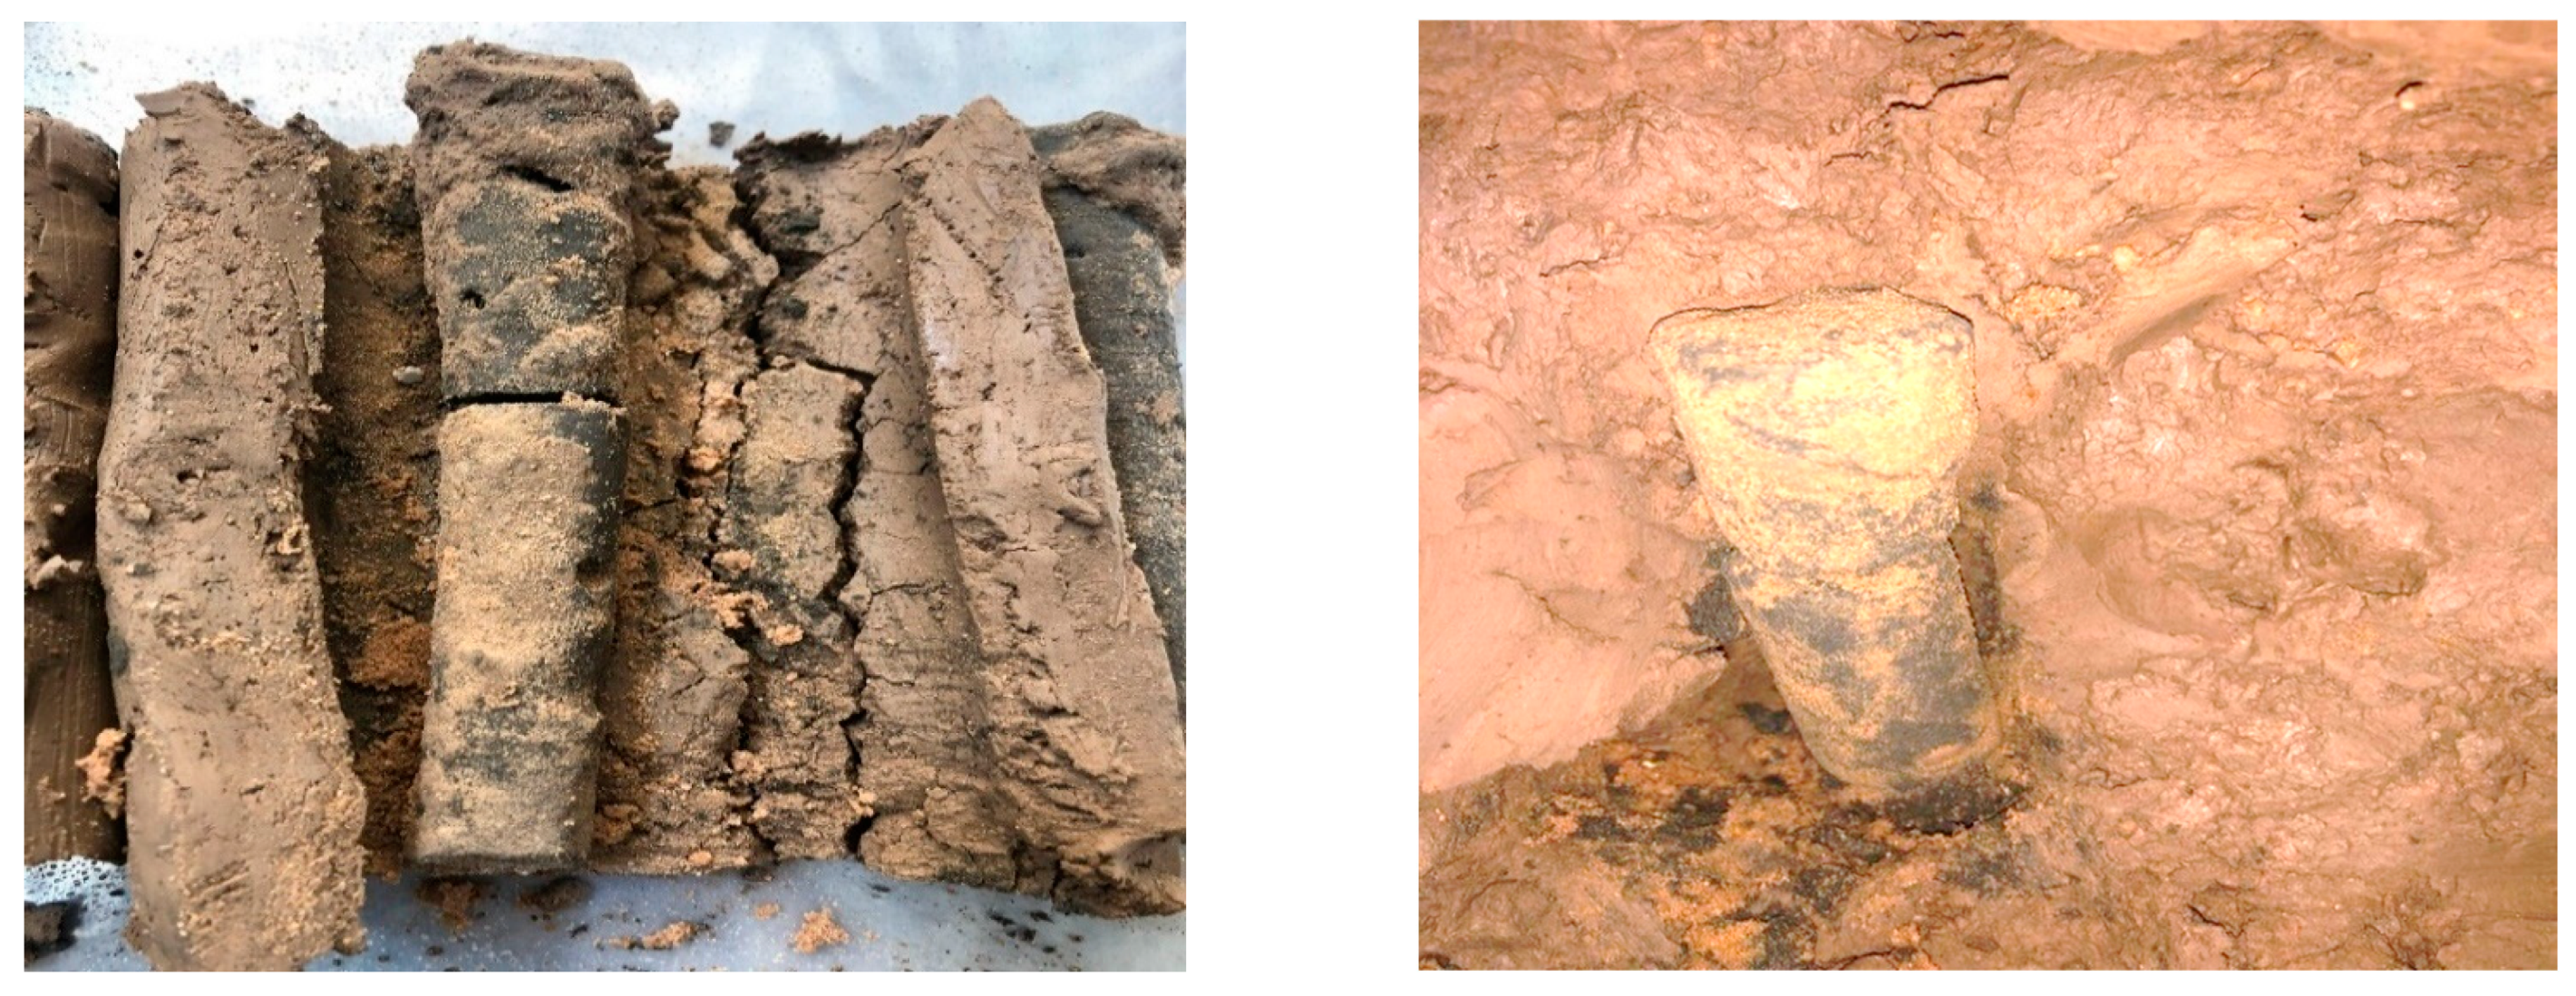
Figure 10 shows the configuration of the cement-grouted sand columns.
The interlocking effect, when using a geogrid, plays a significant role in providing remarkable resistance. The soil particles lock the apertures of the geogrid sheet and prevent its lateral movement, providing additional shearing resistance [30].
Fattah et al. [31] concluded that during grouting, contact between particles is prevented, which causes a reduction in friction. It was observed that there was a reduction in the soaking cohesion component in comparison with the unsoaked case, while a small reduction in the friction component was observed. This reduction may be attributed to the destruction of the interparticle cemented bonds (due to the presence of grouting liquid and gypsum) in the particle system. These results from the specimens indicated that the void ratio was changed after grouting.

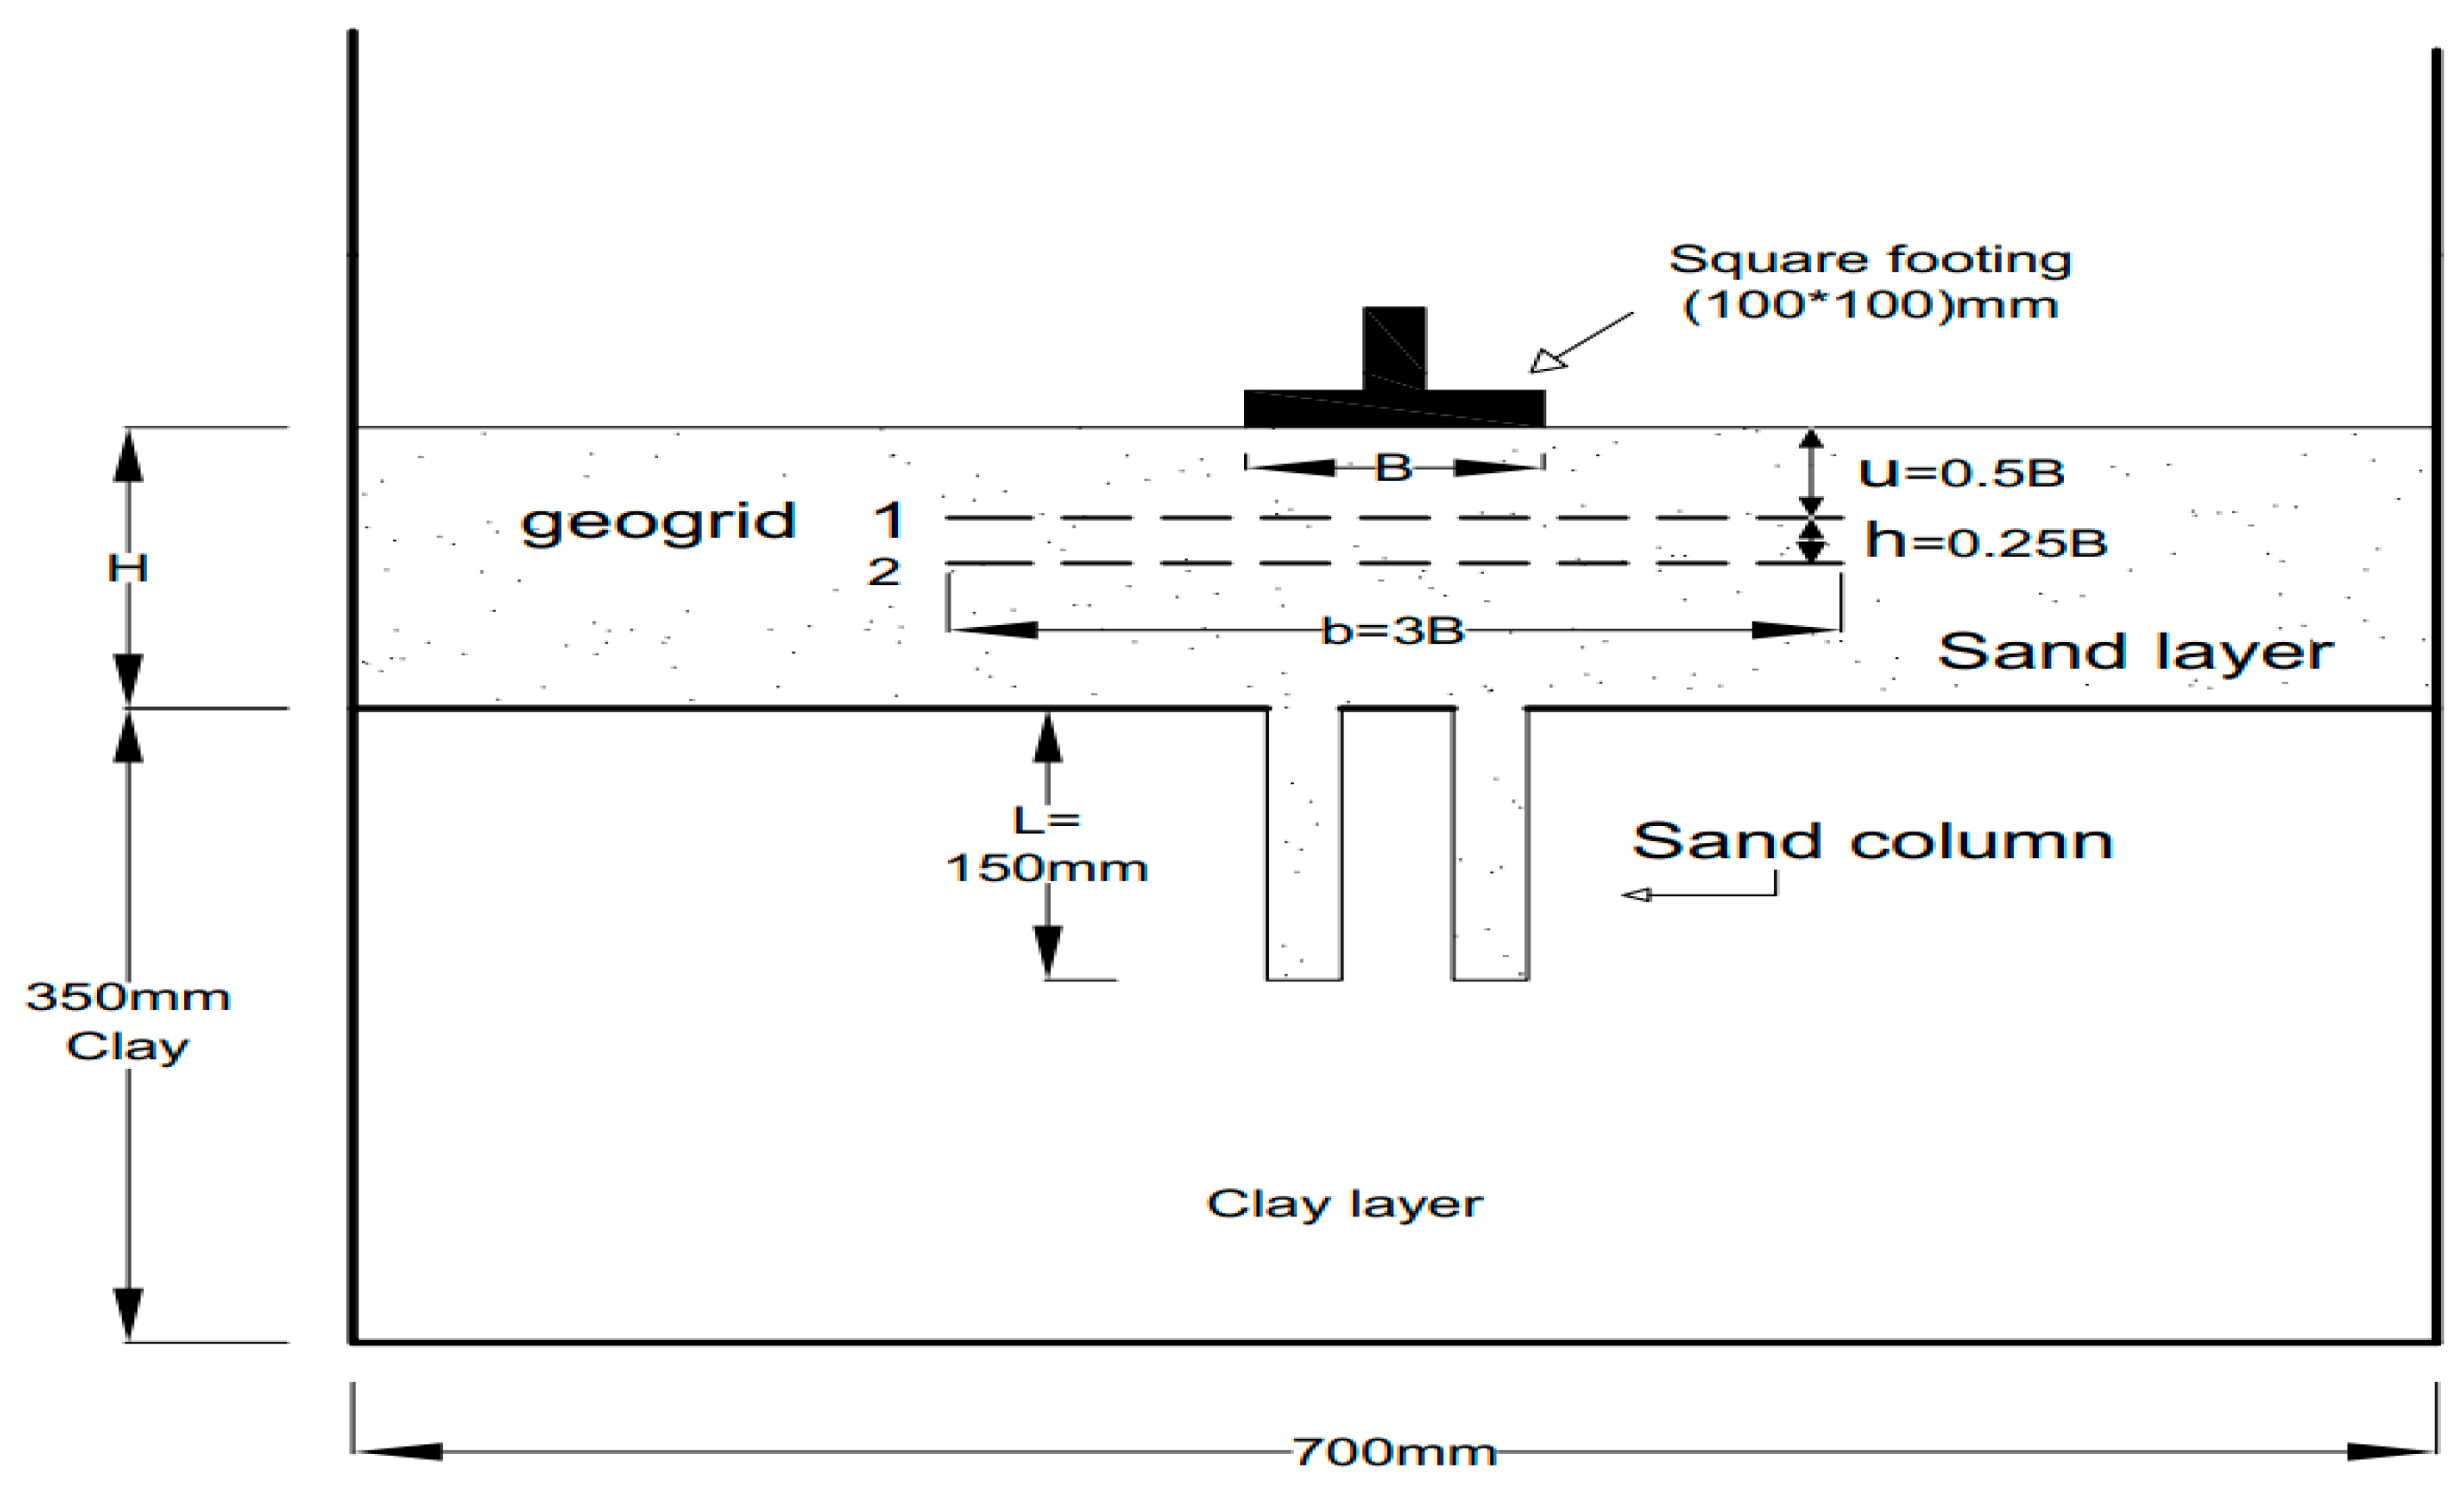
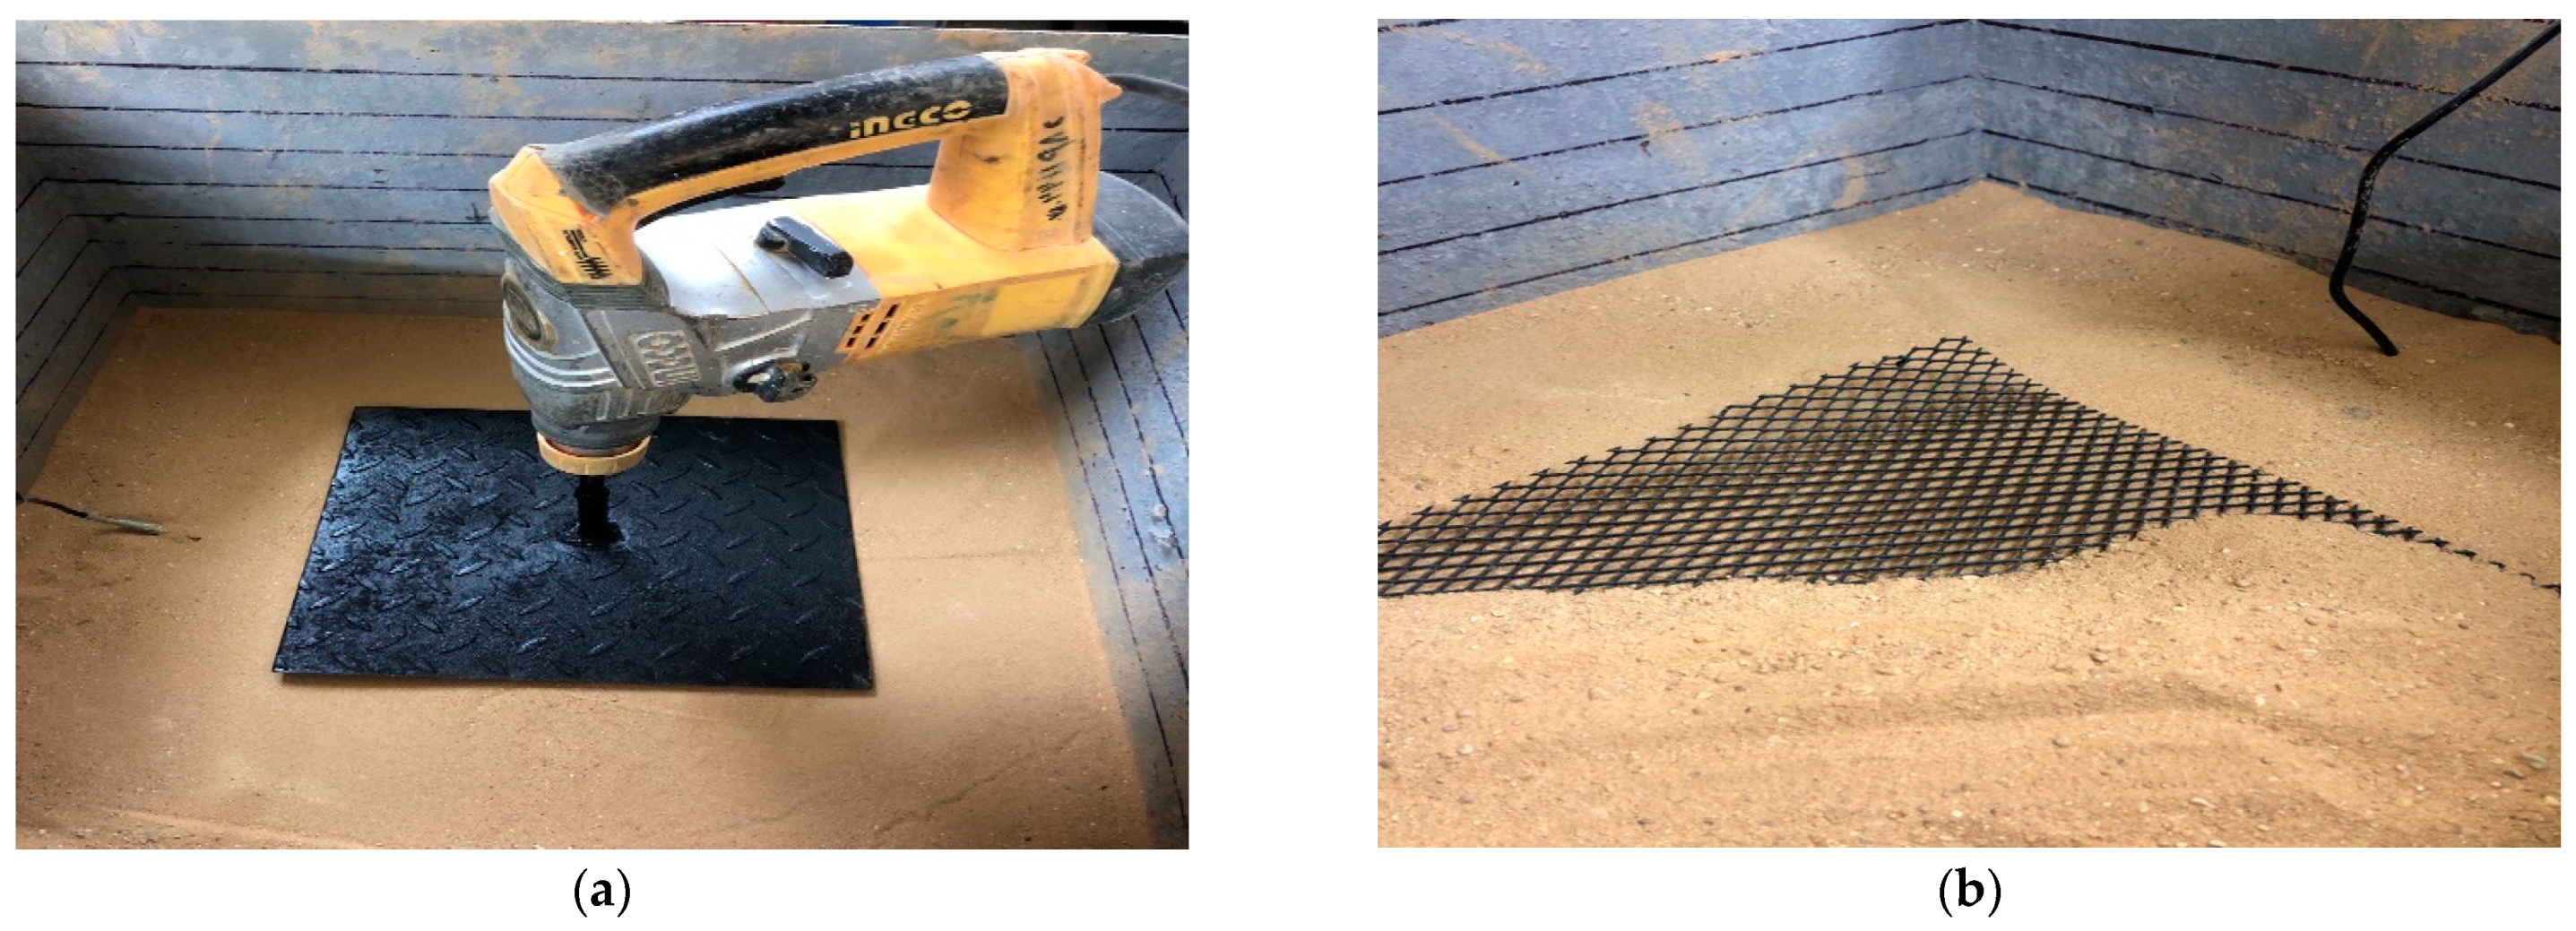
3.2. Model Tests on Soil Treated with Floating Sand Columns and a Geogrid-Reinforced Sand Bed (GRSB)

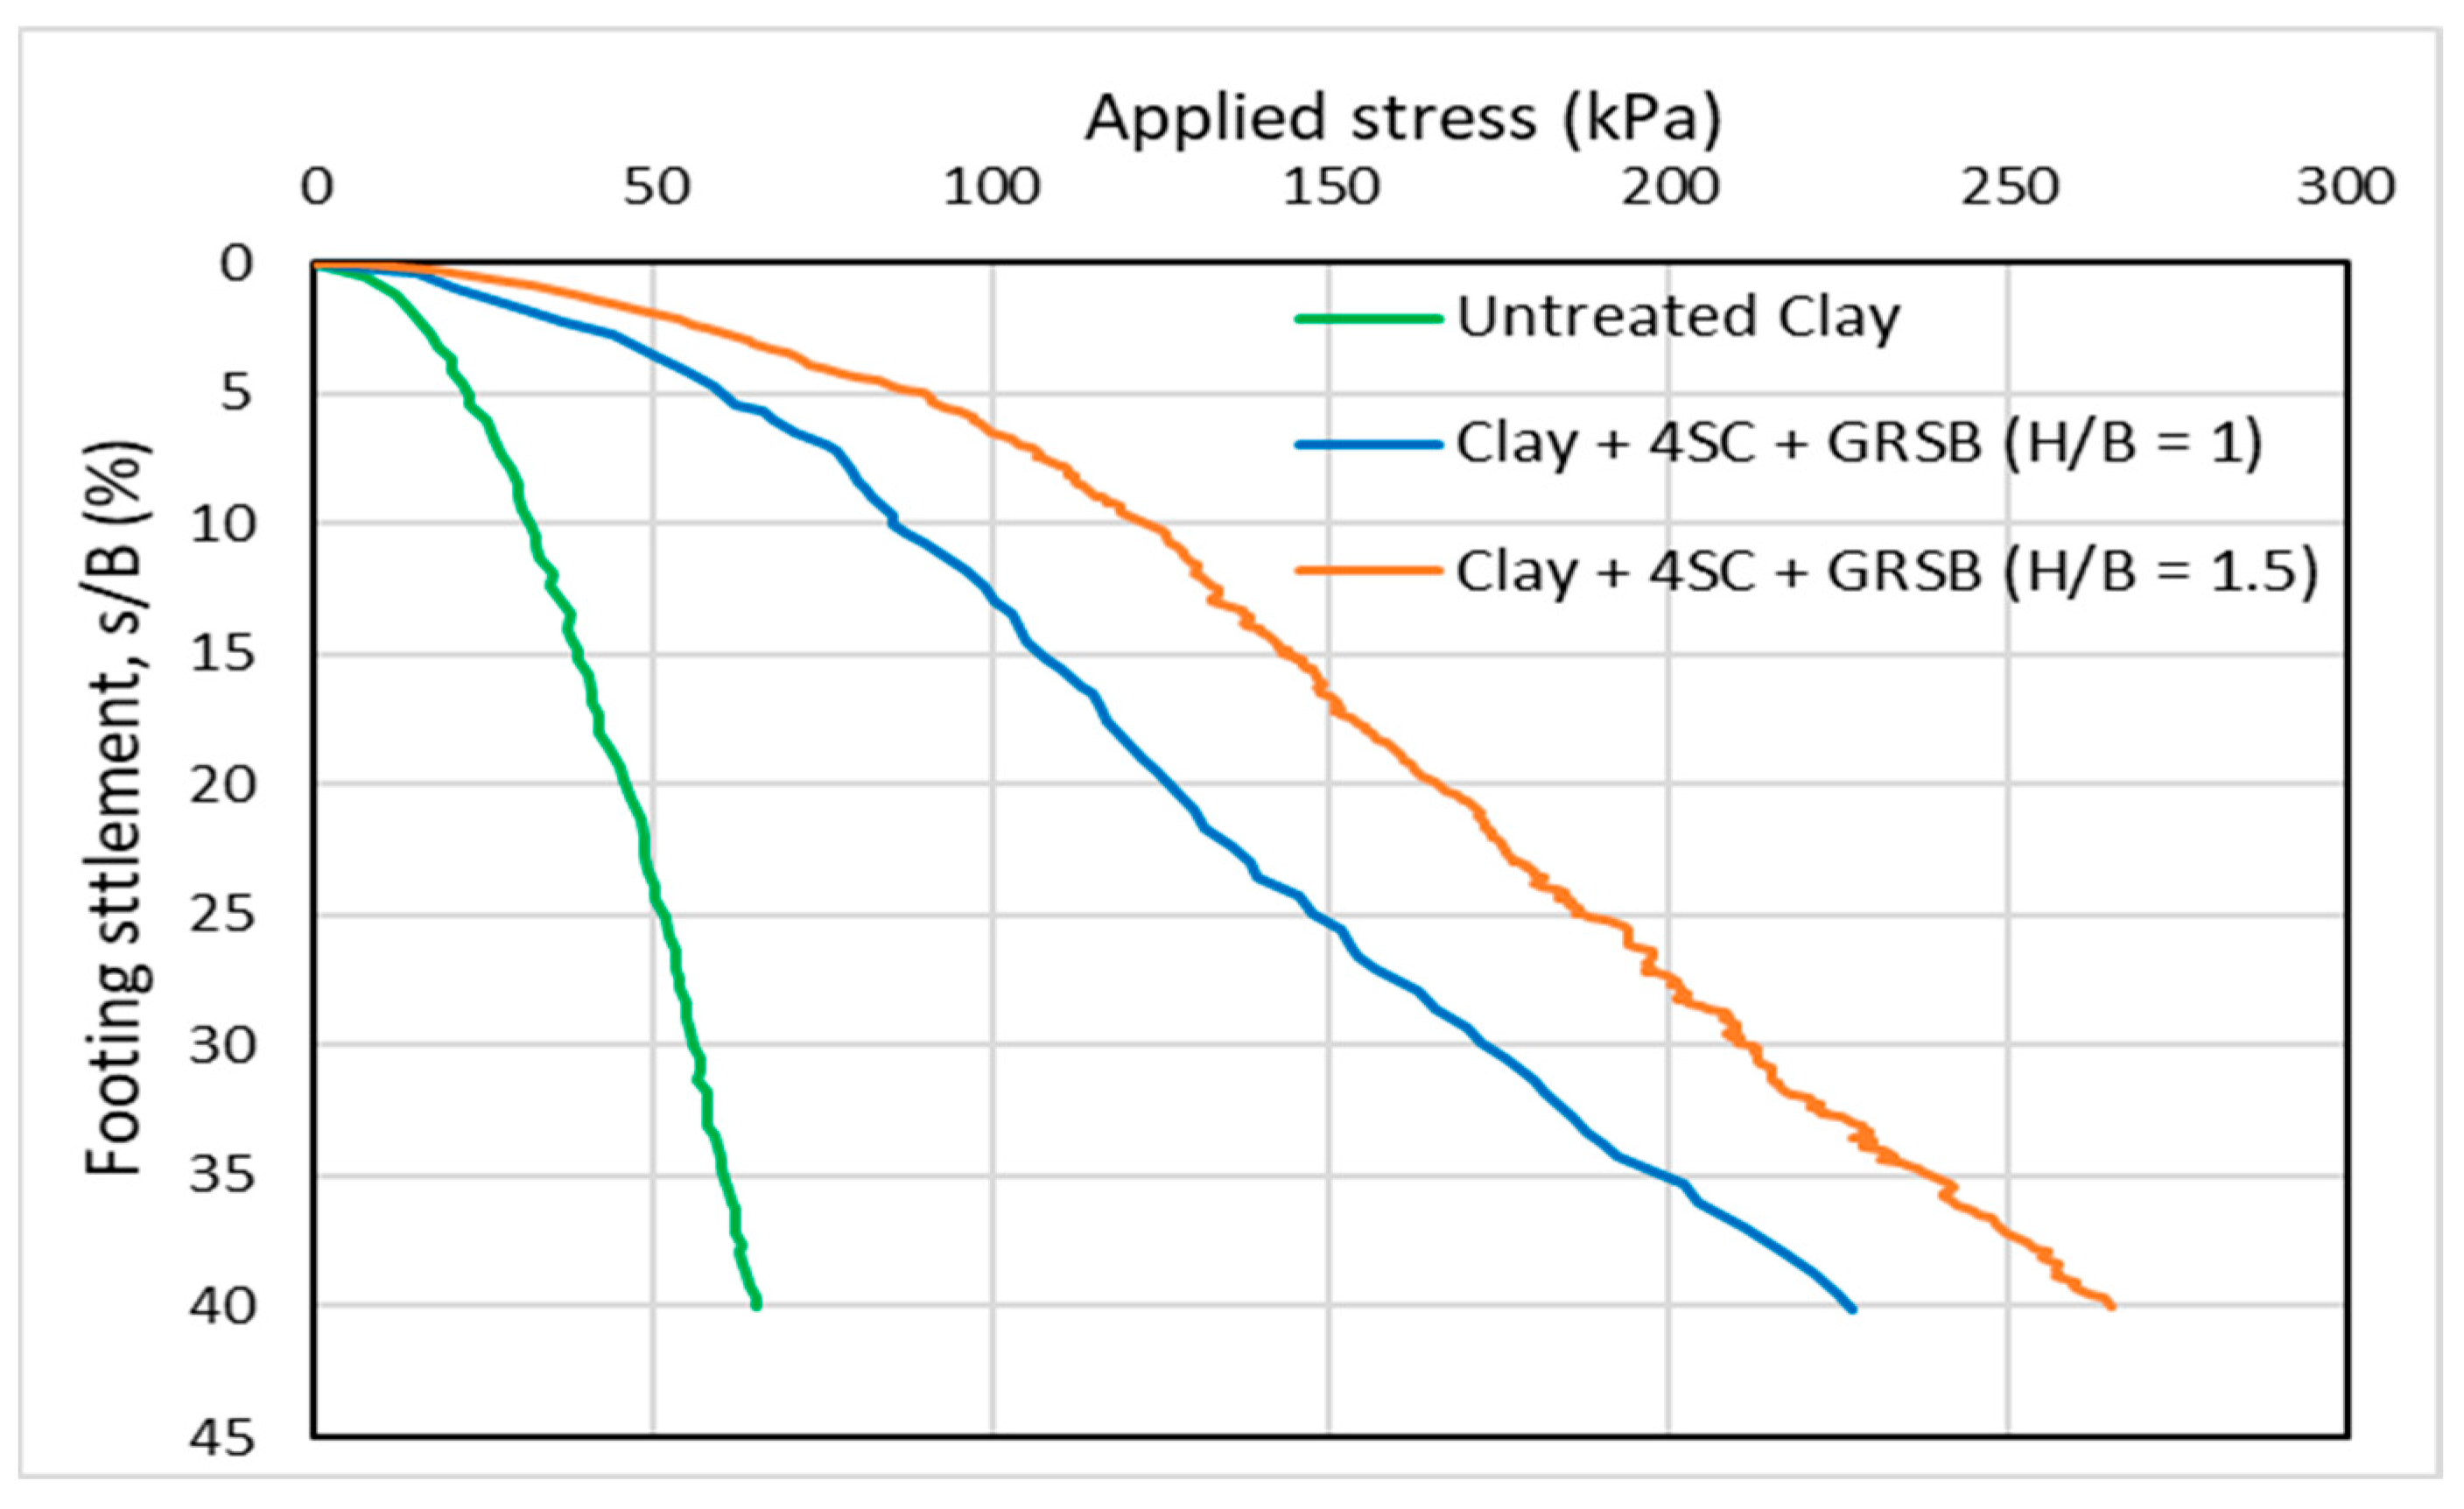
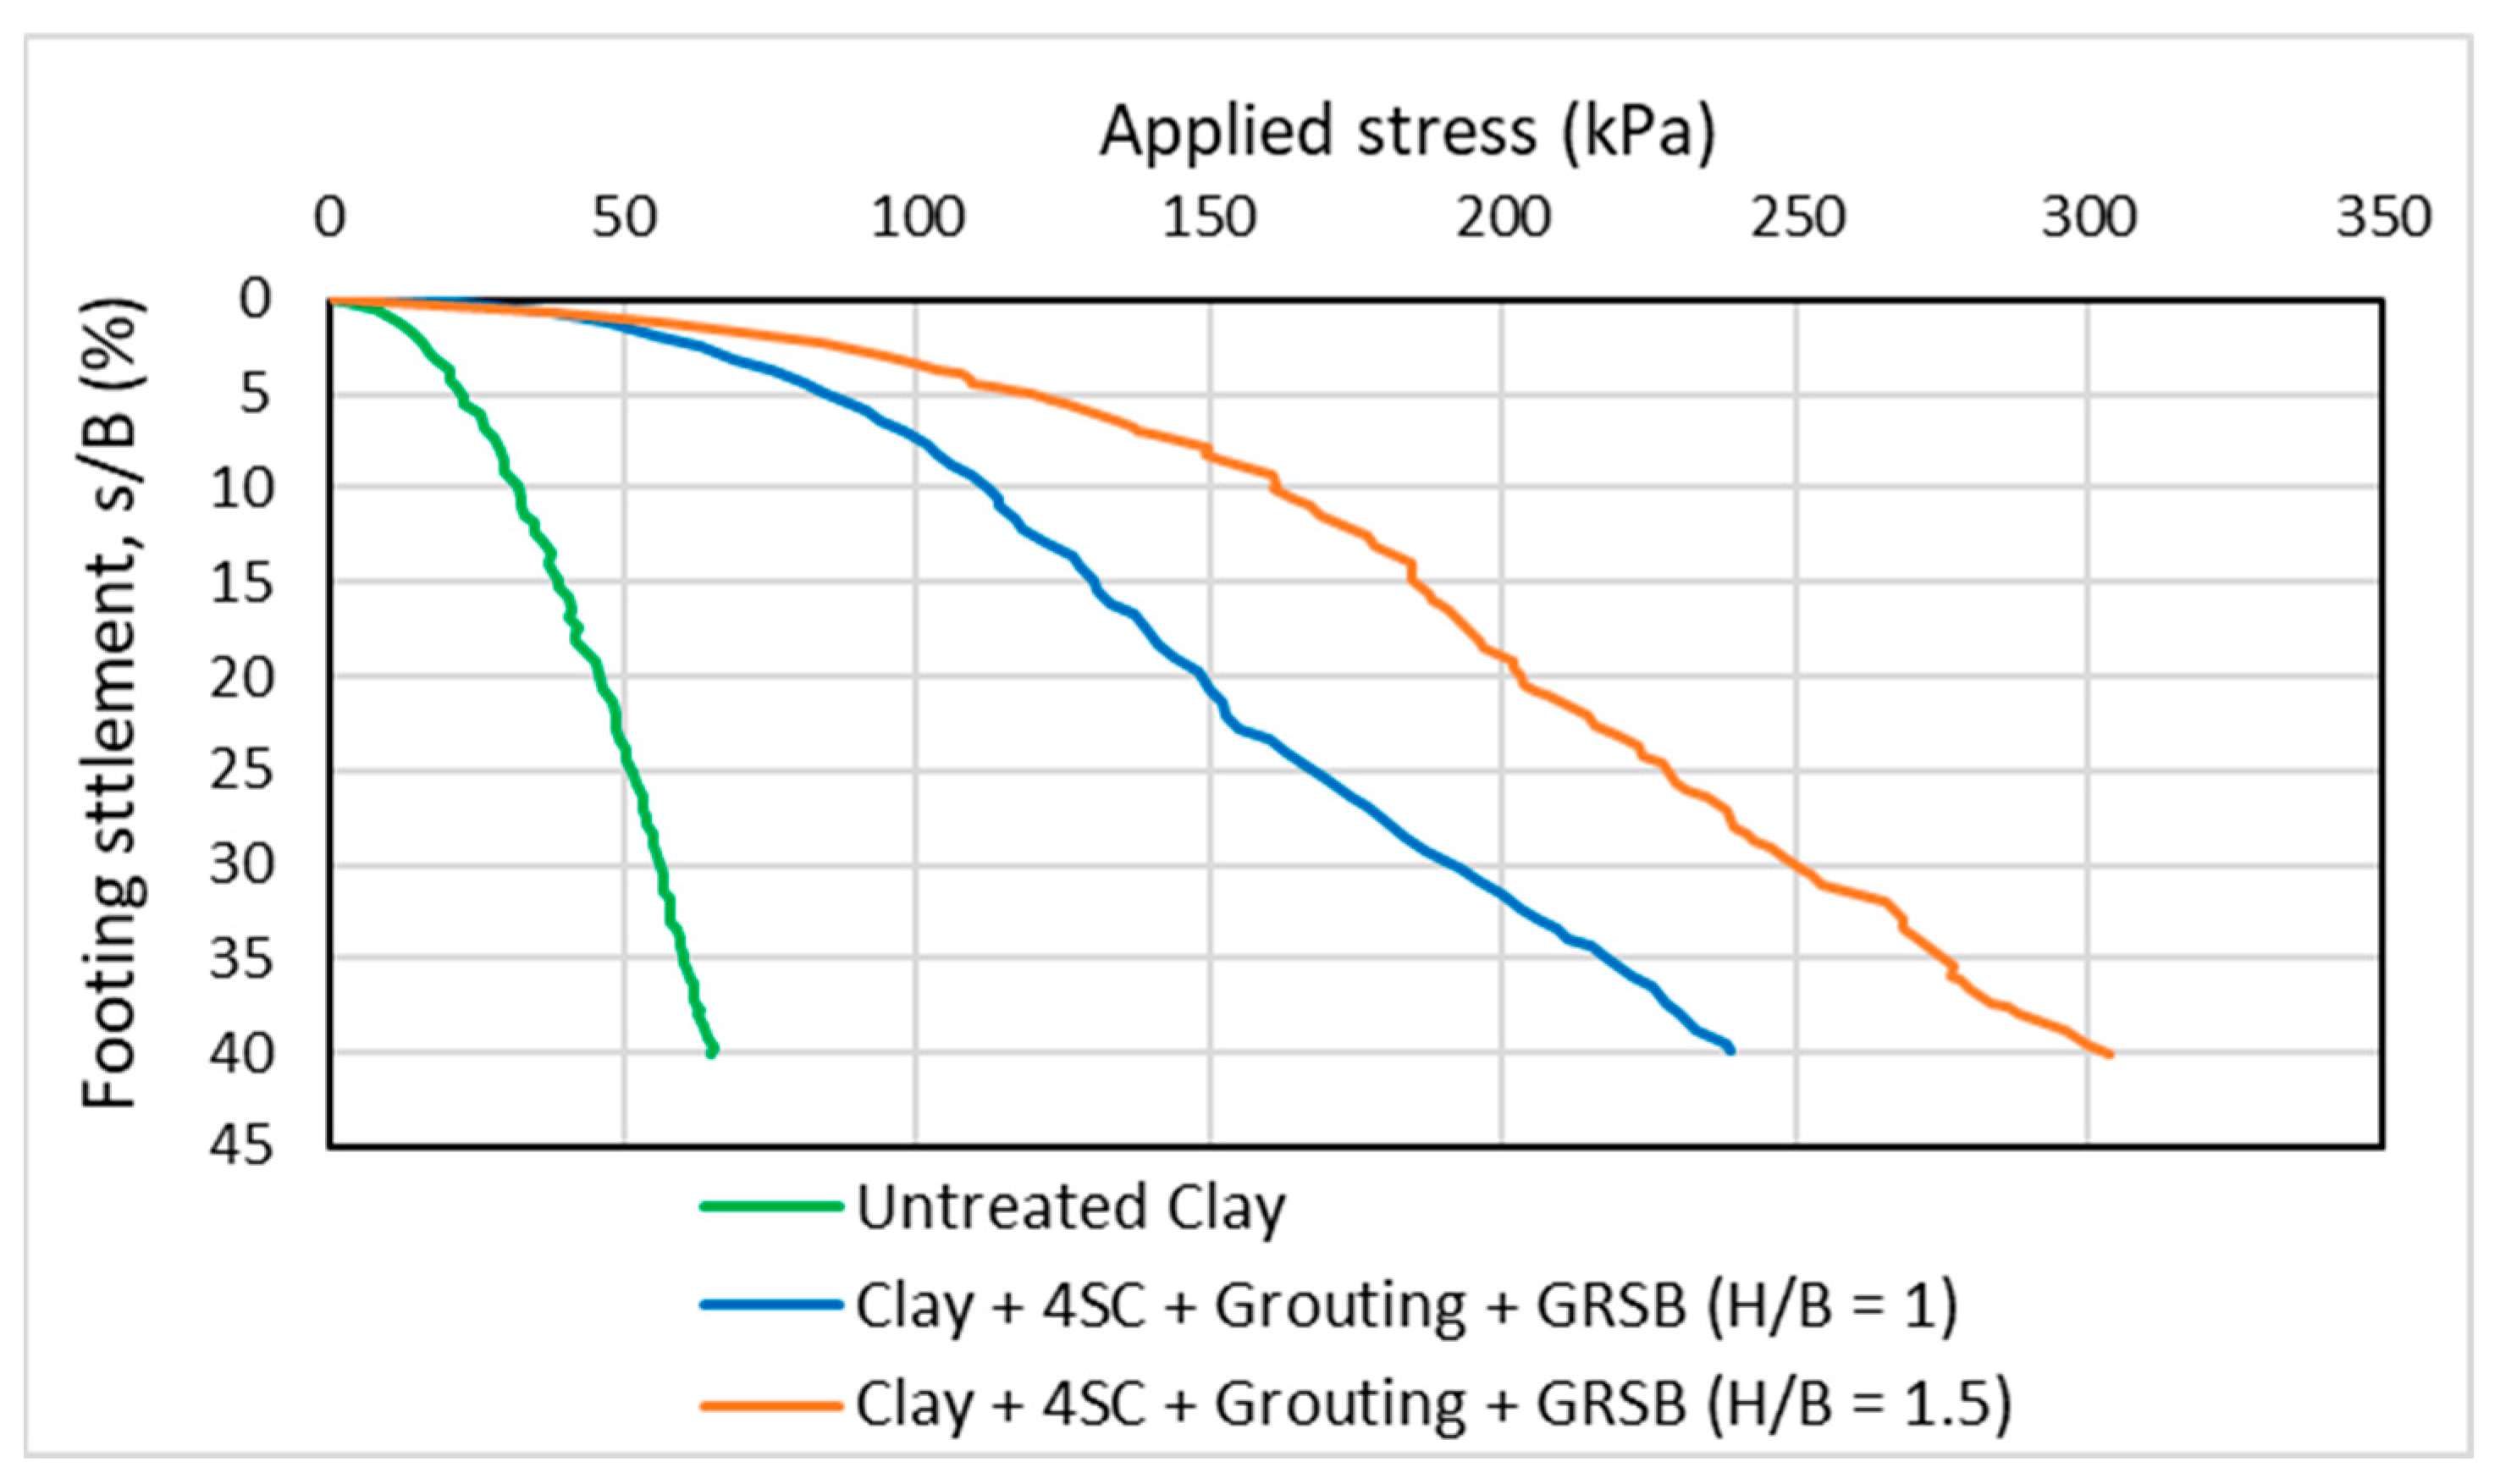
Figure 11 illustrates the response of bearing pressure to footing settlement for a geogrid-reinforced sand cushion placed over a clay base supported by sand columns. The results indicate that introducing a sand cushion with a thickness of H/B = 1 reinforced with a geogrid achieves a bearing pressure of 86 kPa. When the thickness of the sand cushion was increased to H/B = 1.5, the bearing pressure reached up to 123 kPa.
Additionally, the lower slope observed in the pressure–settlement response suggests a marked increase in the stiffness of the foundation bed. This improvement is attributed to the enhanced resistance to deformation provided by the sand columns, resulting from the mobilization of stiffness and friction within the sand, which collectively support the sand columns and the geogrid-reinforced layer. The combined application of sand columns and sand cushions proves more effective than using either method independently; reinforcing the sand cushion with geogrid significantly enhances the load-bearing efficiency of both the sand columns and the cushion. Furthermore, the interlocking effect and high tensile strength of the transverse ribs of the geogrid contribute to the load-carrying capacity of the soil.
In very soft soils, unreinforced stone columns may not support significant loads due to low lateral confinement. In such situations, additional confinement can be provided by encasing the stone columns with geosynthetics. The encasement increases the bearing capacity, increases stiffness, and reduces lateral bulging of stone columns even in very soft soil.
These findings align with the results of a three-dimensional numerical analysis conducted by [32] who examined sand reinforced both with and without the addition of a geogrid. The study focused on encased and conventional columns positioned beneath a sand cushion and demonstrated that a sand cushion supported by traditional stone columns and encased geogrid columns resulted in significant improvements. Specifically, incorporating a geogrid layer within the sand cushion and installing geogrid-encased sand columns yielded an improvement of up to 148% in comparison to untreated cohesive soil.
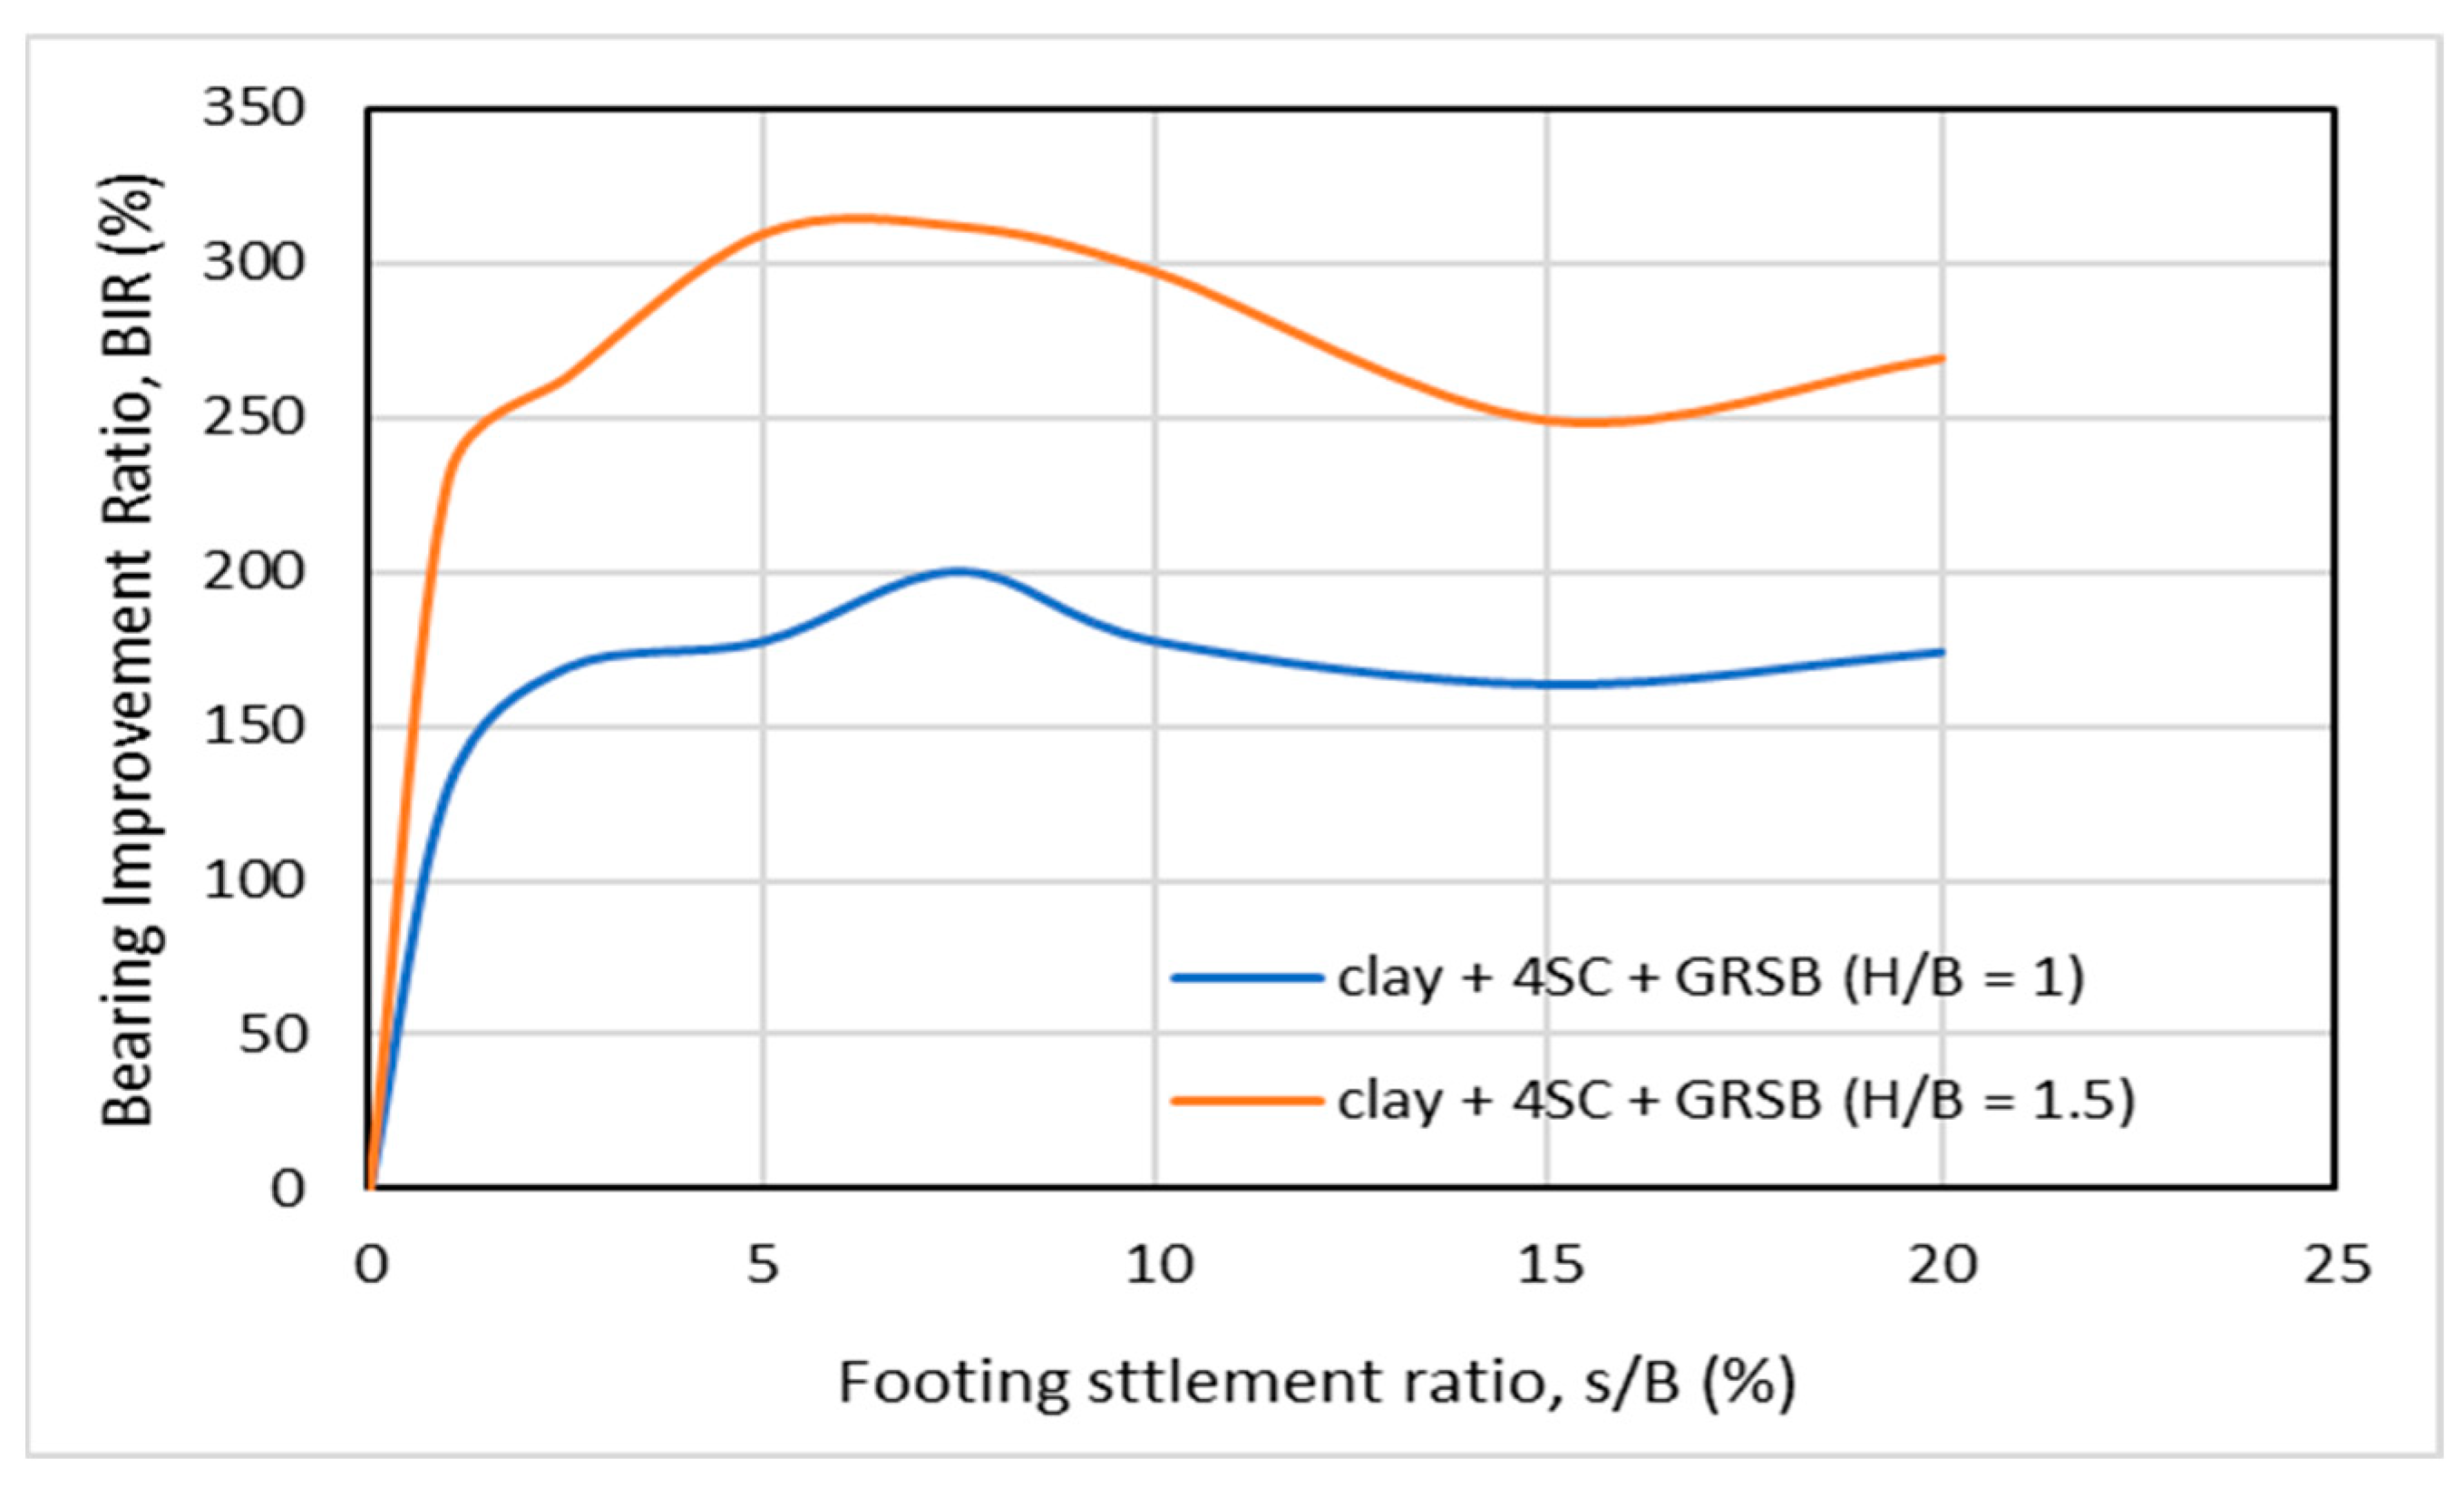
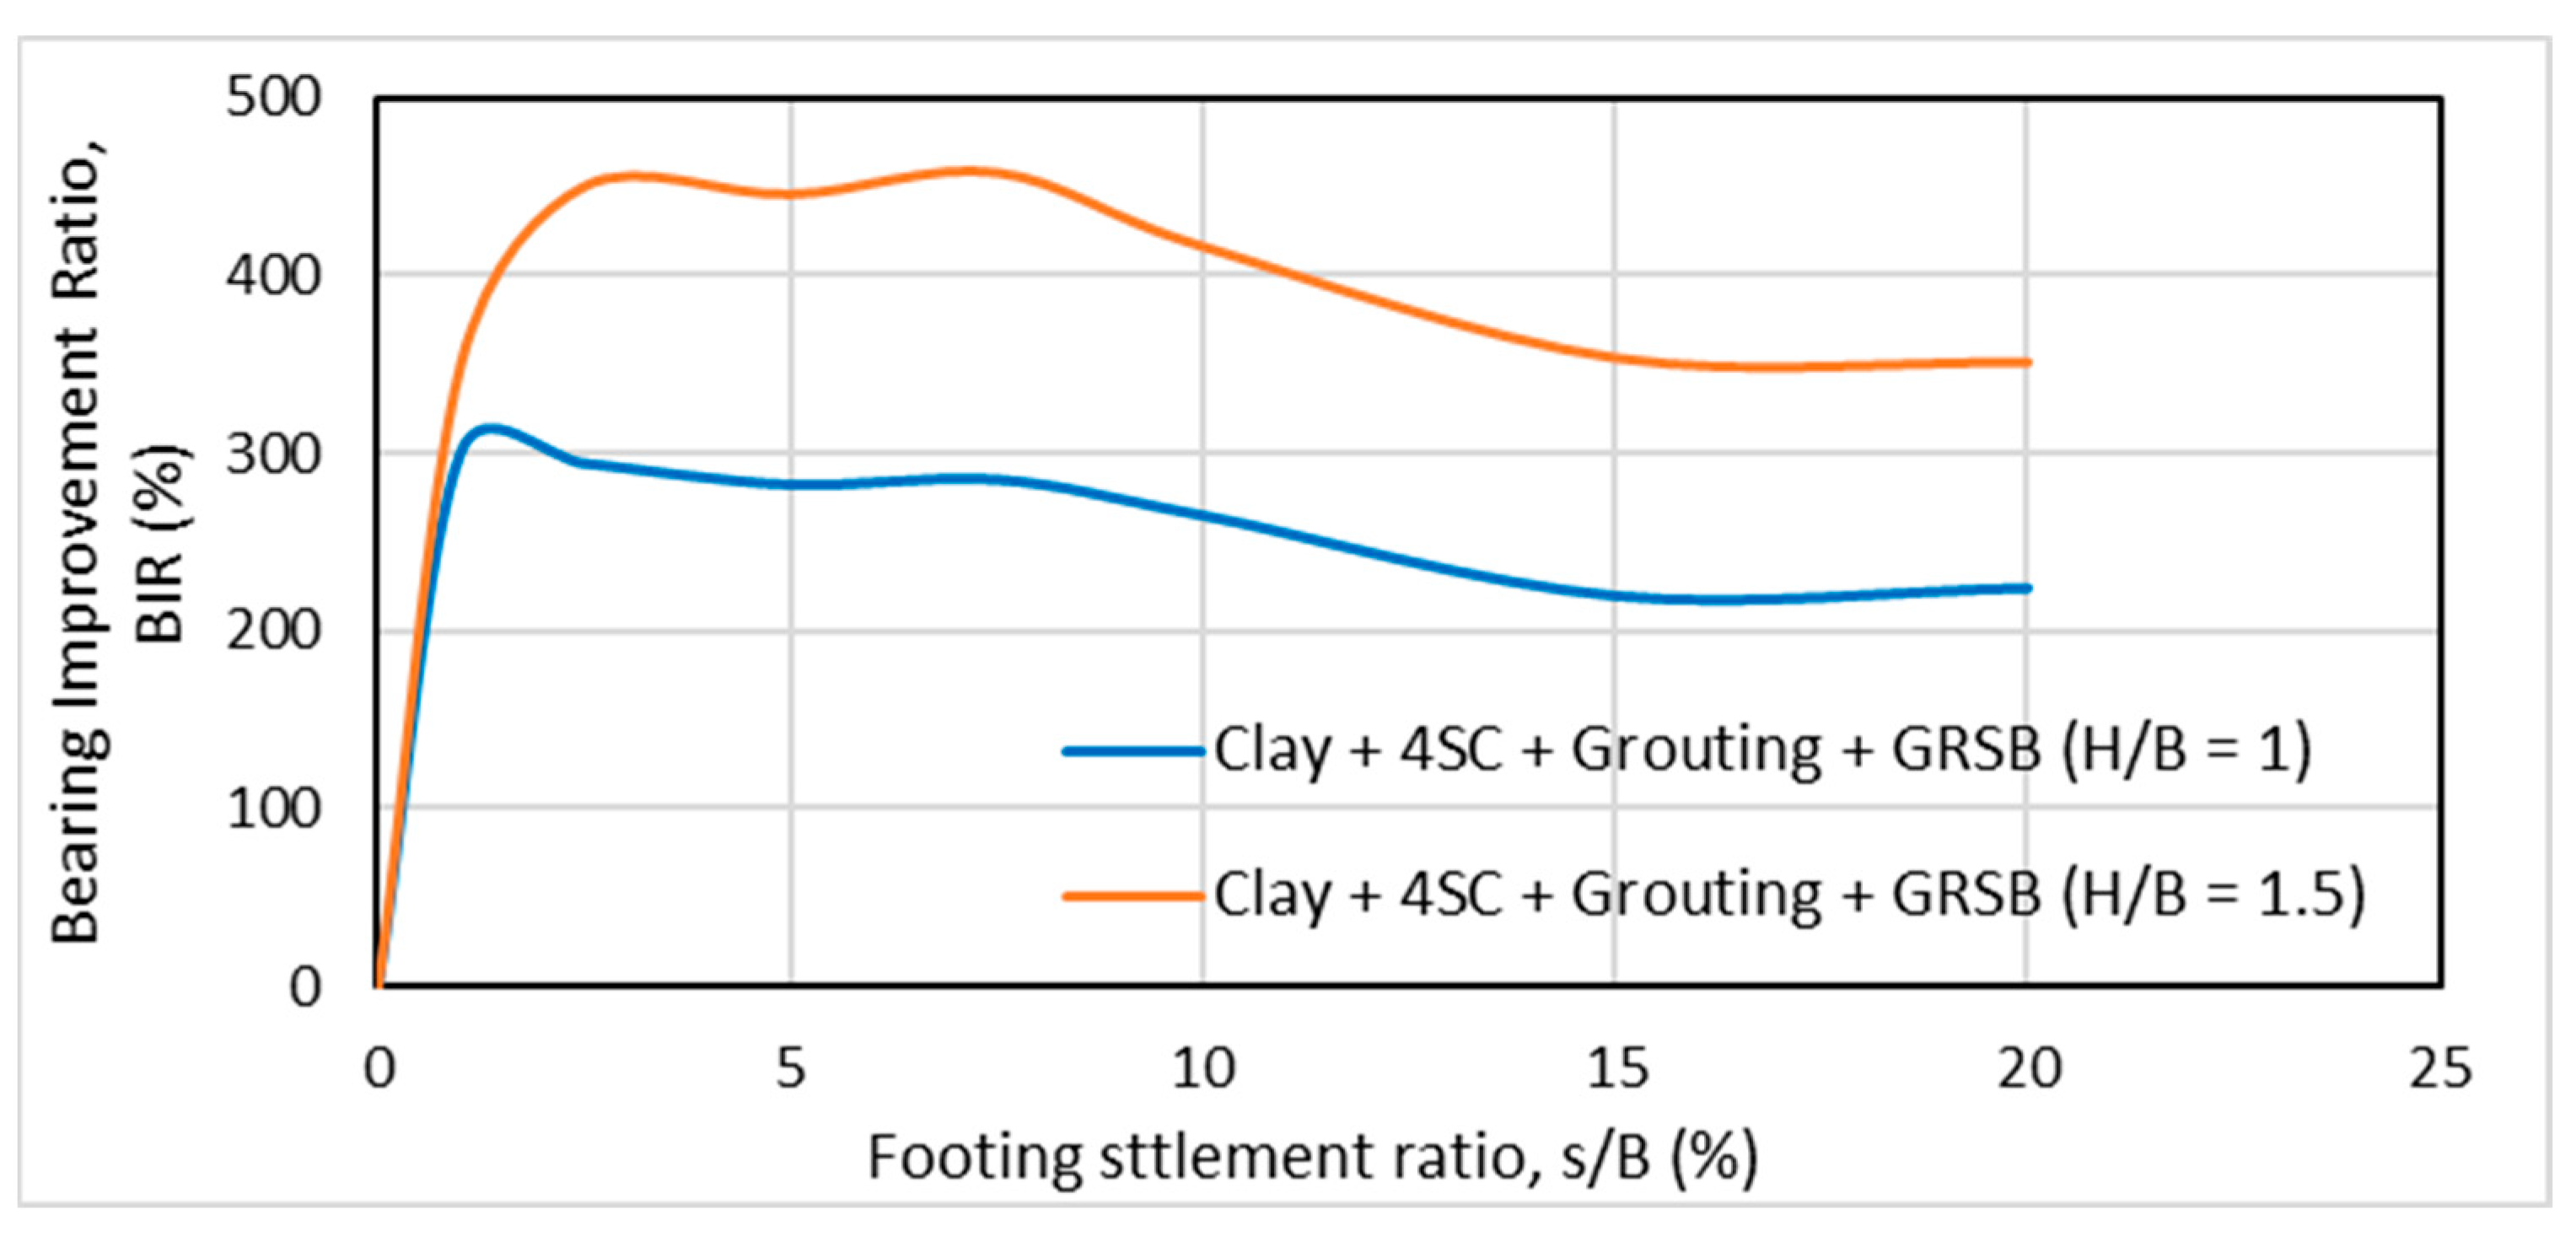
Figure 12 presents the relationship between the bearing capacity ratio (BCR) and settlement ratio (s/B) for treated soil incorporating floating sand columns and a geogrid-reinforced sand bed (GRSB) at varying heights. The peak of the BCR appears between a settlement (s/B) of 200 and 320%, after which the values gradually decrease or stabilize as settlement ratios increase. This behavior can be attributed to the stiffness contrast between the sand columns and the surrounding soil. As the model is subjected to loading, the load is transmitted from the foundation, through the sand layer, and subsequently, to the clay layer containing the sand columns. Consequently, the load concentration initially engages the reinforced columns, yielding peak BCR values, before gradually redistributing to the surrounding soil, which is reflected in the subsequent decline in the improvement ratio.
At failure, the bearing capacity ratios are recorded as 180% for H/B = 1 and 300% for H/B = 1.5. The results indicate that utilizing sand columns alongside geogrid reinforcement not only provides independent improvements but also creates an integrated system that enhances bearing capacity and overall stability. This finding aligns with the conclusions of [33], who identified the combination of these methods as an innovative approach that yields superior performance compared to the use of each technique in isolation.

3.3. Model Tests on Soil Treated with Grouted Sand Columns and a Geogrid-Reinforced Sand Bed (GRSB)

The results presented in Figure 13 demonstrate that the cement grouting of sand columns significantly improves bearing capacity and reduces settlement. This enhancement is due to the grouting process, which reinforces the sand columns, making them both sturdy and resistant to bulging. Furthermore, the pressure applied during grouting compresses the surrounding clay, increasing its density and boosting frictional resistance between the columns and the soft clay.
Figure 14 shows the bearing capacity ratio (BCR) in relation to normalized settlement (s/B) for treated soil with a group of four grouted sand columns, combined with a sand layer (H/B = 1 and 1.5) reinforced by two layers of geogrid. A substantial increase in the BCR is observed when these columns are grouted compared to untreated sand columns. This increase can be attributed to the solidification of the grouted sand columns, which become stiffer than the surrounding clay, as well as the additional lateral pressure exerted by the grout, which enhances the soil’s stability.
Additionally, cement grouting of the sand columns helps seal voids and pores within the clay soil, closing any existing cavities and further strengthening the overall structure. Table 6, Table 7, Table 8 and Table 9 summarize the results of the bearing pressure, BCR, settlement, and settlement reduction ratio for all the tests.

4. Conclusions

Based on the study’s results and experimental analysis, the following conclusions can be drawn:
Cement-grouted sand columns provided a significant improvement in the bearing capacity of soft clay soil, achieving a 90% increase compared to untreated soil. This technique proved effective in reducing deformations and enhancing the soil’s stability. The following conclusions can be obtained:
  • The use of a geogrid with sand columns yielded an even greater improvement in bearing capacity, reaching an increase of 180%. This highlights the additional benefit of geogrids in enhancing the soil’s load-bearing ability and distributing loads more effectively.
  • The combination of cement grouting and geogrid reinforcement demonstrated the highest improvement in bearing capacity at 260%, indicating effective synergy between the two techniques. Grouting enhances the rigidity of the sand columns, while the geogrid contributes to an even load distribution and to settlement reduction.
  • Increasing the reinforcement layer thickness to H/B = 1.5 raised the bearing capacity to 300% for ungrouted columns and to 420% for grouted columns, indicating the importance of thicker reinforcement for improving load capacity in applications that require high soil stability.
  • While the study focused on improving the immediate bearing capacity of the supported system, it is also important to consider the long-term effects. Compared to ordinary sand columns, those that were grouted showed reduced impacts in failure due to bulging, compression, and shear failure. This is because the injected cement makes the sand columns much stronger, resembling piles, thereby enhancing the sustainability of the supported system and improving its effectiveness in long-term engineering applications.
  • The findings show that cement-grouted sand columns and geogrid reinforcement are effective solutions for enhancing the stability of weak clay soils and increasing their bearing capacity, making them suitable for engineering applications that require significant reinforcement. While ordinary sand columns are the least expensive, their improvement in bearing capacity is limited. Grouted sand columns provide a noticeable improvement in bearing capacity at a higher cost, while geogrids offer good improvements at a moderate cost. The combination of grouted sand columns and geogrids is a good cost-effective option compared to other methods, as it provides a significant increase in bearing capacity and a noticeable reduction in settlement.

Author Contributions

Methodology, M.A.A.-K.; investigation, M.A.A.-K.; data curation, M.H.; writing—original draft, M.K.M.; writing—review and editing, M.Y.F.; supervision, M.Y.F. and M.K.M. All authors have read and agreed to the published version of the manuscript.

Funding

No funding was received by the authors.

Data Availability Statement

All data are included in the paper.

Conflicts of Interest

The authors declare no conflict of interest.

References

  1. Bora, M.C.; Dash, S.K. Floating Stone Columns in Soft Clay with Unreinforced and Geocell Reinforced Sand Cushion. In Proceedings of the Indian Geotechnical Conference, Delhi, India, 13–15 December 2012; pp. 1–6. [Google Scholar]
  2. Ambily, A.P.; Gandhi, S.R. Behavior of Stone Columns Based on Experimental and FEM Analysis. J. Geotech. Geoenviron. Eng. 2007, 133, 405–415. [Google Scholar] [CrossRef]
  3. Fattah, M.Y.; Ali, H. Experimental Study on Behavior of Soft Clay Strengthened by Geogrid Encased Stone Columns. Assoc. Arab. Univ. J. Eng. Sci. 2016, 23, 93–117. [Google Scholar]
  4. Al-Gharbawi, A.S.A.; Rajab, N.A.A. Comparison between Sand Columns and Sand Columns Stabilized with Lime or Cement with Stone Columns Embedded in Soft Soil. Eng. Technol. J. 2016, 34, 2805–2815. [Google Scholar] [CrossRef]
  5. Fattah, M.Y.; AAl-Neami, M.; Shamel Al-Suhaily, A. Strength Improvement of Soft Soil Treated Using Stone Columns. Eng. Technol. J. 2015, 33, 1740–1756. [Google Scholar] [CrossRef]
  6. Ali, K.; Shahu, J.T.; Sharma, K.G. Model tests on single and groups of stone columns with different geosynthetic reinforcement arrangement. Geosynth. Int. 2014, 21, 103–118. [Google Scholar] [CrossRef]
  7. Warner, J. Practical Handbook of Grouting: Soil, Rock, and Structures; John Wiley & Sons: Hoboken, NJ, USA, 2004. [Google Scholar]
  8. Karol, R.H. Chemical Grouting and Soil Stabilization, Revised and Expanded; CRC Press: Boca Raton, FL, USA, 2003; Volume 12. [Google Scholar]
  9. Fattah, M.Y.; Al-Ani, M.M.; Al-Lamy MT, A. Wetting and Drying Collapse Behaviour of Collapsible Gypseous Soils Treated by Grouting. Arab. J. Geosci. 2015, 8, 2035–2049. [Google Scholar] [CrossRef]
  10. Moseley, M.P.; Kirsch, K. Ground Improvement; CRC Press: Boca Raton, FL, USA, 2004. [Google Scholar]
  11. ASTM D1603-11; Standard Test Method for Carbon Black Content in Olefin Plastics. ASTM International: West Conshohocken, PA, USA, 2011. [CrossRef]
  12. ISO 9864; Geosynthetics—Test Method for the Determination of Mass per Unit Area of Geotextiles and Geotextile-Related Products. International Organization for Standardization: Geneva, Switzerland, 2005.
  13. ISO 10319; Geosynthetics—Wide-Width Tensile Test. International Organization for Standardization: Geneva, Switzerland, 2015.
  14. IQS No. 5; Portland Cement. Ministry of Planning. Central Organization for Standardization and Quality Control: Baghdad, Iraq, 2019.
  15. Bowles, J.E. Foundation Analysis and Design, 5th ed.; McGraw-Hill: New York, NY, USA, 1996. [Google Scholar]
  16. Shareef, A.; Al-Neami, M.; Rahil, F. Modifying the Strength of Soft Soils via Heating and Cement Grouting Method. Eng. Technol. J. 2023, 42, 472–484. [Google Scholar] [CrossRef]
  17. Rao, L.; Madhira, M. Evaluation of optimum spacing of stone columns. In Proceedings of the Indian Geotechnical Conference—GEOtrendz, Mumbai, India, 16–18 December 2010. [Google Scholar]
  18. Das, M.; Dey, A.K. Use of Soil–Cement Bed to Improve Bearing Capacity of Stone Columns. Int. J. Geomech. 2020, 20, 06020008. [Google Scholar] [CrossRef]
  19. Ali, K.; Shahu, J.T.; Sharma, K.G. An Experimental Study of Stone Columns in Soft Soils. In Proceedings of the Indian Geotechnical Conference, Kochi, India, 15–17 December 2011. Paper No. H-059. [Google Scholar]
  20. Mutman, U.; Kavak, A. Improvement of granular soils by low-pressure grouting. Int. J. Phys.Sci. 2011, 6, 4311–4322. [Google Scholar] [CrossRef]
  21. Yildiz, M.; Soganci, A.S. Improvement of the strength of soils which comprises granular pumice by injection of cement under low pressure. Sci. Iran. A 2015, 22, 81–91. [Google Scholar]
  22. Akbulut, S.; Saglamer, A. Estimating the groutability of granular soils: A new approach. Tunn. Undergr. Space Technol. 2002, 17, 371–380. [Google Scholar] [CrossRef]
  23. Adams, T.M.; Collin, J.G. Large model spread footing load tests on geosynthetic reinforced soil foundations. J. Geotech. Geoenviron. Eng. ASCE 1997, 123, 66–72. [Google Scholar] [CrossRef]
  24. Al-Gharbawi, A.S.A.; Najemalden, A.M.; Fattah, M.Y. Expansive Soil Stabilization with Lime, Cement, and Silica Fume. Appl. Sci. 2022, 13, 436. [Google Scholar] [CrossRef]
  25. Das, B.M.; Khing, K.H. Foundation on layered soil with geogrid reinforcement—Effect of a void. Geotext. Geomembr. 1994, 13, 545–553. [Google Scholar] [CrossRef]
  26. Mosallanezhad, M.; Hataf, N.; Ghahramani, A. Three-dimensional bearing capacity analysis of granular soils, reinforced with innovative grid-anchor system. Iran. J. Sci. Technol. Trans. B Eng. 2010, 34, 419–431. [Google Scholar]
  27. Asakereh, A.; Ahmadi, M.H. Numerical Analysis of the Bearing Capacity of Strip Footing on Reinforced Soil Slope. Int. J. Eng. Trends Technol. 2015, 29, 313–317. [Google Scholar] [CrossRef]
  28. Guido, V.A.; Chang, D.K.; Sweeney, M.A. Comparison of geogrid and geotextile reinforced earth slabs. Can. Geotech. J. 1986, 23, 435–440. [Google Scholar] [CrossRef]
  29. Brand, E.W.; Brenner, R.P. Soft Clay Engineering; Elsevier: Amsterdam, The Netherlands, 1981. [Google Scholar]
  30. Konietzky, H.; te Kamp, L.; Groeger, T.; Jenner, C. Use of DEM to Model the Interlocking Effect of Geogrids under Static and Cyclic Loading. Numer. Model. Micromechanics Via Part. Methods 2004, 3, 12. [Google Scholar]
  31. Fattah, M.Y.; Al-Ani, M.M.; Al-Lamy MT, A. Treatment of Collapse of Gypseous Soils by Grouting. Ground Improv. J. 2013, 166, 32–43. [Google Scholar] [CrossRef]
  32. Jala, S.K.; Sharma, S.; Bhat, A.H. Effect of Sand Blanket Reinforced with Geogrid Over the Stone Column in Compressible Clay Soils: 3D Numerical Study. Lect. Notes Civ. Eng. 2023, 280, 397–406. [Google Scholar] [CrossRef]
  33. Dash, S.K.; Bora, M.C. Improved performance of soft clay foundations using stone columns and geocell-sand mattress. Geotext. Geomembr. 2013, 41, 26–35. [Google Scholar] [CrossRef]
Figure 1. Sand and clay particle size distribution curves.
Infrastructures 10 00062 g001
Figure 2. (a) Schematic of the test setup that was utilized; (b) general view of the device used.
Infrastructures 10 00062 g002
Figure 3. The cement grouting system.
Infrastructures 10 00062 g003
Figure 4. Undrained shear strength variation for the remolded clay versus water content.
Infrastructures 10 00062 g004
Figure 5. (a) The column distribution, (b) sand columns, and (c) grouted columns.
Infrastructures 10 00062 g005
Figure 6. Laboratory test schematic diagram.
Infrastructures 10 00062 g006
Figure 7. (a) Vibrated compactor. (b) Geogrid reinforcement used.
Infrastructures 10 00062 g007
Figure 8. Bearing pressure (q) versus footing settlement ratio (s/B) (%) for untreated soil and soil treated with four sand columns (with or without grouting).
Infrastructures 10 00062 g008
Figure 9. Bearing capacity ratio (BCR) versus footing settlement ratio (s/B) (%) for treated soil with four sand columns (with or without grouting).
Infrastructures 10 00062 g009
Figure 10. The shape of the sand column after grouting.
Infrastructures 10 00062 g010
Figure 11. Bearing pressure (q) versus footing settlement ratio (s/B) (%) for untreated soil and for clay + 4SC + GRSB with H/B = 1 and 1.5.
Infrastructures 10 00062 g011
Figure 12. BCR versus footing settlement ratio (s/B) % for soil treated with sand columns.
Infrastructures 10 00062 g012
Figure 13. Bearing pressure (q) versus normalized footing settlement (s/B) (%) for different improvement cases with grouting.
Infrastructures 10 00062 g013
Figure 14. BCR versus footing settlement ratio (s/B) (%) for treated soil with grouted sand columns.
Infrastructures 10 00062 g014
Table 1. The soft clay soil’s physical and chemical characteristics.
Index PropertyValue
Liquid limit (L.L.) (%)43
Plasticity index (P.I.) (%)19
Plastic limit (P.L.) (%)24
Shrinkage limit (S.L.) (%)11
Specific gravity (Gs)2.69
Gravel (%)0
Silt (0.075 to 0.005 mm) (%)44
Sand (4. 75 to 0.075 mm) (%)3
Clay (<0.005 mm) (%)53
Classification (USCS)CL
Organic matter (O.M.) (%)<0.01
pH value (%)7.2
Total dissolved salts (%) (TDS)2.21
Table 2. Sand’s physical characteristics.
Index PropertyIndex Value
Minimum dry unit weight (kN/m3)14.8
Maximum dry unit weight (kN/m3)17.9
Dry unit weight (kN/m3) at Dr = 15% 15.3
Dry unit weight (kN/m3) at Dr = 70%17.0
D10 (mm)0.25
D30 (mm)0.49
D60 (mm)1.3
Coeff. of curvature (Cc)0.74
Coeff. of uniformity (Cu)5.2
Sand (%) (S)99.5
Gravel (%) (G)0
Fines (%)0.5
Classification (USCS)SP
Specific gravity (Gs)2.6
The friction angle of sand at Dr = 15% 29°
The friction angle of sand at Dr = 70%37°
Table 3. Engineering properties of the geogrid used: (1) chemical, biological, and physical properties; (2) characteristics of dimensions; and (3) technical characteristics.
(1) Chemical, Biological, and Physical Properties
PropertyTest MethodData
Structure [11]Extruded geogrid
Polymer typeHDPE
Packing Rolls
Standard colorGreen
Resistance to chemicalsThe product is inert to all chemicals naturally found in water and soils.
Biological resistance The product is not affected by micro or genesis.
Sunlight resistance Adding appropriate stabilizers can help to minimize damage caused by UV light. When exposed to normal temperatures, the material is expected to last for more than 5 years without losing more than 20% of its strength.
Temperature stability The material remains stable between −60 °C to 100 °C, but its strength reduces at high temperatures.
Stabilizer for UVInserted using color.
(2) Characteristics of Dimensions
PropertyTest MethodUnitData
Roll width[12]m1
Aperture sizemm × mm6 × 6
Roll lengthm30
Mass per unit areag/m2363
(3) Technical Characteristics
PropertyTest MethodDataUnit
Peak tensile strength [13]13.5KN/m
Tensile strength at 2(%) 4.3KN/m
Yield point elongation 20%
Tensile strength at 5(%) 7.7KN/m
Table 4. Properties of sulfate-resistant cement.
ParametersValue
Chemical Tests
Lime saturation coefficient0.83
Magnesium oxide (MgO) %2.76
SO3 content %2.23
Loss on ignition %1.6
Insoluble residue %1.1
SiO2%21.84
AI2O3%4.23
Fe2O3%5.32
Tricalcium silicate (C3S)50.09
Dicalcium silicate (C2S)24.37
Tricalcium aluminate (C3A)2.8
Tetracalcium aluminoferrite (C4AF)14.21
Physical Tests
Initial setting time (min)110
Final setting time (h)4.8
Compressive strength as per [14], (MPa)3 days17.3
7 days24.6
Table 5. Details of the test series that were carried out to meet the predetermined inquiry goal, including the different sand column parameters.
Test SeriesType of ReinforcementInformation About the Parameters Investigated
1Unreinforced clayConstant parameters: cu = 14 kPa and a footing of B/L = 1 for all tests
2Clay + 4SCConstant parameters: S/D = 2.5, L/D = 6
Variable parameters: grouted, not grouted
3Clay + 4SC + GRSBConstant parameters: S/D = 2.5, L/D = 6, h/B = 0.25, u/B = 0.5, GR, and b/B = 3
Variable parameters: H/B = 1 and 1.5, grouted, and not grouted
Note—SC: sand column, GR: geogrid reinforcement, GRSB: geogrid-reinforced sand bed.
Table 6. A summary of all test results for applied pressure (q) (kPa) against footing settling (s/B).
Without Using a Sand Layer
s/B (%)Clay OnlyClay + 4SCClay + 4SC + Grouting
5223547
10314759
15415570
20466576
With a Sand Layer of H/B = 1
s/B (%)Clay + 4SC + GRSBClay + 4SC + GRSB + Grouting
56184
1086113
15108131
20126149
With a Sand Layer of H/B = 1.5
590120
10123160
15143186
20166203
Table 7. Bearing capacity ratio (BCR) (%) summary compared to footing settlement ratio (s/B) for all the tests.
Without Using a Sand Layer
s/B (%)Clay + 4SCClay + 4SC + Grouting
560110
105090
153070
204070
With a Sand Layer of H/B = 1
s/B (%)Clay + 4SC + GRSBClay + 4SC + GRSB + Grouting
5170280
10180260
15160320
20170220
With a Sand Layer of H/B = 1.5
5310450
10300420
15250350
20240350
Table 8. Comparison of settlement (mm) at 50, 100, and 150 kPa loads in all the tests.
Without Using a Sand Layer
(q) kPaClay OnlyClay + 4SCClay + 4SC + Grouting
5024126
100---
150---
With a Sand Layer of H/B = 1
(q) kPaClay + 4SC + GRSBClay + 4SC + GRSB + Grouting
503.51.6
10012.87.5
15025.520.8
With a Sand Layer of H/B = 1.5
5020.8
1006.43.4
15016.67.8
Table 9. Summary of the settlement reduction ratio (St/Sunt) at a 50 kPa load in the tests.
Without Using a Sand Layer
Clay + 4SCClay + 4SC + Grouting
0.500.25
With a Sand Layer of H/B = 1
Clay + 4SC + GRSBClay + 4SC + GRSB + Grouting
0.150.07
With a Sand Layer of H/B = 1.5
0.080.03
Disclaimer/Publisher’s Note: The statements, opinions and data contained in all publications are solely those of the individual author(s) and contributor(s) and not of MDPI and/or the editor(s). MDPI and/or the editor(s) disclaim responsibility for any injury to people or property resulting from any ideas, methods, instructions or products referred to in the content.

