Abstract
The accurate motion of roller-bearing-supported rings is critically influenced by shape and positional tolerances, which are often underestimated in conventional modeling approaches. The aim of this study is to develop and validate a multibody dynamic framework capable of quantifying the impact of roundness and positional errors on the motion accuracy of roller-bearing-supported rings. Shape errors are modeled using Fourier series and incorporated into a high-fidelity multibody simulation environment. Experimental validation using laser triangulation reveals a maximum runout error of 72.9 μm, compared to a numerically predicted value of 88.6 μm, resulting in a quantified numerical overestimation of 21.5%. Parametric studies investigated the effects of harmonic order, error amplitude, and combined error scenarios on key performance metrics, including trajectory runout and initial offset displacement. Results reveal that the trajectory errors range between 0.29 mm and 0.63 mm for shape error orders and can escalate to 2.84 mm for high amplitude errors, demonstrating the critical role of error order and amplitude. Furthermore, combined simulations show that bearing position errors exert a more pronounced effect on radial accuracy than shape deviations alone. The proposed approach enables precision design evaluation and tolerance optimization in high-accuracy applications, including robotics, aerospace mechanisms, and optical alignment systems.
1. Introduction
Large rings [1] or large containers [2], such as those used in aerospace mechanisms, robotic arms, semiconductor wafer stages, and high-accuracy optical devices, can be constrained through fixed rollers contacting the respective inner or outer border or rollers placed between one border and an outer raceway which is fixed (the so-called YRT rollers). Much research has been directed at increasing the reliability of rolling bearings by focusing on the analysis of fatigue resistance, wear, thermal properties, and tribological aspects [3,4,5,6].
Significantly less attention has been devoted to the position accuracy associated with the orbit covered by the center of the ring during a whole rotation. This aspect becomes predominant in the case of rings that are not heavily loaded and whose main function is carrying small devices at established angular positions. In fact, the accuracy of positioning can vary as a result of manufacturing tolerances and shape errors. Prior studies have identified influential parameters, such as the number and spatial distribution of rollers [7], manufacturing tolerances on raceway diameter and profile [8], and localized defects or shape distortions on the bearing surface [9,10]. Many other authors considered variations of contact geometries under different loads [11]. However, most analyses to date rely on simplified analytical models that struggle to capture the complex interactions between multiple geometric and positional errors.
Real-world high-precision applications often demand error combinations to be modeled simultaneously. For example, in robotics and semiconductor manufacturing, sub-micrometer bearing runout directly affects the repeatability and positional fidelity of robotic joints and pick-and-place arms [12]. High-speed spindles in CNC machining rely on ultra-precise rotary motion [13], where roundness errors contribute to tool wear, surface finish degradation, and loss of dimensional control. Additional sensitivity is observed in gyroscopic inertial navigation units [14] and coordinate measuring machines (CMMs) [15], where bearing imperfections induce tracking errors and compromise metrological accuracy.
This calls for high-fidelity numerical frameworks that move beyond the limits of static or single-error models. While a few studies have used finite element techniques [3] or contact mechanics models [11] to simulate these effects, they often lack flexibility or scalability for system-level investigations.
Multibody dynamics (MBD) approaches offer a powerful alternative. Prior research has shown that multibody models can capture complex motion patterns and contact interactions within mechanical assemblies, including those influenced by tolerance chains [16]. The use of MBD tools like MSC Adams 2022.1 allows for modeling multiple degrees of freedom, realistic contact interfaces, and dynamic excitation. However, systematic incorporation of manufacturing tolerances—especially shape and positional errors—into multibody simulations remains limited. Moreover, the validation of such models against experimental data has been sparse.
Despite extensive studies on bearing reliability and tribological behavior, far less attention has been devoted to how manufacturing tolerances and shape deviations propagate into system-level motion errors. For high-precision applications, even sub-millimeter roundness and positional deviations and their combination can accumulate significant runout errors, making it necessary to develop models that explicitly incorporate tolerance effects and their combination into the dynamic analysis of roller-bearing-supported rings. In this work, a multibody dynamic model is developed and validated to assess how shape and position errors characterized using Fourier series affect the trajectory and dynamic behavior of roller-bearing-supported rings. The model is experimentally verified using laser triangulation measurements. Key performance metrics are extracted and analyzed under various harmonic orders and error amplitudes. Special attention is given to the interaction of multiple error types, and the relative impact of shape vs. positional deviations is quantified. The proposed methodology is especially relevant for tolerance optimization frameworks in high-precision design, such as statistical tolerancing: the MBD-driven performance predictor could be computed to guide tolerance allocation across components. The methodology can be extended to support design verification under ISO 492 [17] classification standards.
The present work illustrates how a multibody model can be set up and allows the prediction of axis orbits generated by complex combinations of shape and position errors characterized using Fourier series and taking into account component-level design variables in the evaluation of the overall performance of the system.
2. Materials and Methods
An experimental test was set up in order to validate the numerical model, which was aimed at replicating the actual working conditions. The main aim of the multibody model was to assess the effect on the system’s response of shape errors on the inner surface of the ring, as well as the interactions of various errors affecting the inner circumference of the ring, the outer bearing profile, and the bearing position.
2.1. Experimental Test
The experimental work was conducted at the Department of Mechanical and Aerospace Engineering, Politecnico di Torino, Torino, Italy.
2.1.1. Experimental Setup
The experimental setup consisted of a ring, a series of steel bearings, a driver gear, and a laser triangulation sensor (see Figure 1). Due to confidentiality restrictions established by a non-disclosure agreement with the industrial supplier, photographs of the experimental setup cannot be shared. However, Figure 1 presents the detailed schematics that faithfully reproduce the experimental setup. All relevant parameters, device specifications, and measurement configuration are fully reported in this section to ensure reproducibility.
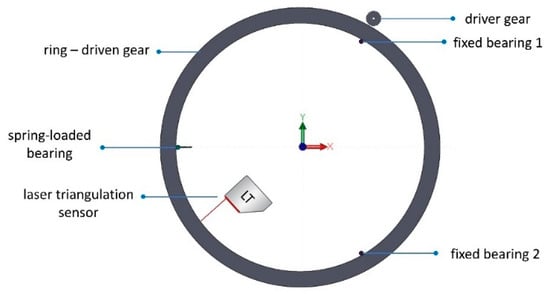
Figure 1.
Measurement of the ring’s displacement through Laser Triangulation (LT).
The vertical displacement of the ring is constrained by eight supporting bearings positioned in contact with the inferior surface of the ring; three spring-loaded bearings are in contact with the superior surface of the ring. The spring stiffness for such bearings is 366 N/m and the preload is 5.3 N. These values were obtained from the technical datasheet of the manufacturer and validated by the supplier through internal calibration procedures. The radial displacement of the ring is constrained by two lateral fixed bearings and one lateral spring-loaded bearing, whose parameters are reported in Table 1. This arrangement ensures stability and precision in the measurements obtained during the experimental procedure. The ring is driven kinematically by an external driver, so an external spur-gear flank of the ring with 969 teeth acts as a driven gear. A steel pinion with 60 teeth meshes laterally with the ring, giving a transmission ratio of 16.15. The external spur mesh gear employs a module of m = 0.7 and a pressure angle of α = 20° [18]. The pinion is guided by a stepper motor with a nominal torque of 1.86 Nm (ST5918l, Nanotec Electronic GmbH & Co. KG, Feldkirchen, Germany.).

Table 1.
LT device and bearing characteristics.
A laser triangulator (LT, PNBC003, Wenglor, Tettnang, Germany) was used to track the actual trajectory of the ring (Figure 1) taking advantage of its capability of performing high-speed, minimally invasive measurements. It was placed at a distance of 50.9 mm from the inner surface of the ring.
Table 1 shows the technical specifications of the LT device, the main geometrical parameters, the bearings and the spring specifications.
Three measurement trials were executed. During each test 2.5 rotations were performed; the test included an initial acceleration step (810°/s2 covering 45°), a steady velocity phase (270°/s covering 810°) and a final deceleration (810°/s2, covering 45°). The results are presented as an averaged and filtered curve from the three trials. During physical testing, the laser triangulator captured the ring’s radial displacement as it rotated, but the initial angular position (i.e., 0° reference on the ring) was not recorded or aligned with a known geometric feature. As a result, the experimental trajectory has an unknown phase offset with respect to the ring geometry used in the simulation. Future studies could resolve this limitation by applying a fiducial mark to the ring and synchronizing measurement with the rotation angle, allowing direct phase comparison. The configuration described in this section is representative of applications with moderate loads and sub-hertz to few-hertz rotational frequencies (0.75 revolutions/s), such as those used in in-vitro diagnostic industry.
2.1.2. Inner Ring Reconstruction
A reference geometry with the actual inner ring was created in order to validate the multibody model. The upper and lower edges of the internal surface of the actual ring were recorded by a roundness tester (CMM, Zeiss Spectrum, ZEISS, Oberkochen, Germany) (Figure 2). The two contour curves were interpolated through a Fourier series, calculating the amplitude and phase up to the eighth harmonic order.
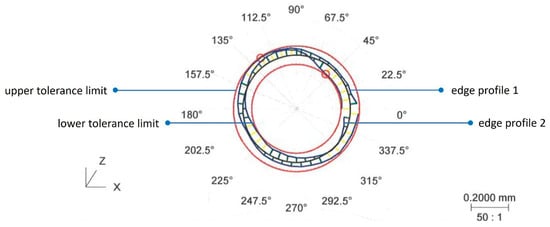
Figure 2.
Contour curves obtained by the roundness instrument.
The model validation was performed by replicating the actual ring shape and boundary conditions in the multibody software MSC Adams 2022.1. Results were compared in terms of the ring’s displacement: the peak-to-peak distances were computed for both numerical and experimental trials at the measurement point as the distance from one peak (red circle in Figure 3) to the nearest valley (green circle in Figure 3). The maximum of such distances is then chosen over one cycle of rotation and defined as the runout error of the system.
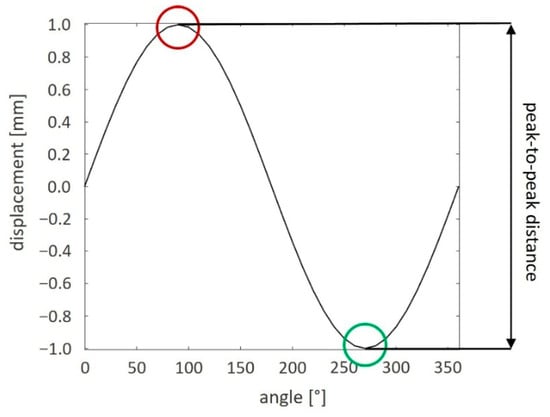
Figure 3.
A schematic of the maximum ring’s displacement computation: the distance from one peak (red circle) to the nearest valley (green circle) of the ring’s displacement (black line).
2.2. Multibody Model
2.2.1. Geometry and Parameters
In order to investigate the dynamic behavior of the ring and bearing system, a multibody model was implemented in MSC Adams (Hexagon Software, v. 2022.1) [19]. The multibody system and its components are represented in Figure 4. The system consists of rigid bodies that are the ring with a thickness of 6 mm, and the lateral bearings, whose actual geometry was simplified by cylinders with 10 mm diameter. Two types of bearings were implemented in the model, fixed and spring-loaded; the spring-loaded bearing is used to ensure constant contact between the inner surface of the ring and the outer surface of the two fixed bearings. The lateral bearings are equally spaced along the internal circumference (120° from each other), as reported in Figure 4; their position corresponds to their nominal value. The spring parameters, stiffness kb and preload force F, are the same reported in Table 1. Table 2 shows the main geometrical parameters of the model.
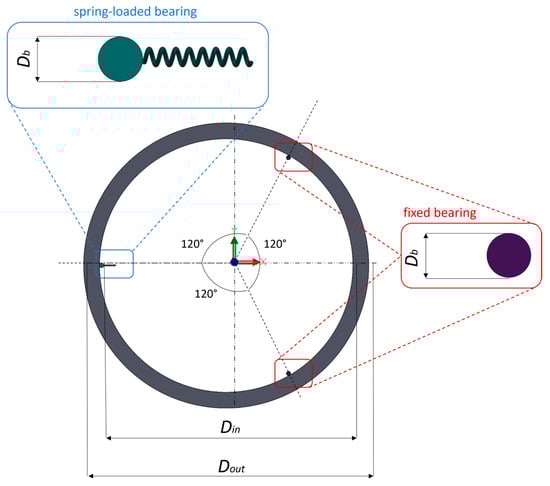
Figure 4.
Multibody system: the overall configuration with spring-loaded bearing (green) and fixed bearings (purple).
Table 2.
System parameters.
All the components in the system are modelled as rigid bodies. This assumption is justified because the elastic deformations under typical bearing preload and operating loads (on the order of 1–10 MPa contact stresses) are two to three orders of magnitude smaller than the micron-scale runout and shape errors being studied [20]. Finite-element analyses of similar roller or race contacts predict sub-micron contact deflections even at peak loads [21], which lie well below our tolerance bandwidth (tens of microns). The ring is made of aluminum and the bearings of steel. The material properties are listed in Table S1 in the Supplementary Materials. Justification for modeling assumptions is discussed in detail in the Supplementary Materials (Section S2).
2.2.2. Boundary Conditions
The two fixed bearings are constrained to the ground with a hinge which allows only the rotation around the z axis (direction normal to the plane xy). The spring-loaded bearing presents two degrees of freedom (DOFs) that are the rotation around the z axis and the translational displacement in the spring-axis direction, x. The ring presents four DOFs, since the only vertical translation along the z-axis is constrained to be zero and a motion law is applied at the center of the ring, imposing the rotation around the z axis; the motion law, Rz(t), is reported in Equation (1):
As a result of the implemented function, the first 0.5 s represents a static condition, leaving time for the ring to reach an equilibrium configuration under the action of the bearings; after 0.5 s, the ring starts rotating with a speed of 270°/s. Table 3 summarizes the boundary conditions applied to the model.
Table 3.
Load and boundary conditions.
2.2.3. Contact
Contact forces were implemented to model the interaction between bearings and the ring. The IMPACT formulation available in MSC Adams 2022.1 was used, which requires the definition of four parameters as reported in Equation (2):
where x is the displacement variable and x1 is the trigger for the interpenetration between the bodies in contact, e is the coefficient of the spring component that characterizes the non-linear relationship between applied load and displacement, serving as a measure of elastic compliance of the system, e.g., a higher value results in more stiff contact, a smaller value leads to a softer one; k is the stiffness that simulates the elasticity of the contacting surfaces, cmax is the maximum damping taking into account energy dissipation, and d is the penetration depth at which the maximum damping is applied, following a step function.
Also, Coulomb friction was modelled, considering the aluminum-steel dry contact set according to [22]. In Adams, an instantaneous transition between the static friction coefficient (μs) and the dynamic friction coefficient (μd) is not permitted. To address this, transition velocities are incorporated into the model. Specifically, as the stiction transition velocity (vs) approaches zero, the system behavior increasingly approximates the stiction condition. Conversely, when the relative velocity between two interacting objects reaches the friction transition velocity (vd), the model transitions to the kinetic friction regime.
Some preliminary simulations were performed in order to identify the best combination of contact parameters. In particular, simulations using the standard ring model were performed, checking oscillation peaks of the contact forces (see Supplementary Materials, Section S3). The set of parameters reported in Table 4 proved to produce smooth behavior of the contact forces.
Table 4.
Contact force parameters.
2.3. Shape and Position Errors
In this study, shape errors of single elements, namely ring and bearings, and their combinations are taken into account. For each shape error investigated, the corresponding geometry and numerical model were implemented and simulations performed. The shape error can be applied for the inner surface of the ring and/or for the outer surface of the bearings. The errors applied to the ring and bearing’s shapes and bearing position are approximated through a periodic function; hence, it is possible to describe these errors by applying the Fourier series in polar coordinates [23]:
where
- Δr(θ): error on the measure of the radius
- Δr0: average radial error
- Cn: amplitude of the n-th harmonic component
- n: order of the harmonic component
- φn: phase shift of the n-th harmonic function
- θ: angle position
An ideal profile would correspond to Cn = 0 mm and Δr0 = 0 mm. The addition of the shape error to the ideal circle profile, defined by the nominal radius r0, gives the actual shape (Figure 5), and so different geometries were created using Equation (3). This formulation of the error was here used to investigate different sources of shape and position errors, based on the system’s component that is affected by the error:
- a.
- inner surface of the ring
- b.
- bearing shape
- c.
- bearings’ position

Figure 5.
Shape and position errors: (a) inner surface of the ring; (b) bearings’ outer surface and their position.
2.3.1. Shape Errors on the Inner Circumference of the Ring
With regard to the shape error only on the inner surface of the ring, the radius errors were generated considering separately the effects of the order n and of the amplitude Cn.
Order of Shape Error in the Inner Circumference of the Ring
The first set of computational trials was aimed at establishing the effect of the profile error order on the inner surface of the ring. The bearings’ profile and their position were fixed at the nominal value. Inner ring shape errors were generated by fixing the amplitude and phase shift values (Cn = 0.14 mm, φn = 45°). The large aluminum ring was produced by waterjet cutting, for which the supplier guarantees a circularity tolerance of 0.20 mm. For the high-precision application, a tighter circularity tolerance of 0.10 mm was required [24]. The ring’s amplitude value of 0.14 mm was used to represent the as-built worst-case geometry from water-jet cutting. This choice ensures realistic simulation of the dominant process-induced form errors [25] and provides a conservative estimate of system run-out.
The investigation process with n order ranged from two to ten (limits included) and 12, 15, 17, and 20 were performed. Usually, the first ten frequencies of the oscillations are analyzed, as higher-order modes are considered negligible for practical surface measurements performed on bearing raceways [7,26]. However, under certain conditions, higher-order frequencies may have an impact [27]. The error amplitude is set larger than the actual error of the ring with the intent to show more distinctly the relationship between dynamic error and the amplitude of the profile error [7].
Amplitude of Shape Error in the Inner Circumference of the Ring
The second set of simulations focused on analyzing the influence of the amplitude of profile error on radial accuracy of the inner surface of the ring. The bearings’ profile and their position are fixed at the nominal value. Insights from the initial trials indicated that specific frequency modes could disproportionately impact the radial error of the ring. To comprehensively evaluate these effects, two shape error orders—2nd and 6th—were selected as representative cases. Consistent with prior simulations, the phase angle, φn, was fixed at 45°. The error amplitude systematically varied between 0.07 mm and 0.7 mm in increments of 0.07 mm, allowing for an exhaustive examination of all possible combinations to quantify the impact of these shape error parameters.
2.3.2. Error Combinations of the Ring Shape, Bearing Shape, and Bearing Position
The third set of computational trials was aimed at studying the combinations of the profile errors of the inner surface of the ring with the bearings’ position and profile. To incorporate the positional error of the bearings into the combination cases, Equation (3) was applied to a nominal circumferential path on which the bearings’ centers are placed (Figure 5b). This approach allowed for determining a new bearing center position that was systematically integrated into the combination model, enabling a more precise assessment of combined error influences on the system’s overall radial accuracy. Both amplitude (Cn) and order (n) parameters were varied so that 12 cases were investigated. In particular, three groups of combinations have been examined, considering two and three errors applied together:
Table 5.
Investigation of error combinations.
Table 5.
Investigation of error combinations.
| Group | Case | Ring Shape Error | Bearings Position Error | Bearings Shape Error |
|---|---|---|---|---|
| ring’s shape + bearings’ position | 1 | n = 2; r0 = 302 mm; Cn = 0.14; | n = 2; r0 = 297 mm; Cn = 0.14; | n = 0; r0 = 5 mm; Cn = 0; |
| 2 | n = 2; r0 = 302 mm; Cn = 0.14; | n = 7; r0 = 297 mm; Cn = 0.14; | n = 0; r0 = 5 mm; Cn = 0; | |
| 3 | n = 5; r0 = 302 mm; Cn = 0.14; | n = 5; r0 = 297 mm; Cn = 0.14; | n = 0; r0 = 5 mm; Cn = 0; | |
| ring’s shape + bearings’ shape | 4 | n = 2; r0 = 302 mm; Cn = 0.14; | n = 0; r0 = 297 mm; Cn = 0; | n = 2; r0 = 5 mm; Cn = 0.014; |
| 5 | n = 2; r0 = 302 mm; Cn = 0.14; | n = 0; r0 = 297 mm; Cn = 0; | n = 7; r0 = 5 mm; Cn = 0.014; | |
| 6 | n = 5; r0 = 302 mm; Cn = 0.14; | n = 0; r0 = 297 mm; Cn = 0; | n = 5; r0 = 5 mm; Cn = 0.014; | |
| ring’s shape + bearing position + bearing shape | 7 | n = 2; r0 = 302 mm; Cn = 0.14; | n = 2; r0 = 297 mm; Cn = 0.14; | n = 2; r0 = 5 mm; Cn = 0.014; |
| 8 | n = 2; r0 = 302 mm; Cn = 0.14; | n = 5; r0 = 297 mm; Cn = 0.14; | n = 7; r0 = 5 mm; Cn = 0.014; | |
| 9 | n = 3; r0 = 302 mm; Cn = 0.14; | n = 7; r0 = 297 mm; Cn = 0.14; | n = 15; r0 = 5 mm; Cn = 0.014; | |
| ring’s shape error | 10 | n = 2; r0 = 302 mm; Cn = 0.14; | n = 0; r0 = 297 mm; Cn = 0; | n = 0; r0 = 5 mm; Cn = 0; |
| 11 | n = 3; r0 = 302 mm; Cn = 0.14; | n = 0; r0 = 297 mm; Cn = 0; | n = 0; r0 = 5 mm; Cn = 0; | |
| 12 | n = 5; r0 = 302 mm; Cn = 0.14; | n = 0; r0 = 297 mm; Cn = 0; | n = 0; r0 = 5 mm; Cn = 0; |
A selection of these error combinations was then compared to the single shape error case (corresponding to Cn and n equal to zero for bearings’ shape and position) of the inner ring surface for a given order (cases 10, 11 and 12).
Although ISO 492 [17] P6/P5 grades for 10 mm bearings specify circularity errors of 0.007 mm and 0.004 mm respectively, a worst-case 0.014 mm error was modeled due to (1) represent realistic off-the-shelf bearing performance in a P0/PA class, (2) amplify bearing effects in the combined errors analysis, and (3) ensure a conservative runout prediction. Prior tolerance-stack studies [7,28] validate the use of inflated form errors to expose dynamic sensitivities before refining to nominal tolerances.
2.4. Model Output
The shape error produces two main effects: the first one arises in the static phase due to the initial displacement that the ring underwent before starting its rotation, while the second is computed in the dynamic phase as the diameter of the circumference circumscribing the trajectory of the ring’s center while the ring computes one cycle of rotation. The first static effect of the ring depends on the initial phase of the geometry; for the purpose of this study, the output here defined is Distini—the distance between the initial position of the center of the ring and the center of the aforementioned circumscribed circumference (see example in Figure 6). Hereinafter, the second dynamic effect is referred to as Dtrajectory—the diameter of the circumscribed circumference of the ring’s trajectory. These two parameters were measured for each investigated configuration of the shape errors, in order to assess the respective effect on the ring behavior.
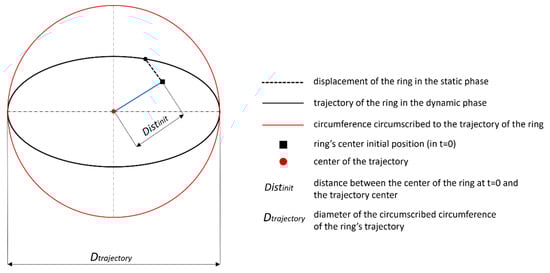
Figure 6.
Two main output variables: example of the computation.
3. Results
3.1. Model Validation
The upper and lower edge profiles of the inner surface of the ring obtained experimentally (Figure 2) have been fitted with a Fourier series. The overall amplitude of the roundness error given by the measuring instrument is 0.0945 mm.
Figure 7 shows the upper and lower edges of the ring and the respective fitting with eight Fourier coefficients, reaching a high goodness of fit (R2 ≈ 99%). Through the Fourier analysis, the coefficients are obtained and inspected: the second-order coefficient has a greater amplitude in both cases. However, all eight coefficients are considered to achieve better reconstruction accuracy. Two ring geometries for the validation model have therefore been developed, based on Fourier regression, considering all eight Fourier coefficients. Other hypotheses implemented in the model were:
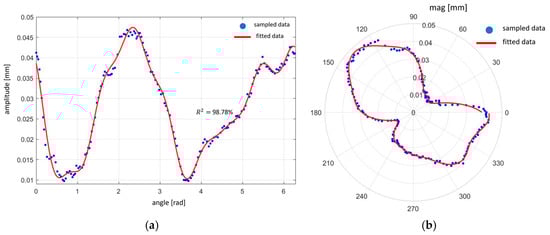
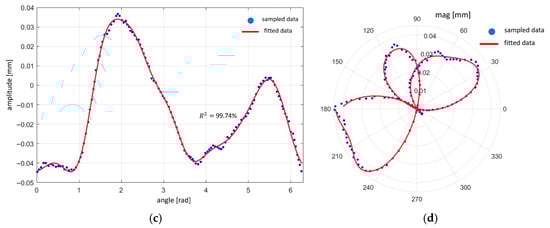
Figure 7.
Ring edges reconstructed through Fourier series: (a) linear graph of the upper edge; (b) polar graph of the upper edge; (c) linear graph of the lower edge; (d) polar graph of the lower edge.
- the profile error of the bearings is ignored
- the error of the bearings’ position is ignored
Figure 8 shows the comparison results for the experimental curve obtained from the laser triangulator and the simulated ring on the measurement point: the initial displacement has not been considered here since measurements were started after the ring reached its equilibrium. The experimental results have been filtered with a lowpass filter. For the numerical results representation, the average curve from the two reconstructed numerical trials is shown. The experimental curve includes error bars indicating ±1 standard deviation, derived from three repeated measurements at each angular position. These error bars provide insight into the repeatability and confidence of the experimental runout values.
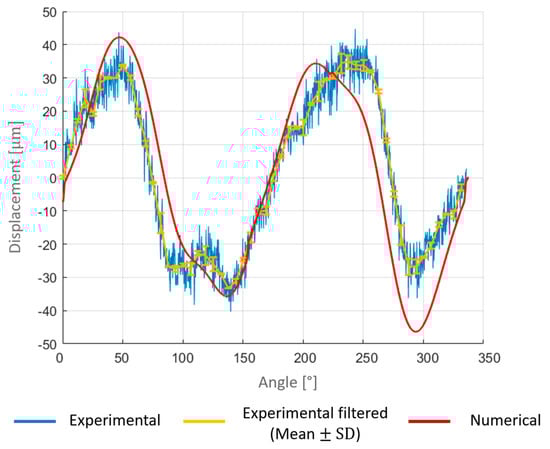
Figure 8.
Comparison between experimental and numerical results; error bars indicate ±1 standard deviation from three repeated trials.
The numerical model results are consistent with the values recorded by the experimental approach. The peak-to-peak distance values are calculated in both numerical and experimental recordings. Experimental results show the runout value to be 72.9 μm, while numerical results provide a runout of 88.6 μm. The multibody model overestimates the experimental results with an error of 21.5%. Figure 8 shows slight discrepancies of the numerical model from the experimental trials: there are slight deviations at specific points (e.g., 130°, 230°), where the numerical prediction has higher amplitude compared to the filtered experimental data. The discrepancy is in the range of 5.5–17.8 μm in these regions. The numerical data closely follows the trend of the filtered experimental data and captures a smooth periodic oscillation with a consistent amplitude. This suggests that the computational model accurately predicts the main behavior of the experimental system, although minor deviations can be observed.
In addition to trajectory analysis, the time evolution of the contact force between the ring and the bearings was evaluated to assess dynamic stability. As shown in Figure 9, an initial transient is observed during the static settling phase (0–0.5 s), after which the contact force stabilizes as the ring reaches steady rotation. The multibody system maintains consistent bearing contact without separation or impact oscillations, thereby validating the assumptions used in contact modeling.
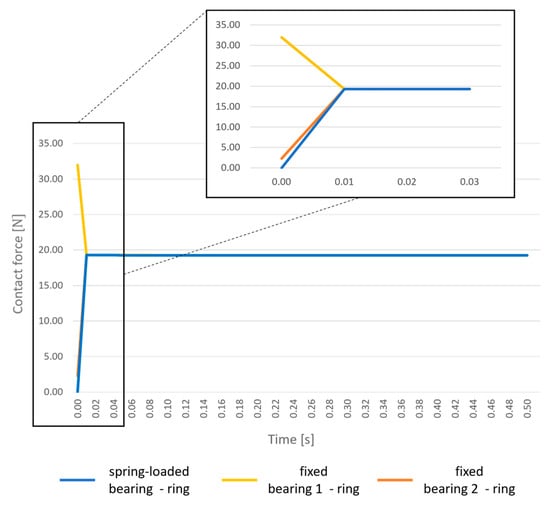
Figure 9.
Initial transient period for contact assessment.
3.2. Shape Errors on the Inner Surface of the Ring
3.2.1. Influence of the Order of Roundness Error
This section depicts the influence of the order of roundness error on the inner surface of the ring.
Figure 10a represents the values of the circumscribed circumference diameter versus the shape error order for all the simulated cases. Figure 10b depicts the distance between the initial position of the center of the ring and the center of the circumscribed circumference, Distinit, versus the shape error order.
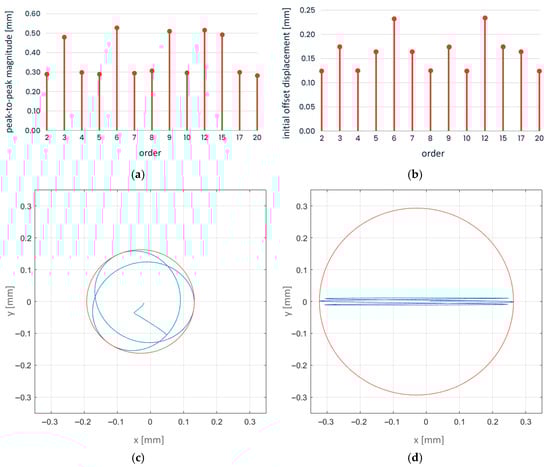
Figure 10.
Order influence: (a) Dtrajectory vs. order; (b) Distinit vs. order; (c) ring’s center trajectory for order 2 (blue) and its circumscribed circumference (red); (d) ring’s center trajectory for order 3 (blue) and its circumscribed circumference (red).
In Figure 10c and in Figure 10d, the trajectory of the center of the ring and the circumscribed circumference are shown; for the sake of clarity, only roundness errors of order 2 and 3 are reported, respectively. All the order cases studied are shown in Table S2 in the Supplementary Materials.
According to Figure 10a, there is not a monotonic relationship between the circumscribed circumference diameter and the shape error order, in line with the results from previous authors [28]. As shown in Figure 10b, there is not a significant difference among all the order cases regarding the distance between the initial position of the center of the ring and the center of the circumscribed circumference. Figure 10c,d graphically illustrate how the harmonic order of the shape error governs the ring’s orbit. With a 2nd-order (elliptical) error (Figure 10c), the trajectory forms a two-axis ellipse that alternately loads two distinct bearings. As the ring rotates, each lobe alternately engages and disengages the spring-loaded bearing, causing the center to shift between two principal contact regions. In contrast, in the 3rd-order error (Figure 10d) each of the three lobes sequentially engages a different bearing, leading to three distinct “bumps” in the trajectory. Because the bearing layout (Z = 3) matches the harmonic order, the motion is more symmetric but can produce slightly larger peak deviations produces a three-lobed path, resulting in a more symmetric but still pronounced runout.
3.2.2. Influence of the Amplitude of Roundness Error
This section analyzes the impact of the profile error amplitude of the ring at the second and sixth harmonic orders. These specific orders were selected based on results obtained from the previous simulations, which indicated variability in the circumscribed circumference diameter values across different harmonic orders, as shown in Figure 10. Certain orders produced pronounced variations, while others resulted in minimal values of the circumscribed circumference diameter. To systematically examine the range of such values, the second harmonic order was chosen to represent a low-value diameter, while the sixth to represent a high-value diameter. This approach allows for a comprehensive assessment of the influence of roundness error amplitude across a spectrum of the ring’s responses.
Figure 11a shows how the circumference diameter values grow as the amplitude of the error increases. Figure 11b presents the variation of the distance between the initial position of the center of the ring and the center of the circumscribed circumference in relation to the variation of the error’s amplitude. The relationship between Dtrajectory and the error’s amplitude is linear for low amplitude values. However, this behavior changes when the error’s amplitude reaches higher values.
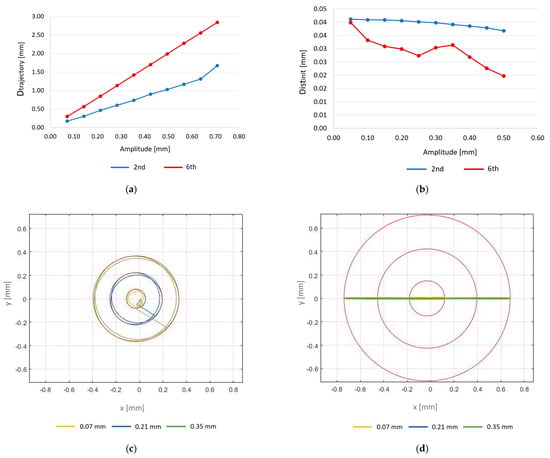
Figure 11.
(a) Dtrajectory vs. error’s amplitude; (b) Distinit vs. error’s amplitude; (c) ring’s center trajectory and its circumscribed circumference (red) for 0.07 mm, 0.21 mm, and 0.35 mm amplitudes for the 2nd order model; (d) ring’s center trajectory and its circumscribed circumference (red) for 0.07 mm, 0.21 mm, and 0.35 mm amplitudes for the 6th order model.
For result visualization purposes, Figure 11c,d represent the trajectory of the center of the ring and the circumscribed circumference for the second order and the sixth order respectively in correspondence to three amplitude errors applied on the inner surface of the ring: 0.07 mm, 0.21 mm and 0.35 mm.
3.3. Error Combinations
The results of the shape error combinations are shown in Figure 12. Reference behaviors, shaded in Figure 12, report results obtained for the single shape error on the inner surface of the ring and can be used to study interactions. For better outcome interpretation, the results were grouped based on the ring’s shape error order. All the interaction cases were compared to a single-error case on the inner surface of the ring.
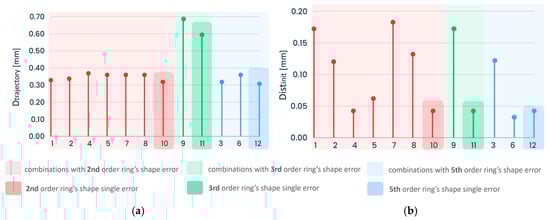
Figure 12.
Order error combination influence: (a) Dtrajectory; (b) Distinit.
Figure 12a depicts the influence of the shape error’s order and its combination on the ring’s behavior. The addition of other errors on the bearing’s outer surface or their position does not produce significant variations of the circumscribed circumference diameter; on the contrary, it has an impact on the distance between the initial position of the center of the ring and the center of the circumscribed circumference (Figure 12b). Comparing combination cases 1 and 2 (ring’s shape error—bearings position error) with combination cases 4 and 5 (ring’s shape error—bearings shape error), it can be concluded that errors in bearings’ position have a major influence compared to errors in the bearing surface and this is due to differences between the respective amplitudes. For the purpose of results representation, Figure 13 shows the ring’s center trajectory in static and dynamic phases for four different combination cases.
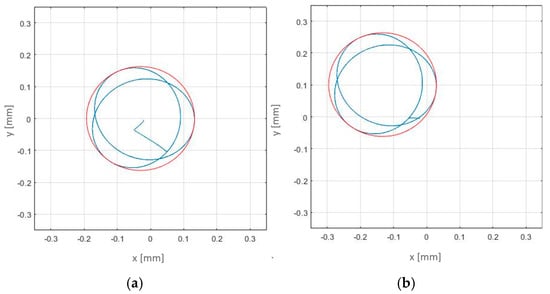
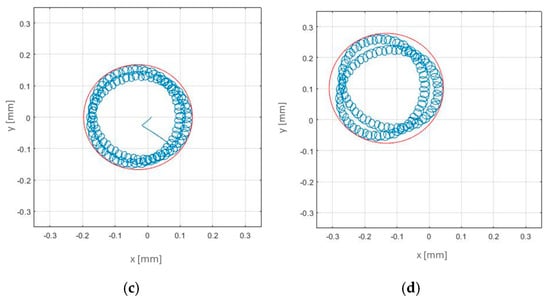
Figure 13.
Ring’s center trajectory (blue) and circumscribing circumference (red) in four different combination cases: (a) case 10—2nd order ring’s shape single error; (b) case 2—2nd order ring’s shape error and 2nd order bearing position errors; (c) case 4—2nd order ring’s shape error and 2nd order bearing shape errors; (d) case 7—2nd order ring’s shape error, 2nd order bearing position, and 2nd order bearing shape errors.
4. Discussion
The workflow here developed can be applied to assess the impact of geometrical errors affecting profiles or position errors. The multibody model can be used to inspect a single effect or error combinations both in static and dynamic conditions. The ring is kept in place by an elastic component, and this results in errors affecting both its initial position (initial offset) and its trajectory. Trajectory errors are determined not only by the amplitude of the profile errors but also by error orders that influence the elastic component behavior.
When only the order effect is studied, the greater influence of the error is observed for orders that follow a certain pattern. In accordance with [28], when the number of bearings Z is odd (Z = 3 in the present case), the minimum value of the circumscribed circumference diameter is obtained for orders (Z ± 1)/2 + (n − 1) · Z, and the maximum for n·Z, where n is a natural number. Importantly, the initial assembly state (relative ring and roller positions) determines which rollers contact which error lobes, so that even the same shape error can yield different ring displacements under different mounting conditions [28]. Therefore, to improve the rotational accuracy of the dynamic system, the harmonic components that present n·Z orders must be avoided during the manufacturing process.
Given the order of shape errors with an amplitude of 0.14 mm, the ring trajectory errors are in the range of [0.29–0.63] mm (Figure 10); the runout error may reach up to 2 to 4.5 times the amplitude of the ring’s profile error. Meanwhile, the distance between the initial position of the center of the ring and the center of the circumscribed circumference does not have significant variation through all the order cases. This is due to the spring bearing which follows the ring’s profile. The impact of the order of profile errors implies that the rotating speed is relevant.
Due to the previous considerations, the circumscribed circumference diameter can assume high or low values, based on the order case. These considerations helped to select the second computational setup to cover the entire range and to study the amplitude influence. Based on these preliminary considerations, the trajectory error varies significantly depending on the harmonic order, with potential for both high and low values. To comprehensively evaluate this variability, initial offset values were categorized into low and high levels. This framework informed the selection of the second computational setup, which was designed to span the entire range of potential values, thereby enabling a thorough analysis of amplitude effects on radial runout error. This setup allows for a robust investigation of how amplitude variations impact the overall runout error across different harmonic orders.
The sensitivity to harmonic order is further evident in the amplitude of the run-out response. Given the amplitude of shape errors, the ring trajectory errors are in the range of [0.17–2.84] mm (Figure 11). Consistent with prior studies on bearing accuracy [26,28], the relationship between the amplitude of the profile error and the circumscribed circumference diameter is quasi-linear, since larger form deviations raise the peak–valley height of the raceway. Notably, amplitude effects are not uniform across orders: consistent with the literature, we see that for orders like (Z ± 1)/2 + (n − 1) · Z (Z odd) even a large amplitude has only a small impact, whereas for order n·Z it has a dramatic impact. This explains why in the results, some error harmonics appear “benign” to amplitude changes while others induce steep rises in amplitude change.
In the second part of the study, combinations of shape and positional errors were investigated to understand their interactive influence on the system’s behavior. The results, as presented in Figure 12, show a notable increase in the initial displacement (Distinit) when multiple error types are combined, while the trajectory diameter (Dtrajectory) during rotation remains largely consistent with that of the single shape-error cases. This indicates that the interaction between different error sources—particularly shape deviations of the ring and positional offsets of the bearings—exerts its primary influence during the static phase, when the ring finds its equilibrium position relative to the preloaded bearing. The mechanism underlying this behavior arises from the engagement of shape lobes with bearing contact points. When bearing positions are slightly perturbed, even low-order shape deviations of the ring are encountered at different angular locations, effectively changing the angle of interaction. This causes a geometric mismatch between the ring profile and the preload path, resulting in a lateral shift of the ring center to minimize energy under contact constraints. The system stabilizes in a new position that accommodates both the lobed geometry and the altered bearing layout, leading to a larger Distinit, even if the rotating runout amplitude does not increase substantially. Positional errors of the same harmonic order and amplitude shift the static equilibrium by up to 0.04–0.18 mm in cases 1–4, but only marginally changing Dtrajectory. This difference arises because position errors alter the preload geometry before rotation, whereas dynamic runout is governed more by the ring’s profile under cyclic loading [28]. Similar effects have been described in high-precision assemblies, where mounting eccentricities modulate contact phase and amplify positional drift without necessarily affecting dynamic error magnitude [29,30]. Moreover, both positioning errors and trajectory errors may actually be lower than the sum of single error effects: shape and positional tolerances do not merely additively superpose—they modulate each other’s effect via the changing contact geometry.
The simulation cases that included bearing shape errors (cases 4–6 and 7–9) did not show a significant rise in Dtrajectory either. This is attributed to the smaller absolute amplitude of bearing profile errors (e.g., for bearings having an outer diameter of 10.0 mm the tolerances are less than 0.01 mm [17]). As a result, although three combined error sources are present in cases 7–9, the dynamic influence remains subdued compared to the effect of initial offset. These findings confirm that Distinit is a more sensitive metric for assessing multi-tolerance interactions in lightly loaded or elastically preloaded bearing systems, where the ring adjusts its position before rotation begins. Thus, for precision-critical applications, both static displacement and dynamic runout must be evaluated, as they respond to different aspects of the tolerance chain.
The model validation was performed through an experimental analysis. The shape profile of the ring’s edges recorded by the roundness instrument shows that the lower edge presents a smaller radius compared to the upper one. This is due to the manufacturing technique implemented to build the ring: the waterjet laser technique produces a tapering effect on the cutting surface [25]. Furthermore, the 0.0945 mm measured profile amplitude closely matches the value used in the tolerance analysis (Cn = 0.14 mm), validating the relevance of the shape order and interaction studies presented in previous sections. The Fourier analysis of the edges shows the amplitude of the second harmonic component to be dominant for both profiles, so both shapes are similar (mainly elliptical).
The resulting runout errors amplitude agreed between experimental and numerical tests (72.9 μm vs. 88.6 μm, respectively). Phase shifts between numerical and experimental results cannot be compared to each other as the initial measurement point on the ring is unknown. The starting angle of measurement in the experimental setup is not aligned with a known geometric feature, meaning any phase shift between the numerical and experimental profiles could shift peaks and valleys in a way that alters the apparent runout. This phase shift means that while both the experimental and simulated orbits trace similar patterns—e.g., elliptical or lobed paths—their orientation in the coordinate frame differs. Consequently, maximum and minimum points do not align, and the trajectory curves cannot be overlaid directly without applying an arbitrary rotational transformation. Since the goal of this study was to assess the magnitude and shape of the runout rather than its absolute angular position, the validation focused on peak-to-peak amplitude (Dtrajectory) and orbit shape symmetry rather than phase-coherent alignment.
The discrepancy can be attributed to several model simplifications:
- The most prominent simplification in the numerical model is the assumption that both the ring and the bearings behave as perfectly rigid bodies. The rigid-body assumption is justified for this system given the low speeds, relatively high stiffness of the ring and bearings, and the geometric scale of the tolerance-induced deviations. However, in high-speed, thin-walled, or ultra-precision applications, elastic deformation could significantly influence both static and dynamic responses and should be incorporated through compliant multibody or FEM-based modeling extensions.
- The present model targets low-speed operation (270°/s) with a fixed preload and rigid bodies coupled by penalty-based contact with normal and tangential compliances, viscous damping, and Coulomb friction with stiction and friction transitions. Lubrication, material hysteresis, and structural flexibility are not included. Jacobs et al. [31] experimentally show the formation of a lubricant film changes the stiffness and damping of a deep-groove ball bearing. Alfares et al. [32] show that the initial axial preload applied to the bearings plays a significant role in reducing the vibration levels. Following Jang & Jeong’s rigid-rotor formulation [33], the cage and ball-spin frequencies increase with speed via centrifugal and gyroscopic effects, so the principal order lines shift upward. Therefore, the here developed predictions should be interpreted as conservative for geometric-error-driven runout within the tested regime.
- The experimental ring is supported by physical bearings whose seating and alignment introduce subtle misalignments and damp high-frequency modes. The simulation, by contrast, assumes perfectly fixed vertical DOF of the ring and no assembly clearance.
- The reconstructed ring profile was assumed to be a perfect vertical extrusion between upper and lower cross-sections, whereas the real ring cut via waterjet may have slight axial taper or warping; the actual contact circumference between the bearings and the ring may present other shape errors that are not considered in this case. This approximation could magnify the lobing effect in the model compared to the smoother real contact behavior.
- Only the profile error of the inner ring surface was experimentally measured: in the actual model, there are several more tolerances to be examined, such as position error of the bearings, shape error of the bearings, diameter error, flatness, perpendicularity, etc.; being true that these have a smaller impact, their effect is not null. In particular, the exclusion of bearing position errors and housing misalignments may cause the model to over-predict sensitivity to the ring profile alone. Prior studies [24,27] emphasize that tolerance interactions are nonlinear, and overemphasis on a single tolerance source may inflate its simulated impact.
Nonetheless, the model validation produced positive results since model simulation errors are kept below the expected circularity tolerance of 0.20 mm. The close match in the trajectory shape and the systematic dynamic overestimation (rather than erratic error) confirms that the model accurately reflects the physical mechanism of shape-induced runout. The 21.5% margin thus provides a reliable conservative envelope, indicating that the multibody model can be used for design and tolerance prediction even when full elastic and tribological modeling is not feasible. Future refinement could include compliant contact modeling or stiffness calibration based on bearing test data. The validated workflow readily accommodates 3D and higher speed extensions. The current model already includes in-plane translations and tilts of the ring. Axial taper and/or warping can be incorporated without altering the solver architecture by the Fourier parametric error description used for shapes and positions within the same workflow. On the dynamics side, the imposed motion law Rz(t), the parametrized spring preload and stiffness, and the IMPACT contact with compliance and damping already in the model allow speed and preload sweeps without changes to the topology of the model.
Despite some limitations of the numerical approach and the uncertainty of the experimental setup, the model-predicted values are consistent with the experimental outcome: the numerical results closely follow the trend of the experimental data, capturing a smooth periodic oscillation as well as their amplitude. The analytical estimation and dynamic effects would have been very hard to compute considering that the ring position is set by an elastic component, and secondly, the estimation becomes very complex when more errors are considered.
5. Conclusions
The method outlined here is very versatile and can allow the optimization of the bearings’ tolerances or any large components such as rings according to specifications on the position accuracy and the roundness error. The objective here is preliminary design screening to study the effect of the propagation of measured geometric deviations through a transparent MBD model and quantify their impact on runout under representative low-speed and fixed preload conditions. The model can be customized considering actual manufacturing errors, assessed through dedicated metrology campaigns, so that the respective outcome can be foreseen without specific experimentation and, most importantly, the effort to improve the manufacturing process can be directed towards the most effective improvements to the end of position accuracy. This work, by incorporating harmonic surface errors into such a multibody framework, complements recent efforts to validate complex bearing models against experiments. Among the investigated error sources, bearing position errors affect the static offset, as they directly change the preload geometry before rotation. Roundness profiles, particularly with harmonic orders matching the supporting bearings number n·Z, dominate the trajectory of the ring during rotation. Considering that the static offset can be compensated for a posteriori, the most critical errors are those related to critical harmonic orders in ring geometry.
The results provide a validated framework for quantifying tolerance effects in mechanisms requiring high precision. The findings contribute to industrial reliability, improved precision in robotics, manufacturing, and reduced time waste from over-specification of tolerances.
The multibody model not only provides kinematic information, but also dynamic output so that vibrations can be assessed, and this is particularly important in the case of transportation of components containing liquids and/or if repeated accelerations, stops, and inversion of rotation are foreseen.
Supplementary Materials
The following supporting information can be downloaded at: https://www.mdpi.com/article/10.3390/designs9050120/s1, Section S1—Material Description; Table S1: Material Description; Section S2—Modeling Assumptions; Section S3—Contact Parameters Modeling; Figure S1: Contact parameters tuning: (a) e coefficient; (b) penetration depth d; (c) stiffness k and damping c; (d) three parameters change; Section S4—Trajectory for all order cases; Table S2: Circumscribed Circumference for all order cases.
Author Contributions
Conceptualization, U.K. and E.M.Z.; methodology, U.K.; software, G.P.; validation, U.K.; formal analysis, M.C.; investigation, E.M.Z. and G.P.; resources, M.C.; data curation, U.K. and G.P.; writing—original draft preparation, U.K.; writing—review and editing, E.M.Z., G.P. and M.C.; visualization, M.C.; supervision, E.M.Z. All authors have read and agreed to the published version of the manuscript.
Funding
This research was funded by European Union—Next Generation EU, Mission 4 Component 2 CUP E12B22000470006 and by DiaSorin S.p.A. (Saluggia, Italy).
Institutional Review Board Statement
Not applicable.
Informed Consent Statement
Not applicable.
Data Availability Statement
The data supporting the findings of this study, including simulation inputs and experimental results, are available from the corresponding author upon reasonable request. Proprietary manufacturing data from the ring supplier are not publicly available due to confidentiality agreements.
Conflicts of Interest
The authors declare no conflicts of interest.
Abbreviations
The following abbreviations are used in this manuscript:
| CNC | Computer Numerical Control |
| CMM | Coordinate Measuring Machine |
| MBD | Multibody Dynamic |
| ISO | International Organization for Standardization |
| LT | Laser Triangulator |
| DOF | Degree Of Freedom |
| FEM | Finite Element Method |
References
- Slocum, A.H. Precision Machine Design; Society of Manufacturing Engineers: Southfield, MI, USA, 1992. [Google Scholar]
- Niemann, G.; Winter, H. Machine Elements Volume 2: Machine Components; Springer: Berlin/Heidelberg, Germany, 1989. [Google Scholar]
- Hou, Y.; Wang, X. Measurement of load distribution in a cylindrical roller bearing with an instrumented housing: Finite element validation and experimental study. Tribol. Int. 2021, 155, 106785. [Google Scholar] [CrossRef]
- Mikić, D.; Desnica, E.; Kiss, I.; Mikić, V. Reliability Analysis of Rolling Ball Bearings Considering the Bearing Radial Clearance and Operating Temperature. Adv. Eng. Lett. 2022, 1, 16–22. [Google Scholar] [CrossRef]
- Pastukhov, A.; Timashov, E.; Stanojević, D. Temperature Conditions and Diagnostics of Bearings. Appl. Eng. Lett. 2023, 8, 45–51. [Google Scholar] [CrossRef]
- Pastukhov, A.; Timashov, E. Procedure for Simulation of Stable Thermal Conductivity of Bearing Assemblies. Adv. Eng. Lett. 2023, 2, 58–63. [Google Scholar] [CrossRef]
- Noguchi, S.; Ono, K. Reduction of NRRO in ball bearings for HDD spindle motors. Precis. Eng. 2004, 28, 409–418. [Google Scholar] [CrossRef]
- Bhateja, C.P.; Pine, R.D. The rotational accuracy characteristics of the preloaded hollow roller bearing. J. Lubr. Technol. 1981, 103, 6–12. [Google Scholar] [CrossRef]
- Okamoto, J.; Ohmori, T.; Kitahara, T. Study on run-out of ball bearings: Relation between unroundness of race and locus of shaft in rotation. J. Jpn. Soc. Tribol. 2001, 46, 578–584. [Google Scholar]
- Wang, L.; Cui, L.; Zheng, D.; Gu, L. Nonlinear dynamic behaviors of a rotor roller bearing system with radial clearances and waviness considered. Chin. J. Aeronaut. 2008, 21, 86–96. [Google Scholar] [CrossRef]
- Yang, Z.; Hong, J.; Liu, J.; Ding, Y.H.; Wang, M. Theoretical method to reduce the non-repetitive run-out (NRRO) of angular contact ball bearings. In Proceedings of the 2011 IEEE International Symposium on Assembly and Manufacturing (ISAM), Tampere, Finland, 25–27 May 2011. [Google Scholar] [CrossRef]
- Li, Y.; Shang, D.; Liu, Y. Kinematic modeling and error analysis of Delta robot considering parallelism error. Int. J. Adv. Robot. Syst. 2019, 16, 1729881419878927. [Google Scholar] [CrossRef]
- Yang, J.; Guan, J.; Ye, X.; Li, B.; Cao, Y. Effects of geometric and spindle errors on the quality of end turning surface. J. Zhejiang Univ.-Sci. 2015, 16, 371–386. [Google Scholar] [CrossRef]
- Zheng, T.; Xu, A.; Xu, X.; Liu, M. Modeling and compensation of inertial sensor errors in measurement systems. Electronics 2023, 12, 2458. [Google Scholar] [CrossRef]
- Ito, S.; Tsutsumi, D.; Kamiya, K.; Matsumoto, K.; Kawasegi, N. Measurement of form error of a probe tip ball for coordinate measuring machine (CMM) using a rotating reference sphere. Precis. Eng. 2020, 61, 41–47. [Google Scholar] [CrossRef]
- Chun, H.; Kwon, S.J.; Tak, T. Multibody approach for tolerance analysis and optimization of mechanical systems. J. Mech. Sci. Technol. 2008, 22, 276–286. [Google Scholar] [CrossRef]
- ISO 492; Rolling Bearings—Radial Bearings—Geometrical Product Specifications (GPS) and Tolerance Values. International Organization for Standardization: Geneva, Switzerland, 2023.
- DIN867; Basic Rack Tooth Profiles for Involute Teeth of Cylindrical Gears for General Engineering and Heavy Engineering. Deutsches Institut für Normung: Berlin, Germany, 1986.
- MSC Software Corporation. Adams User’s Guide, Version 2022.1; MSC Software Corporation: Newport Beach, CA, USA, 2022. [Google Scholar]
- Harris, T.A. Rolling Bearing Analysis, 4th ed.; Wiley-Interscience: New York, NY, USA, 2001. [Google Scholar]
- Johnson, K.L. Contact Mechanics; Cambridge University Press: Cambridge, UK, 1985. [Google Scholar]
- Barrett, R.T. Fastener Design Manual; NASA Reference Publication 1228; National Aeronautics and Space Administration: Washington, DC, USA, 1990. [Google Scholar]
- Görög, A.; Görögová, I. Application of Fourier series for evaluation of roundness profiles in metrology. Adv. Sci. Technol. Res. J. 2019, 13, 30–38. [Google Scholar] [CrossRef]
- ISO 1101:2017; Geometrical Product Specifications (GPS)—Geometrical Tolerancing—Tolerances of Form, Orientation, Location and Run-Out. International Organization for Standardization: Geneva, Switzerland, 2017.
- Ruiz-García, R.; Mayuet Ares, P.F.; Vázquez-Martínez, J.M.; Salguero, J. Influence of abrasive waterjet parameters on the cutting and drilling of CFRP/UNS A97075 and UNS A97075/CFRP stacks. Materials 2019, 12, 107. [Google Scholar] [CrossRef]
- Cui, D.; Yu, Y.; Xue, Y.; Guo, P.; Han, H.; Cai, H. Effect of roundness error of the grooves on the inner ring runout of angular contact ball bearings. Machines 2024, 12, 532. [Google Scholar] [CrossRef]
- Zhang, P. Accuracy prediction and roller number optimization of journal roller bearing based on averaging coefficient considering raceway roundness error. J. Braz. Soc. Mech. Sci. Eng. 2023, 45, 203. [Google Scholar] [CrossRef]
- Yu, Y.; Li, J.; Xue, Y. Influence of roundness errors of bearing components on rotational accuracy of cylindrical roller bearings. Sci. Rep. 2022, 12, 6794. [Google Scholar] [CrossRef] [PubMed]
- Ono, K.; Takahashi, K. Theoretical analysis of shaft vibration supported by a ball bearing with small sinusoidal waviness. IEEE Trans. Magn. 1996, 32, 1709–1714. [Google Scholar] [CrossRef]
- Giraudo, L.; Di Maggio, L.G.; Giorio, L.; Delprete, C. Dynamic multibody modeling of spherical roller bearings with localized defects for large-scale rotating machinery. Sensors 2025, 25, 2419. [Google Scholar] [CrossRef]
- Jacobs, W.; Boonen, R.; Sas, P.; Moens, D. The influence of the lubricant film on the stiffness and damping characteristics of a deep groove ball bearing. Mech. Syst. Signal Process. 2014, 42, 335–350. [Google Scholar] [CrossRef]
- Alfares, M.A.; Elsharkawy, A.A. Effects of axial preloading of angular contact ball bearings on the dynamics of a grinding machine spindle system. J. Mater. Process. Technol. 2003, 136, 48–59. [Google Scholar] [CrossRef]
- Jang, G.; Jeong, S.-W. Vibration analysis of a rotating system due to the effect of ball bearing waviness. J. Sound Vib. 2004, 269, 709–726. [Google Scholar] [CrossRef]
Disclaimer/Publisher’s Note: The statements, opinions and data contained in all publications are solely those of the individual author(s) and contributor(s) and not of MDPI and/or the editor(s). MDPI and/or the editor(s) disclaim responsibility for any injury to people or property resulting from any ideas, methods, instructions or products referred to in the content. |
© 2025 by the authors. Licensee MDPI, Basel, Switzerland. This article is an open access article distributed under the terms and conditions of the Creative Commons Attribution (CC BY) license (https://creativecommons.org/licenses/by/4.0/).