Abstract
The growing demand for renewable energy in space-constrained environments highlights the need for compact, high-efficiency wind energy systems. Conventional bare wind turbine (BWT) arrays suffer from severe wake interactions and performance degradation when operated in tandem or closely spaced configurations. To address these limitations, this study investigates the aerodynamic performance and near-wake dynamics of a novel multi-ducted wind turbine (MDWT) system that integrates passive flow-control technique (PFCT) into an innovative fixed-duct design. The objective is to evaluate how tandem ducted arrangements with this integrated mechanism influence wake recovery, vortex dynamics, and power generation compared with multi-bare wind turbine (MBWT) system. A numerical approach is employed using the Unsteady Reynolds-Averaged Navier–Stokes (URANS) formulation with the k–ω SST turbulence model, validated against experimental data. The analysis focuses on two identical, fixed-orientation ducts arranged in tandem without lateral offset, tested under three spacing configurations. The results reveal that the ducted system accelerates the near-wake flow and displaces velocity-deficit regions downward due to the passive flow-control sheets, producing stronger inflow fluctuations and enhanced turbulence mixing. These effects improve wake recovery and mitigate energy losses behind the first turbine. Quantitatively, the MDWT array achieves total power outputs 1.99, 1.90, and 1.81 times greater than those of the MBWT array for Configurations No. 1, No. 2, and No. 3, respectively. In particular, the second duct in Configuration No. 1 demonstrates a 3.46-fold increase in power coefficient compared with its bare counterpart. These substantial gains arise because the upstream duct–PFCT assembly generates a favorable pressure gradient that entrains ambient air into the wake, while coherent tip vortices and redirected shear flows enhance mixing and channel high-momentum fluid toward the downstream rotor plane. The consistent performance across spacings further confirms that duct-induced flow acceleration and organized vortex structures dominate over natural wake recovery effects, maintaining efficient energy transfer between turbines. The study concludes that closely spaced MDWT systems provide a compact and modular solution for maximizing energy extraction in constrained environments.
1. Introduction
International climate challenges and policy commitments increasingly support the development of renewable energy applications. Among these, wind energy has emerged as one of the most important renewable energy resources over recent decades due to its abundance, scalability, and low environmental footprint. However, wind energy applications suffer from persistent issues that affect their performance, most notably turbine wake zone problems. Previous studies have pointed out that between 10 and 40% of production losses in wind farms are attributable to the wake area, which causes a flow speed deficit, generates complex vortex structures, and induces high turbulence intensity levels [1]. Consequently, optimizing the wind turbine layout within a farm is necessary to avoid wake effects and maximize energy production. In this context, the impact of the spacing between turbine arrays on wind farm performance has been extensively studied by many researchers [2], yet further investigation is required to develop innovative design strategies capable of mitigating wake losses and enhancing overall efficiency.
1.1. Bare Wind Turbines
Several researchers have examined the effect of altering the lateral distance among bare HAWTs, including the influence of turbine alignment on the total generated energy [3,4]. Forsting and Troldborg [4] explored the individual power output of a row of five laterally arranged turbines separated by a 3D (Three-Rotor-Diameter) distance. The results demonstrated a 1.1–2% increase in energy generation when the primary inflow was redirected by an angle of 45°. McTavish et al. [3] demonstrated that a strategic reduction in lateral turbine spacing induces a beneficial in-field blockage effect. This phenomenon results in accelerated flow velocities between turbines, ultimately enhancing power output. Their findings suggest that this configuration offers dual advantages: improved wind farm efficiency and reduced spatial requirements.
Other studies have focused on the downstream distance between turbines arranged in a line and the mechanisms that enhance the power produced by the array. Zong and Porté-Agel [5] experimentally tested three mini wind turbines configured in a farm layout, investigating the effect of an active yaw control system in the range of –40° to 40° on power generation. Seven different wake conditions were evaluated by changing the spanwise distance among adjacent turbines across a range of –1D to 1D, with an increment of 1/3D for each tested step. The deflection of turbine columns at an angle of 2–4° yielded an 18% increase in power generation. Many authors [6,7,8] have experimentally or numerically examined the configuration of closely arranged multi-bare rotors on a single tower as a solution to increase the power produced while maintaining the same rotor bulk.
1.2. Ducted Wind Turbines
Various investigations have been performed on diffuser augmented wind turbines (DAWTs) or ducted horizontal-axis wind turbines, arranged in a specific layout called multi-rotor systems (MRSs), to investigate the possibility of increasing the overall power output of these layouts. Feng et al. [9] experimentally and numerically investigated the performance of two tandem mini-ducted tidal surrounding horizontal-axis wind turbines (HAWTs’) rotors configured at a variably spaced distance across a range of (5D–10D). They noted that the performance of the back turbine was reduced to 50% compared to the front turbine at the proposed spacing, and oscillations in the loads by a factor of 2–5 were detected owing to the upstream wake and surrounding field effects. However, the performance increased to 80% after a spacing of 10D, although still without reducing the load oscillation.
Watanabe and Ohya [10] studied both experimentally and numerically the aerodynamic characteristics and power produced by three DAWTs positioned close to each other in either triangular or side-by-side arrangements. The ratio of the distance or gaps between the DAWTs’ brims to the diameter of the brim was in the range of (0.01–0.3). The findings indicated a 12% gain in power in the side-by-side configuration and 10% in the triangular configuration. The optimum distance was found to be 0.2 for both cases. They attributed the power output gain to the low-pressure areas created by the vortices behind the gaps between the ducts.
Göltenbott et al. [2] performed an experimental investigation of the aerodynamic patterns and performance of two arrangements of DAWTs. The first involved testing a structure of two DAWTs with surrounding horizontal-axis wind turbines, which were closely arranged side-by-side and spaced at various distances or gaps. The second arrangement comprised three DAWTs with identical separation gaps. The side gaps between the DAWTs were in the range of (0–0.5D) with an increment of 0.05D for each test. The maximum output power of the arrangement of the three DAWTs was 9% higher than that of the single DAWT, whereas the increase was 5% for the arrangement of two DAWTs. The maximum increase of 9% occurred at a gap of 0.15D. These results indicate that the coherent configuration of the bare wind turbine (BWT), as in the case of the DAWT turbines, increased the energy output, further indicating that the suitable proximity between HAWTs, whether shrouded or not, improved their performance.
Carrillo et al. [11] performed both tunnel experiments and CFD tests to analyze the performance of different configurations of three wind-lens turbines. The configurations were side-by-side arrangements with a gap ratio (gap/diameter brim) in the range (0–0.3), while the other arrangement was a staggered layout, which differed from the first in changing the location of the centered turbine to the front of the two other turbines. In addition, a side-by-side arrangement of two DAWTs was examined. The findings demonstrated that the average power produced by the configurations under test increased compared with that of the standalone turbine, with the side-by-side cases presenting better performance than the other cases.
Gunasekaran et al. [12] analyzed the flow interactions between two WLTs closely arranged side-by-side with a gap between their adjacent brims in a range of (x/D-brim = 0.1–0.5) using experimental methods. Three different WLT geometries were investigated. The findings showed that the wakes of the turbines were merged at a gap of (0.1–0.2) due to the proximity, combined with the lowering frequency of vortex shedding. A smaller distance between the WLTs resulted in a more stable low-pressure area behind the lenses.
S. Watanabe et al. [13] suggested a computational fluid dynamics (CFD) approach developed to evaluate the aerodynamic performance of large-size MRSs of DAWTs, using the Lattice Boltzmann method, which is notably practical for large-size CFD simulations. Halawa et al. [14] analyzed numerically the aerodynamic interactions of an MRS employing fully designed DAWTs. They studied two DAWTs separated by a distance equal to (s/D) = 0.2, which represents the optimum value for the ratio of the gap between the brims of WTLs to the diameter of WLTs including brim borders.
In addition, researchers studied the incorporation of two HAWT rotors in the same duct [15,16,17] and examined the effect of using a dual-rotor system inside a duct with different rotor diameters, varying distances between rotors, changes in the rotor rotation direction, and variations in the speed of upstream flow.
1.3. Methodological Limitations and the State of Numerical/Experimental Approaches
The research on ducted turbines spans analytical models, numerical simulations, and experimental validation, yet the literature reveals persistent methodological constraints and conflicting interpretations. Early one-dimensional and vortex-based models predicted dramatic power gains from diffuser-augmented turbines, even beyond the Betz limit. However, subsequent wind tunnel and in situ measurements have frequently shown more modest improvements, highlighting a recurring gap between theoretical predictions and experimental realities.
Recent numerical studies, such as those by Silva et al. [18], employ high-fidelity Reynolds-averaged Navier–Stokes (RANS) solvers to resolve wake dynamics and tip vortex trajectories in shrouded turbines. These efforts demonstrate that conventional tools, such as Prandtl’s tip-loss corrections, are inadequate under ducted configurations. Similarly, parametric optimization frameworks—combining CFD with machine learning (Hwang et al. [19]) or response surface methodology (Shambira et al. [20])—show promise for reducing computational costs while maintaining predictive accuracy. Nonetheless, their reliance on simplified turbulence models and limited experimental benchmarking constrains their generalizability.
Comparison across studies also reveals disagreement in reported performance trends. Some authors emphasize blockage effects and flow acceleration in ducts as pathways to efficiency gains [20], whereas others stress wake-induced losses and flow separation as critical limiting factors [18]. For instance, concentrator–diffuser designs with flanges have been reported to achieve up to fivefold power increases in low-wind-speed regions [20], while alternative CFD investigations caution that excessive vortex formation and hub separation may negate such benefits [19]. Similarly, investigations into twin-rotor and counter-rotating configurations suggest augmentation of mass flow and partial mitigation of tip losses, but results vary depending on turbulence modeling strategies and mesh resolution.
Experimental validation remains comparatively rare. Lipian et al. [21] reported good agreement between fully resolved rotor CFD models and laboratory tests for small-scale shrouded turbines. However, large-scale array concepts—such as reconfigurable ducted systems (Bilgen et al. [22]) or multi-unit spiral rotor configuration (Song et al. [23]), are still primarily evaluated through simulations, without full-scale demonstration. This methodological imbalance skews the literature toward numerically favorable scenarios and limits the transferability of results to real-world installations where structural loads, noise, and cost become decisive factors.
In summary, while numerical approaches continue to advance in fidelity and efficiency, their conclusions remain sensitive to turbulence closure schemes, boundary conditions, and geometric simplifications. Experimental campaigns, though fewer, often challenge optimistic numerical projections, especially regarding scalability and cost-effectiveness. Cross-validation between approaches is therefore limited, and the field remains characterized by contradictions: between predicted blockage-induced benefits and observed wake-related penalties. These tensions highlight the urgent need for coordinated, multi-scale validation frameworks.
1.4. Study Objectives and Approaches
The principal objective of this research is to advance the understanding and application of MDWT systems configured in tandem. Unlike conventional diffuser-augmented or ducted turbines that rely primarily on geometric expansion to enhance flow acceleration, the present study introduces a duct design integrating PFCT-arrangement into the duct walls. This integration represents a key innovation, as it enables wake manipulation and pressure-driven entrainment through thin, strategically inclined flow-control sheets positioned downstream of the duct throat. These sheets re-energizing the near-wake region without any active control mechanisms, and improving the aerodynamic conditions for both upstream and downstream turbines.
This study is structured around three interconnected aims:
- Performance Evaluation: To investigate the aerodynamic and power generation performance of a system comprising two identical, in-line ducted turbines. The proposed duct design integrates a plain conical geometry with a passive flow-control mechanism, with the dual intent of augmenting the total power output of the array and enhancing the performance of individual ducts.
- Wake Interaction Analysis: To characterize the flow interactions and resultant near-wake dynamics within tandem ducted arrays. This aim specifically addresses a gap in the existing literature by quantifying the influence of duct-induced flow acceleration and passive flow control on wake development and recovery.
- Spatial Efficiency Assessment: To evaluate the potential of MDWT configurations to reduce inter-turbine spacing requirements relative to conventional MBWT configurations. A successful reduction would signify improved spatial power density, thereby expanding the feasibility of wind energy deployment in area-constrained environments.
2. Methodology
2.1. Ducts Design and Fabrication
The proposed duct geometry played a pivotal role in defining the aerodynamic performance of ducted wind turbines (DWT) [24]. The design integrated a horizontal-axis wind turbine (HAWT) within a three-dimensional trapezoidal duct configuration, carefully engineered to achieve an optimal balance between aerodynamic efficiency, manufacturability, and structural simplicity. The duct featured a square inlet (34 cm × 34 cm) and a slightly larger square outlet (40 cm × 40 cm). With a length-to-rotor diameter ratio (L/D) of 0.625, the geometry was optimized through iterative parametric refinement to enhance flow acceleration and energy extraction while minimizing geometric complexity, structural mass, and pressure losses.
To further regulate and stabilize the flow, PFCT was implemented at the duct outlet. This system comprised three thin rectangular flow-guiding sheets (each measuring 58 cm × 58 cm), spaced 10 cm apart, and inclined at an expansion angle of 40° relative to the duct’s vertical axis. The sheets were mounted on a 9 cm-wide rectangular brim that framed the outlet (Figure 1a). Their arrangement served to guide the outflow and stabilize the wake region.
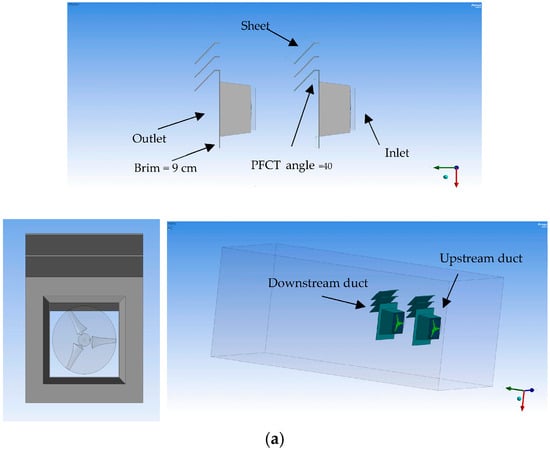
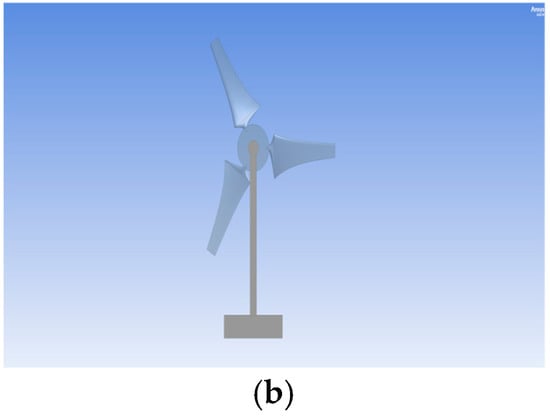
Figure 1.
(a) CAD model of the duct geometry and experimental setup, (b) Bare Wind Turbine.
For fabrication, the ducts were constructed from reinforced cardboard panels supported by wooden frames, ensuring sufficient rigidity and dimensional stability during wind tunnel experiments. The duct geometry was designed and parameterized in ANSYS Workbench (2022 R1), providing precise geometric control and facilitating integration with computational fluid dynamics (CFD) analyses.
2.2. Optimization and Parametric Study
A systematic optimization procedure, illustrated in Figure 2, was employed to refine the design parameters of the ducted wind turbine (DWT). The key design variables were investigated within constrained ranges (Figure 3a–c), as informed by prior studies [25]. Specifically, the duct expansion angle, defined as the half-angle of the diverging conical section, was varied from 3.5° to 11.0° in increments of 2.5°. Concurrently, the duct length-to-rotor diameter ratio (L/D) was tested over an interval of 0.375 to 0.625, with a step size of 0.125. This upper limit of 0.625 was selected to maintain a minimum planned inter-turbine separation distance of 1.5D, thereby ensuring a suitable clearance between the PFCT-sheets and the downstream duct while preserving a compact duct design that balanced structural and performance objectives. Furthermore, the inclination angle of the PFCT-sheets, measured relative to the vertical axis at the duct outlet, was evaluated from 25° to 70° in 15° increments to cover feasible mounting configurations.
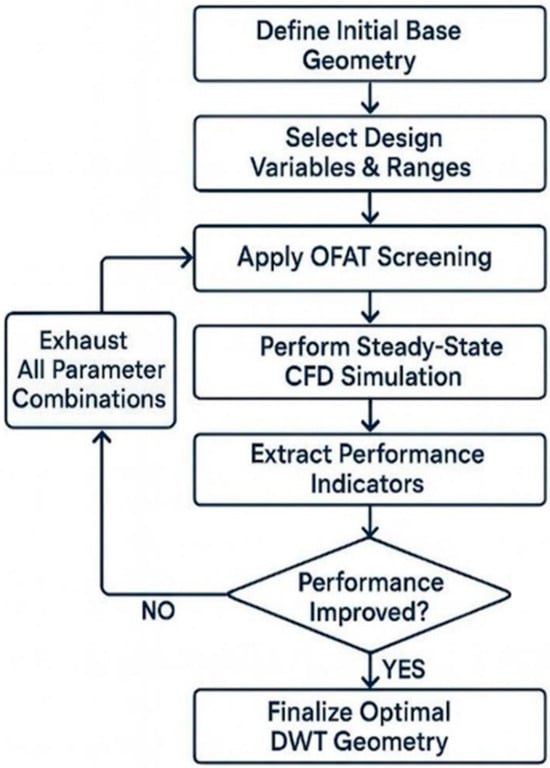
Figure 2.
Flowchart of the systematic optimization procedure.
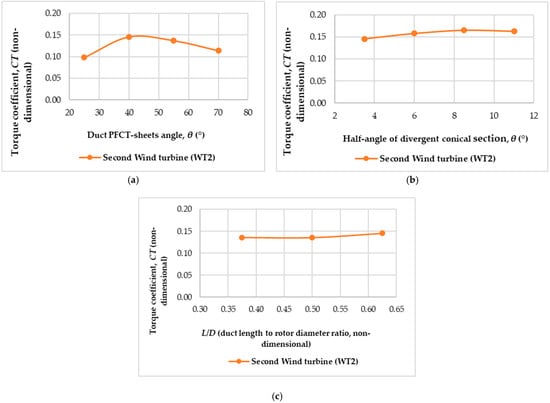
Figure 3.
(a). Torque coefficient vs. PFCT-sheet angle (°), (b). Torque coefficient vs. half-angle of diver gent conical section, θ (°), (c). Torque coefficient vs. duct length to rotor diameter ratio (L/D) for DWT.
To establish initial sensitivity ranges and isolate dominant effects, a one-factor-at-a-time (OFAT) approach was initially applied. While this method is recognized for its inability to capture interaction effects between variables, it provided a computationally efficient means to narrow the design space prior to more advanced multi-variable optimization techniques [26].
At each iteration, the power coefficient (Cp) of the downstream turbine (WT2, in the second duct) was extracted from the simulation results and benchmarked against the baseline turbine performance. This comparative framework ensured that the final configuration not only maximized aerodynamic augmentation but also satisfied structural feasibility and practical manufacturability constraints. As observed in Figure 3a–c, the optimal parameters were as follows: an L/D ratio of 0.625, a sheet angle of 40°, and a half-angle of 8.5° for the diverging conical section.
2.3. Rotor Design and Fabrication
The DWT and BWT, presented in Figure 1b, were designed with identical rotor geometries. This approach was taken to isolate the aerodynamic effects attributable solely to the integration of the duct. The rotor design utilized the NACA 4412 airfoil, which was selected for its favorable lift characteristics and its suitability for the additive manufacturing process [27]. Furthermore, the blade design process adhered to a Blade Element Momentum (BEM) methodology, which was conducted under free-stream flow assumptions. Consequently, this initial design phase did not account for the flow modifications induced by the duct.
The angle of attack was optimized to maximize the lift-to-drag ratio, a standard criterion for enhancing rotor efficiency. To characterize the flow regime, the operating Reynolds number was calculated as 98,658 based on a velocity of 5 m/s and utilized the rotor diameter as the characteristic length.
The rotors were fabricated using 3D printing technology based on CAD models developed in SolidWorks2016(Vélizy, France), allowing precise reproduction of aerodynamic profiles.
2.4. Experimental Setup and Validation
Validation experiments were carried out for both the DWT and BWT configurations. The miniature horizontal-axis wind turbines were mounted on rigid wooden towers to minimize vibrational interference during testing. To establish a fair comparison baseline, the BWT was fabricated with the same rotor diameter, blade geometry, hub, and material as the DWT, thereby ensuring that any performance differences could be attributed solely to the presence of the duct. Computational simulations were conducted in ANSYS Fluent (2022), with CAD modeling carried out in ANSYS Workbench and SolidWorks. The key turbine parameters employed study are summarized in Table 1.

Table 1.
Aerodynamic and geometric specifications of the wind turbine prototype.
2.5. Wind Tunnel Construction
A subsonic wind tunnel was used to validate the single-turbine configurations, as shown in Figure 4a,b. The tunnel was equipped with an axial fan, and a speed controller was used to maintain the target flow velocity of 5 m/s. The fan supplied air to the settling, contraction, and test sections. The detailed specifications of the wind tunnel are provided in Table 2.
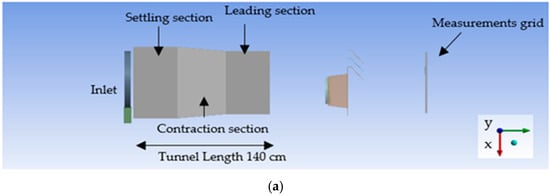
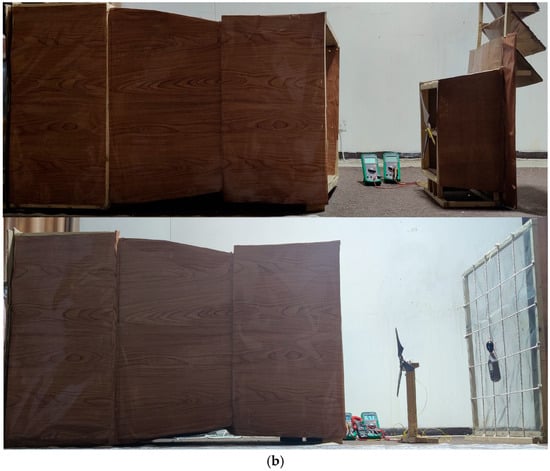
Figure 4.
(a) CAD model of the wind tunnel components and experimental setup, (b) Experimental setup for Single DWT and Single BWT.
Table 2.
Specifications of the experimental wind tunnel setup.
Two wire-grid screens were installed 15 cm from the inlet of the settling chamber, separated by a distance of 5 cm. This separation is equivalent to 50 times the grid cell width of 1 mm, which is considered adequate as it exceeds the typical minimum distance of 30 times the cell width. Each screen was constructed by mounting a square-cell grid onto a 70 cm × 70 cm wooden frame. The wire gauge had a diameter of 0.27 mm. This configuration effectively promotes the decay of turbulent flow patterns [28].
The efficiency of the constructed wind tunnel was verified experimentally. An anemometer was employed to measure the wind velocity, while the inflow turbulence intensity was calculated utilizing equation No. 1 [29].
is founded by utilizing Equations (2) and (3).
The first examination focused on measuring the average velocity of the airflow outside the wind tunnel at three locations. A measurement grid measuring 70 cm × 70 cm was constructed to ensure coverage of both the vertical and spanwise axes at the measurement locations. The grid was a wooden frame with a square shape, covered by a slim-gauge iron wire mesh, which facilitated securely fixing the anemometer. The grid was divided into square segments of equal area using rope. During the measurement campaign, the anemometer was placed at the centroid of each segment, and measurements were taken across three rows [30], as illustrated in Figure 5. The grid was positioned in the (X–Z) plane, perpendicular to the flow direction along the (Y) axis, as shown in Figure 6 and Figure 7. The origin point of the measurement grid plane was aligned with the origin point of the wind tunnel exit. Figure 5 presents a schematic representation of the measuring grid configuration and measurement points.
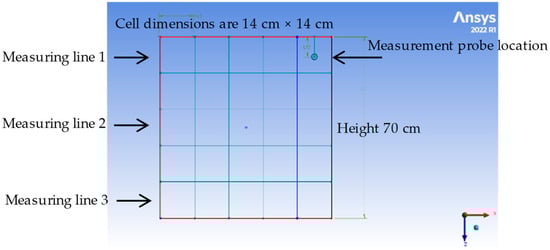
Figure 5.
Schematic representation of the measuring grid configuration, illustrating measurement points.
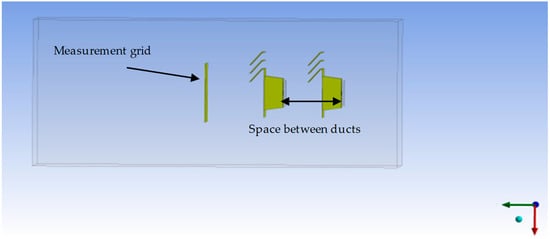
Figure 6.
Installation of the measurement grid downstream of the ducts in the experimental setup.
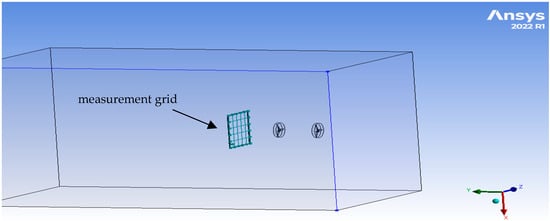
Figure 7.
Installation of the measurement grid downstream of rotors the in the experimental setup.
A hot-wire anemometer was used to measure mean flow velocity in the wake region downstream of the rotor. Its measurable wind speed with an accuracy of ± (5% rdg.), a resolution of 0.1 m/s, and a sampling interval of 0.5 s. The device captures fluctuations at frequencies up to several hundred kHz, providing high time resolution suitable for resolving fine-scale turbulent structures in the wake. The hot-wire technique operates on convective heat transfer: the cooling rate of a heated wire correlates directly with local fluid velocity. This enables highly sensitive detection of small-scale velocity fluctuations and is particularly effective for characterizing turbulence intensity and spectral content. To minimize measurement uncertainty, the probe was aligned with the local flow direction and positioned at multiple downstream stations in the wake.
Each grid point was sampled across two independent repetitions, with each repetition comprising a 30 s data acquisition interval. This limited number of repetitions was justified by the nature of the measured quantity: the anemometer recorded time-averaged wind speed rather than instantaneous values, thereby inherently reducing the requirement for extensive temporal replication. Specifically, the instrument’s internal signal processing algorithm computed the mean wind speed over the acquisition window, ensuring that each recorded value represented a statistically stable estimate of the local flow conditions. Consequently, the experimental design prioritized spatial resolution and coverage over redundant temporal sampling, a methodological choice consistent with established practices in boundary-layer wind tunnel studies where ensemble averaging is substituted by sufficiently long time-averaging intervals (e.g., as discussed in [31]).
For every location, the standard deviation of the velocity was computed. Based on the mean velocity dataset, the statistical results differed slightly between the two configurations.
For the BWT, the overall mean velocity was 1.92 m/s, with a standard deviation of 0.47 m/s. The 95% confidence interval half-width was ±0.15 m/s, and the total experimental uncertainty, combining statistical variability and an assumed instrument uncertainty of ±0.03 m/s, was ±0.16 m/s.
For the DWT, the mean velocity was 2.27 m/s, with a standard deviation of 0.18 m/s. The 95% confidence interval half-width was ±0.059 m/s, and the total combined uncertainty was ±0.066 m/s.
These results demonstrate that, although variability in repeated measurements was moderate (particularly for BWT), the calculated confidence intervals and uncertainties remained statistically well-bounded. Importantly, the experimental uncertainty levels for both configurations were suitably low—in the order of ±0.06 to ±0.16 m/s—indicating high repeatability and measurement fidelity.
2.6. Numerical Setup
Numerical simulations were performed for two distinct cases. First, the initial case analyzed a single wind turbine configuration to determine the optimal tip-speed ratio (TSR) for both ducted and bare turbines, thereby providing a baseline performance reference for subsequent comparative studies. In contrast, the second case examined a two-turbine tandem (in-line) arrangement to assess aerodynamic wake interactions, flow recovery, and potential performance gains or losses due to upstream–downstream interference.
Within this configuration, the optimum TSR was determined specifically for the downstream turbine through a parametric sweep across multiple TSR values, aimed at maximizing the total system power extraction while mitigating wake-induced losses and turbulence effects. This methodology enabled a direct evaluation of wake dynamics, rotor–wake alignment, and energy capture efficiency under practical operating conditions.
2.6.1. Single Turbine Configuration
For this case, numerical simulations were conducted first on a single ducted wind turbine (DWT) and subsequently on a single BWT. To minimize inlet flow disturbances, the single DWT was positioned at a distance of 2D downstream of the domain inlet. A series of steady-state numerical simulations were performed to determine the optimal tip-speed ratio (λ), with the rotor rotation speed calculated using Equation (4). The optimization criterion for selecting the optimum λ value was based on achieving the maximum power coefficient (Cp,max).
2.6.2. Two-Tandem Configuration
In the second case, an investigation was conducted on three distinct in-line configurations of two ducted wind turbines (MDWT). The center-to-center separation distance between the rotor planes was systematically varied: 1.5D in Configuration No. 1, 2.0D in Configuration No. 2, and 2.5D in Configuration No. 3. These specific separation distances were selected for analysis because they correspond to the critical near-wake region of the upstream turbine. This focus on the near-wake is essential, as the flow in this area is characterized by high velocity deficits and elevated turbulence levels. Consequently, analyzing these configurations provided critical insights into the wake interference effects and the potential for performance recovery between closely spaced MDWT [32,33].
Across all twin-turbine arrangements, the upstream turbine (WT1) was positioned at a fixed distance of 2D from the wind tunnel exit—a location previously validated as sufficiently downstream to prevent turbine operation from influencing the inlet velocity profile’s uniformity [34]. This strategic placement minimized inlet distortion effects, thereby isolating performance differences to wake–rotor interactions rather than upstream flow irregularities.
The simulations quantified key aerodynamic parameters—namely, flow speed, static pressure, and turbulence kinetic energy—at three downstream measurement stations (1.5D, 2D, and 2.5D behind WT2), as illustrated in Figure 6. Furthermore, the power coefficients of each turbine and the system-wide total power coefficient were evaluated for all configurations. For benchmarking, identical procedures were applied to two tandem in-line identical bare wind turbines (MBWT) (Figure 7).
A parametric study determined the optimum tip-speed ratio (λ) for WT2, with WT1’s λ fixed to the single-turbine-optimized value (Section 2.6.1). Focusing on Configuration 2 (2D spacing)—selected for its representative balance between wake recovery and interaction effects—the optimum λ was defined as the value maximizing the system’s total power coefficient. This approach ensured WT2 operated at conditions optimizing combined energy extraction while compensating for wake-induced velocity deficits and turbulence.
2.6.3. Validation of Simulation Processes
To validate the accuracy and reliability of the numerical solution results, experimental measurements were conducted for both a single DWT and a single BWT, as illustrated in Figure 8a,b. In both experimental setups, the hub centers of the rotors were precisely aligned with the center of the wind tunnel exit, corresponding to the coordinates (x = 0, z = 0), to ensure symmetric inflow conditions and eliminate geometric misalignment effects.
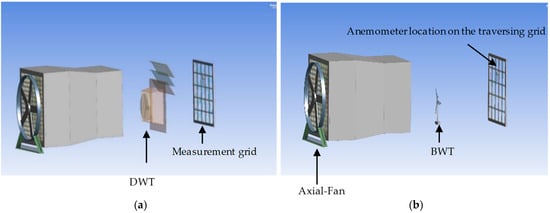
Figure 8.
(a). Installing Single DWT Outside Tunnel, (b) Installing Single BWT Outside Tunnel.
Furthermore, the MBWT configuration was validated using benchmark experimental data reported in [34]. This validation process ensured that the numerical model could accurately capture the aerodynamic performance and wake behavior for both ducted and bare configurations under controlled laboratory conditions. The consistency between numerical predictions and experimental results provides confidence in extending the simulations to more complex multi-turbine arrangements.
2.7. Numerical Model
2.7.1. Computational Domain and Boundary Conditions
A three-dimensional computational domain was designed as a rectangular cuboid with dimensions of 5.5D (Width) × 14.5D (Length) × 5.5D (Height), where D represents the rotor diameter. These specific dimensions, shown in Figure 9a, were adopted based on the best practices established in previous validated studies [35,36,37], and were found to be sufficiently large to avoid blockage effects, accurately represent the inflow rotation, and capture the full spatial development of the wake contours.
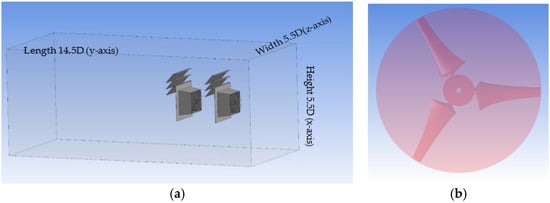
Figure 9.
(a) Computational Domain with Ducts, (b) Inner Domain Around Rotor.
The numerical solutions were performed using a finite-volume, pressure-based solver with pressure–velocity coupling implemented via the SIMPLE algorithm [38]. The flow was assumed to be incompressible, and spatial discretization of the governing equations was carried out using the second-order upwind scheme, which enhances numerical accuracy for convective terms in rotating flows. Turbulence was modeled using the Unsteady Reynolds-Averaged Navier–Stokes (URANS) formulation with the k–ω SST model, selected due to its proven ability to accurately predict flow separation, shear-layer dynamics, and wake recovery in wind turbine simulations [39].
Boundary conditions were assigned as follows: all external walls of the domain, as well as the duct and rotor surfaces, were treated as no-slip walls [40]. The inlet boundary was prescribed as a uniform velocity profile of 5 m/s, while the outlet was assigned a static pressure boundary condition equal to ambient atmospheric pressure. A 3D simulation was run in transient mode with a sliding mesh technique applied to the rotor zone, thereby ensuring proper resolution of blade rotation effects.
A circular subdomain enclosing the rotor Figure 9b, with a diameter slightly exceeding that of the rotor itself, was introduced as the inner computational domain [41], enabling refined mesh resolution in regions of high velocity gradients. The time-stepping strategy was tailored to capture the unsteady rotor–wake interaction: initially, a fine time step of 0.0003 s (equivalent to a 2° rotor rotation per step) was used until periodic stability in torque and flow fields was reached (approximately two full rotor revolutions). Thereafter, the time step was increased in stages—first to 0.001 s and subsequently to 0.005 s—to efficiently complete the simulation without compromising accuracy.
The convergence criteria were set such that the scaled residuals of continuity, momentum, and turbulence equations were reduced below 10−6, with rotor torque stability used as an additional physical convergence check. The total simulation comprised 510-time steps, corresponding to approximately 25,500 solver iterations and a total simulated physical time of 1.2 s. This approach ensured that both the transient aerodynamic behavior and the fully developed wake structures were accurately resolved, thereby providing a reliable basis for performance and flow field analysis.
The transport equations for the turbulent kinetic energy (k) and the specific dissipation rate (ω) of the k–ω SST model are expressed as follows. Details of symbols and definitions are explained in [41].
2.7.2. Mesh Grid Generation
The numerical simulations were conducted using ANSYS Fluent 2022, employing an unstructured grid strategy in line with established CFD best practices [42]. A dual-resolution approach was adopted: (1) a high-resolution base mesh for the outer flow domain, and (2) locally enhanced refinement in the rotating regions and duct passages, as shown in Figure 10a–e. This hierarchical meshing strategy enabled accurate resolution of rotor dynamics, tip vortex roll-up, duct–wall boundary layer growth, and wake development while maintaining computational efficiency [39,43]. Particular attention was devoted to mesh density within the rotating zones to capture rotor–wake interactions and secondary flow features.
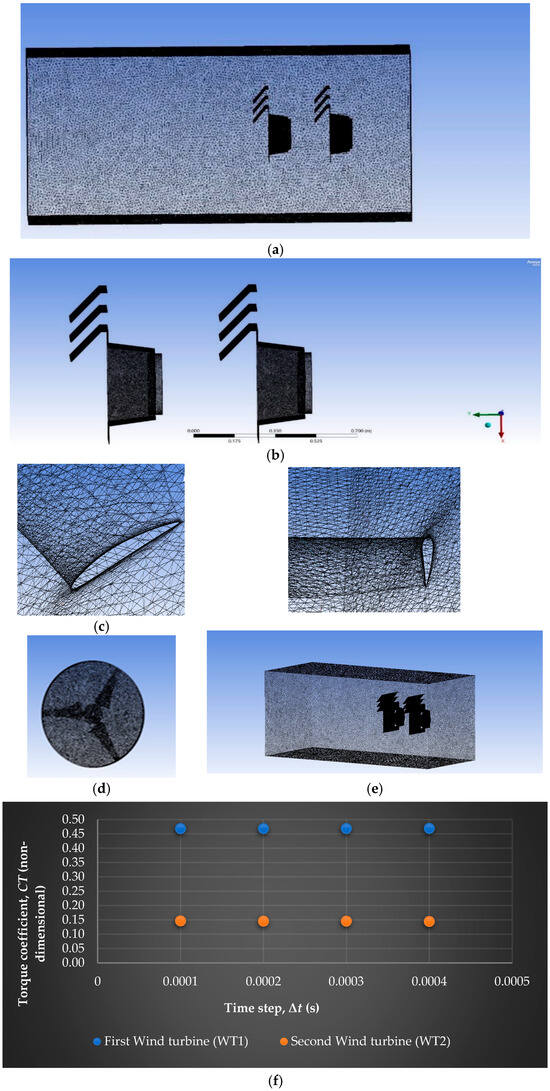
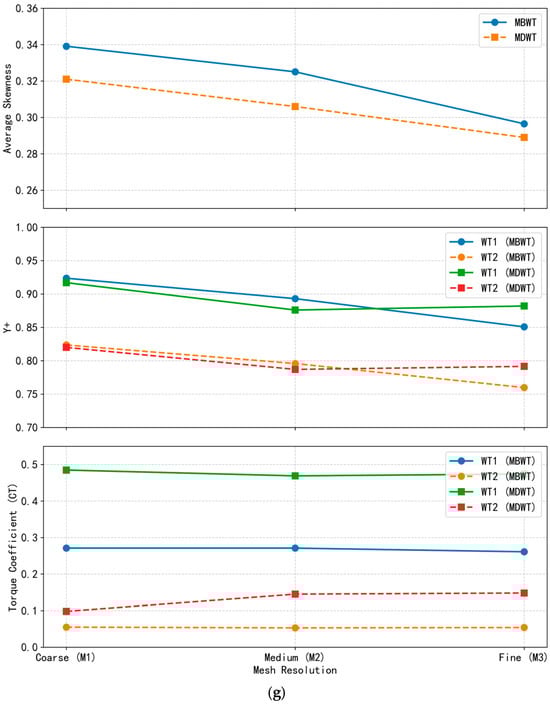
Figure 10.
(a) Mesh of outer domain, and ducts, (b) Mesh of ducts, (c) Blade surface inflation layers, (d) Mesh of inner domain and rotor, (e) Mesh of duct, inner domain, and rotor, (f) Time step size independence analysis, (g) Mesh independence analysis, for upstream turbine (WT1), and downstream turbine (WT2) in MBWT and MDWT configurations.
A boundary layer mesh comprising 25 inflation layers was applied to all solid surfaces. The first-cell height was adjusted to maintain y+ < 1, thereby satisfying near-wall resolution requirements for the k–ω SST turbulence closure [16]. This refinement ensured accurate prediction of flow separation, reattachment, and adverse pressure gradients that strongly affect aerodynamic performance. Mesh growth rates were restricted to below 1.2 to avoid excessive stretching and loss of accuracy. The computational mesh settings used in the CFD simulations are presented in Table 3.
Table 3.
Computational mesh settings used in CFD simulations.
2.7.3. Independence Tests
Mesh and timestep independence assessments were conducted to ensure numerical reliability in the simulation of both the MDWT and MBWT setups. For the timestep sensitivity analysis, steady-state simulations were performed using four timestep sizes ranging from 0.0001 s to 0.0004 s, incremented by 0.0001 s. Concurrently, mesh independence was evaluated through three steady-state simulations employing progressively refined computational grids: coarse (M1, lowest cell count), medium (M2), and fine (M3) as shown in Table 4. Both analyses utilized Configuration No. 2, with each turbine operating at its respective optimum TSR as defined in Section 2.6.2 for the MDWT and MBWT setups.
Table 4.
Mesh independence study configurations.
Torque output was monitored as the primary convergence metric for both studies, consistent with established practices in rotor aerodynamic validation [44]. In the MDWT case, the relative difference in rotor torque coefficient between the M3 (fine) and M2 (medium) meshes was 1.23% for WT1 and 1.90% for WT2. For the MBWT configuration, the corresponding differences were 4.17% for WT1 and 1.79% for WT2. As illustrated in Figure 10g, the torque coefficient values exhibit negligible change between M2 and M3, indicating that a grid-independent solution is achieved with the M2 mesh. Consequently, the M2 was selected for all subsequent simulations, as it provides an optimal balance between solution accuracy and computational cost—particularly given the marginal gain in fidelity relative to the substantial increase in resource demand associated with the M3 mesh [16].
Mesh quality assessment further supports this choice: orthogonal quality metrics for the M2 mesh yielded an average cell quality of 0.78, which is considered excellent for unstructured CFD domains and ensures robust numerical stability.
Regarding timestep independence, Figure 10f also reveals that torque coefficient predictions converge for timesteps of 0.0003 s or smaller. Specifically, reducing the timestep further refinement to 0.0002 s or 0.0001 s produces statistically indistinguishable outcomes. This indicates that simulations employing timesteps = 0.0003 s are effectively timestep-independent. Therefore, a timestep of 0.0003 s was adopted for all reported simulations, ensuring temporal resolution sufficient to capture relevant aerodynamic dynamics without incurring unnecessary computational overhead.
3. Results and Discussion
3.1. Wind Tunnel Flow Verification
3.1.1. Velocity Uniformity
Figure 11a presents the normalized velocity distributions across the spanwise coordinate at 1D, 1.5D, and 2.5D positions within the empty test section. At 1D, the mean normalized velocity was 0.038 with a high coefficient of variation (COV) of 0.50, suggesting localized measurement sensitivity close to the inlet plane. By 1.5D, the mean velocity rose to 1.311, but with a COV of 0.62, indicating some over-acceleration effects in the core flow. At 2.5D, the mean velocity stabilized near unity (1.011) with a substantially reduced COV of 0.19, confirming that the tunnel established a more uniform test-section flow downstream.
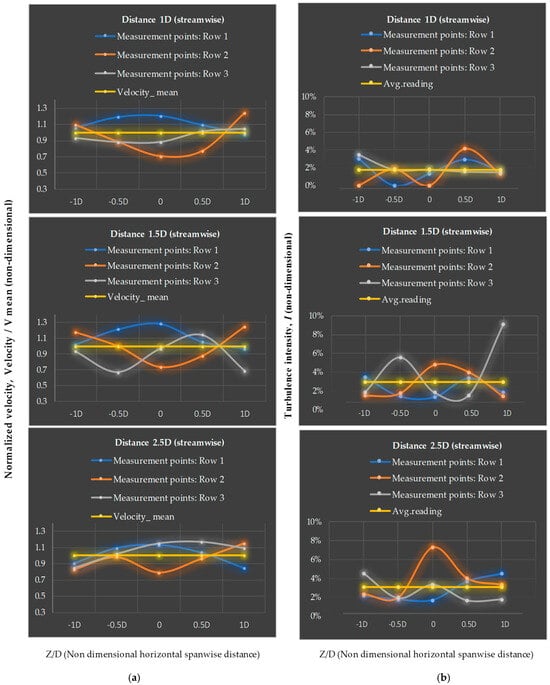
Figure 11.
(a) Flow velocity measurements at three downstream stations (1D, 1.5D, and 2.5D) from the tunnel exit, (b) flow turbulence intensity calculated at three downstream stations (1D, 1.5D, and 2.5D) from the tunnel exit.
3.1.2. Turbulence Characteristics
Figure 11b shows the turbulence intensity distributions. At 1D, turbulence levels were negligible (mean 0.027%, range 0.016–0.045%), reflecting extremely smooth inflow conditions. At both 1.5D and 2.5D, turbulence intensity increased slightly to mean values of 1.106% and 1.109%, respectively, with maxima not exceeding 1.29%. These values remain below the 2% threshold typically considered acceptable for small-scale aerodynamic experiments, confirming the laminar quality of the test-section flow.
3.1.3. Overall Flow Quality Assessment
The combined statistical and graphical evidence demonstrates that the tunnel provides high-quality flow in its test section. Velocity uniformity improves with distance downstream, converging toward V/V_ref. ≈ 1 with acceptable variability. Turbulence intensity remains low and consistent across the measurement stations. These findings validate the tunnel’s suitability for controlled aerodynamic investigations and provide a reliable baseline for subsequent turbine and wake interaction experiments.
3.2. Validation of Numerical Model
3.2.1. Single Turbine Configuration
The numerical simulations for the single ducted (DWT) and bare wind turbine (BWT) configurations were validated against experimental measurements using the mean velocity as the comparison parameter. The resulting profiles are shown in Figure 12a,b. The numerical model demonstrated satisfactory agreement with the experimental data, effectively capturing the principal wake characteristics—including the velocity deficit profile and wake expansion—for both configurations. To quantify the fidelity of the simulation, an error analysis was performed. For the DWT case, this yielded a mean absolute error of 0.38 m/s and a relative error of 21.4%. The correlation coefficient between the simulated and experimental velocity fields was 0.64, indicating a moderately strong linear relationship.
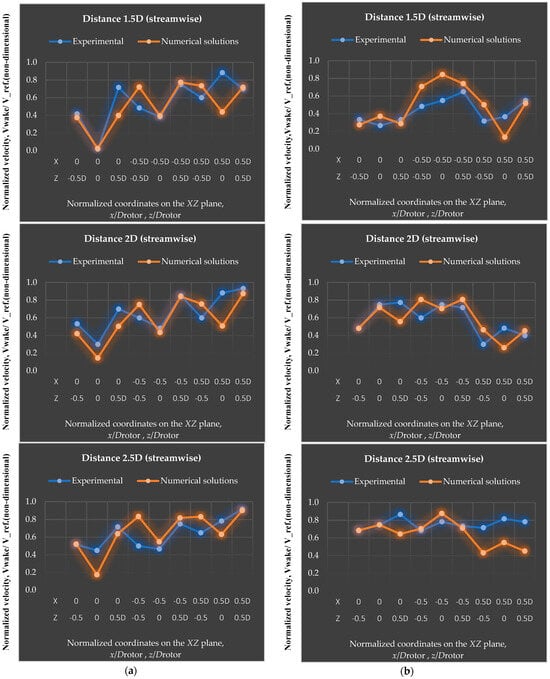
Figure 12.
(a) Flow velocity at three stations (1D, 1.5D, and 2.5D) behind turbine in single BWT configuration, (b) flow velocity at three stations (1D, 1.5D, and 2.5D) behind turbine in single DWT configuration.
A key finding concerns the model’s ability to predict wake recovery downstream of the rotor. The overall percentage difference in wake recovery for the DWT was 24.1%, suggesting that the numerical framework represents the evolution of the wake with reasonable accuracy. This level of agreement is particularly notable given the inherent complexities of near-wake aerodynamics, such as shear layer instabilities and tip vortex interactions, which are challenging to resolve without high-fidelity turbulence modeling.
Nevertheless, discrepancies between simulation and experiment persisted in regions characterized by high flow gradients and elevated turbulence intensity—particularly within the near-wake zone (0–3D downstream of the rotor, where D denotes rotor diameter). These deviations are consistent with established limitations in Reynolds-averaged Navier–Stokes (RANS)-based approaches, which typically capture mean flow features well but under-resolve small-scale turbulent structures and three-dimensional vortex dynamics [45,46]. Notably, the omission of the turbine tower and DC generator from the computational domain likely contributed to localized inaccuracies, especially in the lower portion of the wake where tower shadow effects are pronounced [47]. Despite these limitations, the results demonstrate that the numerical model provides a physically plausible representation of the global wake behavior, thereby supporting its use for comparative performance assessments of ducted versus bare wind turbine configurations.
3.2.2. Two Tandem Turbines Configuration
The numerical simulation results for the MBWT configuration were systematically validated against the experimental measurements reported by [34]. Figure 13a,b present the velocity distribution profiles along the horizontal axis (Z-axis) at the rotor hub center, measured at two downstream stations behind the second wind turbine (WT2): 1D and 2.5D. Comparisons were conducted among three configurations: (i) experimental data, (ii) a numerical simulation of the rotor only (excluding the tower and nacelle), and (iii) a numerical simulation of the complete turbine assembly, including both the tower and nacelle, to evaluate the influence of these components on the overall flow behavior. At 1D downstream, the numerical models reproduced the general shape of the experimental wake but exhibited quantitative discrepancies. The rotor-only CFD predicted the deepest velocity deficit, with a mean normalized velocity (averaged across −1 ≤ Z/R ≤ 1) of 0.138, compared to 0.280 for the full-model simulation and approximately 0.777 in the experimental measurements. This indicates that the rotor-only simulation overestimated the wake deficit by about 51% relative to the full-model simulation. In contrast, the experimental profile exhibited a pronounced left–right asymmetry, with the wake core displaced by approximately 0.1R from the centerline. This skewness is attributed to wake rotation and the upward deflection of the tower wake induced by blade rotation, as also reported in [48,49,50,51]. The rotor-only simulation showed minimal skewness compared with the other two cases, whereas the complete turbine model reproduced partial asymmetry, thereby improving consistency with the experimental observations. It is worth noting that the direction of wake skewness in both numerical models was opposite to that of the experiment, primarily due to differences in coordinate system orientation.
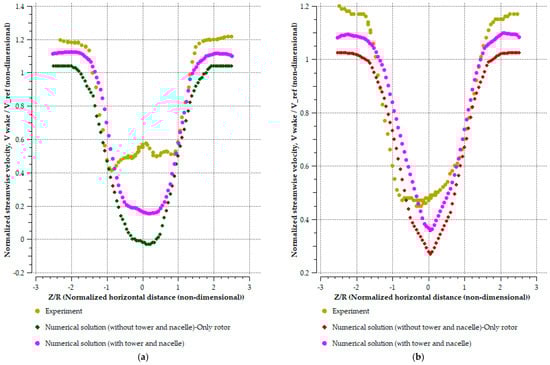
Figure 13.
(a) Flow velocity distribution at 1D stations downstream WT2 in MBWT configuration, (b) flow velocity distribution at 2.5D stations downstream WT2 in MBWT configuration.
At 2.5D downstream, all three configurations exhibited substantial wake recovery. The minimum normalized velocity increased to approximately 0.45 in the experimental data, compared with 0.27 and 0.36 for the rotor-only and complete-turbine simulations, respectively. The differences among the three cases diminished considerably, with both CFD models predicting wake depths within a few percentage points of the experimental values. Moreover, the velocity troughs were centered near Z/R = 0.11, and the asymmetry observed at 1D had largely dissipated, resulting in nearly symmetric profiles across all datasets. This convergence confirms that the wake progressively stabilizes with increasing downstream distance and that the numerical models accurately capture wake evolution at 2.5D, where the influence of the tower and blade–wake interactions become negligible.
The remaining discrepancies between the experimental and numerical profiles at 1D, even when including the tower and nacelle, can be attributed to several factors, including differences in geometric details, airfoil aerodynamic performance data, blade and rotor dimensions, inflow velocity, and the numerical model and the experimental setup reported by [34].
3.3. Power Performance Analysis
3.3.1. Single Turbine Configuration
Figure 14 presents the power coefficient (Cp) as a function of tip speed ratio (λ) for the single-turbine configurations. At low λ (<3), the DWT demonstrates a distinct enhancement in aerodynamic performance relative to the BWT. Specifically, the DWT achieves Cp,max of 0.470 at λ = 4.4, whereas the BWT attains Cp,max of 0.274 at λ = 4.2. This corresponds to an approximately 71.3% improvement in peak power conversion capability attributable to the presence of the duct–PFCT design, a result consistent with the flow acceleration and mass flow augmentation mechanisms described in ducted turbine theory [16,52].
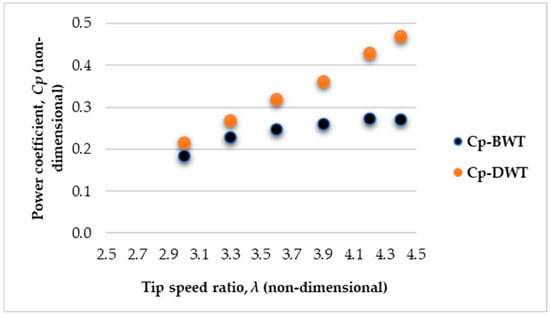
Figure 14.
Power coefficient-λ curve for single DWT and single BWT configurations.
The performance advantage of the DWT is further substantiated by average Cp values computed over the operational TSR range. The DWT exhibits a mean Cp of 0.345, compared to 0.245 for the BWT, indicating consistently superior aerodynamic efficiency across typical operating conditions. This sustained enhancement suggests that the duct not only amplifies peak performance but also broadens the effective energy extraction envelope, albeit within a shifted TSR regime.
To quantify cumulative energy extraction potential, the integrated performance metric, defined as the area under the Cp–λ curve, was evaluated. The DWT yielded an integrated value of 0.473, in contrast to 0.345 for the BWT, thereby confirming a marked increase in total extractable energy over the tested TSR spectrum. Such integration accounts for both peak efficiency and operational bandwidth, offering a more holistic metric than Cp,max alone.
An analysis of efficient operating conditions, defined as the TSR intervals wherein Cp remains within 5% of its maximum value, reveals a trade-off between performance magnitude and operational robustness. The BWT maintains near-optimal efficiency over a broader range (λ = 3.9 to 4.4), whereas the DWT exhibits a narrower window centered precisely at λ = 4.4.
3.3.2. Two Tandem Turbines Configuration
Figure 15a presents a comparison of the total power coefficient (Cp,total) versus λ for the MDWT and MBWT configurations. The results reveal that the optimum λ yielding the maximum total power coefficient was 3.6 for the second turbine in MDWT configuration No. 2, compared to 2.7 for the second turbine in the MBWT configuration No. 2. The upward shift in the optimum λ for MDWT can be attributed to the accelerated inflow and reduced wake expansion generated by the ducts, which allows both turbines to operate efficiently at higher rotational speeds. Furthermore, the mean power coefficient for the MBWT system was observed to be 0.310 ± 0.016 (standard deviation), while that for the MDWT system was significantly higher at 0.582 ± 0.0270. Quantitatively, the MDWT system exhibited a 71% to 122% increase in power coefficient relative to the MBWT system across the explored range of tip speed ratios from 2.1 to 3.9., highlighting the aerodynamic benefits of duct-assisted energy capture in multi-turbine arrays.
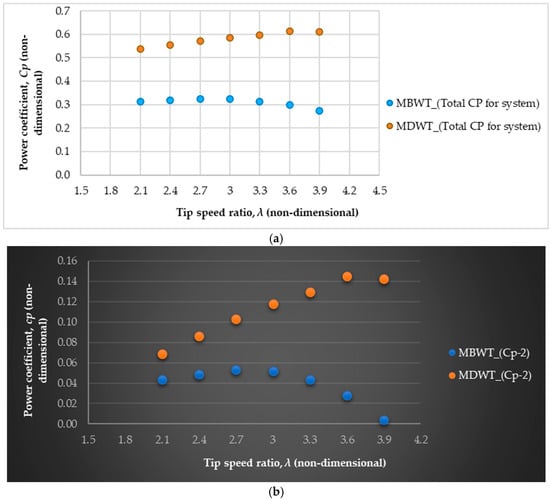
Figure 15.
(a) The total power coefficient-λ curve for MDWT (Cp,total) and MBWT (Cp,total) configurations, (b) the power coefficient-λ curve for second wind turbine in MDWT (MDWT_Cp-2) and MBWT (MBWT_Cp-2) configurations.
Figure 15b compares the individual coefficient of the second turbine (WT2-Cp) in both configurations. Statistical analysis reveals a substantially higher mean power coefficient for the second turbine in the MDWT configuration, measured as 0.113 ± 0.027 (standard deviation), compared to a mean of 0.038 ± 0.018 for the MBWT system. The relative increase in the second turbine power coefficient of the MDWT system over the MBWT system ranges from approximately 57% at lower tip speed ratios to an exceptional increase exceeding 400% at higher tip speed ratios. Correlation coefficients expose distinctive performance trends: the MBWT second turbine power coefficient is negatively correlated with tip speed ratio (r = −0.74), indicating that higher rotational speeds of downstream turbine adversely affect its efficiency. In contrast, the MDWT second turbine power coefficient demonstrates a robust positive correlation (r = 0.98), reflecting enhanced aerodynamic performance with increasing tip speed ratio. It is evident that second turbine power WT2-Cp in the MDWT (MDWT_Cp-2) arrangement exceeded that of the MBWT case across the tested λ range. This improvement can be linked to the duct’s ability to partially recover wake energy and maintain a higher inflow velocity to the downstream rotor, thereby mitigating the wake deficit effect that typically reduces the performance of the second turbine in tandem layouts. These findings are consistent with previous investigations [16,52], which reported that ducts can effectively improve downstream turbine performance in multi-turbine configurations.
3.4. Performance and Wake Dynamics Analysis—Two Tandem Turbines Configuration
The physical rationale for positioning a second turbine within the near wake of DWT, a region distinctly characterized by elevated turbulence intensity and a significant velocity deficit, stems from the ability of the proposed tandem DWT configuration to leverage the unique aerodynamic advantages of ducted designs. Rather than treating the near wake as an irretrievable energy loss zone, this system transforms it into a viable region for secondary power extraction by exploiting pressure-driven entrainment phenomena, coherent vortex dynamics, and targeted wake control strategies to direct the flow toward the rotor of the downstream duct.
These mechanisms were specifically enabled by a duct design that strategically integrated PFCT-arrangement. The upstream duct–PFCT assembly generated a strong suction peak at the wake of both the duct and the sheets, establishing a favorable pressure gradient that effectively entrained ambient air into the wake. This active flow entrainment substantially enhances the mass flux through the downstream turbine rotor plane, thereby mitigating the velocity deficit. In addition, the tip vortices shed from the upstream DWT and the edges of the PFCT-sheets transported rotational kinetic energy into the near wake, thereby supporting the mixing process of wake patterns by promoting interaction between high-velocity and low-velocity regions. A downstream duct positioned within this vortex-dominated interaction zone can effectively extract energy from these structures.
The third mechanism involves the acceleration of the flow currents through the gaps between the sheets of the PFCT-arrangement, subsequently redirecting them toward the wake center and downstream duct.
It is important to note that this study did not explore the use of adaptive downstream duct designs tailored to the wake characteristics of upstream ducts. Instead, an identical duct geometry was employed for the downstream turbine to isolate and evaluate the effects of integrating the PFCT-arrangement into the duct on both wake recovery and downstream turbine performance. Through the analysis, a sensitivity study was conducted to assess the influence of spacing between ducts on the power output and near-wake characteristics.
3.4.1. Power and Torque
Figure 16 presents the Cp and torque coefficient values for the upstream (WT1) and downstream (WT2) turbines, as well as the total power coefficient, for both the MDWT and the MBWT arrangements across the three configurations, No. 1, No. 2, and No. 3 (1.5D, 2D, and 2.5D on, respectively). A comparison revealed that the upstream rotor in the MDWT consistently achieved a substantially higher power coefficient than its counterpart in the MBWT, with mean values of Cp ≈ 0.470 versus Cp ≈ 0.270, representing a relative improvement of approximately 74%. A comparable enhancement was observed in torque coefficient, with the MDWT’s upstream turbine torque coefficient 0.47 compared to 0.27 for the MBWT. Similarly, the WT2 exhibited improved absolute performance under the ducted configuration, achieving Cp ≈ 0.138 and torque coefficient of 0.01384, as opposed to Cp ≈ 0.052 and 0.0516 in the bare configuration.
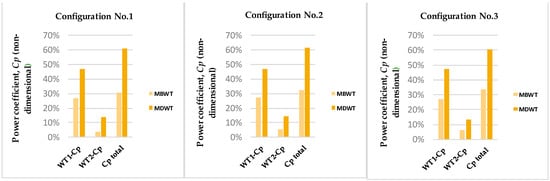
Figure 16.
Power coefficients for the three configurations of MDWT and MBWT, for upstream turbine power coefficient (WT1-Cp), downstream turbine power coefficient (WT2-Cp), and total power coefficient of system (Cp,total).
Consequently, the aggregate performance of the turbine pair was markedly superior in the MDWT arrangement, yielding an average total power coefficient of approximately 0.608, compared to 0.321 for the MBWT. This result indicates that the ducted configuration nearly doubles the total power output of the tandem system, underscoring the aerodynamic benefits conferred by the duct-augmented design.
When examined across individual spacing intervals, the MBWT demonstrated a progressive increase in total power coefficient with greater separation: from 0.306 at Configuration No. 1 to 0.324 at Configuration No. 2, and further to 0.334 at Configuration No. 3. This trend aligns with established wake-recovery dynamics observed in conventional wind turbine arrays, wherein increased streamwise distance allows partial re-energization of the wake through ambient turbulence and shear [53]. In contrast, the MDWT maintained a near-constant total power coefficient of approximately 0.61 across all three spacings. This insensitivity to inter-turbine distance suggests that the aerodynamic influence of the duct—particularly its ability to accelerate and reorganize the flow—predominates over the modest effects of spacing within the tested range.
Further insight into system behavior is gained by analyzing the relative performance of WT2 across configurations. In the MBWT arrangement, the power deficit of WT2 relative to WT1 decreased monotonically with increasing spacing: −78.5% at 1.5D, −71.7% at 2D, and −67.0% at 2.5D. This gradual recovery is consistent with canonical wake evolution models, which describe the re-entrainment of high-momentum fluid into the wake as a function of downstream distance [53].
The MDWT- WT2 consistently outperformed its MBWT counterpart at equivalent inter-turbine spacings. However, when compared to the upstream turbine in the same ducted array (MDWT-WT1), WT2 exhibited substantial power deficits, with relative reductions of −64.3% at 1.5D, −62.1% at 2D, and −65.5% at 2.5D. Notably, the slight performance peak observed at 2D spacing suggests the presence of non-linear aerodynamic interactions between the turbine wake and the duct’s shear layer, potentially involving vortex shedding or shear-layer instabilities at the duct exit plane [54].
3.4.2. Velocity Field
Figure 17a–c illustrates the local velocity contours in the wake zone at the (XY) plane, Z = 0, for the three configurations (No. 1, No. 2, and No. 3). The near-wake profiles of the MBWT were more consistent compared with those observed in the MDWT cases. Among the MBWT configurations, the widest wake profiles were obtained in configurations No. 2 and No. 3.
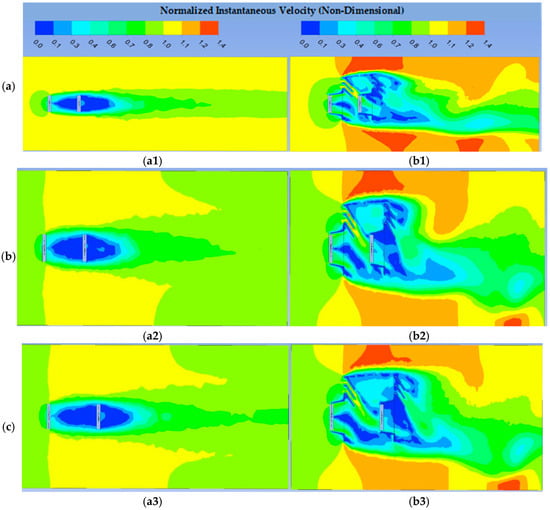
Figure 17.
(a) Velocity contours in the XY plane at Z = 0 for Configuration No. 1, (a1) MBWT, (b1) MDWT, (b) Velocity contours in the XY plane at Z = 0 for Configuration No. 2, (a2) MBWT, (b2) MDWT, (c) Velocity contours in the XY plane at Z = 0 for Configuration No. 3, (a3) MBWT, (b3) MDWT.
In contrast, the MDWT cases exhibited distinct flow acceleration near WT2 and at the upper sides of the near-wake profiles. This effect is attributed to PFCT-sheets, which narrow the flow passage. The resulting contraction accelerates the flow velocity, consistent with the conservation of mass and Bernoulli’s principle [2]. Additionally, the presence of the sheets above the ducts displaced velocity-deficit regions downward within the near wake, thereby enhancing turbulence intensity and inflow velocity fluctuations. Similar mechanisms were reported in [55]. Importantly, this flow reorganization translated directly into improved power extraction by WT2. Performance data confirm that the MDWT’s downstream rotor achieved average power and torque coefficients 2.65 and 2.68 times greater, respectively, than its counterpart in the MBWT. This demonstrates that the duct-driven acceleration created a more energetic inflow, which significantly enhanced the output of WT2.
A closer inspection of the wake behind the ducts reveals that the most pronounced velocity deficit occurred behind the upper sheet, compared with the other two sheets within the same duct. The distribution of high-speed flow currents also varied across the three MDWT configurations. In Configuration No. 1, the currents were concentrated on the upper side of the WT2 plane; in Configuration No. 2, they shifted to the middle; and in Configuration No. 3, they were directed toward the lower side of the WT2 plane. This progressive shift indicates that increasing the separation distance between WT1 and WT2 caused the accelerated currents to bend downward, pushing the low-speed wake patterns toward the bottom regions of the near-wake plane. Consistent with this trend, the downstream turbine performance showed a modest improvement at 2D spacing, with a relative power deficit of −62.1% compared to −64.3% at 1.5D and −65.5% at 2.5D. This non-linear behavior highlights the influence of spacing on the interaction between accelerated jets and wake vortices.
Figure 18a–c illustrates the velocity streamline contours, where vortex formation was clearly observed in all simulation cases. For the MDWT configurations, the vortices generated behind DWT2 were consistently larger and more concentrated than those behind DWT1. This behavior is primarily attributed to the broad vortical flow region produced by the upper sheet of DWT1, which directly influenced the near-wake structures of DWT2. Among the three MDWT configurations, the smallest vortices occurred in Configuration No. 1, where the short separation distance (1.5D) caused early vortex decay. In contrast, the most concentrated vortices appeared in Configuration No. 2, highlighting the influence of spacing on vortex development. In MBWT cases, vortex structures were also present across all three configurations, with Configuration No. 2 exhibiting the most concentrated vortices. However, unlike MDWT, the separation distance between BWT1 and BWT2 did not significantly affect vortex decay within the region between the two turbines.
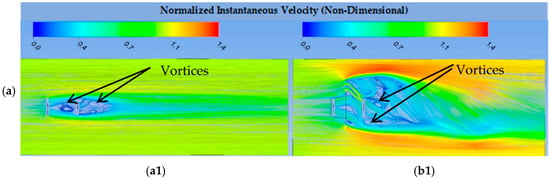
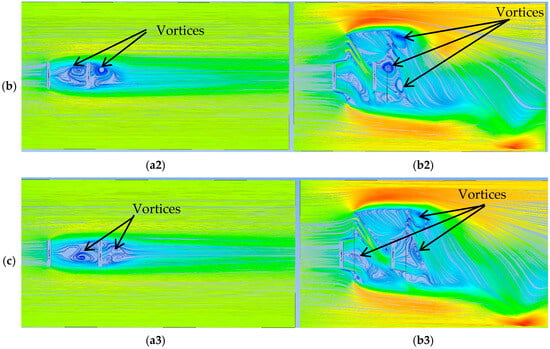
Figure 18.
(a) Streamlines of the velocity field in the XY plane at Z = 0 for Configuration No. 1, (a1) MBWT, (b1) MDWT, (b) Streamlines of the velocity field in the XY plane at Z = 0 for Configuration No. 2, (a2) MBWT, (b2) MDWT, (c) Streamlines of the velocity field in the XY plane at Z = 0 for Configuration No. 3, (a3) MBWT, (b3) MDWT.
Finally, a notable distinction emerged between MBWT and MDWT wake structures. The MBWT vortices were more symmetrical than those observed in the MDWT cases, as also shown in Figure 18a–c. This finding supports the explanation that the ducts in the MDWT promoted vortex decay and asymmetry, aligns with earlier studies [9,16], while simultaneously accelerating inflow currents that enhanced WT2 performance. Collectively, both the flow-field observations and performance data confirm that the MDWT concept not only modifies the wake structure but also delivers a measurable power benefit to the downstream turbine, a feature absent in MBWT arrays.
Furthermore, Figure 19a–c demonstrate that the flow between the sheets became increasingly concentrated within the ducts. These high-velocity streams were generated by the narrow-gap effect of the PFCT-sheets in the MDWT cases, a phenomenon also documented in [10,13,56]. Notably, such patterns of accelerated currents in the near wake were absent in the MBWT configurations. The consequence of these concentrated currents is reflected in the total system power: the MDWT pair produced a combined power coefficient of ≈0.608, nearly double the ≈0.321 observed in the MBWT.
Figure 19.
(a) Velocity vectors in the XY plane at Z = 0 for Configuration No. 1 (a1) MBWT, (b1) MDWT, (b) Velocity vectors in the XY plane at Z = 0 for Configuration No. 2, (a2) MBWT, (b2) MDWT, (c), Velocity vectors in the XY plane at Z = 0 for Configuration No. 3 (a3) MBWT, (b3) MDWT.
The normalized instantaneous streamwise velocity distributions were analyzed along three vertical lines (1.5D, 2.0D, and 2.5D) downstream of the second turbine (WT2) for both the MDWT and the MBWT in Configurations No. 1 through No. 3 (Figure 20a–c). The wake development observed across these downstream distances for each configuration is detailed in the following analysis.
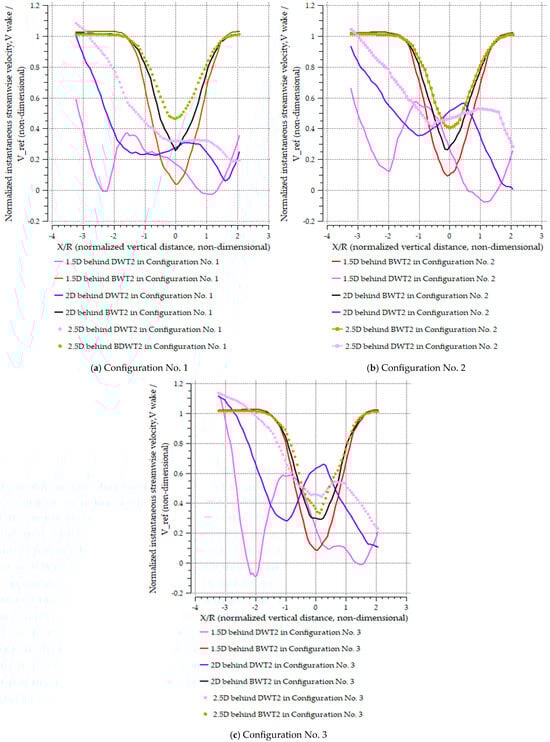
Figure 20.
Normalized instantaneous streamwise velocity distributions along three vertical lines at 1.5D, 2.0D, and 2.5D downstream of the second bare turbine (BWT2) and the second ducted turbine (DWT2) for both the MDWT and MBWT across Configurations No. 1 to No. 3.
In Configuration No. 1, the velocity distributions exhibited a sharp and deep velocity deficit immediately behind WT2. At 1.5D, both the MBWT and MDWT presented core wake velocities reduced to approximately 0.2–0.3, though the MDWT case was more asymmetric. On the negative side of x/R, influenced by the upper duct in the MDWT, strong acceleration occurred, which yielded a steep gradient between the high-speed jet and the low-speed core. By 2.0D, the MBWT wake had partially recovered, elevating the minimum velocity to approximately 0.5, whereas the deficit in the MDWT remained broad and was displaced downward. At 2.5D, the MBWT continued its recovery toward a velocity of 0.6–0.7, while the MDWT still exhibited deep deficits (0.3–0.4) and enhanced asymmetry. This behavior indicates that the local acceleration zones produced PFCT-sheets mitigated the common non-uniformity and delayed recovery observed in BWT and common DAWT systems.
For Configuration No. 2, the wake core was less severe at the first measurement line (1.5D). The MBWT showed minima of approximately 0.3–0.4, while the MDWT minima were nearer to 0.2. At 2.0D, the MBWT developed a more symmetric profile with recovery toward 0.6, whereas the MDWT exhibited a shifting of the accelerated jet toward the centerline, which displaced the velocity deficit downward. By 2.5D, the MBWT continued its symmetric recovery, reaching 0.7–0.8. In contrast, the MDWT retained a split profile, characterized by high velocities near the upper side (negative x/R) and suppressed flows (~0.4) on the lower side. This reflects how the PFCT redirected inflow, thereby reorganizing the deficit structure rather than eliminating it.
In Configuration No. 3, the near-wake region at 1.5D already demonstrated substantial jet-wake interaction. The MBWT again yielded a symmetric, deep deficit of approximately 0.3, while the MDWT displayed strong asymmetry; the wake minimum was displaced downward, with high-speed zones persisting near the upper duct side. At 2.0D, the MBWT recovered smoothly to 0.5–0.6, whereas the MDWT exhibited non-monotonic behavior, manifesting as double troughs in its vertical profile. By 2.5D, the MBWT approached a recovery of 0.8, while the MDWT still displayed broad, asymmetric deficits (0.4–0.5) that extended across the lower half of the rotor plane.
A sensitivity analysis of wake development to configuration type revealed distinct trends. The MBWT wakes were consistently more symmetric and demonstrated progressive recovery, characterized by deeper deficits at 1.5D but steady improvement by 2.5D across all configurations. Conversely, the MDWT wakes remained highly sensitive to turbine spacing. In Configuration No. 1, the accelerated jet was concentrated near the upper side, producing strong asymmetry and downward-deflected deficits. In Configuration No. 2, the jet shifted toward the mid-plane, which temporarily enhanced centerline velocities and displaced the deficit further downward, resulting in the most organized acceleration-deficit split among the three configurations. In Configuration No. 3, the jet bent even further downward, creating broad asymmetric deficits across the lower side and complex velocity profiles with multiple minima.
This progression indicates that increasing turbine spacing enhanced the downward deflection of the accelerated jet in the MDWT, thereby pushing the wake deficit lower into the vertical plane. Consequently, wake recovery was highly sensitive to spacing in the MDWT, whereas the MBWT recovery remained relatively uniform and predictable across all configurations.
3.4.3. Static Pressure
Figure 21a–c presents the static pressure contours in the wake zone at the (XY) plane, Z = 0. In the MDWT arrangements, the pressure profiles appeared more irregular than those in the MBWT cases. A pronounced drop in static pressure was observed in the zones downstream of the upper sheets above both ducts, a feature not present in the MBWT wake.
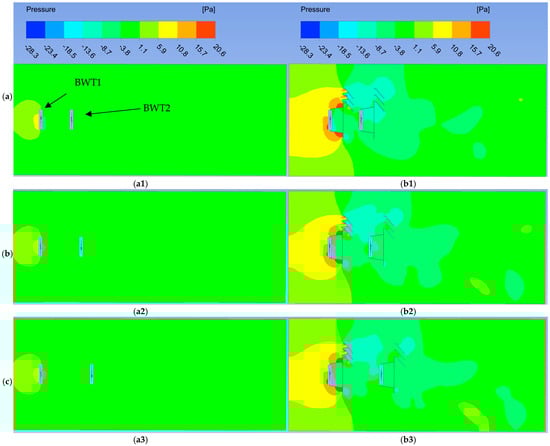
Figure 21.
(a) Pressure contours in the XY plane at Z = 0 for Configuration No. 1 (a1) MBWT, (b1) MDWT, (b) Pressure contours in the XY plane at Z = 0 for Configuration No. 2, (a2) MBWT, (b2) MDWT, (c), Pressure contours in the XY plane at Z = 0 for Configuration No. 3 (a3) MBWT, (b3) MDWT.
Figure 22 shows the static pressure distribution along a horizontal line in the Z-axis at three downstream stations (1.5D, 2D, and 2.5D) behind WT2 for both MDWT and MBWT arrangements. The results indicate that static pressure values in the MDWT cases were consistently lower than those in the MBWT cases, which is consistent with findings reported in study [14]. A remarkable pressure reduction behind ducts was noted in MDWT compared to MBWT, especially due to gap-flow acceleration and vortex shedding align with results in [10,11,14]. This pressure reduction enhanced near-wake flow velocity by drawing high-speed currents into these regions, a mechanism driven by the presence and movement of vortices.
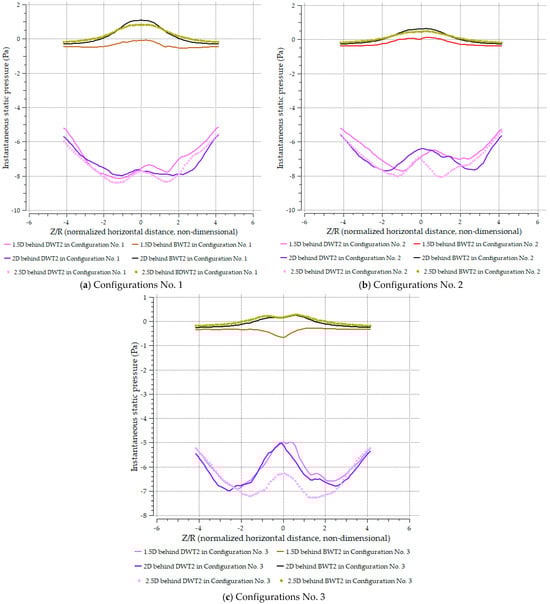
Figure 22.
Instantaneous static pressure distributions along three vertical lines at 1.5D, 2.0D, and 2.5D downstream of the second bare turbine (BWT2) and the second ducted turbine (DWT2) for both the MDWT and MBWT across Configurations No. 1 to No. 3.
In addition, the low-pressure zones downstream of the ducts created strong pressure differentials relative to the higher-pressure regions located upstream and around the ducts and sheets. These differentials promoted an increased mass flow rate, thereby boosting turbine power output. This outcome is consistent with previous findings [10,16,57,58,59].
Among the three measurement stations, the greatest pressure drop occurred at 1.5D, the closest location to the duct. This observation highlights the dominant influence of duct effects in the near-wake region. Furthermore, the pressure distribution patterns in MDWT cases were asymmetrical across all configurations, in contrast to the more balanced distributions in MBWT cases.
Finally, Table 5 corroborates these observed trends. The MBWT configuration exhibits a mean static pressure of −0.514 ± 0.862 Pa (±1 standard deviation), reflecting only mild pressure deficits in the wake region at the downstream measurement stations considered. By contrast, the MDWT configuration produces a substantially lower mean static pressure of −6.605 ± 0.240 Pa, indicative of a significantly more pronounced pressure drops in the same region.
Table 5.
Static pressure distribution in the XZ plane, measured at three downstream locations behind WT2 of both the MDWT and MBWT systems. Values represent area-averaged pressure over circular regions corresponding to the rotor-swept area.
The static pressure difference between the MDWT and MBWT configurations ranges from −5.2 Pa at 1.5D to −6.7 Pa at 2.5D downstream. When normalized by the absolute magnitude of the MBWT pressure values, this corresponds to a relative pressure difference of approximately 3 to 28 times greater for the MDWT configuration—highlighting its markedly enhanced ability to intensify wake-induced pressure gradients.
This quantitative evidence supports the qualitative interpretations described above. Overall, the pressure field analysis emphasizes that duct integration in MDWT intensifies wake effects, leading to stronger pressure deficits and enhanced flow acceleration compared to MBWT. These intensified pressure gradients and vortex-driven suction mechanisms are directly linked to elevated turbulence kinetic energy levels in the wake, which will be examined in detail in the following section.
3.4.4. Turbulence Kinetic Energy
Turbulence kinetic energy (TKE) provides a crucial metric for quantifying wake unsteadiness and energy redistribution in turbine arrays. Since the MDWT arrangements produced stronger pressure gradients and concentrated vortical structures, as demonstrated in the previous section, higher TKE levels are observed in their near-wake regions compared to MBWT configurations.
Figure 23a–c indicates the turbulence kinetic energy contours for the arrangements of MDWT and MBWT in the lateral plane (XY plane), Z = 0. The turbulence kinetic energy levels were higher in the case of the MDWT than the MBWT arrangements, specifically after the sheets, which was reported in a previous study about the flange’s effect [60]. This observation aligns with the earlier pressure analysis, where low-pressure regions downstream of the ducts acted as suction zones, intensifying velocity fluctuations and thereby amplifying TKE production. The turbulence kinetic energy profiles were asymmetrical and wide, extending over a long distance downstream and oriented to the lower sides of the near-wake plane.
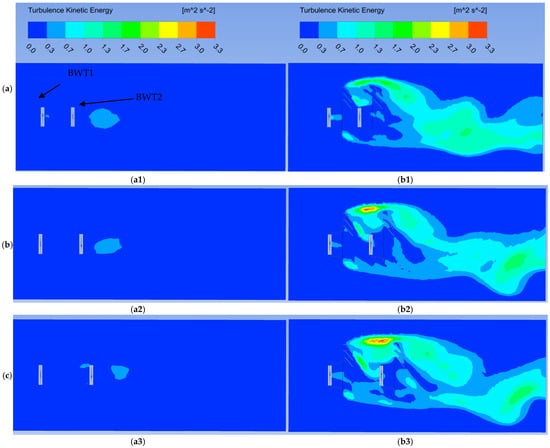
Figure 23.
(a) Turbulence kinetic energy contours in the XY plane at Z = 0 for Configuration No. 1 (a1) MBWT, (b1) MDWT, (b) Turbulence kinetic energy contours in the XY plane at Z = 0 for Configuration No. 2, (a2) MBWT, (b2) MDWT, (c), Turbulence kinetic energy contours in the XY plane at Z = 0 for Configuration No. 3 (a3) MBWT, (b3) MDWT.
In the MDWT cases, elevated TKE was concentrated around the upper wake regions, directly downstream of the duct sheets. This concentration is attributed to the strong vortices shed from the sheet edges, which interacted with the accelerated core flow between the ducts. As the separation distance between WT1 and WT2 increased from configuration No. 1 to configuration No. 3, the high-TKE regions shifted progressively toward the lower part of the wake plane. This trend mirrors the behavior of high-speed flow currents described in Section 3.4.2, confirming that wake deflection induced by duct geometry and sheet placement directly affects the spatial distribution of turbulence intensity.
In contrast, the MBWT arrangements exhibited more uniform and symmetrical TKE patterns across all three configurations. While turbulence was still generated due to blade–wake interactions, the absence of ducts and sheet-induced accelerations limited the overall magnitude of TKE, consistent with the earlier observations regarding vortex concentration. However, the magnitudes remained substantially lower than those recorded in the MDWT cases.
The turbulence intensity (TI) and normalized instantaneous TKE distributions were analyzed along three vertical lines (1.5D, 2.0D, and 2.5D) downstream of the second turbine (WT2) for both the MDWT and the MBWT in Configurations No. 1 through No. 3 (Figure 24a–c). The analysis revealed systematic differences in the spatial distribution of TKE and TI between the two designs.
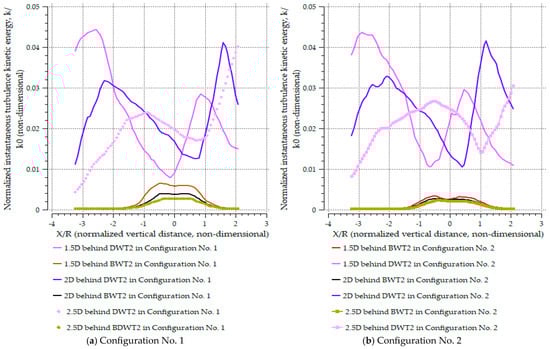
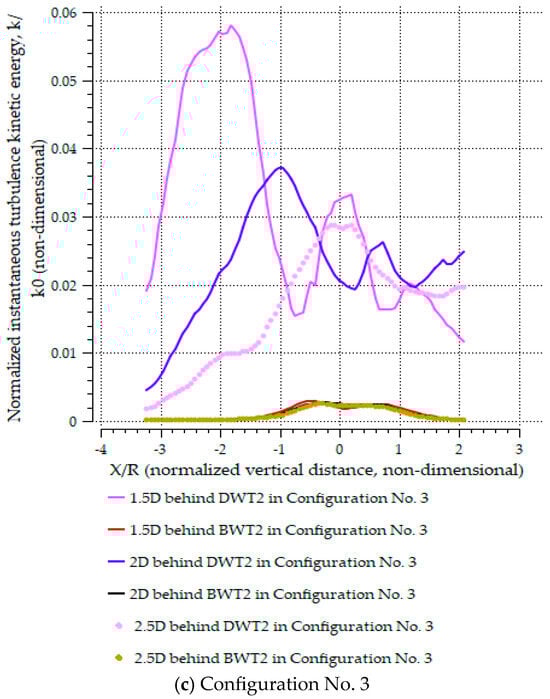
Figure 24.
Normalized instantaneous TKE distribution along three downstream lines behind of the second bare turbine (BWT2) and the second ducted turbine (DWT2) for both the MDWT and MBWT across Configurations No. 1 to No. 3.
Ensemble statistics, including the median, 5th and 95th percentiles, and mean ± standard deviation, computed for each downstream line demonstrated that the MDWT configurations produced markedly higher near-wake TKE and TI than the MBWT cases. At 1.5D, for instance, the median TKE for the MDWT was 0.0222, compared to 0.00104 for the MBWT, representing an increase by a factor of approximately 21. Similarly, the median TI was 0.389 for the MDWT versus 0.029 for the MBWT (13.4 times higher turbulence intensity than the MBWT case).
Spatial maps of median and 95th-percentile TKE (the value covering 95% of all grid point readings) further highlighted these differences, showing a pronounced asymmetry in the MDWT wakes. High-TKE regions were concentrated on the duct side and extended farther downstream; the 95th-percentile TKE contours for the MDWT extended beyond their MBWT counterparts. This pattern is consistent with vortex shedding from the sheet edges and the low-pressure suction zones downstream of the flange. As the inter-turbine spacing increased from Configuration No. 1 to Configuration No. 3, the MDWT high-TKE centroid (the mean x/R of points with k ≥ the 90th percentile at that distribution line identifies where the strongest turbulence is localized) shifted laterally by Δx/R ≈ 0.42, moving from x/R = −0.18 at 1.5D to x/R = −0.60 at 2.5D. The k-weighted centroids (the center of mass of TKE laterally, calculated as x/R:xc = ∑xiki / ∑ki) showed a consistent trend, shifting from x/R = −0.12 to −0.51 across the same downstream range. This systematic displacement of the turbulent structures quantitatively substantiates the visual observation of lateral TKE redistribution toward the lower wake side with increasing separation and mirrored the deflection of the high-speed flow described in Section 3.4.2.
Collectively, these quantitative results support the earlier mechanistic explanation: the duct geometry and sheet placement generate low-pressure suction and concentrated vortices that intensify velocity fluctuations. This process results in higher TKE levels and asymmetric wake spreading in the MDWT. In contrast, the MBWT wakes remained comparatively uniform and symmetric, with significantly lower TKE magnitudes.
3.4.5. Quantitative Correlation Between Power, Pressure, and Turbulence
Power–Pressure Relationship
Across all configurations, the MDWT exhibited substantially larger pressure deficits (mean −6.6 Pa) than the MBWT (−0.51 Pa). These strong suction zones coincided with higher total power coefficients (Cₚ,total ≈ 0.61 vs. 0.32). Statistical evaluation yielded a Pearson correlation of r = −0.94 between the magnitude of static-pressure deficit (|P|) and Cₚ,total, confirming that increased suction directly enhances aerodynamic power extraction.
Pressure–Turbulence Relationship
The MDWT’s highest TKE values occurred at the locations of maximum pressure deficit. At 1.5D, the pressure drops of −6.88 Pa corresponded to a TKE of 0.0222, while at 2.5D, both parameters slightly decreased (−6.16 Pa and 0.0201). The resulting correlation of r = +0.97 indicates that low-pressure zones promote turbulence amplification through vortex shedding and accelerated gap flow.
Turbulence–Power Relationship
Comparing the downstream turbines showed that elevated TKE translated into higher power recovery. The MDWT case (TKE = 0.0222) produced a Cₚ,WT2 = 0.138, whereas the MBWT (TKE = 0.00104) yielded only Cₚ,WT2 = 0.052. This relationship gives a positive correlation of r = +0.91, demonstrating that turbulence-induced wake mixing sustains energy transfer to the downstream rotor.
The combined correlations establish a coherent aerodynamic sequence:
Pressure deficit (drop in P) → Increased turbulent kinetic energy (TKE) → Enhanced wake mixing → Higher power coefficient (Cp).
This chain confirms that the MDWT’s superior efficiency originates from pressure-driven turbulence production and wake re-energization, whereas the MBWT’s weaker gradients limit recovery potential.
3.5. Sensitivity Analysis
The sensitivity of aerodynamic performance and wake behavior was assessed with respect to inter-turbine spacing, downstream distance, and duct–PFCT effects.
3.5.1. Inter-Turbine Spacing
For the MBWT, the total power coefficient increased from 0.306 to 0.334 as spacing widened (1.5D–2.5D), showing gradual wake recovery. In contrast, the MDWT maintained a nearly constant total Cₚ of ≈0.61, demonstrating minimal sensitivity to spacing. The downstream turbine in the MDWT exhibited small variations in power deficit (−64.3% to −65.5%), confirming spacing-independent performance.
3.5.2. Downstream Distance and Pressure Field
Velocity recovery in the MBWT wake improved steadily from 0.3 to 0.7 between 1.5D and 2.5D, whereas the MDWT retained asymmetric low-speed regions (≈0.3–0.4). Static pressure in the MDWT wake remained markedly lower (−6.9 → −6.2 Pa) than in the MBWT (≈−0.5 Pa), highlighting strong duct-induced suction and enhanced entrainment near the wake core.
3.5.3. Turbulence and Wake Structure
The MDWT generated substantially higher turbulence kinetic energy (median 0.0222 vs. 0.00104 for MBWT) and showed a downward shift of turbulent structures (Δx/R ≈ 0.42) with increased spacing. These effects confirm that turbulence amplification and wake deflection are primarily governed by duct geometry rather than spacing.
Overall, the MDWT performance is largely insensitive to spacing, dominated instead by geometry-driven flow acceleration and pressure gradients. The MBWT, by contrast, shows conventional spacing-dependent recovery typical of bare turbine arrays.
4. Limitations of the Study
The identified limitations of this work can be ranked according to their relative influence on the accuracy and generalizability of the findings.
4.1. Omission of Tower and Nacelle Geometry
The exclusion of the turbine tower and nacelle introduced a critical simplification that significantly compromised near-wake fidelity. This omission artificially enforced wake symmetry, resulting in near-wake velocity errors of up to 51%. This deviation, observed at 1.5D downstream and across the rotor’s lateral extent, is consistent with previous validations (e.g., [48,49,50,51]) which show that significant asymmetry is recovered only when the tower is modeled. The simulated wake lacked the upward-deflected, high-turbulence region generated by the tower, which typically creates a low-velocity zone in the lower rotor plane. Consequently, the inflow velocity to the lower blade sections was overestimated, particularly in tightly spaced layouts. Furthermore, the absence of the tower’s bluff-body wake led to a marked underprediction of TKE in the lower near-wake (Figure 23 and Figure 24), potentially masking the elevated fatigue loads on WT2.
4.2. Idealized Inflow Conditions
The simulations assume uniform inflow with moderate turbulence intensity (around 5%), which contrasts with the complex vertical shear, veer, and higher ambient turbulence intensities (8–15%) found in the atmospheric boundary layer. This reduced turbulence realism likely underestimates wake recovery variability and turbulence amplification, affecting the accuracy of power loss and fatigue load predictions in actual field conditions.
4.3. Rotor Modeling and Control Strategy
Rotor designs were based on Blade Element Momentum theory under free-stream assumptions and do not account for complex flow curvature effects induced by ducts. The use of fixed-pitch and fixed-TSR control neglects dynamic operational strategies such as variable pitch or yaw adjustments, which in reality could mitigate wake losses and improve energy capture.
4.4. Turbulence Modeling Fidelity
The URANS approach with the k-ω SST turbulence model, while well-validated for predicting mean flow characteristics, is known to under-resolve unsteady vortex dynamics and small-scale turbulence with Relative Error (10–23.8%) [34,50]. This limitation is particularly relevant for capturing the full spectrum of turbulent interactions in the wake, potentially leading to an inaccurate representation of turbulence decay and the energy contained within coherent structures.
4.5. Extrapolation of Wind-Tunnel Validation to Atmospheric Conditions
Wind-tunnel validation (as performed for the DWT and BWT cases) supports the credibility of the numerical model for mean-flow, early design screening. However, extrapolation to atmospheric operation must be qualified: Reynolds-number mismatch, inflow length-scale differences and atmospheric stability can each alter wake recovery and unsteady behavior by amounts that are not negligible for power and load predictions. By explicitly correcting for matching or bounding turbulent length scales, including structural geometry, the uncertainty in translating tunnel-scale validation to field predictions can be substantially reduced.
5. Conclusions and Future Work
This study investigated the aerodynamic performance and wake dynamics of ducted versus bare wind turbines in both single and tandem arrangements using CFD. The use of high-fidelity CFD was instrumental in achieving this work’s objective. It provided the complete, three-dimensional data required to characterize the complex viscous and turbulent physics of the near-wake, which were inaccessible to lower-fidelity models. The CFD results directly revealed the key wake features—including vortex shedding dynamics, turbulent kinetic energy distribution, and the mechanism of wake breakdown—that form the core findings of this study.
The results confirmed that integrating a duct with PFCT significantly enhances aerodynamic efficiency. The single ducted turbine achieved a 71% increase in peak power coefficient compared to the bare turbine, while the tandem MDWT configuration nearly doubled the total power output, demonstrating the effectiveness of the PFCT-assisted duct in amplifying energy capture. The PFCT-sheets fundamentally alters near-wake behavior through pressure-driven entrainment and vortex-enhanced mixing. The MDWT arrangement produced stronger pressure deficits (≈−6.6 Pa) and higher turbulence kinetic energy (≈21× that of MBWT), validating that passive flow control successfully re-energizes the wake and maintains higher inflow velocity to the downstream rotor.
The MDWT configuration demonstrated minimal sensitivity to turbine spacing, maintaining a near-constant total Cₚ ≈ 0.61 across 1.5D–2.5D separations. This confirms that the ducted system can operate efficiently in compact layouts—achieving high spatial power density—unlike the MBWT system, which required wider spacing for performance recovery.
Collectively, these outcomes establish that the MDWT with PFCT integration provides a passive, geometry-driven mechanism for wake energy recovery and compact-array optimization. The findings validate the study’s central hypothesis: that wake energy, rather than being lost, can be effectively re-entrained through duct–PFCT coupling to sustain downstream power generation, advancing both the scientific understanding and practical application of multi-ducted wind turbine systems.
Future research should address the current study’s limitations by incorporating full turbine geometries, including tower and nacelle, to accurately capture complex wake asymmetries and turbulence generation. Additionally, adaptive control strategies such as variable pitch and yaw should be tested under operational variability and turbulent inflow conditions to evaluate system robustness and optimize power capture. This includes applying advanced adaptive pitch or torque control algorithms shown to enhance energy extraction while reducing structural loads in modern wind turbines.
Extending the analysis across a broad range of wind speeds and atmospheric conditions will be essential to determine the scalability and robustness of the aerodynamic benefits of ducted tandem turbines. The computational model needs coupling of CFD solvers with synthetic turbulence generators or precursor LES within a Hybrid RANS/LES framework to introduce realistic inflow turbulence. Parameterizing inflow shear and veer profiles will enable simulation of realistic atmospheric boundary layer variability, ensuring the model accurately reflects field operating conditions.
Such refinements will be critical for translating the demonstrated efficiency gains of ducted tandem turbines into robust design guidelines for large-scale and urban wind farm applications. Conceptually, this work establishes a new passive aerodynamic optimization model by showing that wake energy can be re-entrained through duct–PFCT coupling to sustain downstream power generation. Scientifically, it contributes a validated framework for characterizing wake–duct interactions in multi-rotor systems, while technologically advancing the development of compact, modular wind turbine arrays suited for constrained spatial environments.
Author Contributions
M.M.A.: Conceptualization, Methodology, Software, Formal analysis, Investigation, Resources, Writing—Original Draft, Data Curation, Funding acquisition; M.M.-G.: Validation, Supervision, Writing—Review and Editing, Project administration, Visualization. All authors have read and agreed to the published version of the manuscript.
Funding
This research received no external funding.
Data Availability Statement
The data that support the findings of this study are available from the corresponding author upon reasonable request.
Conflicts of Interest
Maytham M. Abid has patent pending to P202430727. Marc Marin Genesca has patent pending to P202430727. If there are other authors, they declare that they have no known competing financial interests or personal relationships that could have appeared to influence the work reported in this paper.
Abbreviations
This manuscript uses the following abbreviations and symbols.
| BEM | Blade Element Momentum |
| BWT | Bare wind turbine |
| CFD | Computational fluid dynamics |
| Cp | Power coefficient |
| Cp,max | Maximum power coefficient |
| Cp,total | Total power coefficient for configuration |
| DAWT | Diffuser-augmented wind turbine |
| DWT | Ducted wind turbine |
| HAWT | Horizontal-axis wind turbine |
| MBWT | Multi-bare wind turbine configuration |
| MDWT | Multi-ducted wind turbine configuration |
| MRS | Multi-rotor system |
| WLT | Wind lens turbine |
| WT1 | First wind turbine in the twin configuration |
| WT2 | Second wind turbine in the twin configuration |
| Symbols | |
| D | Rotor diameter (m) |
| Instantaneous velocity at a defined point (m/s) | |
| Root mean square of speed oscillations normalized to free-stream speed (m/s) | |
| Velocity fluctuation from mean value at measurement point (m/s) | |
| Average inflow speed (m/s) | |
| Vref. | Reference velocity (Inlet velocity = 5 m/s) |
| Vwake | Velocity in wake region (m/s) |
| λ | Tip speed ratio |
| Rotor angular velocity (rad/s) | |
References
- Wang, L.; Dong, M.; Yang, J.; Wang, L.; Chen, S.; Duić, N.; Joo, Y.H.; Song, D. Wind turbine wakes modeling and applications: Past, present, and future. Ocean Eng. 2024, 309, 118508. [Google Scholar] [CrossRef]
- Göltenbott, U.; Ohya, Y.; Yoshida, S.; Jamieson, P. Aerodynamic interaction of diffuser augmented wind turbines in multi-rotor systems. Renew. Energy 2017, 112, 25–34. [Google Scholar] [CrossRef]
- McTavish, S.; Rodrigue, S.; Feszty, D.; Nitzsche, F. An investigation of in-field blockage effects in closely spaced lateral wind farm configurations. Wind Energy 2015, 18, 1989–2011. [Google Scholar] [CrossRef]
- Forsting, A.R.M.; Troldborg, N. The effect of blockage on power production for laterally aligned wind turbines. J. Phys. Conf. Ser. 2015, 625, 012029. [Google Scholar] [CrossRef]
- Zong, H.; Porte-Agel, F. Experimental investigation and analytical modelling of active yaw control for wind farm power optimization. Renew. Energy 2021, 170, 1228–1244. [Google Scholar] [CrossRef]
- Brown, K.; Cheung, L.; Hsieh, A.; Maniaci, D.; Hamilton, W. Wake interactions behind individual-tower multi-rotor wind turbine configurations. J. Phys. Conf. Ser. 2023, 2505, 012041. [Google Scholar] [CrossRef]
- Xiong, X.L.; Laima, S.; Li, H. Experimental study of the wake of multi-rotor turbine. Ocean Eng. 2023, 269, 113594. [Google Scholar] [CrossRef]
- Yang, D.; Gu, X.; Li, C.; Lin, F.; Jiang, Z.; Yang, M.; Liu, Z.; Qi, Z.; He, L.; Wu, S. CFD study on wake characteristics of a dual rotor wind turbine using different turbulence models. J. Phys. Conf. Ser. 2024, 2820, 012012. [Google Scholar] [CrossRef]
- Feng, B.; Liu, X.; Ying, Y.; Si, Y.; Zhang, D.; Qian, P. Research on the tandem arrangement of the ducted horizontal-axis tidal turbine. Energy Convers. Manag. 2022, 258, 115546. [Google Scholar] [CrossRef]
- Watanabe, K.; Ohya, Y. Multirotor systems using three shrouded wind turbines for power output increase. J. Energy Resour. Technol. 2019, 141, 051211. [Google Scholar] [CrossRef]
- Carrillo-Canizalez, D.; Watanabe, K.; Uchida, T.; Ohya, Y. Power Output Enhancement of Wind Lens Turbines Used in Various Arrangements of Multi Multi-Rotor System. Proc. Jpn. Wind Energy Symp. 2020, 42, 80–83. [Google Scholar]
- Gunasekaran, S.; Peyton, M.; Novotny, N. Aerodynamic Interactions of Wind Lenses at Close Proximities. Energies 2022, 15, 4622. [Google Scholar] [CrossRef]
- Watanabe, S.; Yoshikawa, M.; Hu, C. CFD simulation of a multi-rotor system using diffuser augmented wind turbines by lattice Boltzmann method. J. Phys. Conf. Ser. 2024, 2767, 072002. [Google Scholar] [CrossRef]
- Halawa, A.M.; Uchida, T.; Watanabe, K.; Ohya, Y. Validation Study of Multi-Rotor Systems Using Two Shrouded Wind Turbines. J. Phys. Conf. Ser. 2020, 1618, 032017. [Google Scholar] [CrossRef]
- Mohamed, A.; El-Baz, A.; Mahmoud, N.; Hamed, A.; El-kohly, A. CFD Simulation of Ducted Dual Rotor Wind Turbine for Small-Scale Applications. In Proceedings of the ASME 2019 Gas Turbine India Conference, Chennai, India, 5–6 December 2019; Volume 83532, p. V002T06A001. [Google Scholar]
- Rahmatian, M.A.; Tari, P.H.; Majidi, S.; Mojaddam, M. Experimental study of the effect of the duct on dual co-axial horizontal axis wind turbines and the effect of rotors diameter ratio and distance on increasing power coefficient. Energy 2023, 284, 128664. [Google Scholar] [CrossRef]
- Taghinezhad, J.; Alimardani, R.; Masdari, M.; Mahmoodi, E. Performance optimization of a dual-rotor ducted wind turbine by using response surface method. Energy Convers. Manag. X 2021, 12, 100120. [Google Scholar] [CrossRef]
- Silva, P.A.; Tsoutsanis, P.; Vaz, J.R.; Macias, M.M. A comprehensive CFD investigation of tip vortex trajectory in shrouded wind turbines using compressible RANS solver. Energy 2024, 294, 130929. [Google Scholar] [CrossRef]
- Hwang, P.-W.; Wu, J.-H.; Chang, Y.-J. Optimization Based on Computational Fluid Dynamics and Machine Learning for the Performance of Diffuser-Augmented Wind Turbines with Inlet Shrouds. Sustainability 2024, 16, 3648. [Google Scholar] [CrossRef]
- Shambira, N.; Makaka, G.; Mukumba, P. Velocity augmentation model for an empty concentrator-diffuser-augmented wind turbine and optimisation of geometrical parameters using surface response methodology. Sustainability 2024, 16, 1707. [Google Scholar] [CrossRef]
- Lipian, M.; Dobrev, I.; Massouh, F.; Jozwik, K. Small wind turbine augmentation: Numerical investigations of shrouded-and twin-rotor wind turbines. Energy 2020, 201, 117588. [Google Scholar] [CrossRef]
- Bilgen, O.; Wang, R.; Cao, Y.; Erol, N.; Shan, X. A reconfigurable ducted turbine array concept for renewable flow energy harvesting. In Proceedings of the AIAA SCITECH 2022 Forum, San Diego, CA, USA, 3–7 January 2022; p. 2222. [Google Scholar]
- Song, K.; Huan, H.; Wei, L.; Liu, C. Aerodynamic performance and coupling gain effect of Archimedes spiral wind turbine array. J. Mar. Sci. Eng. 2024, 12, 1062. [Google Scholar] [CrossRef]
- Watanabe, K.; Ohya, Y. A simple theory and performance prediction for a shrouded wind turbine with a brimmed diffuser. Energies 2021, 14, 3661. [Google Scholar] [CrossRef]
- Masukume, P.M.; Makaka, G.; Mukumba, P. Optimization of the power output of a bare wind turbine by the use of a plain conical diffuser. Sustainability 2018, 10, 2647. [Google Scholar] [CrossRef]
- Olabinjo, O.O. Response surface techniques as an inevitable tool in optimization process. In Response Surface Methods-Theory, Applications and Optimization Techniques; IntechOpen: London, UK, 2024. [Google Scholar]
- Sudarman Subeki, N.; Akhmadi, A.K.R. Design of a micro-scale wind turbine with horizontal axis using airfoil NACA 4412. AIP Conf. Proc. 2022, 2453, 020001. [Google Scholar] [CrossRef]
- Liu, P.; Xing, Y.; Guo, H.; Li, L. Design and performance of a small-scale aeroacoustic wind tunnel. Appl. Acoust. 2017, 116, 65–69. [Google Scholar] [CrossRef]
- Pope, K.; Rodrigues, V.; Doyle, R.; Tsopelas, A.; Gravelsins, R.; Naterer, G.F.; Tsang, E. Effects of stator vanes on power coefficients of a zephyr vertical axis wind turbine. Renew. Energy 2010, 35, 1043–1051. [Google Scholar] [CrossRef]
- Caré, I.; Bonthoux, F.; Fontaine, J.R. Measurement of air flow in duct by velocity measurements. EPJ Web Conf. 2014, 77, 00010. [Google Scholar] [CrossRef]
- Chen, J.; Hu, Y.; Yu, Y.; Lü, S. Ergodicity test of the eddy-covariance technique. Atmos. Chem. Phys. 2015, 15, 9929–9944. [Google Scholar] [CrossRef]
- Kocer, G.; Mansour, M.; Chokani, N.; Abhari, R.S.; Müller, M. Full-Scale Wind Turbine Near-Wake Measurements Using an Instrumented Uninhabited Aerial Vehicle. J. Sol. Energy Eng. 2011, 133, 041011. [Google Scholar] [CrossRef]
- Zhang, W.; Markfort, C.D.; Porté-Agel, F. Near-wake flow structure downwind of a wind turbine in a turbulent boundary layer. Exp. Fluids 2012, 52, 1219–1235. [Google Scholar] [CrossRef]
- Pierella, F.; Krogstad, P.Å.; Sætran, L. Blind Test 2 calculations for two in-line model wind turbines where the downstream turbine operates at various rotational speeds. Renew. Energy 2014, 70, 62–77. [Google Scholar] [CrossRef]
- Ghasemian, M.; Ashrafi, Z.N.; Sedaghat, A. A review on computational fluid dynamic simulation techniques for Darrieus vertical axis wind turbines. Energy Convers. Manag. 2017, 149, 87–100. [Google Scholar] [CrossRef]
- Mao, Z.; Zhang, T.; Yang, G.; Tian, W. Effects of gurney flaps on the performance of a horizontal axis ocean current turbine. J. Mar. Sci. Eng. 2023, 11, 2188. [Google Scholar] [CrossRef]
- Saeed, H.A.H.; Elmekawy, A.M.N.; Kassab, S.Z. Numerical study of improving Savonius turbine power coefficient by various blade shapes. Alex. Eng. J. 2019, 58, 429–441. [Google Scholar] [CrossRef]
- Gui, X.; Xue, H.; Su, S.; Hu, Z.; Xu, Y. Study on aerodynamic performance of mine air duct horizontal axis wind turbine based on breeze power generation. Energy Sci. Eng. 2022, 10, 1132–1152. [Google Scholar] [CrossRef]
- Jaszczur, M.; Borowski, M.; Halibart, J.; Zwolińska-Glądys, K.; Marczak, P. Optimization of the Small Wind Turbine Design—Performance Analysis. Computation 2024, 12, 215. [Google Scholar] [CrossRef]
- Lee, J.-H.; Lee, Y.-T.; Lim, H.-C. Effect of twist angle on the performance of Savonius wind turbine. Renew. Energy 2016, 89, 231–244. [Google Scholar] [CrossRef]
- Abid, M.M.; Mahmood, H.Y. Numerical Study for HAWT Wake shape with different Angles of Attack. J. Eng. 2021, 27, 1–15. [Google Scholar] [CrossRef]
- ANSYS Fluent Theory Guide. Available online: https://dl.cfdexperts.net/cfd_resources/Ansys_Documentation/Fluent/Ansys_Fluent_Theory_Guide.pdf (accessed on 11 July 2025).
- Lanzafame, R.; Mauro, S.; Messina, M. 2D CFD modeling of H-Darrieus wind turbines using a transition turbulence model. Energy Procedia 2014, 45, 131–140. [Google Scholar] [CrossRef]
- Balduzzi, F.; Bianchini, A.; Ferrara, G.; Ferrari, L. Dimensionless numbers for the assessment of mesh and timestep requirements in CFD simulations of Darrieus wind turbines. Energy 2016, 97, 246–261. [Google Scholar] [CrossRef]
- Yuan, Y.; Hao, H.; Yu, Z.; Zheng, X.; Wang, C. Experimental and numerical validation of a hybrid method for modelling the wake flow of two in-line wind turbines. Eng. Appl. Comput. Fluid Mech. 2023, 17, 2270505. [Google Scholar] [CrossRef]
- Antonini, E.G.A.; Romero, D.A.; Amon, C.H. Analysis and modifications of turbulence models for wind turbine wake simulations in atmospheric boundary layers. J. Sol. Energy Eng. 2018, 140, 031007. [Google Scholar] [CrossRef]
- Abraham, A.; Dasari, T.; Hong, J. Effect of turbine nacelle and tower on the near wake of a utility-scale wind turbine. J. Wind Eng. Ind. Aerodyn. 2019, 193, 103981. [Google Scholar] [CrossRef]
- Krogstad, P.; Eriksen, P.E. “Blind test” calculations of the performance and wake development for a model wind turbine. Renew. Energy 2013, 50, 325–333. [Google Scholar] [CrossRef]
- Krogstad, P.; Sætran, L.; Adaramola, M.S. “Blind Test 3” calculations of the performance and wake development behind two in-line and offset model wind turbines. J. Fluids Struct. 2015, 52, 65–80. [Google Scholar] [CrossRef]
- Ye, M.; Chen, H.C.; Koop, A. High-fidelity CFD simulations for the wake characteristics of the NTNU BT1 wind turbine. Energy 2023, 265, 126285. [Google Scholar] [CrossRef]
- Ye, M.; Chen, H.C.; Koop, A. High-fidelity CFD simulations of two tandemly arrayed wind turbines under various operating conditions. Ocean Eng. 2024, 314, 119703. [Google Scholar] [CrossRef]
- Siavash, N.K.; Najafi, G.; Hashjin, T.T.; Ghobadian, B.; Mahmoodi, E. An innovative variable shroud for micro wind turbines. Renew. Energy 2020, 145, 1061–1072. [Google Scholar] [CrossRef]
- Zimmerman, S.; Philip, J.; Marino, N.; Klewicki, J. Downstream recovery of turbulence kinetic energy in the wake of a turbulent boundary layer wing-body junction flow. In Proceedings of the 21st Australasian Fluid Mechanics Conference, Adelaide, Australia, 10–13 December 2018. [Google Scholar]
- Gong, J.; Ding, J.; Wang, L. Propeller–duct interaction on the wake dynamics of a ducted propeller. Phys. Fluids 2021, 33, 074102. [Google Scholar] [CrossRef]
- Feng, D.; Gupta, V.; Li, L.K.; Wan, M. An improved dynamic model for wind-turbine wake flow. Energy 2024, 290, 130167. [Google Scholar] [CrossRef]
- Koc, E.; Yavuz, T. Effect of flap on the wind turbine-concentrator combination. Int. J. Renew. Energy Res. 2019, 9, 551–560. [Google Scholar] [CrossRef]
- Abe, K.I.; Ohya, Y. An investigation of flow fields around flanged diffusers using CFD. J. Wind Eng. Ind. Aerodyn. 2004, 92, 315–330. [Google Scholar] [CrossRef]
- Abe, K.; Nishida, M.; Sakurai, A.; Ohya, Y.; Kihara, H.; Wada, E.; Sato, K. Experimental and numerical investigations of flow fields behind a small wind turbine with a flanged diffuser. J. Wind Eng. Ind. Aerodyn. 2005, 93, 951–970. [Google Scholar] [CrossRef]
- Hu, J.F.; Wang, W.X. Upgrading a shrouded wind turbine with a self-adaptive flanged diffuser. Energies 2015, 8, 5319–5337. [Google Scholar] [CrossRef]
- Rahmatian, M.A.; Tari, P.H.; Mojaddam, M.; Majidi, S. Numerical and experimental study of the ducted diffuser effect on improving the aerodynamic performance of a micro horizontal axis wind turbine. Energy 2022, 245, 123267. [Google Scholar] [CrossRef]
Disclaimer/Publisher’s Note: The statements, opinions and data contained in all publications are solely those of the individual author(s) and contributor(s) and not of MDPI and/or the editor(s). MDPI and/or the editor(s) disclaim responsibility for any injury to people or property resulting from any ideas, methods, instructions or products referred to in the content. |
© 2025 by the authors. Licensee MDPI, Basel, Switzerland. This article is an open access article distributed under the terms and conditions of the Creative Commons Attribution (CC BY) license (https://creativecommons.org/licenses/by/4.0/).