Article

Comparative Transcriptome Analysis Identifies MAPK Signaling Pathway Associated with Regulating Ovarian Lipid Metabolism during Vitellogenesis in the Mud Crab, Scylla paramamosain

1
College of Fisheries and Life Science, Shanghai Ocean University, Shanghai 201306, China
2
Key Laboratory of East China Fishery Resources Exploitation, East China Sea Fisheries Research Institute, Ministry of Agriculture and Rural Affairs, Chinese Academy of Fishery Science, Shanghai 200090, China
*
Author to whom correspondence should be addressed.
Fishes 2023, 8(3), 145; https://doi.org/10.3390/fishes8030145
Submission received: 8 January 2023 / Revised: 23 February 2023 / Accepted: 24 February 2023 / Published: 28 February 2023
(This article belongs to the Special Issue Recent Advances in Crab Aquaculture)

Abstract

:
The mud crab, Scylla paramamosain, has abundant nutrients in the ovary, where numerous lipids accumulate during ovarian maturation. However, the mechanism behind the accumulation of lipids in the ovary of mud crab during ovarian maturation is largely unknown. This study conducted a comparative transcriptome analysis of the ovaries of mud crabs at various stages of ovarian maturation. A total of 63.69 Gb of clean data was obtained, with a Q30 of 93.34%, and 81,893 unigenes were identified, including 10,996 differentially expressed genes (DEGs). After KEGG enrichment of these DEGs, MAPK signaling pathway was significantly enriched during vitellogenesis. Moreover, the expression levels of genes involved in carbohydrate, amino acid, and lipid metabolism were found to be higher during vitellogenesis. The two genes (Sp-Eip75B and Sp-Eip78C) that are homologous to the vertebrate gene PPARγ in the PPAR signaling pathway, were identified. Additionally, genes in MAPK signaling pathway might regulate lipid metabolism through PPAR signaling pathway based on Protein-Protein Interaction (PPI) network. These findings suggest that MAPK signaling pathway plays a critical role in lipid metabolism in the ovary during vitellogenesis, which provides new insights into the mechanism of lipid accumulation during ovarian maturation in mud crabs.
Key Contribution: In this study, a comparative transcriptome analysis of the mud crab ovary during different ovarian maturation stages was performed. It is inferred that the MAPK signaling pathway should be associated with lipid metabolism regulation via the homologous gene of PPARγ (Sp-Eip75B and Sp-Eip78C) in the PPAR signaling pathway.

1. Introduction

The mud crab, Scylla paramamosain, is widely distributed in tropical and subtropical countries in the Indo-Pacific region and is important for commercial fishing [1,2]. Female mud crabs are typically more valuable due to the higher nutritional value of their matured ovaries [3,4]. However, overfishing of wild mud crabs has led to an increased demand for artificially bred mud crabs with mature ovaries [5]. Therefore, understanding the molecular mechanisms of ovarian development and oocyte maturation is crucial for both growing and breeding in mud crabs.
The two key biological events occur during the ovarian maturation period in mud crabs. The first is oocyte growth maturation, which refers to the completion of vitellogenesis in the oocyte and the cessation of oocyte volume increase. The second is oocyte physiological maturation, which refers to the detachment of the oocyte from the ovarian lobule and its entry into the first meiotic metaphase [6,7]. Both of these events are necessary for ovarian maturation and reproduction in aquatic invertebrates. Previous studies have identified five stages (stage I, II, III, IV, and V) during the first ovarian maturation period (FOMP) in mud crabs after mating based on morphological and histological observations, and on the gonadosomatic index (GSI) and the hepatopancreas index (HSI) [8,9]. During stage I, II, III, IV, and V, mud crab is able to undergo re-maturation after spawning, similar to the Chinese mitten crab (Eriocheir sinensis) [10] and swimming crab (Portunus trituberculatus) [11], with re-maturation occurring from Stage III to Stage V during the secondary ovarian maturation period (SOMP) in a short developmental period [12]. Ovarian stages III, IV, and V are collectively referred to as the vitellogenesis period [2], where vitellogenin (Vg) is synthesized by the ovary and hepatopancreas, undergoes a series of processes and modifications, accumulates in oocytes, and provides nutrients including lipid, protein, and carbohydrates to maturing oocytes for embryonic development [13,14]. Among these nutrients, lipids, specifically fatty acids, sterols, and phospholipids, are essential for various reproductive processes, including ovarian development, egg formation, spawning, and embryogenesis [15,16]. Previous research has shown that the hepatopancreas has a higher synthesis capacity for lipids during ovarian development than the ovary, as many lipids must be transported from the hepatopancreas to the ovary in the form of phospholipids [14,17]. Moreover, during ovarian maturation and spawning, the fatty acid composition of the ovary changes [18]. During ovary maturation and spawning, the fatty acid composition of the ovary changes, with C16:0 and C18:1n9c being the predominant fatty acids in the ovary and hepatopancreas [9,12,19], and there are dramatic changes in trends of HUFA and saturated fatty acids (SFA) during ovarian development [9,12]. The ovaries accumulate lipid content consisting of triacylglycerols (TAGs) and saturated fatty acids (SFAs) transferred from the hepatopancreas; this emphasizes the significance of SFAs as an important energy source for larval growth, embryonic development, and vitellogenesis [20,21]. The dynamic changes in lipid content are largely influenced by apolipocrustacein (apoCr), a protein involved in lipid transport, which is deposited in the hepatopancreas and transported to the ovary during ovarian maturation [22,23,24,25]. According to research by Zeng et al. [24], there are five types of large lipid transfer proteins that play a role in lipid transport during ovarian development in mud crabs. These proteins include apoCr1, apoCr2, a precursor of the large discoidal lipoprotein and high density lipoprotein/beta-glucan binding protein, microsomal triglyceride transfer protein, and clotting protein. These findings suggest that the accumulation of lipids in the ovary is largely dependent on supply from the hepatopancreas in mud crabs. In addition, a previous study [12] reported ovaries during SOMP could mature in a shorter time than that during FOMP with different ovarian developmental patterns. It suggested that lipids could rapidly accumulated in the ovary in a particularly shorter developmental period during SOMP than that during FOMP. However, there is a lack of research on the molecular mechanisms underlying ovarian lipid metabolism during ovarian maturation and the differences in the lipid metabolism mechanisms between the two ovarian maturation periods (FOMP and SOMP). Therefore, it is valuable to study the molecular mechanism in lipid metabolism during ovarian maturation for clarifying the ovarian developmental mechanism based on transcriptomic sequencing.
In this study, we conducted a comparative transcriptomic analysis of the different stages of ovarian development during two ovarian maturation periods (FOMP and SOMP) in the mud crab. Our analysis focused on identifying and analyzing key genes and signaling pathways involved in regulating ovarian lipid metabolism. The results of this study will provide new perspectives on the mechanism of lipid accumulation in mud crabs.

2. Materials and Methods

2.1. Animals and Sampling

This study obtained 100 individuals mud crab in ovarian stage I of the FOMP sourced from Ningbo City, Zhejiang province, China. The methods of crab cultivation and sampling used in this study were based on our previous report [12]. A total of 40 ovaries (eight groups of samples include five intact and similar individuals of each group with 0.5 ± 0.05 g per ovary) were collected during the different developmental stages (stage I to V in the first ovarian developmental period; stage III to V in the second ovarian developmental period) after ice anesthesia; these ovary samples were washed in 1 × PBS buffer and quick-frozen in liquid nitrogen for RNA extraction. The sample information is shown in Table 1. Ovarian stages were distinguished by histomorphology and color according to previous studies [2,9], as the pre-developmental stage (stage I, translucent), the pre-vitellogenesis stage (stage II, creamy white), the early vitellogenesis stage (stage III, light-yellow), the late vitellogenesis stage (stage IV, orange), and the mature stage (stage V, bright orange). To confirm the classification by histology, ovary tissues were selected for HE staining. Finally, ovaries of different ovarian stages were identified. All the ovaries of the same stage were pooled into one mixed sample, and a total of eight groups of ovaries were obtained.

2.2. Library Constructing and Sequencing

Total RNA was extracted from ovary samples using TRIzol Reagent (Invitrogen, Waltham, MA, USA). RNA quality was assessed by agarose gel electrophoresis (agarose: 2%; TBE: 0.4 M Tris base, 0.4 M boric acid, 0.5 M EDTA; 10× loading buffer: 0.25 M bromophenol blue, 0.4 M sucrose; Dye: Ethidium bromide, EtBr) and Nanodrop 2000 (Thermo Scientific, Carlsbad, CA, USA). According to previous studies [26,27], sequencing libraries were constructed using the Illumina TruseqTM RNA sample prep Kit (San Diego, CA, USA), and the libraries were polled and then sequenced on an Illumina Novaseq 6000 platform with 2 × 150 paired-end.

2.3. De Novo Assembly, Clustering Analysis, and Functional Annotation

High-quality raw data was obtained using the Illumina Novaseq 6000 platform. The quality of raw reads was visually evaluated by fastx_tookit software version 0.0.14. The sequence adapters and low-quality bases (Quality score < 20) were filtered out, and short length reads (<35 nt) were removed by fastp software version 0.19.5. Subsequent procedures, including assembly, clustering, and functional annotation, were performed based on previous reports [26,27]. The major procedures as following: the high-quality raw data were assembled into transcripts by Trinity software version 2.8.5, the assembled transcripts were filtered out and de-redundant using TransRate software version v1.0.3 and CD-HIT software version 4.5.7, and gene functional annotations were separately performed according to the following databases: NR (NCBI non-redundant proteins sequences), COG (Clusters of Orthologous Groups of proteins), Swiss-Prot (A manually annotated and reviewed protein sequence database), Pfam (Protein family), GO (Gene Ontology) and KEGG (Kyoto Encyclopedia of Genes and Genomes).

2.4. Analysis of DEGs and Functional Enrichment

To measure expression levels, the raw data was aligned to unigenes using bowtie2 and RSEM software and reported as transcripts per kilobase of exon model per million mapped reads (TPM). The identification of DEGs between different groups was carried out using edgeR software with thresholds set at |Log2FC| ≥ 4.0 and p-adjust < 0.001. Functional enrichment analysis of DEGs (GO and KEGG) was performed using the Goatlools software version 0.6.5 with a Fisher exact test on the Majorbio platform (https://cloud.majorbio.com/ (accessed on 1 October 2022)), and the corrected p-adjust < 0.05 was considered as significant enrichment.

2.5. Analysis of Functional Genes and Signaling Pathways Related to Ovarian Lipid Metabolism

A heat map was generated to visualize expression levels of genes associated with KEGG pathways of metabolism (amino acid metabolism, carbohydrate metabolism, and lipid metabolism), lipid metabolism (fatty acid degradation [map00062]). Furthermore, expression analysis of DEGs related to GO functions including lipid metabolism (lipid metabolic process [GO:0006629], lipid binding [GO:0008289], and lipid biosynthetic process [GO:0008610]) was also performed.

2.6. Analysis of PPI Networks

Analysis of PPI between the DEGs from the candidate KEGG signaling pathways related to mediating lipid metabolism were performed using the Majorbio platform (https://cloud.majorbio.com/ (accessed on 10 October 2022)) with the parameters of high confidence (0.700). The PPI network was established using the String database (Version 11.5: https://cn.string-db.org/cgi/input?sessionId=SLJ4TpGaDoRC&input_page_show_search=on (accessed on 10 October 2022)). The parameters were set as follows: organism: Drosophila melanogaster; active interaction sources: texting mining, experiments, databased, co-expression, neighborhood, gene fusion, and co-occurrence; minimum required interaction score: high confidence (0.700).

2.7. Confirmation of DEGs from Transcriptome Data

To validate the expression of DEGs identified by transcriptomic sequencing, 6 DEGs were randomly selected for additional qRT-PCR evaluation. In addition, two genes related to ovary development include vitellogenin (Vg, Sp-Vg) and vitellogenin receptor (VgR, Sp-VgR) were selected for qRT-PCR evaluation. The remaining total RNA used for RNAseq of each sample (see Section 2.2.) was reverse transcribed into cDNA by ReverTra Ace® qPCR RT Master Mix with gDNA Remover (Code No. FSQ-301, Toyobo Life Science, Shanghai, China) according to the manufacturer’s instructions. All primers used for qRT-PCR are shown in Supplementary file Table S1. Sp-18S was used as an internal control. All samples were analyzed three times by qRT-PCR using the following cycling conditions: 4 °C for 30 s, 40 cycles of 94 °C for 5 s, 60 °C for 30 s; followed by a melting curve at 94 °C for 15 s, 60 °C for 1 min, and 94 °C for 15 s.

2.8. Data Transformation and Statistical Analysis

All qRT-PCR data are shown as geometric mean ± S.D. Statistical analysis was carried out using Microsoft Excel 2016MSO (version 2301 Build 16.0.16026.20002) and IBM SPSS Statistics software (version 26.0), and between-group comparisons were performed using one-way ANOVA. Pearson’s correlation test was conducted between the data from qRT-PCR and RNAseq using IBM SPSS software (version 26.0). A p-value of p < 0.05 was considered significantly significant.

3. Results

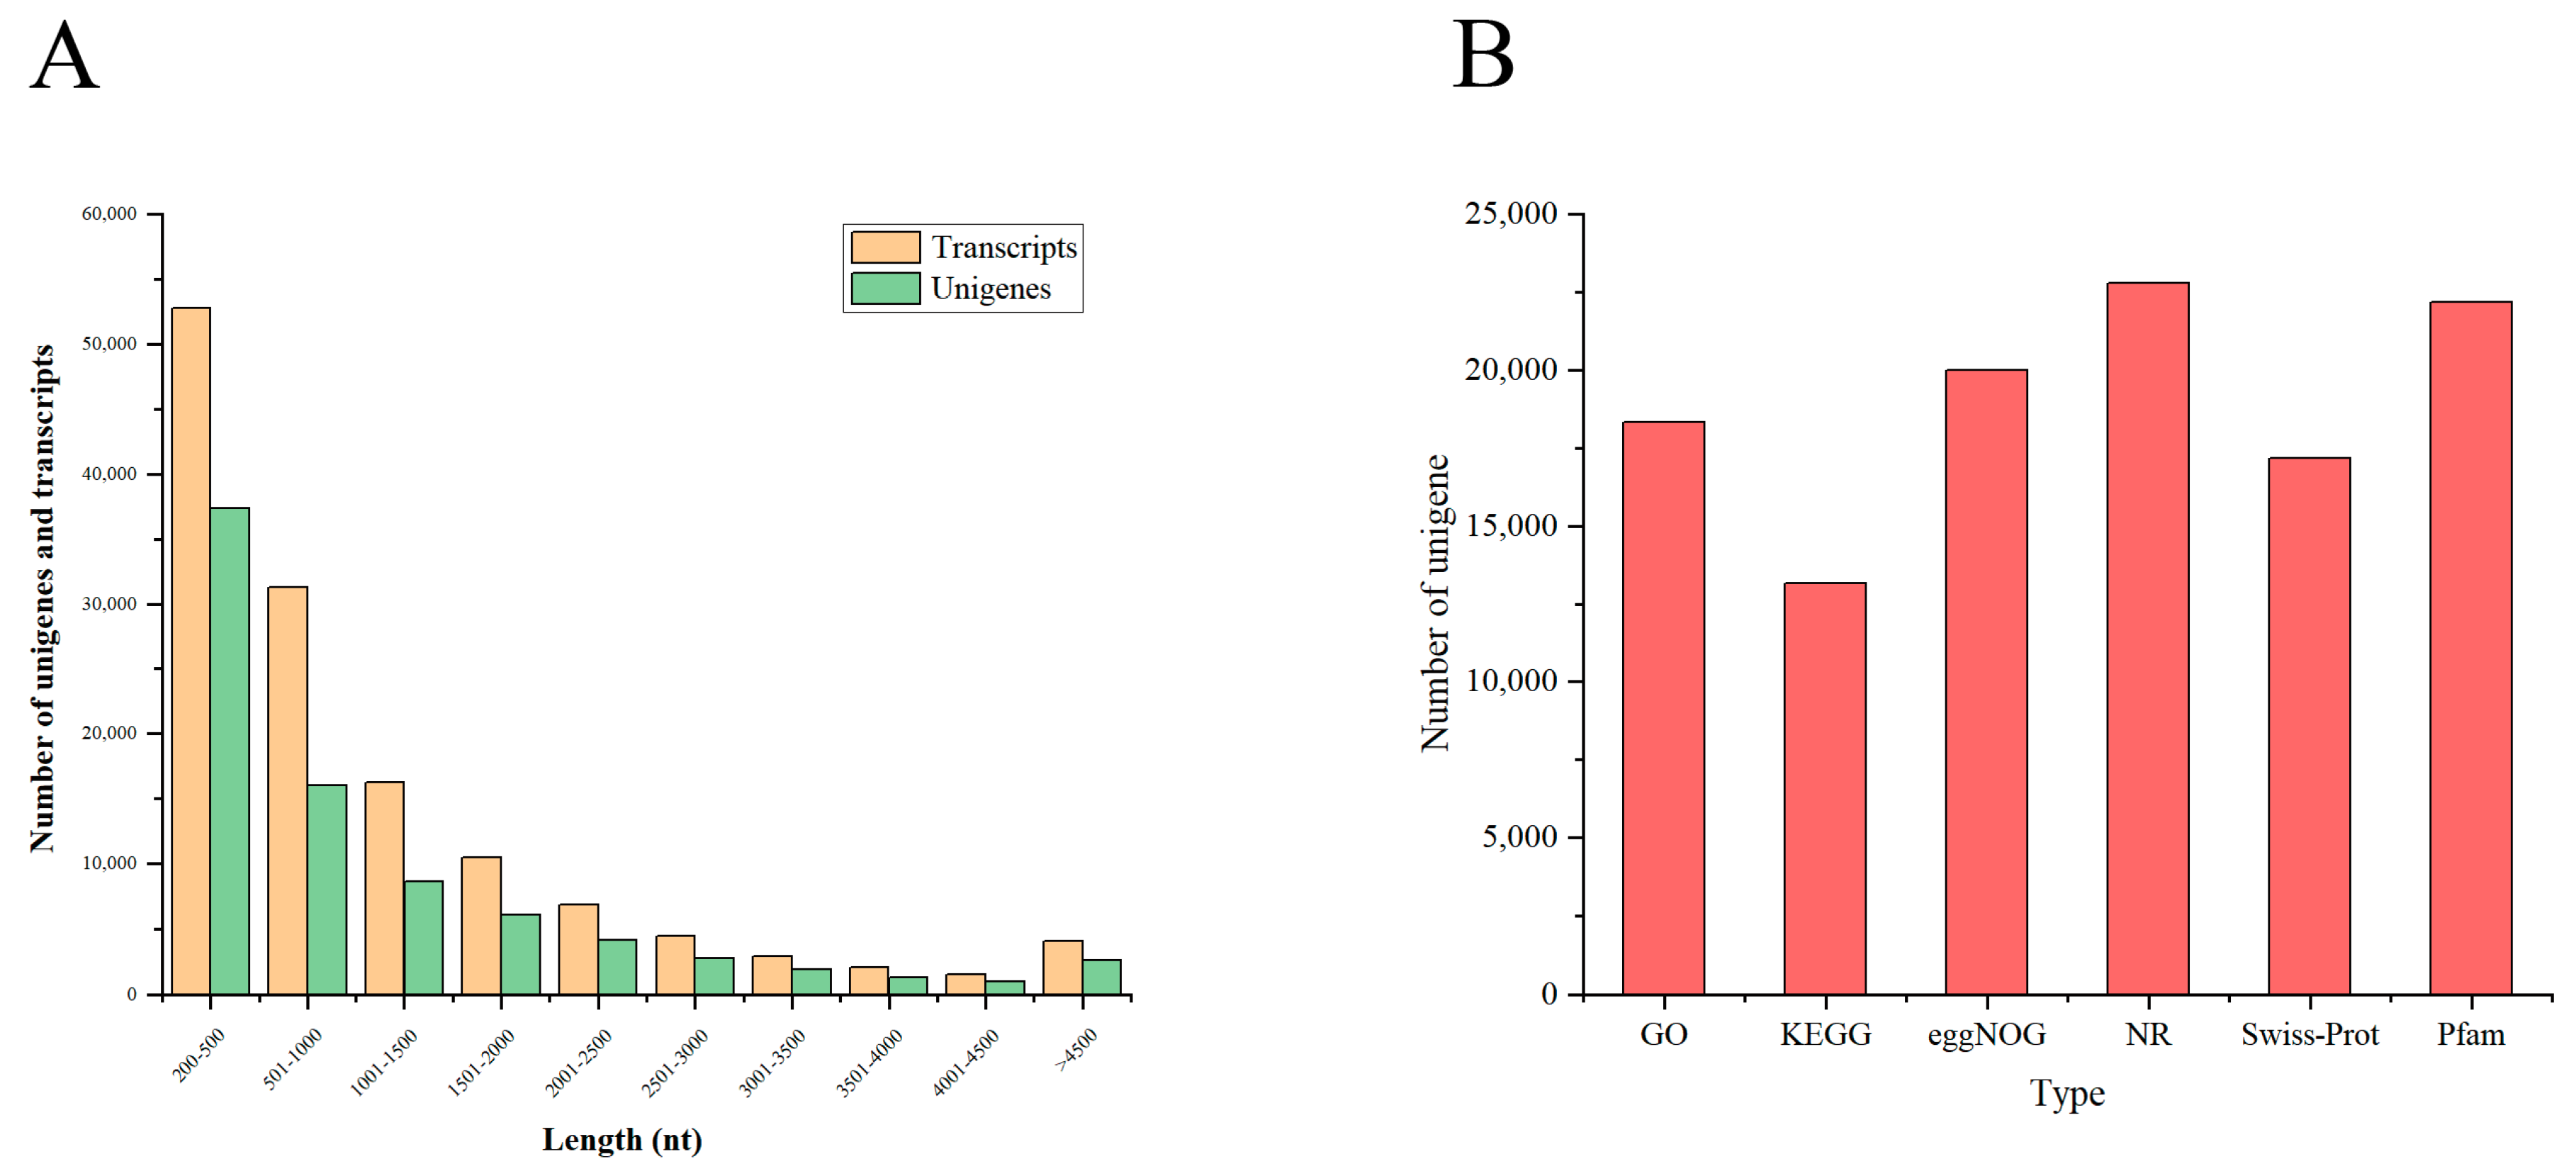
3.1. Assembly and Quality Control of Transcriptome Data

Eight groups of ovary samples from mud crabs were collected during the two ovarian maturation periods (stage I to stage V of the FOMP; stage III to stage V of the SOMP), and were subjected to RNA-seq. The total raw read counts of all samples were between 52,707,876 and 63,846,232; the Q30 base ratios and the GC contents ranged from 91.83% to 92.62% and 50.34% to 52.67%, respectively; while the average of GC contents was 51.78% (Supplementary File Table S2). After quality control, total clean read counts of all the samples ranged from 48,538,534 to 61,793,014; the Q30 and the GC content ranged from 48,538,534 to 61,793,014 and 50.23% to 52.56%; while the average GC content was 51.62% (Supplementary file Table S3).
The clean reads were assembled into transcripts, and the largest transcripts were identified as unigenes. A total of 132,744 transcripts and 81,893 unigenes were identified with average length of 1161.47 bp and 1133.65 bp, respectively; the N50 length of the transcripts and unigenes were 1986 bp and 2111 bp. In addition, to evaluate the assembly of transcripts and unigenes, three parameters including fragment mapped percent (84.346% and 71.497%), GC percent (46.75% and 46.62%), and BUSCO score (98.5% and 96.6%) were evaluated (Table 2). The length distribution of the transcripts (64%) and unigenes (66%) was generally less than 1000 bp (Figure 1A).

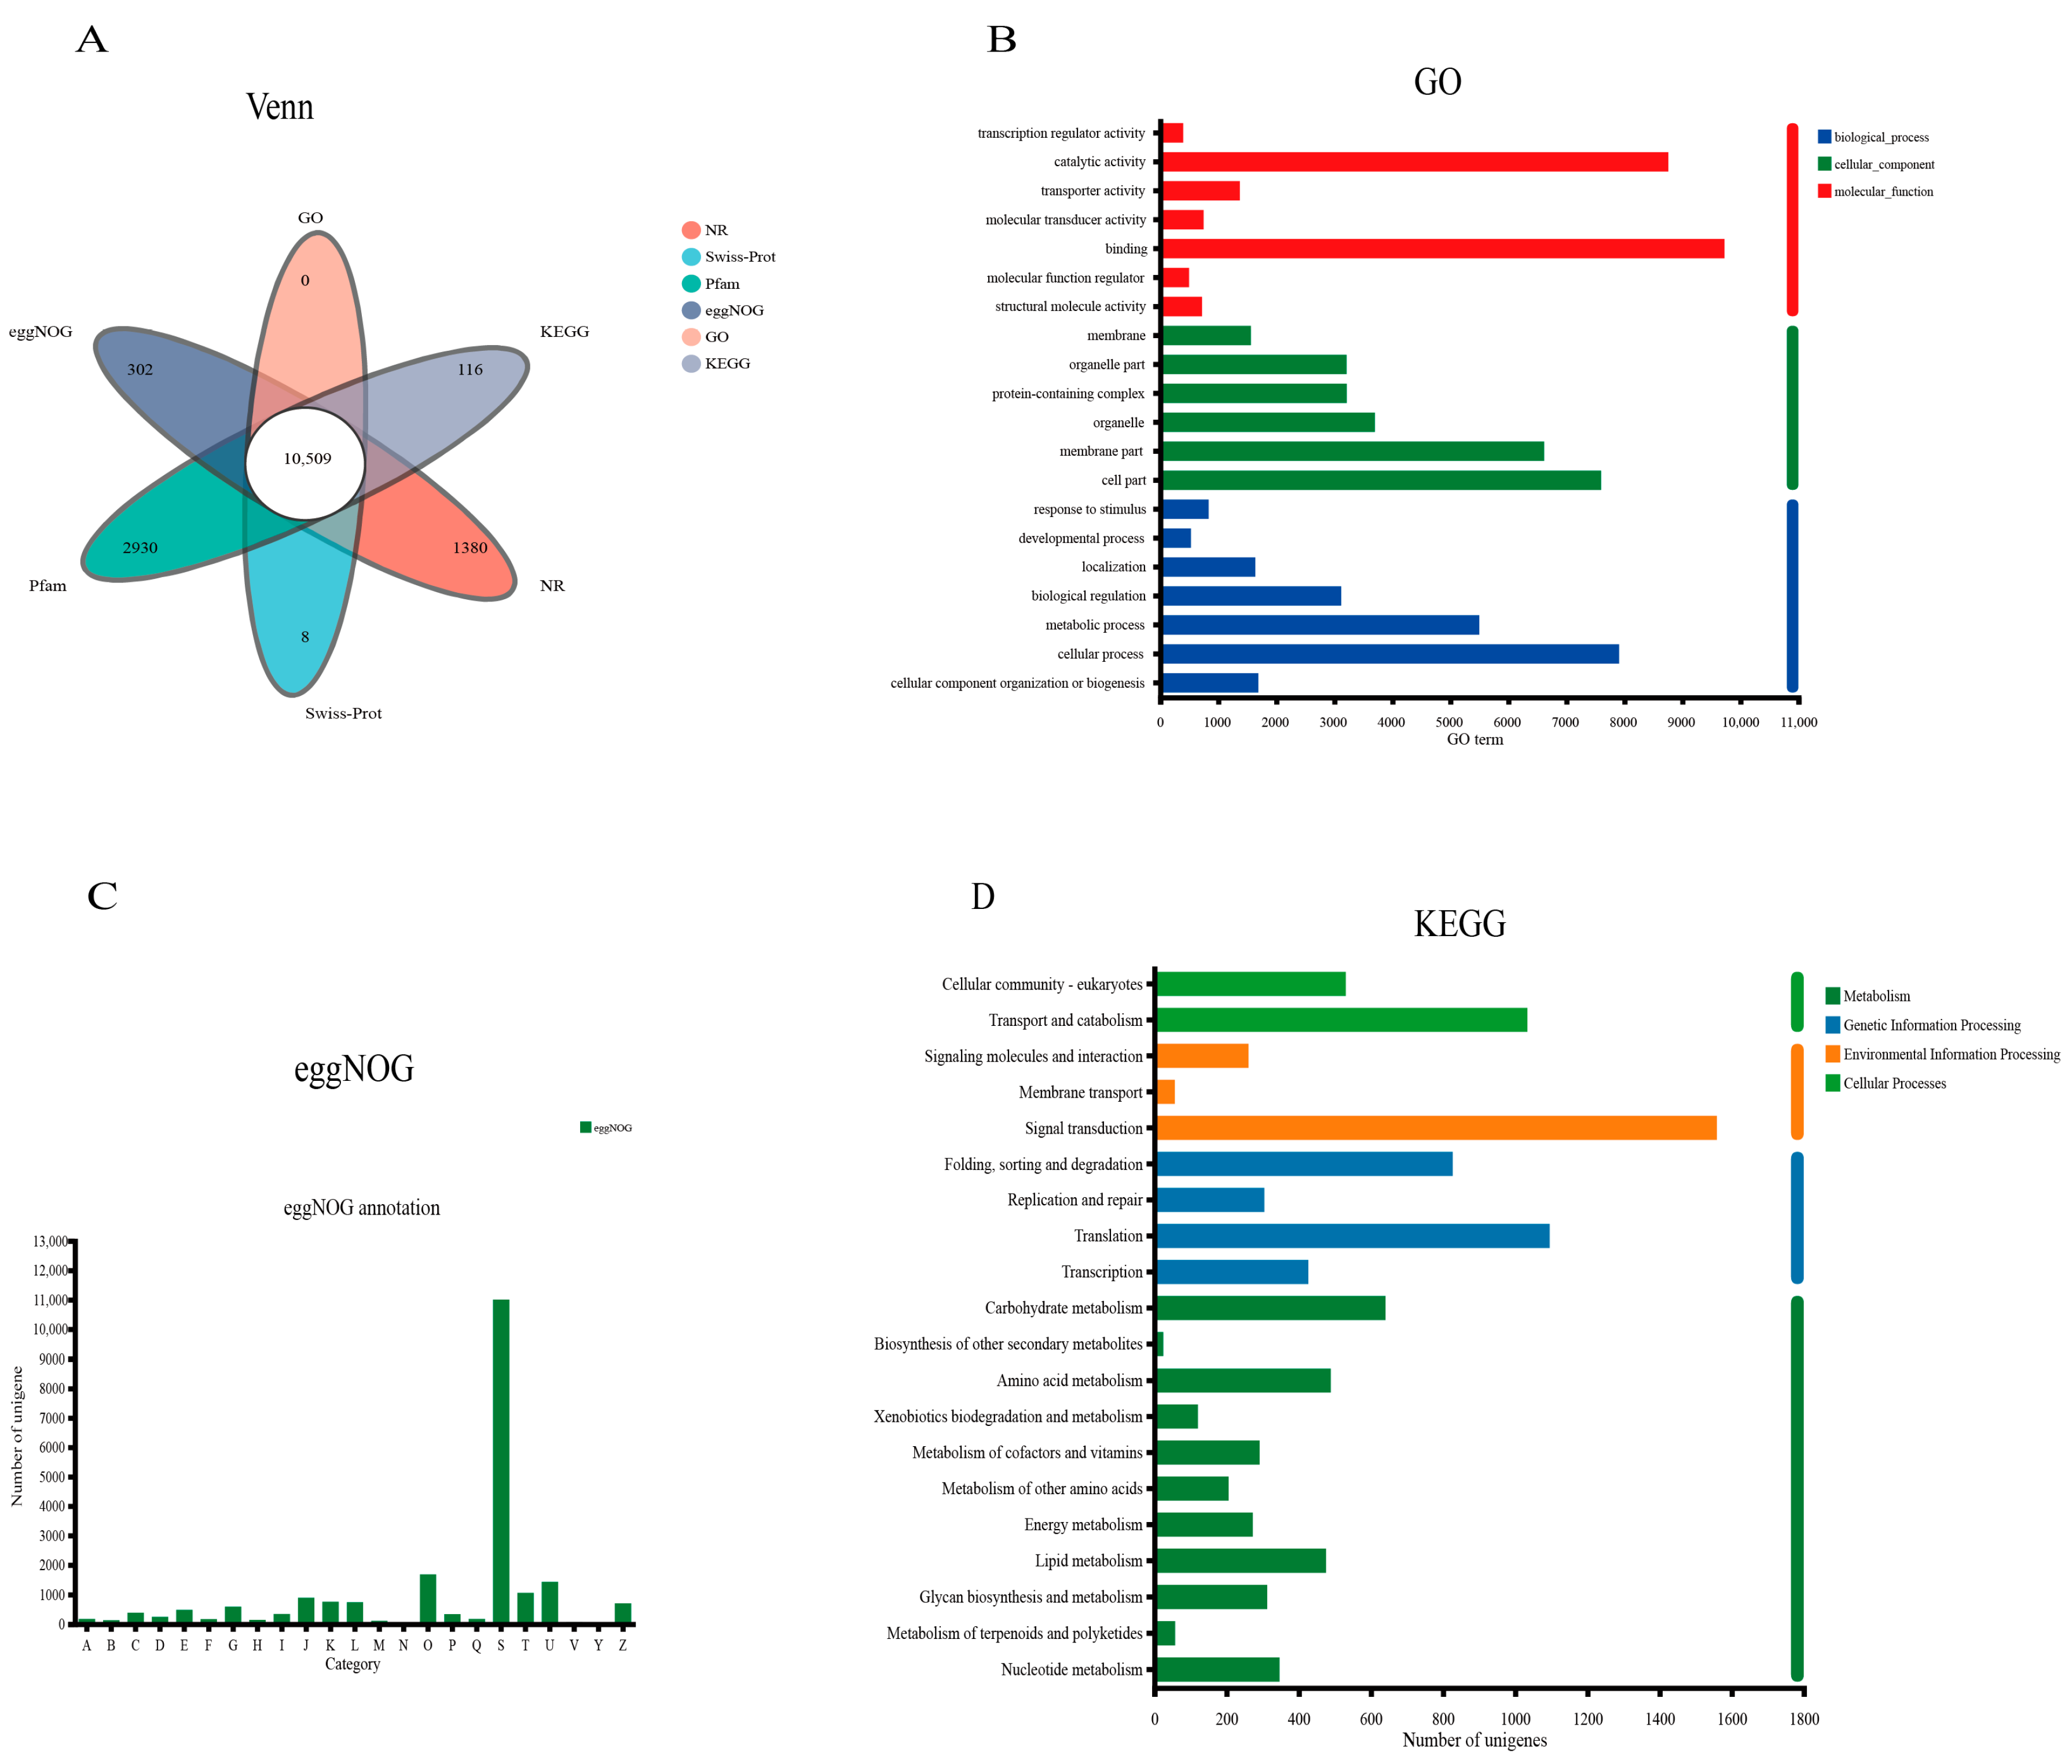
3.2. Overall Functional Annotation

In this study, 81,893 unigenes were annotated into six databases with an E-value of <10−5 to identify putative functions using Blastx. Among these, there were 18,402 (22.47%), 13,214 (16.14%), 20,078 (24.52%), 22,869 (27.93%), 17,238 (21.05%), and 22,239 (27.16%) unigenes were identified in the GO, KEGG, eggNOG, NR, Swiss-Prot, and Pfam databases, respectively (Figure 1B). A total of 10,509 unigenes were annotated into all six databases (Figure 2A).
GO function classification analysis identified 52 enriched GO terms; all the GO annotated unigenes (72,530 unigenes) were enriched in three major functional categories including molecular function (22,720 unigenes, 31.33%), biological process (22,433 unigenes, 30.93%), and cellular components (27,377 unigenes, 37.75%) (Figure 2B). The top three GO terms of these three major functional categories are as follows: Biological processes: cellular process (7910 unigenes), metabolic process (5501 unigenes), and biological regulation (3120 unigenes); Cellular components: cell part (7600 unigenes), membrane part (6618 unigenes), and organelle (3701 unigenes); Molecular function: binding (9726 unigenes), catalytic activity (8757 unigenes), and transporter activity (1372 unigenes). Based on the sequence homology, 10,446 unigenes were categorized into 23 functional categories in the eggNOG databases; the S group had the largest number of unigenes (10,996), followed by group O (1675 unigenes) and group U (1419 unigenes) (Figure 2C); all the information on the eggNOG functional categories is displayed in the Supplementary File Table S4. According to KEGG annotation analysis, 13,744 unigenes were highly enriched among 43 pathways, with the top three pathways including signal transduction (1559 unigenes), translation (1096 unigenes), and transport and catabolism (1034 unigenes) (Figure 2D).

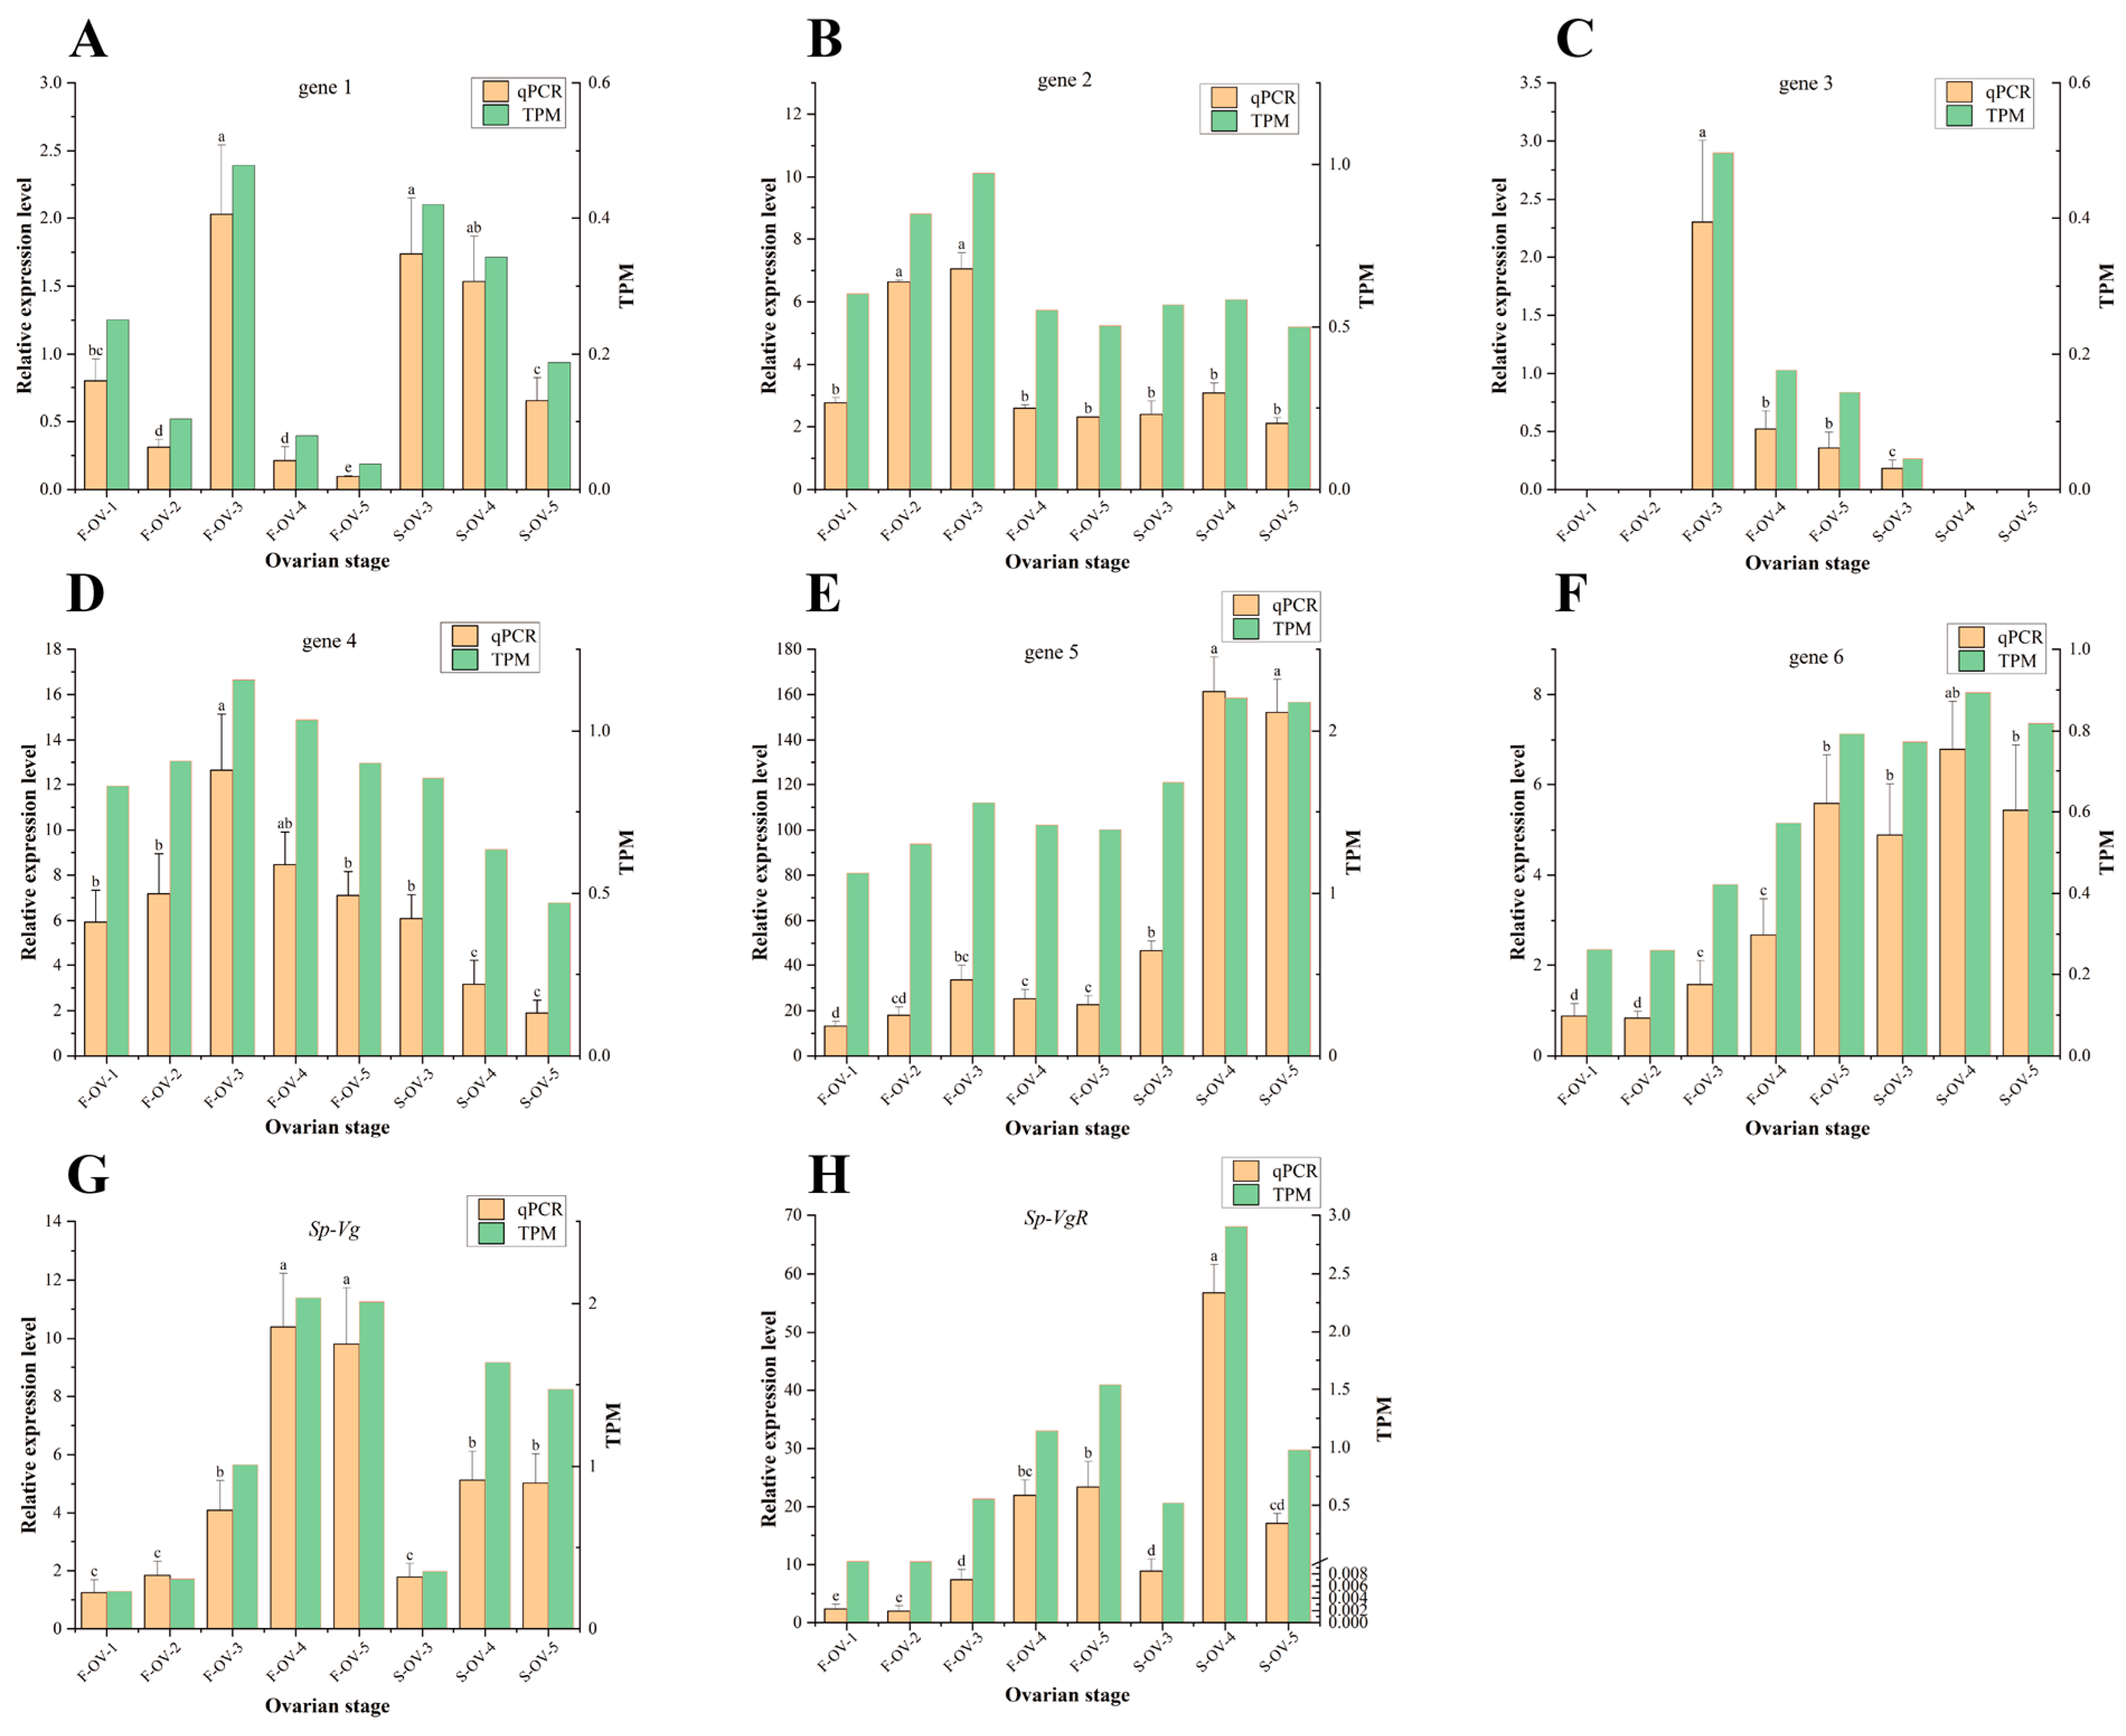
3.3. qRT-PCR Validation of Transcriptomic Sequencing Data

The results of the transcriptomic sequencing were validated using qRT-PCR. Relative expression levels of select DEGs were evaluated by qRT-PCR with the correction value of 0.646 (p < 0.01) and revealed that the changes in expression of these genes were consistent with the results of the transcriptomic sequencing (Figure 3), confirming that the transcriptomic sequencing data were reliable. In addition, the expression of Sp-Vg and Sp-VgR in the ovary during ovarian maturation was analyzed by qRT-PCR. The expression level of Sp-Vg and Sp-VgR had an increasing trend in the ovary during FOMP; The expression level of Sp-VgR was higher in FOMP than in SOMP except in S_OV_4 (stage IV in SOMP); Sp-VgR was significantly expressed in stage IV during SOMP.

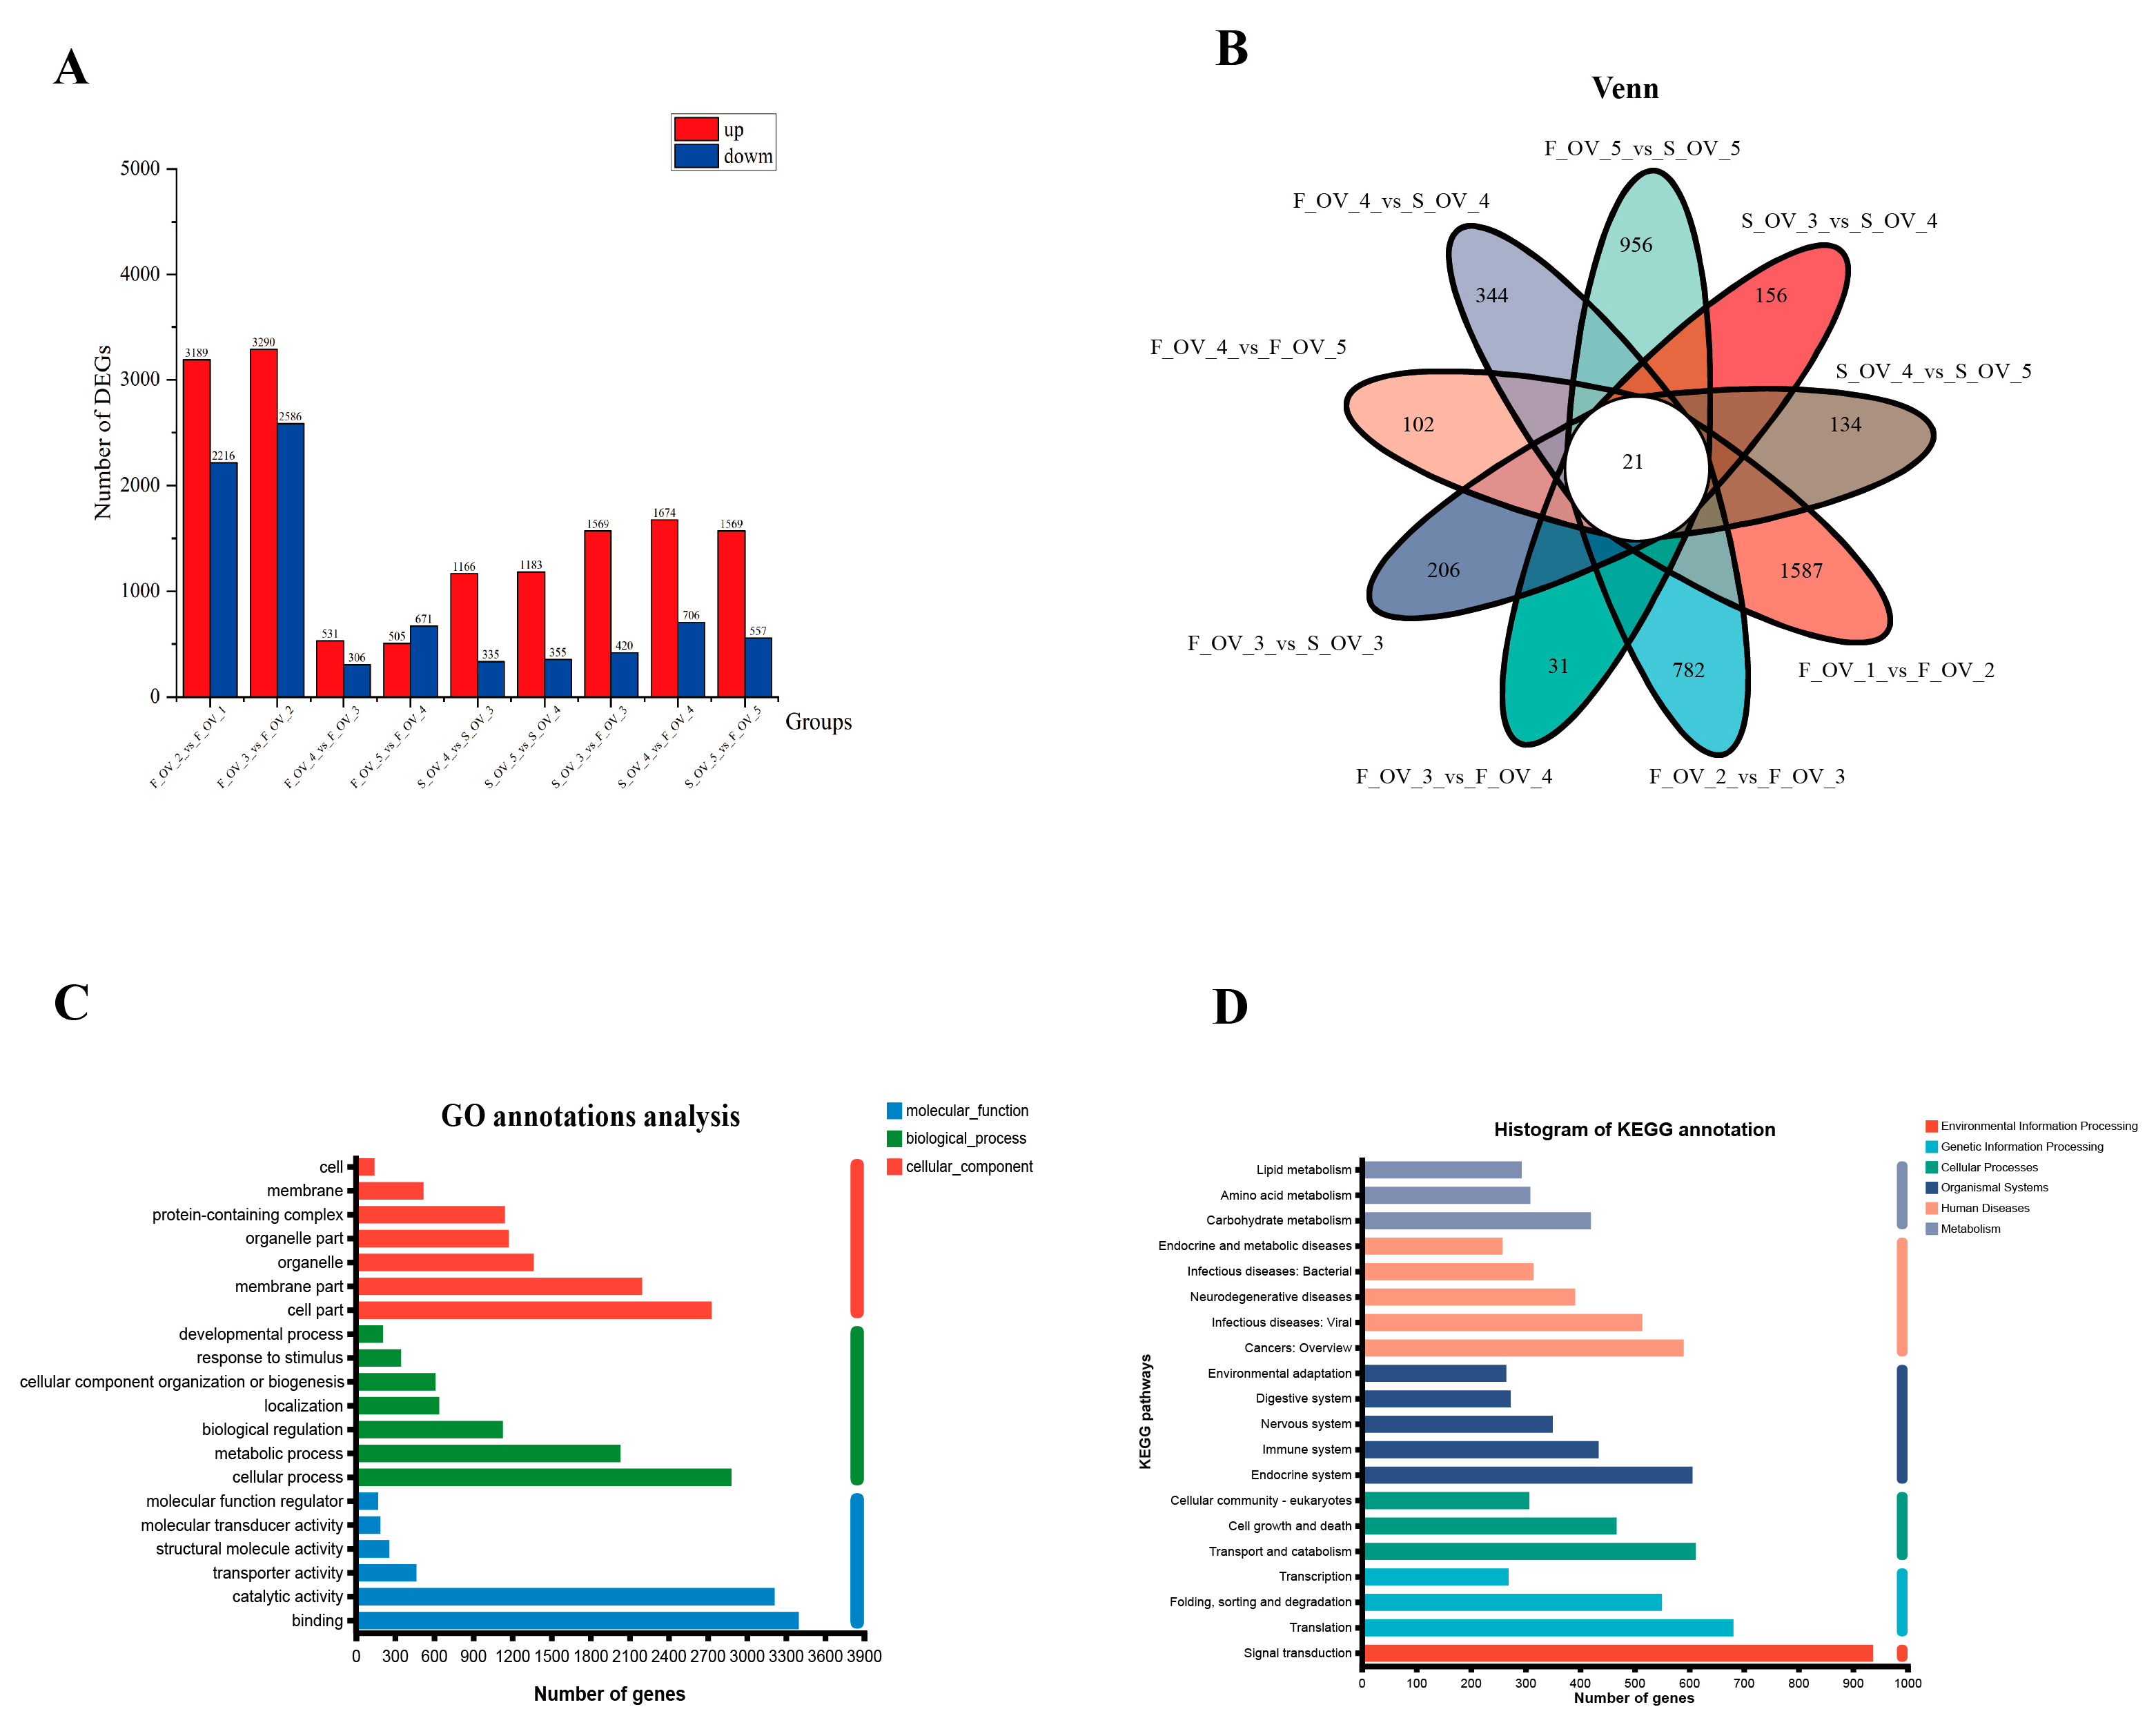
3.4. Identification and Function Analysis of DEGs

The DEGs were obtained from the pairwise comparison of different ovarian stages in mud crabs using parameters of |log2FC| ≥ 4.0 and p-adjust < 0.001. A total of 10,996 DEGs were acquired from the pairwise comparison of groups (F_OV_2_vs_F_OV_1(up-regulated: 3189; down-regulated: 2216), F_OV_3_vs_F_OV_2 (up-regulated: 3290; down-regulated 2586), F_OV_4_vs_F_OV_3 (up-regulated: 531; down-regulated: 306), F_OV_5_vs_F_OV_4 (up-regulated: 505; down-regulated: 671), S_OV_4_vs_S_OV_3 (up-regulated: 1166; down-regulated: 335), S_OV_5_vs_S_OV_4 (up-regulated: 1183; down-regulated: 355), S_OV_3_vs_F_OV_3 (up-regulated: 1569; down-regulated: 420), S_OV_4_vs_F_OV_4 (up-regulated: 1674; down-regulated: 706), and S_OV_5_vs_F_OV_5 (up-regulated: 1569; down-regulated: 557)) during the two ovarian maturation periods (Figure 4A,B).
All the DEGs from the nine comparison groups were annotated into GO and KEGG databases. The top 20 GO terms and KEGG pathways of the total DEGs are listed in Figure 4C,D, respectively. Subsequently, KEGG enrichment analysis were applied to identify DEGs with p-value less than 0.05.

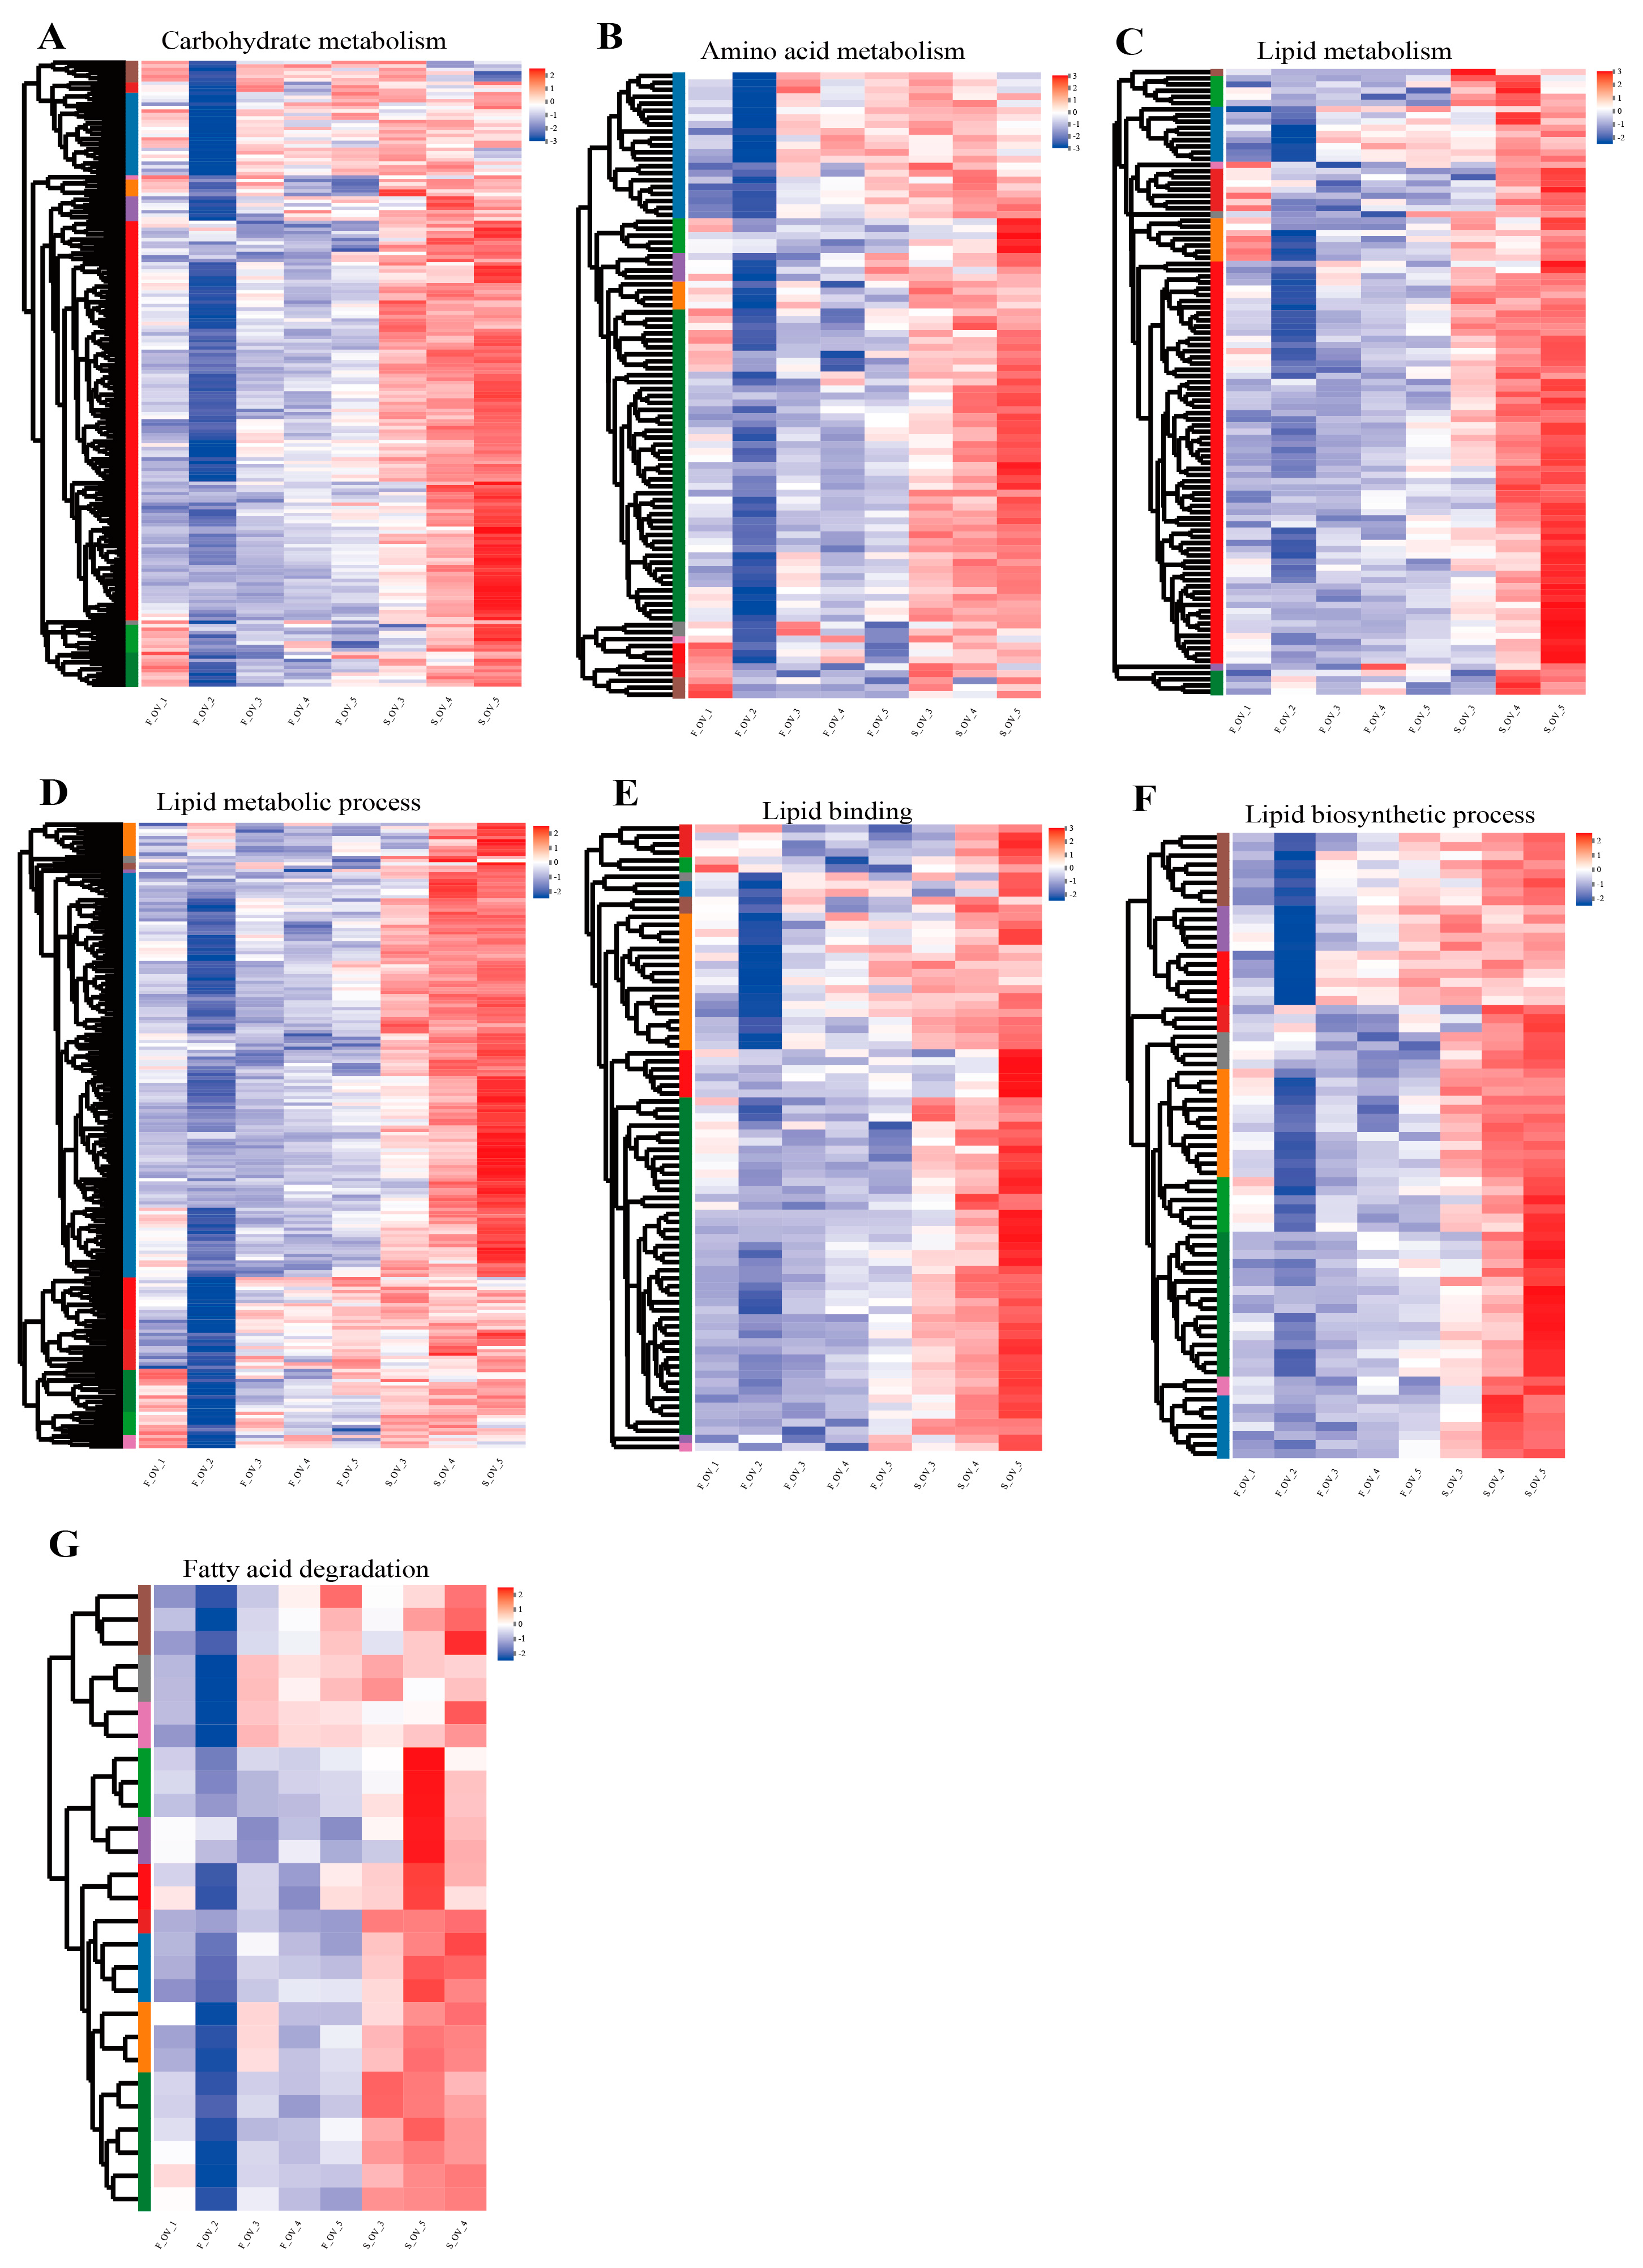
3.5. Expression Analysis of Genes Related to Lipid Metabolism

Carbohydrate metabolism, amino acid metabolism, and lipid metabolism were the three metabolic signaling pathways most enriched among the KEGG pathways (p < 0.05). The three most enriched GO terms related to lipid metabolism (lipid metabolic process, lipid binding, and lipid biosynthetic process) were also identified at p < 0.05. The enrichment results (Figure 5A–F) demonstrate that most of genes related to metabolism were up-regulated in the SOMP (ovarian III, IV, and V stages), while fewer were upregulated in the FOMP. A pathway associated with lipid metabolism was identified from lipid metabolism gene set: fatty acid degradation (map00062). The heatmap indicates that the overwhelming majority of genes associated with lipid metabolism (fatty acid β oxidation) were upregulated in the SOMP and exhibited lower expression in the FOMP (Figure 5G).

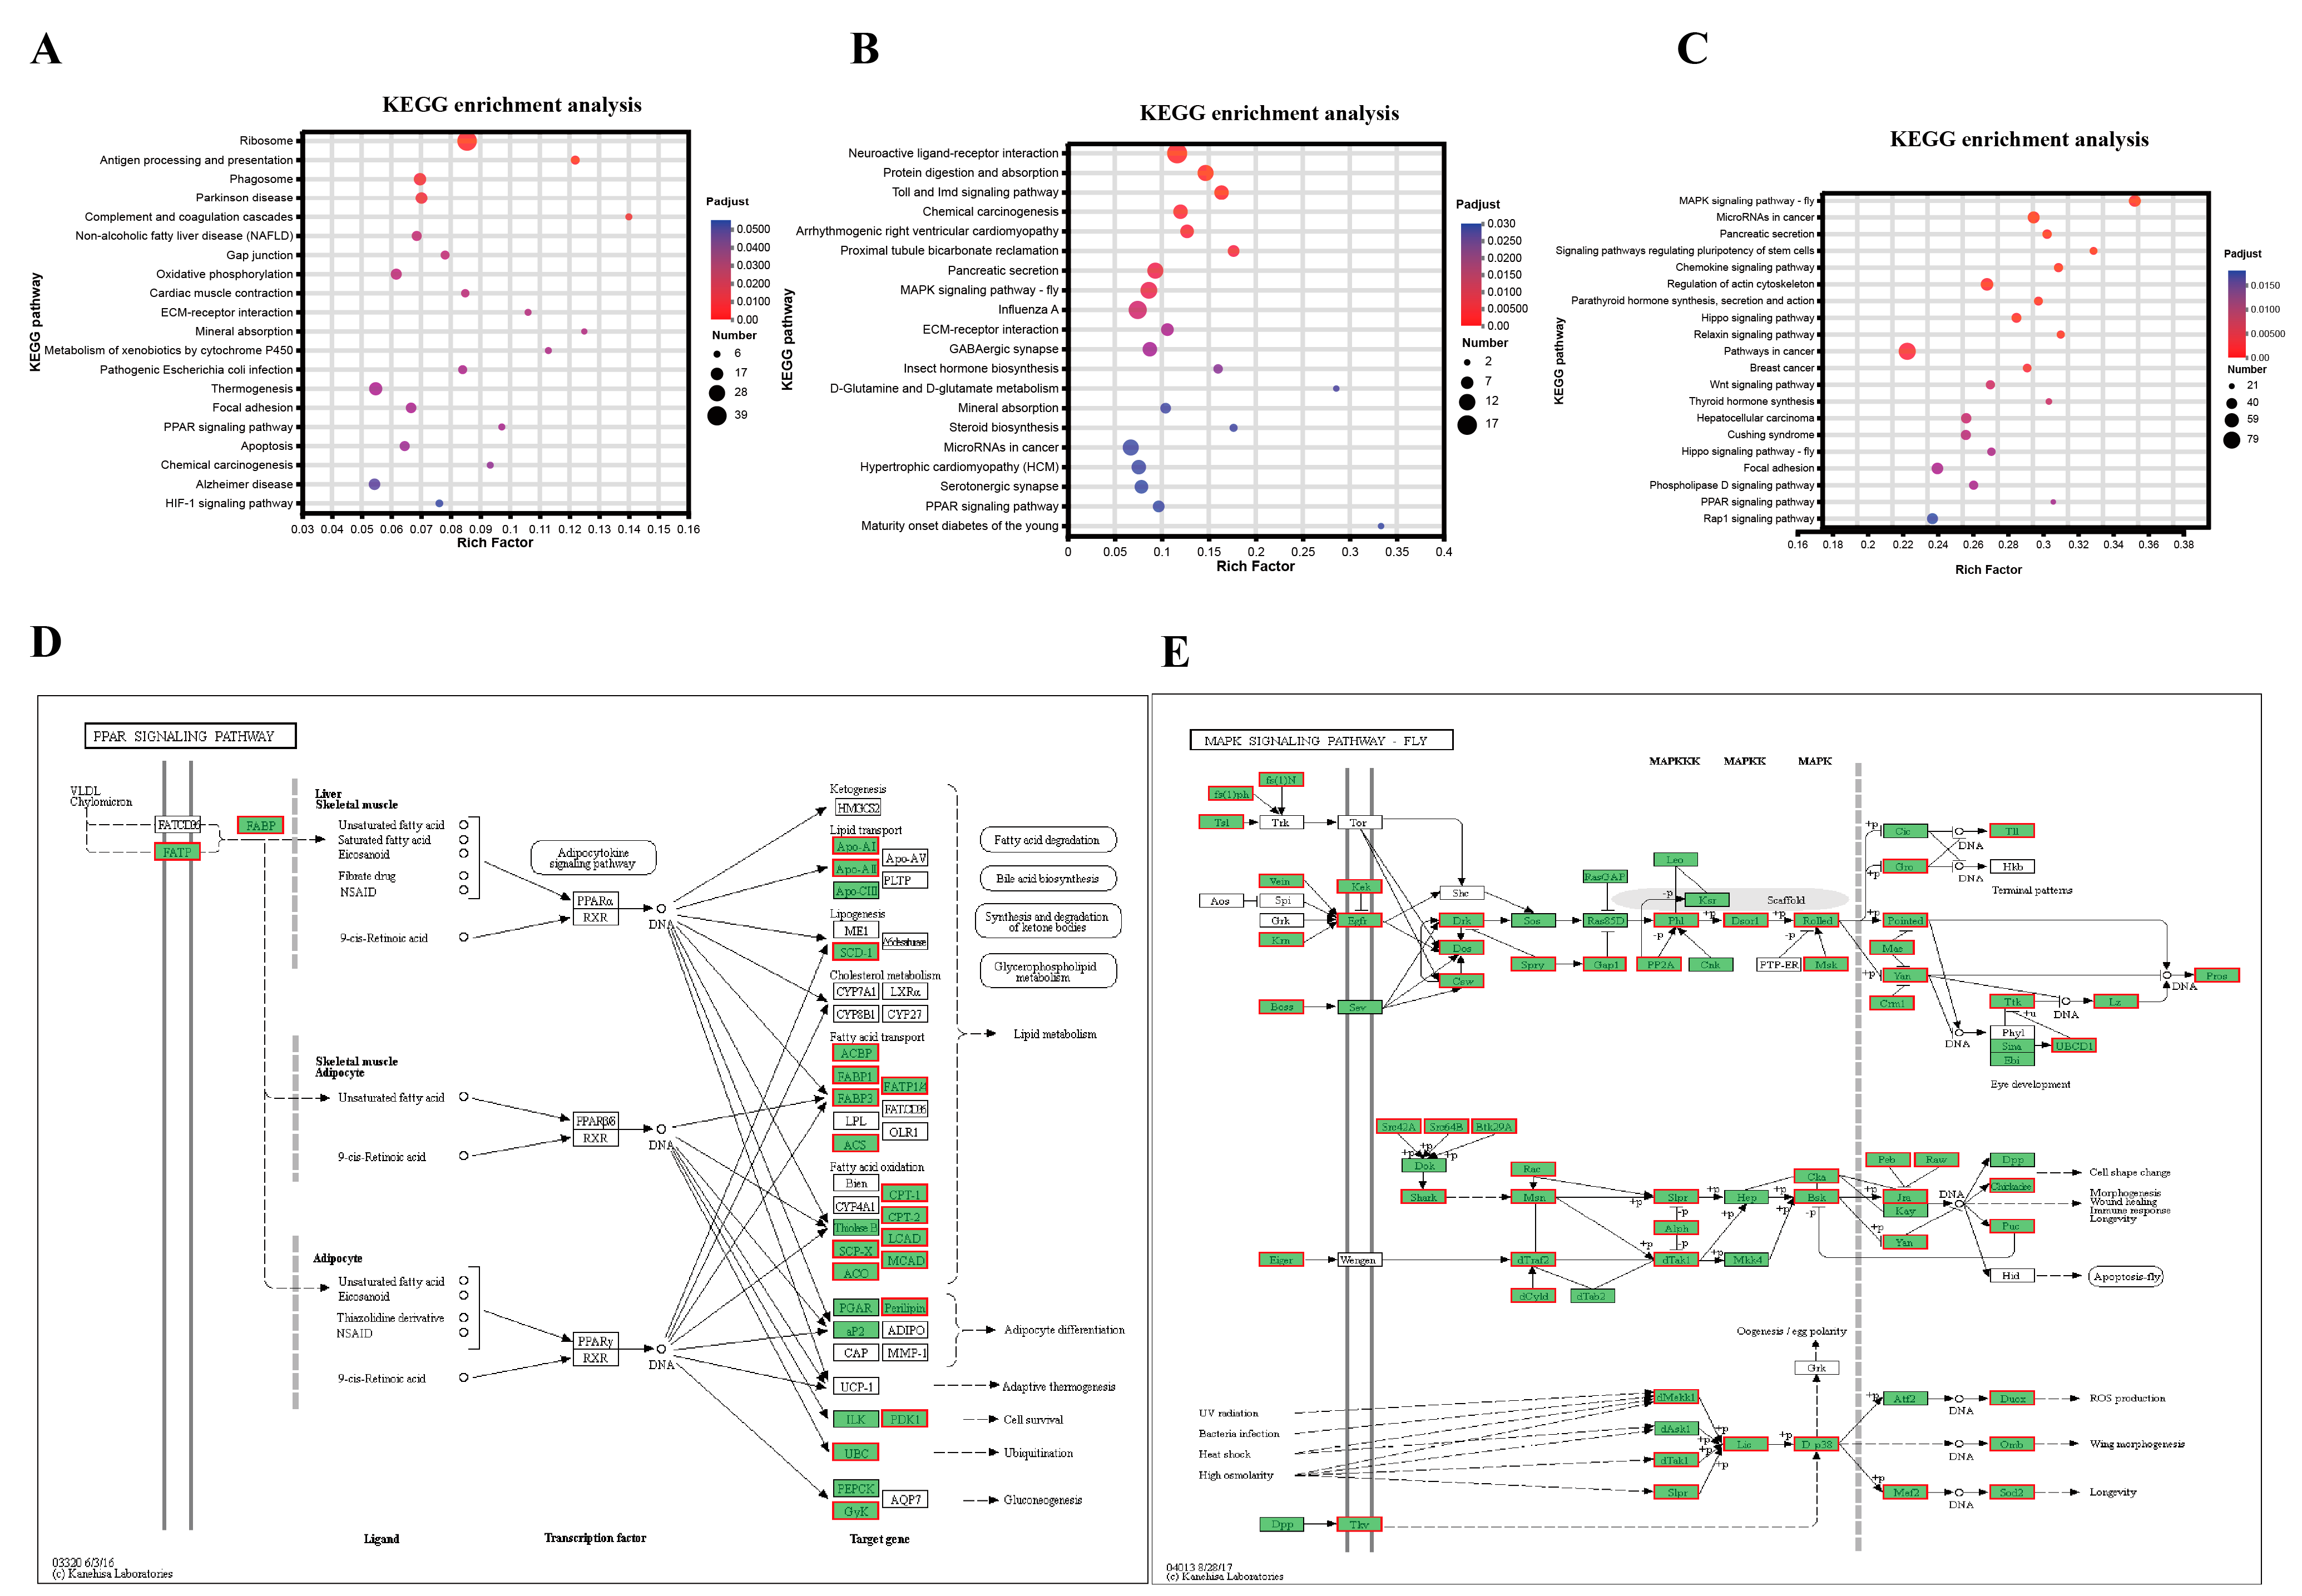
3.6. Identification of Candidate Signaling Pathways and Genes Related to Regulation of Lipid Metabolism

During vitellogenesis, nutrients, consisting mainly of lipids, accumulate rapidly in oocytes [28,29] for use as energy for embryonic development [30]. Therefore, to reveal the mechanism underlying ovarian lipid metabolism, DEGs from vitellogenesis periods (ovarian III, IV, and V stages of FOMP and SOMP) were analyzed and KEGG signaling pathway enrichment analysis was performed. The MAPK signaling pathway (map04013) was significantly enriched from the DEGs in SOMP group (S_OV_4_vs_S_OV_3; S_OV_5_vs_S_OV_4) during vitellogenesis (Figure 6A,E); however, it was not enriched from the DEGs of vitellogenesis stages in FOMP group (F_OV_4_vs_F_OV_3; F_OV_5_vs_F_OV_4) (Figure 6B). Notably, the MAPK signaling pathway also was the dominant pathway enriched from the total DEGs of the SOMP vs. FOMP group (S_OV_3_vs_F_OV_3, S_OV_4_vs_F_OV_4, and S_OV_5_vs_F_OV_5) (Figure 6C,E). In addition, the DEGs in the three groups include FOMP group, SOMP group, and SOMP vs. FOMP group during vitellogenesis were all enriched into PPAR signaling pathway (map03320) which includes many candidate genes related to lipid metabolism (Figure 6A–D).

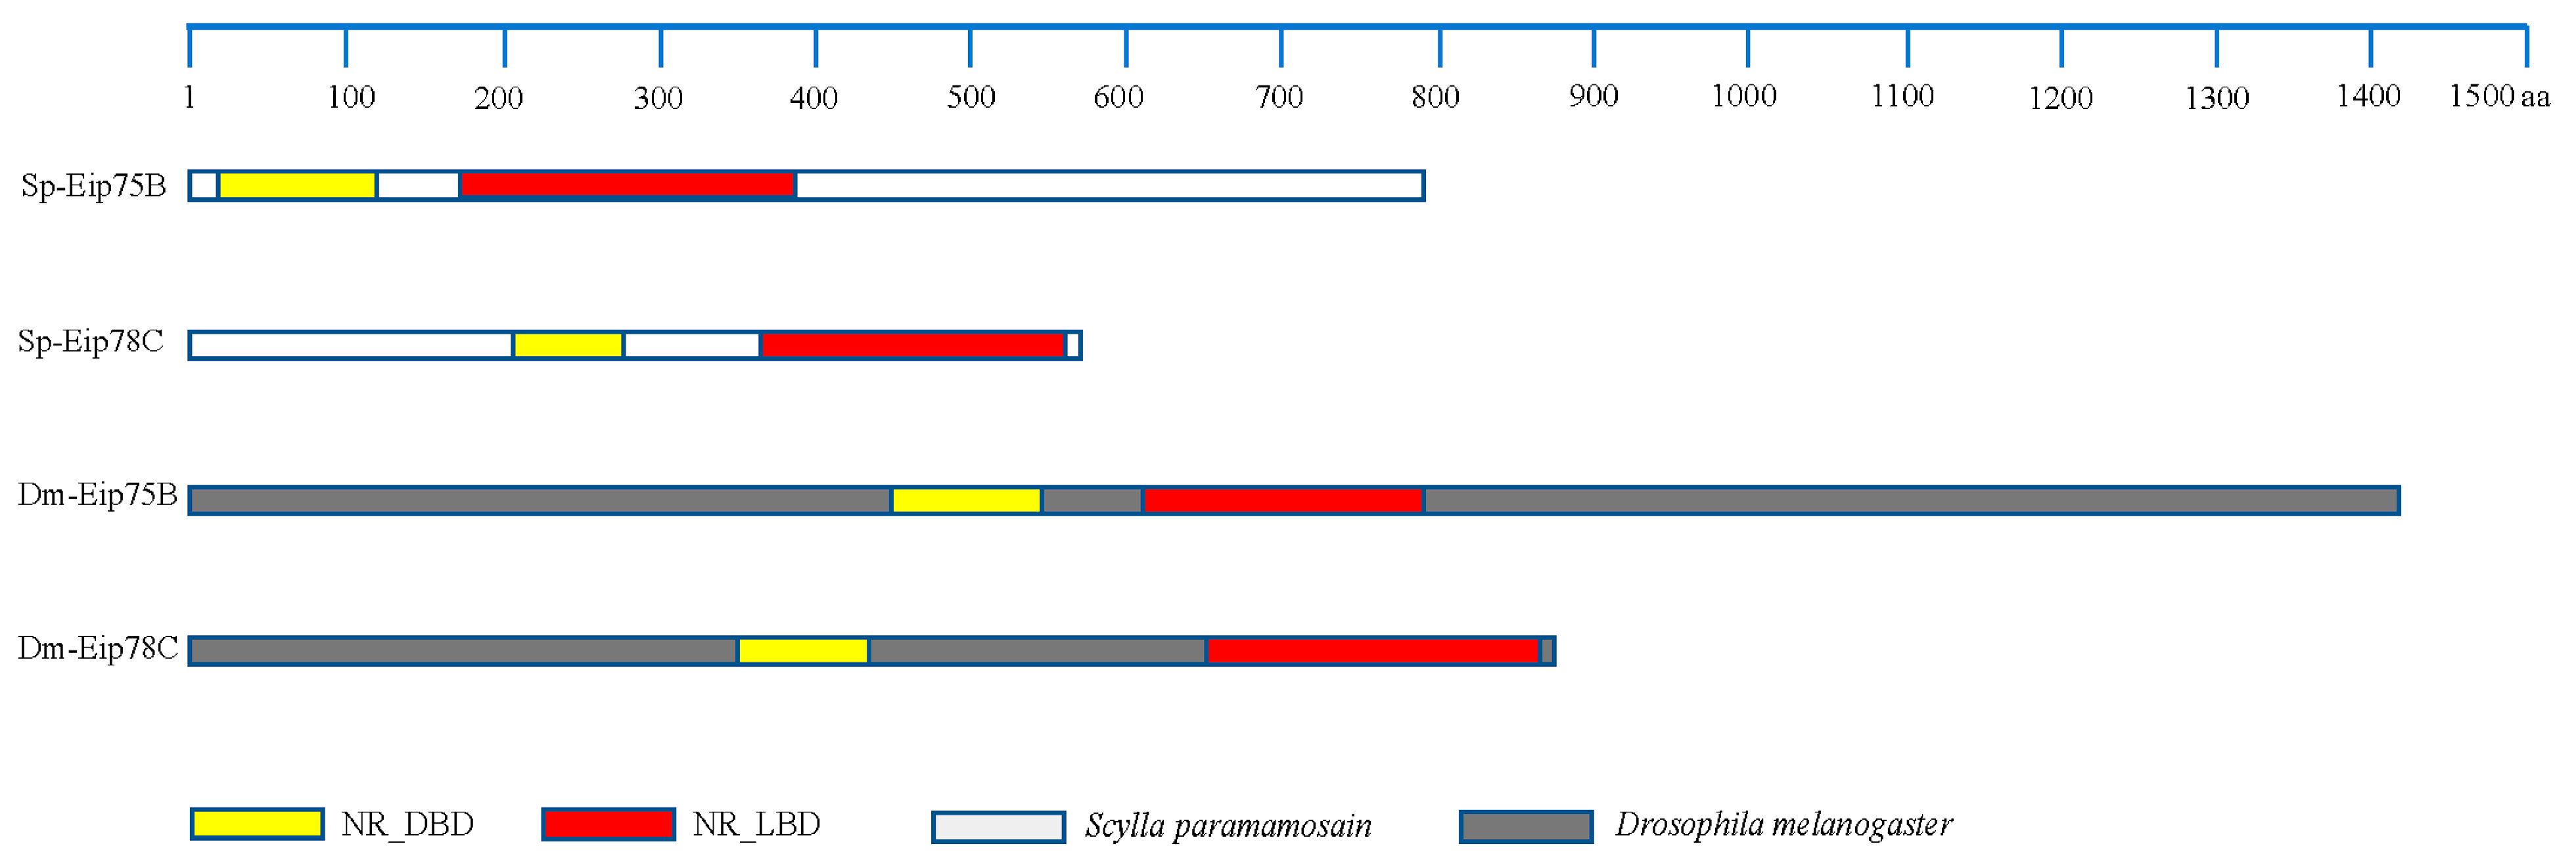
3.7. Identification of the Key Genes, Notably PPARγ-Homologous, Involved in Mediating Lipid Metabolism

The sequences of ecdysone-induced protein E75B (Eip75B) and ecdysone-induced protein E78C (Eip78C) in mud crabs, were acquired from the transcriptomic database, and homology analysis was conducted. The domain architectures of Eip75B and Eip78 in mud crabs share the same domains, including NR_LBD and NR_DBD, as those same proteins in Drosophila melanogaster (Figure 7). The sequences from Sp-Eip75B and Sp-Eip78C obtained in this study suggest that these proteins may have similar functions as the same proteins in Drosophila melanogaster.

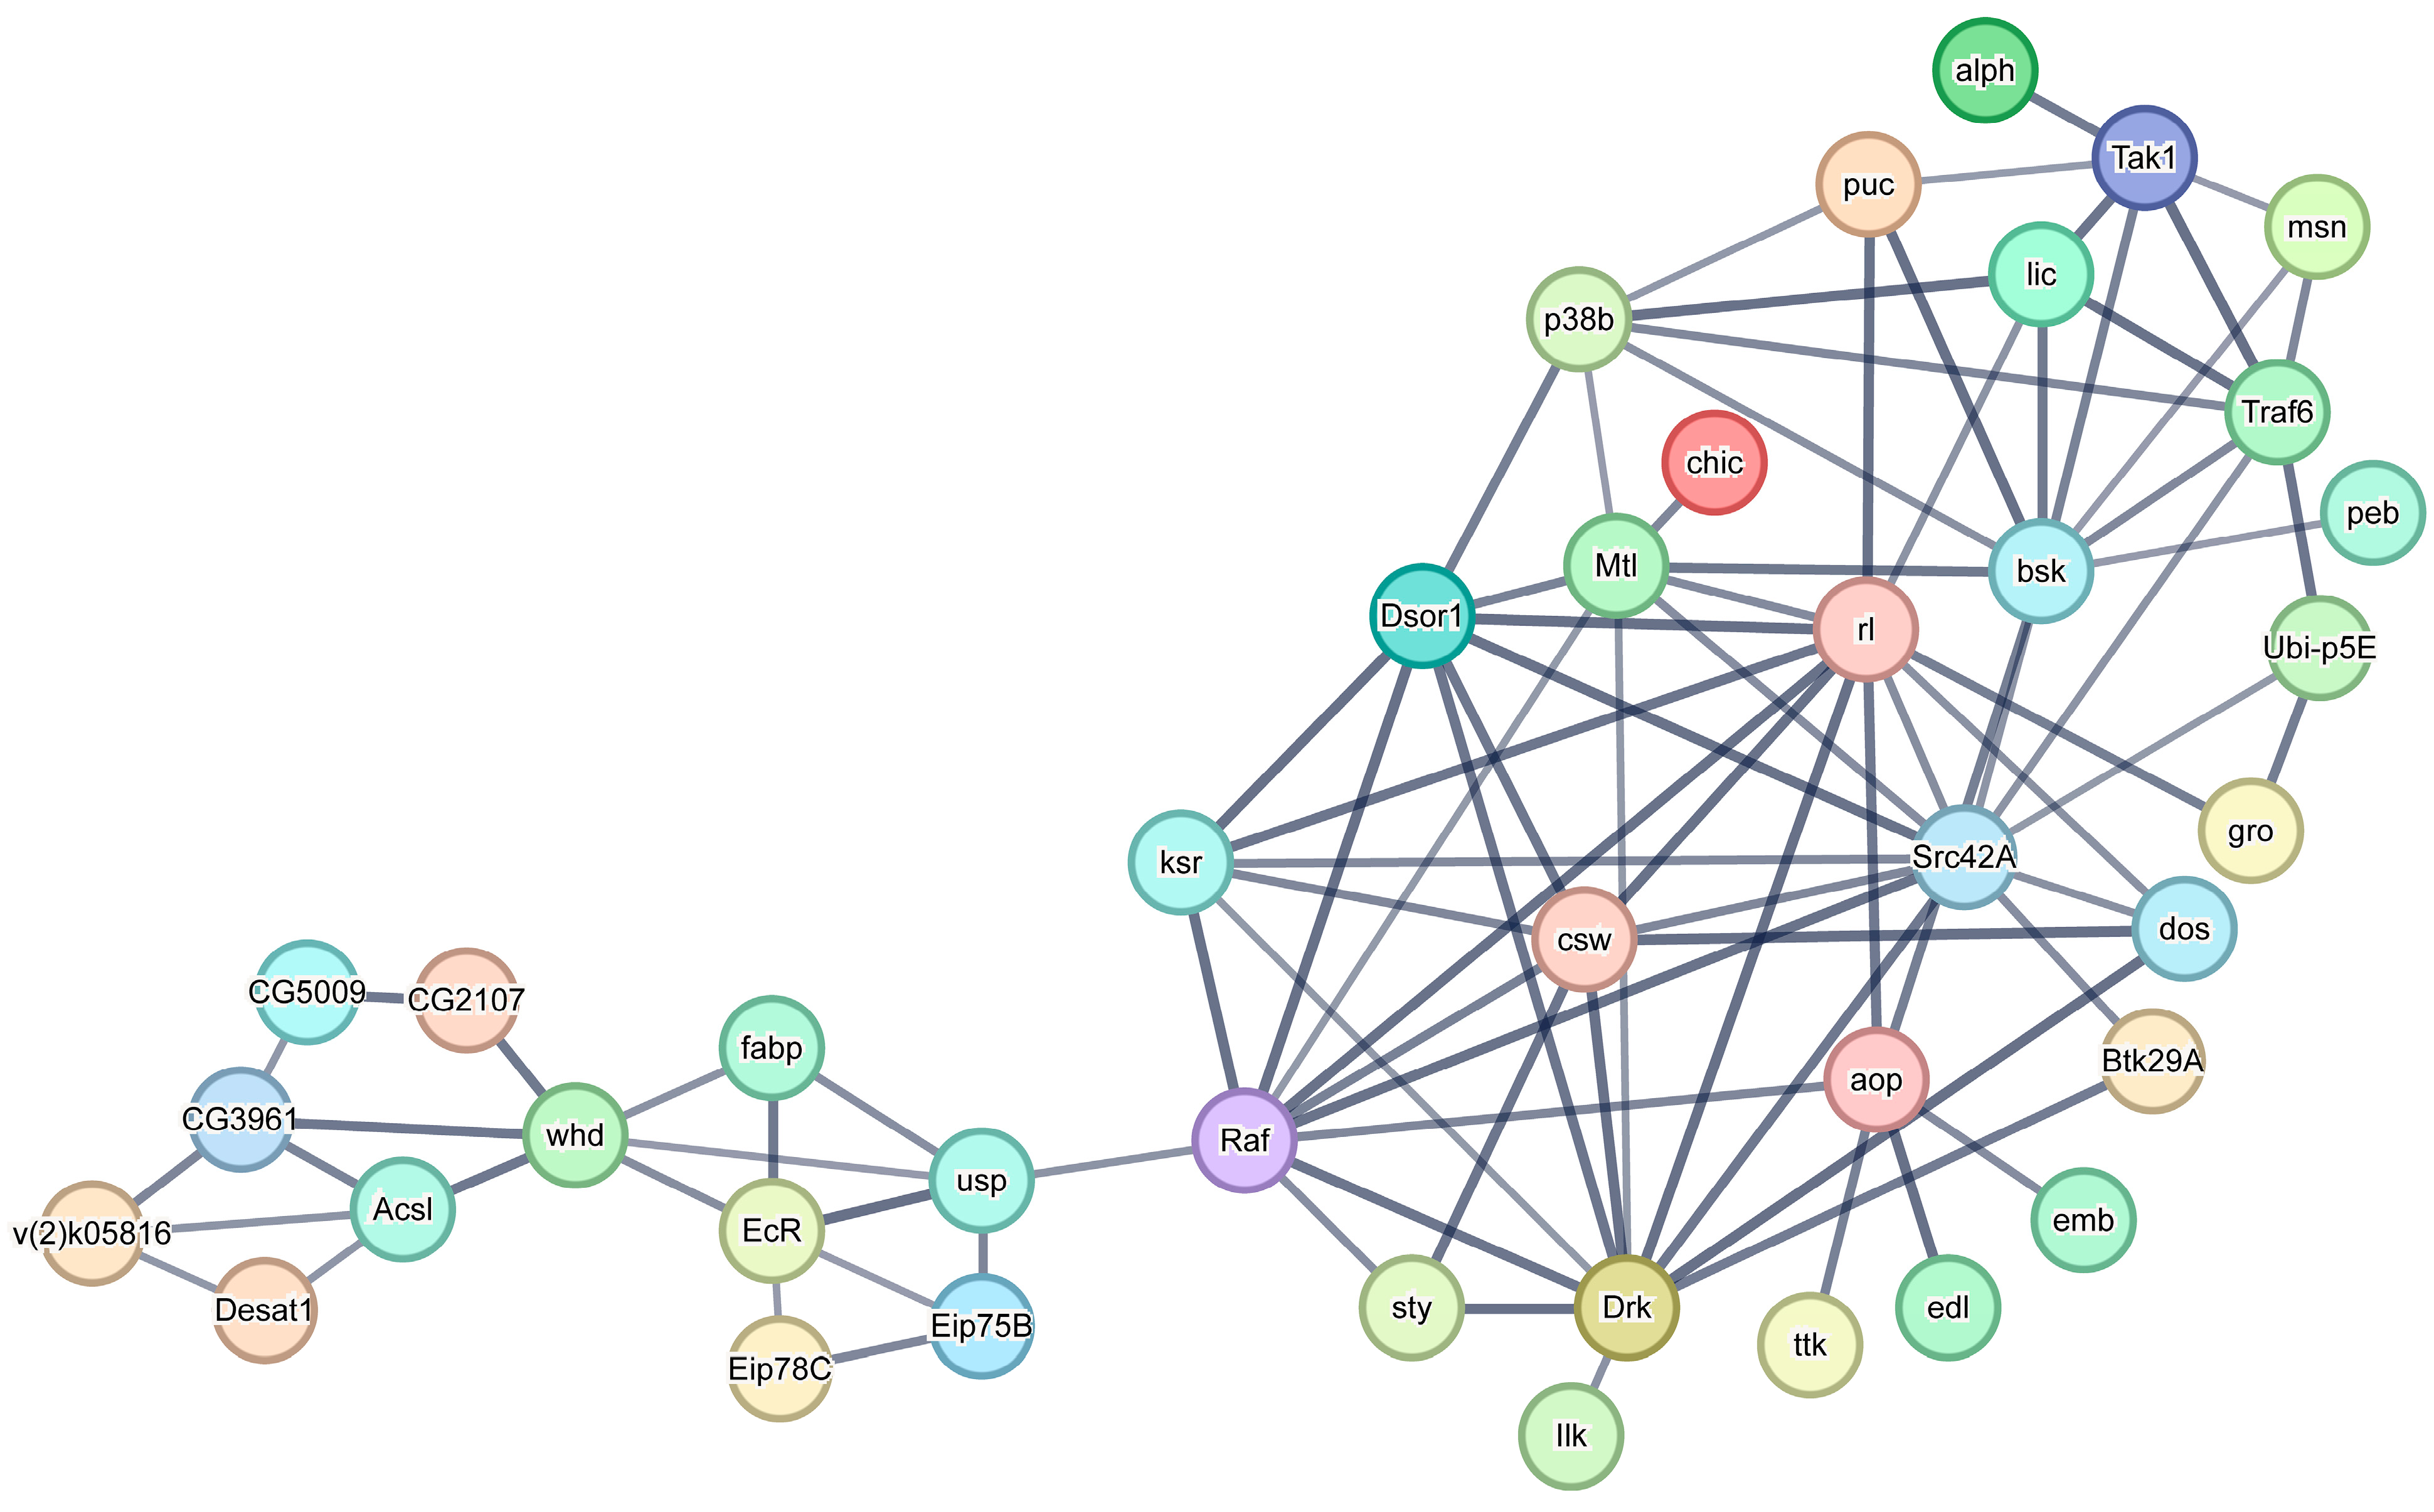
3.8. Construction of a Protein-Protein Interaction Network

A PPI network was constructed involving the MAPK signaling pathway and the PPAR signaling pathway in the mud crab ovary transcriptome (Figure 8). A total of 28 MAPK signaling-related unigenes and 12 PPAR signaling-related unigenes were identified. Two central genes, including Raf homolog serine/threonine-protein kinase (Raf) and Carnitine o-palmitoyltransferase 1 (CPT1) play different roles in this PPI network; Raf is the central unigene connecting the MAPK and PPAR signaling pathways, and CPT1 is the central gene of the PPAR signaling pathway that regulates lipid metabolism.

4. Discussion

This study aimed to identify functional genes and signaling pathways involved in mediating ovarian lipid metabolism in mud crabs through comparative transcriptomic analysis of the ovaries at different stages of ovarian development, including the first and second ovarian maturation periods. By examining the transcriptional regulation changes that occur during different stages of ovarian development, this study aimed to uncover the potential mechanisms for regulating lipid metabolism in the ovaries of this species.
All clean reads were subjected to quality control analysis, including assessments of base quality, mean error, and base content, which showed that the transcriptome sequencing data was reliable and met the necessary requirements for sequence assembly. These transcriptome sequencing assemblies and evaluations were similar to those of previous studies [26,27]. Through functional enrichment analysis, this study identified multiple pathways and categories related to ovarian maturation. The predicted GO terms and KEGG pathways helped to reveal the relationships between genes and the regulatory mechanisms of ovarian development in mud crabs. During the two ovarian maturation periods, group F_OV_4_vs_F_OV_3 had the fewest DEGs (8,37), followed by F_OV_5_vs_F_OV_4 (1176), S_OV_4_vs_S_OV_3 (1501), S_OV_5_vs_S_OV_4 (1538), S_OV_3_vs_F_OV_3 (1989), S_OV_4_vs_F_OV_4 (2308), S_OV_5_vs_F_OV_5 (2217), F_OV_3_vs_F_OV_2 (5876), and F_OV_2_vs_F_OV_1 (5405), which suggested that groups in the vitellogenesis period of the FOMP (F_OV_4_vs_F_OV_3 and F_OV_5_vs_F_OV_4) had fewer differences between each other than during other stages of SOMP (S_OV_4_vs_S_OV_3, S_OV_5_vs_S_OV_4, S_OV_3_vs_F_OV_3, S_OV_4_vs_F_OV_4, and S_OV_5_vs_F_OV_5); Many differences existed between FOMP and SOMP; Ovarian stage Ⅰ, Ⅱ, and Ⅲ were different, which was similar to the results of a previous study [27]. The results indicated that the DEGs identified in the F_OV_2_vs_F_OV_1 and F_OV_3_vs_F_OV_2 may play a crucial role in ovarian early development of mud crab; in addition, the molecular mechanism of ovary maturation during SOMP may differ from that during FOMP.
The analysis of DEGs during various ovarian stages in mud crabs showed that more DEGs associated with lipid metabolism were upregulated during SOMP and fewer were upregulated during FOMP (Figure 5). This suggests that the vitellogenesis period is the major stage for lipid metabolism and requires more lipids for the developing ovaries during ovarian maturation. Genes involved in lipid metabolism, including those involved in β-oxidation (lipid metabolic process, GO:0006629; fatty acid degradation, map00062), lipid absorption (lipid binding, GO:0008289), and lipid biosynthesis (lipid biosynthetic process, GO:0008610), were mainly upregulated during SOMP and less so during FOMP, indicating that the metabolic level is higher during SOMP than during FOMP. In addition, few genes related to fatty acid biosynthesis were slightly up regulated during vitellogenesis of SOMP, which suggested that small quantities of fatty acids might be synthesized in the ovary during SOMP to support the requirements of ovarian maturation in a short interval [12]. One potential reason for this may be the need for more energy substances obtained from metabolism to support the rapid development of the ovary during SOMP. As demonstrated by our previous study [12], during SOMP, the ovary is able to maintain the status of FOMP for a short time. However, the ovary must rapidly accumulate nutrients, particularly lipids, to meet the demands of maturation as the hepatopancreas gradually degenerates during SOMP. Therefore, in addition to relying on the hepatopancreas for its energy supply, the capacity of the ovary to uptake and synthesize lipids must be increased during SOMP.
In crustaceans, lipids including fatty acids, phospholipids, and sterols are critical nutrients that are essential for many reproduction-related processes, including ovarian development, egg formation, spawning, and embryogenesis [15,16]. These lipids accumulated in the ovary during the vitellogenesis period [13,14,31]. It is generally known that lipids are transported from the hepatopancreas to the ovary during ovarian development in crabs [14,23,24]. For example, a possible mechanism for lipid transport in mud crabs [25] may involve microsomal triglyceride transfer protein transport of triacylglycerol to apolipocrustacein, then surfeit locus protein 4 conveyed apolipocrustacein is absorbed by the vitellogenin receptor of oocytes, leading to a higher gonadosomatic index and lipid accumulation regulated by lipid metabolism-related genes. In this study, the high expression level of Sp-Vg in FOMP and Sp-VgR in SOMP (S_OV_4) indicated that the capacity of nutritional synthesis in the ovary during FOMP was higher than that during SOMP; In S_OV_4, the capacity of nutritional absorption in the ovary was higher than other stages during ovarian maturation. These results may be supported by previous studies [6,12], mud crabs could re-mature occurring from Stage III to Stage V during SOMP due to oocyte physiological maturation completed before vitellogenesis during FOMP; The nutrients mainly include lipids required for ovarian maturation need to be rapidly accumulated in the ovary to complete ovarian maturation in a shorter time during SOMP. Therefore, Sp-VgR was significantly expressed during ovarian maturation, especially in S_OV_4, a large number of lipids could be absorbed in the ovary through VgRs during SOMP. However, there is a paucity of information on the signaling pathways that mediate lipid accumulation and lipid metabolism in the ovary during the vitellogenesis period. We have previously reported that [12] lipids are rapidly increased during vitellogenesis, indicating that numerous DEGs related to lipid metabolism could be upregulated, and suggesting that genes mediating lipid metabolism may be differentially expressed in the ovary during these periods.
The present study identified the MAPK signaling pathway (map04013) as a candidate pathway that may play an important role during the vitellogenesis period. MAPK signaling pathways are crucial transmitters of transduction signals from cell surface receptors to nuclear internal targets, are significant pathways involved in eukaryotic signal transmission networks [32], and are involved in the regulation of cell growth, differentiation, proliferation, migration, meiosis, fertilization, and metabolism [33,34,35]. Moreover, in crustaceans, the MAPK signaling pathway plays a crucial part in the testis development of E. sinensis [36] and ovarian development of mud crab [37] by participating in cell differentiation and meiosis [38], which might cause the mature cycle in SOMP was shorter than in FOMP [12] due to MAPK signaling pathway was significantly enriched from the DEGs of SOMP vs. FOMP group (Figure 6C). It indicates that MPAK signaling pathway might promote ovarian maturation in mud crabs. Additionally, the MAPK signaling pathway is involved in regulating lipid metabolism in many species, including mammals [39,40], fish [41,42], nematoda [43], and insects [44]. The MAPK signaling pathway regulates lipid metabolism in part through the peroxisome proliferator-activated receptors (PPAR) signaling pathway [45,46].
PPARs are transcription factors of the class of nuclear receptors that modulate target gene expression in response to endogenous and exogenous ligands [47,48,49,50]. The PPAR family consists of three members, PPARα, PPARβ/δ, and PPARγ, whose major physiological functions are involved in the regulation of lipid metabolism [51]. PPARs are nuclear in location, where they remain heterodimerized with 9-cis retinoic acid (RXR) [52,53] and bind to upstream cis-acting regulatory regions, so-called ‘peroxisome proliferator response elements’, (PPRE) of target genes [54,55] to drive transcription and mediate lipid metabolism in mammals [56,57]. However, the PPAR signaling pathway identified in this study only include some genes related to lipid metabolism, not the key genes PPARs and RXR. It indicated that the key genes, PPARs and RXR, in the PPAR signaling pathway in crustacean may be different from other species [58]. For example, in Drosophila, ecdysone-induced protein E75B (Eip75B) or ecdysone-induced protein E78C (Eip78C) are orthologs of mammalian PPARγ [58,59,60,61]. Furthermore, like mammals, ultraspiracle (USP), a Drosophila homolog of RXR, forms heterodimers with various family members, including ecdysone receptors (EcR) [62]. Interestingly, RXR is also able to successfully heterodimerize with EcR for DNA binding and transcriptional activation [63], and USP is involved in the response to nutrients and metabolites [64]. In crustaceans, EcR belongs to the superfamily of nuclear receptors and can form a heterodimer complex with RXR, which is an ortholog of USP in insects [65,66]. Moreover, the heterodimer complex of EcR-RXR in crustaceans has similar functions to that of EcR-USP in insects [67,68], for example, RXR can form a complex with EcR and ecdysone to activate the transcription of hormone response genes responsible for vitellogenesis, such as Eip75, Eip74, HR3, and Br-C [69]. Therefore, we speculate that Eip75B or Eip78C form heterodimer complexes with EcR-RXR in crustaceans; these complexes may have similar functions in regulating lipid metabolism as those in Drosophila, akin to the PPAR signaling pathway of vertebrate.
This study performed PPI network between the MAPK signaling pathway and the PPAR signaling pathway regulating lipid metabolism. We found that the Raf homolog serine/threonine-protein kinase (Raf) is the central gene connecting the MAPK and PPAR signaling pathway. The Ras/Raf/MEK/ERK cascade is one of the essential components of the ERK pathway [70,71], and previous studies have reported that Raf has multiple biological functions through the MAPK signaling pathway, including activating transcription factors involved in cell proliferation [72,73], regulating oocyte maturation [74], mediating lipid metabolism [75], and monitoring adipogenesis through PPARγ [76]. Accordingly, we speculated that the MAPK signaling pathway could regulate lipid metabolism through Raf, which mediates PPAR signaling pathway, subsequently regulating the expression of genes related to lipid metabolism (lipid degradation, lipid absorption, and lipid biosynthesis). Notably, genes related lipid biosynthesis, absorption, and degradation were found to be upregulated in SOMP, indicating more energy is required for ovarian maturation during a short time interval. In addition, all three members of the PPAR subfamily (PPARα, PPARβ/δ, and PPARγ) function as sensors for fatty acids and fatty acid derivatives and control metabolic pathways involved in energy homeostasis [52,53,77]. For example, PPARα is expressed in tissues with high fatty oxidation activities, including liver, kidney, small intestine, heart, and skeletal muscle, consistent with its predominant functional role in regulating lipid catabolism [52,78]. Activation of PPARβ/δ also induces expression of genes required for fatty acid oxidation and energy dissipation in skeletal muscle and adipose tissue, which in turn leads to improved lipid profiles and reduced adiposity [52,79]. PPARγ is expressed at relatively high levels in adipose tissue, serves as a vital regulator for adipocyte differentiation, and promotes lipid/energy storage in mature adipocytes by increasing the expression level of several key genes in the PPAR pathway [52,80]. Consequently, in crustaceans, various PPAR-homologous (including multiple isoforms of Eip75 and Eip78 or other nuclear receptors) may have functions similar to the PPARs in mammals (PPARα, PPARβ/δ, and PPARγ). This might be an important reason for the upregulation of genes related to lipid metabolism (including lipid biosynthesis, absorption, and degradation). This study also identified an additional KEGG signaling pathway associated with lipid metabolism, the canonical Wnt/β-catenin pathway (Wnt signaling pathway). Wnt signaling pathways may regulate lipid metabolism through PPAR signaling pathway, as previously suggested [81,82,83]. As a consequence, in mud crabs, this study proposes a hypothesis that MAPK could regulate lipid metabolism through PPAR during the vitellogenesis period. In addition, the Wnt signaling pathway might also have similar functions to the MAPK pathway in regulating lipid metabolism via other unknown mechanisms ways (Figure 9), which need be additional evaluations.

5. Conclusions

This study identified two genes (Sp-Eip75B and Sp-Eip78C) and the signaling pathway (MAPK signaling pathway: map04013) that may play crucial roles in ovarian development in mud crabs. As in Drosophila melanogaster, Sp-Eip75B and Sp-Eip78C are homologous to the vertebrate gene PPARγ in PPAR signaling pathway. The MAPK signaling pathway may regulate ovarian lipid metabolism through the central gene Raf, which mediates the PPAR signaling pathway during the vitellogenesis period. This study provides new insights into the mechanism of ovarian lipid metabolism regulation in mud crabs.

Supplementary Materials

The following supporting information can be downloaded at: https://www.mdpi.com/article/10.3390/fishes8030145/s1, Table S1: Special primers used in qRT-PCR; Table S2: Raw data statistics table; Table S3: Clean data statistics; Table S4: Information of eggNOG functional categories; Table S5: Information of functional proteins in PPI network.

Author Contributions

Conceptualization, L.M. Writing—original draft, Y.R. Writing—review & editing, K.J., W.W., Z.L., Y.F., M.Z., W.C. and L.X. Data curation, Y.R. and L.X. Methodology, M.L., L.X., T.Z. and T.H. Supervision, C.M. and F.Z. All authors have read and agreed to the published version of the manuscript.

Funding

This study was funded by the Special Scientific Research Funds for Central Non-profit Institutes, Chinese Academy of Fishery Sciences (2021Z03, 2020TD20), Special Program on Agricultural Aspect of Science and Technology Commission of Ningbo (2019B10010), the National Infrastructure of Fishery Germplasm Resources.

Institutional Review Board Statement

The mud crab S. paramamosain is not an endangered or protected species, and permission to perform experiments involving this species is not required in China.

Informed Consent Statement

Not applicable.

Data Availability Statement

All data generated or analyzed during this study are included in the published article and its Supplementary Files. The transcriptomic raw data in this study have been deposited to the NCBI SRA database with the BioProject accession number: PRJNA915646.

Acknowledgments

We gratefully acknowledge the help of our colleagues in the MaLab of East China Sea Fisheries Research Institute, Chinese Academy of Fishery Science. We would like to thank all the reviewers for their valuable comments and advice.

Conflicts of Interest

The authors declare no conflict of interest.

References

  1. Le Vay, L. Ecology and Management of Mud Crab Scylla spp. Asian Fish. Sci. 2001, 14, 101–112. [Google Scholar] [CrossRef]
  2. Islam, M.S.; Kodama, K.; Kurokora, H. Ovarian Development of the Mud Crab Scylla paramamosain in a Tropical Mangrove Swamps, Thailand. J. Sci. Res. 2010, 2, 380–389. [Google Scholar] [CrossRef] [Green Version]
  3. Shi, X.; Lu, J.; Wu, Q.; Waiho, K.; Aweya, J.J.; Fazhan, H.; Zhang, Y.; Li, S.; Zheng, H.; Lin, F.; et al. Comparative analysis of growth performance between female and male mud crab Scylla paramamosain crablets: Evidences from a four-month successive growth experiment. Aquaculture 2019, 505, 351–362. [Google Scholar] [CrossRef]
  4. Wan, H.; Zhong, J.; Zhang, Z.; Zou, P.; Wang, Y. Comparative Transcriptome Reveals the Potential Modulation Mechanisms of Spfoxl-2 Affecting Ovarian Development of Scylla paramamosain. Mar. Biotechnol. 2022, 24, 125–135. [Google Scholar] [CrossRef]
  5. Angell, C. Summary of the proceedings of the seminar on mud crab culture and trade. In Seminar on Mud Crab Culture and Trade, Bay of Bengal Program; Angell, C.A., Ed.; BOBP: Madras, India, 1992; pp. 1–2. [Google Scholar]
  6. Gu, Z.; He, L. Histological and cytological observation on the development cycle of crab (Eriocheir sinensis) ovary. Oceanol. Limnol. Sin. 1997, 28, 138–145. [Google Scholar]
  7. Wu, X.; Liu, M.; Pan, J.; Chen, H.; Zeng, C.; Cheng, Y. The ovarian development pattern of pond-reared Chinese mitten crab, Eriocheir sinensis H. Milne-Edwards, 1853. Crustaceana 2017, 90, 449–470. [Google Scholar] [CrossRef]
  8. Huang, X.; Ye, H.; Huang, H.; Yang, Y.; Gong, J. An insulin-like androgenic gland hormone gene in the mud crab, Scylla paramamosain, extensively expressed and involved in the processes of growth and female reproduction. Gen. Comp. Endocrinol. 2014, 204, 229–238. [Google Scholar] [CrossRef]
  9. Wu, Q.; Waiho, K.; Huang, Z.; Li, S.; Zheng, H.; Zhang, Y.; Ikhwanuddin, M.; Lin, F.; Ma, H. Growth performance and biochemical composition dynamics of ovary, hepatopancreas and muscle tissues at different ovarian maturation stages of female mud crab, Scylla paramamosain. Aquaculture 2019, 515, 734560. [Google Scholar] [CrossRef]
  10. Liu, Z.; Wu, X.; Cheng, Y.; Zeng, C.; Yang, X. Ovarian re-maturation following the first spawning in the Chinese mitten crab, Eriocheir sinensis (H. Milne-Edwards). Aquac. Res. 2010, 42, 417–426. [Google Scholar] [CrossRef]
  11. Wu, X.; Cheng, Y.; Zeng, C.; Wang, C.; Cui, Z. Reproductive performance and offspring quality of the first and the second brood of female swimming crab, Portunus trituberculatus. Aquaculture 2010, 303, 94–100. [Google Scholar] [CrossRef]
  12. Ren, Y.; Wang, W.; Liu, Z.; Luo, M.; Fu, Y.; Zhang, F.; Ma, C.; Zhao, M.; Chen, W.; Jiang, K.; et al. Insight of vitellogenesis patterns: A comparative analysis of the differences between the primary and secondary vitellogenesis period in the ovary, hepatopancreas, and muscle of mud crab, Scylla paramamosain. Front. Genet. 2022, 13, 965070. [Google Scholar] [CrossRef] [PubMed]
  13. Valle, D. Vitellogenesis in insects and other groups: A review. Mem. Inst. Oswaldo Cruz. 1993, 88, 1–26. [Google Scholar] [CrossRef] [PubMed] [Green Version]
  14. Subramoniam, T. Mechanisms and control of vitellogenesis in crustaceans. Fish. Sci. 2010, 77, 1–21. [Google Scholar] [CrossRef]
  15. Harrison, K.E. The role of nutrition in maturation, reproduction and embryonic development of decapod crustacean: A review. J. Shellfish Res. 1990, 9, 1–28. [Google Scholar]
  16. Xu, X.; Ji, W.; Castell, J.; O’Dor, R. Essential fatty acid requirement of the Chinese prawn, Penaeus chinensis. Aquaculture 1994, 127, 29–40. [Google Scholar] [CrossRef]
  17. Li, S.; Lin, S.; Liu, L. In Studies on Lipid Classes & Fatty Acid Compositions during Ovarian Development of Mud Crab, Scylla serrata (Forskal). J. Xiamen Univ. Nat. Sci. 1994, 33, 109–115. [Google Scholar]
  18. Alava, V.R.; Quinitio, E.T.; de Pedro, J.B.; Priolo, F.M.P.; Orozco, Z.G.A.; Wille, M. Lipids and fatty acids in wild and pond-reared mud crab Scylla serrata (Forsskål) during ovarian maturation and spawning. Aquac. Res. 2007, 38, 1468–1477. [Google Scholar] [CrossRef] [Green Version]
  19. Ghazali, A.; Azra, M.N.; Noordin, N.M.; Abol-Munafi, A.B.; Ikhwanuddin, M. Ovarian morphological development and fatty acids profile of mud crab (Scylla olivacea) fed with various diets. Aquaculture 2017, 468, 45–52. [Google Scholar] [CrossRef]
  20. Djunaidah, I.S.; Wille, M.; Kontara, E.; Sorgeloos, P. Reproductive performance and offspring quality in mud crab (Scylla paramamosain) broodstock fed different diets. Aquac. Int. 2003, 11, 3–15. [Google Scholar] [CrossRef]
  21. Wu, X.; Cheng, Y.; Zeng, C.; Wang, C.; Yang, X. Reproductive performance and offspring quality of wild-caught and pond-reared swimming crab Portunus trituberculatus broodstock. Aquaculture 2010, 301, 78–84. [Google Scholar] [CrossRef]
  22. Gusarova, V.; Brodsky, J.L.; Fisher, E.A. Apolipoprotein B100 Exit from the Endoplasmic Reticulum (ER) Is COPII-dependent, and Its Lipidation to Very Low Density Lipoprotein Occurs Post-ER. J. Biol. Chem. 2003, 278, 48051–48058. [Google Scholar] [CrossRef] [PubMed] [Green Version]
  23. Lin, Z.; Qi, C.; Han, F.; Chen, X.; Qin, C.; Wang, C.; Wang, X.; Qin, J.; Chen, L. Selecting suitable phospholipid source for female Eriocheir sinensis in pre-reproductive phase. Aquaculture 2020, 528, 735610. [Google Scholar] [CrossRef]
  24. Zeng, X.; Wan, H.; Zhong, J.; Feng, Y.; Zhang, Z.; Wang, Y. Large lipid transfer proteins in hepatopancreas of the mud crab Scylla paramamosain. Comp. Biochem. Physiol. Part D Genom. Proteom. 2021, 38, 100801. [Google Scholar] [CrossRef] [PubMed]
  25. Chen, B.; Zheng, J.; Chen, C.; Wu, K.; Lin, F.; Ning, L.; Rong, H.; Chen, C.; Xiao, F.; Zhang, H.; et al. Differences in lipid accumulation and mobilization in the hepatopancreas and ovary of female mud crab (Scylla paramamosain, Estampador, 1949) during ovarian development. Aquaculture 2023, 564, 739046. [Google Scholar] [CrossRef]
  26. Zhang, Y.; Jiang, S.; Qiao, H.; Xiong, Y.; Fu, H.; Zhang, W.; Gong, Y.; Jin, S.; Wu, Y. Transcriptome analysis of five ovarian stages reveals gonad maturation in female Macrobrachium nipponense. BMC Genom. 2021, 22, 1–11. [Google Scholar] [CrossRef]
  27. Zhong, Y.; Zhao, W.; Tang, Z.; Huang, L.; Zhu, X.; Liang, X.; Yan, A.; Lu, Z.; Yu, Y.; Tang, D.; et al. Comparative transcriptomic analysis of the different developmental stages of ovary in red swamp crayfish Procambarus clarkii. BMC Genom. 2021, 22, 1–20. [Google Scholar] [CrossRef]
  28. Wouters, R.; Molina, C.; Lavens, P.; Calderón, J. Lipid composition and vitamin content of wild female Litopenaeus vannamei in different stages of sexual maturation. Aquaculture 2001, 198, 307–323. [Google Scholar] [CrossRef] [Green Version]
  29. Zmora, N.; Trant, J.; Zohar, Y.; Chung, J.S. Molt-inhibiting hormone stimulates vitellogenesis at advanced ovarian developmental stages in the female blue crab, Callinectes sapidus 1: An ovarian stage dependent involvement. Saline Syst. 2009, 5, 1–11. [Google Scholar] [CrossRef] [Green Version]
  30. Heras, H.; Gonzalez-Baró, M.R.; Pollero, R.J. Lipid and fatty acid composition and energy partitioning during embryo development in the shrimp Macrobrachium borellii. Lipids 2000, 35, 645–651. [Google Scholar] [CrossRef]
  31. Chen, J.-S.; Sappington, T.; Raikhel, A.S. Extensive Sequence Conservation Among Insect, Nematode, and Vertebrate Vitellogenins Reveals Ancient Common Ancestry. J. Mol. Evol. 1997, 44, 440–451. [Google Scholar] [CrossRef]
  32. Wei, H.; Ren, Z.; Tang, L.; Yao, H.; Li, X.; Wang, C.; Mu, C.; Shi, C.; Wang, H. JNK signaling pathway regulates the development of ovaries and synthesis of vitellogenin (Vg) in the swimming crab Portunus trituberculatus. Cell Stress Chaperones 2020, 25, 441–453. [Google Scholar] [CrossRef] [PubMed]
  33. Sun, J.; Nan, G. The Mitogen-Activated Protein Kinase (MAPK) Signaling Pathway as a Discovery Target in Stroke. J. Mol. Neurosci. 2016, 59, 90–98. [Google Scholar] [CrossRef] [PubMed]
  34. Rosette, C.; Karin, M. Ultraviolet Light and Osmotic Stress: Activation of the JNK Cascade Through Multiple Growth Factor and Cytokine Receptors. Science 1996, 274, 1194–1197. [Google Scholar] [CrossRef] [PubMed]
  35. Wang, H.; Shi, C.; Kong, M.; Mu, C.; Wei, H.; Wang, C. Cloning and expression of a transcription factor activator protein-1 member identified from the swimming crab Portunus trituberculatus. Cell Stress Chaperones 2018, 23, 1275–1282. [Google Scholar] [CrossRef]
  36. Zhao, J.C.; Wang, Y.L.; Li, Q.; Zhu, M.; Sun, W.J.; Wu, T.M.; Wang, Q.; He, L. Molecular cloning and characterization of p38 gene in the Chinese Mitten Crab, Eriocheir sinensis. Aquac. Res. 2014, 47, 1353–1363. [Google Scholar] [CrossRef]
  37. Ma, A.; Wang, Y.; Zou, Z.; Fu, M.; Lin, P.; Zhang, Z. Erk2 in Ovarian Development of Green Mud Crab Scylla paramamosain. DNA Cell Biol. 2012, 31, 1233–1244. [Google Scholar] [CrossRef] [Green Version]
  38. Feng, Q.-M.; Liu, M.-M.; Cheng, Y.-X.; Wu, X.-G. Comparative proteomics elucidates the dynamics of ovarian development in the Chinese mitten crab Eriocheir sinensis. Comp. Biochem. Physiol. Part D Genom. Proteom. 2021, 40, 100878. [Google Scholar] [CrossRef]
  39. Fu, C.; Liu, L.; Li, F. Acetate alters the process of lipid metabolism in rabbits. Animal 2018, 12, 1895–1902. [Google Scholar] [CrossRef]
  40. Engelman, J.A.; Berg, A.H.; Lewis, R.Y.; Lin, A.; Lisanti, M.P.; Scherer, P.E. Constitutively Active Mitogen-activated Protein Kinase Kinase 6 (MKK6) or Salicylate Induces Spontaneous 3T3-L1 Adipogenesis. J. Biol. Chem. 1999, 274, 35630–35638. [Google Scholar] [CrossRef] [Green Version]
  41. Lei, Y.; Li, F.; Mortimer, M.; Li, Z.; Peng, B.-X.; Li, M.; Guo, L.-H.; Zhuang, G. Antibiotics disrupt lipid metabolism in zebrafish (Danio rerio) larvae and 3T3-L1 preadipocytes. Sci. Total. Environ. 2023, 858, 159755. [Google Scholar] [CrossRef]
  42. Du, J.; Xiang, X.; Xu, D.; Zhang, J.; Fang, W.; Xu, W.; Mai, K.; Ai, Q. FXR, a Key Regulator of Lipid Metabolism, Is Inhibited by ER Stress-Mediated Activation of JNK and p38 MAPK in Large Yellow Croakers (Larimichthys crocea) Fed High Fat Diets. Nutrients 2021, 13, 4343. [Google Scholar] [CrossRef] [PubMed]
  43. Li, Z.; Yu, Z.; Gao, P.; Yin, D. Multigenerational effects of perfluorooctanoic acid on lipid metabolism of Caenorhabditis elegans and its potential mechanism. Sci. Total. Environ. 2019, 703, 134762. [Google Scholar] [CrossRef] [PubMed]
  44. Chakrabarti, S.; Poidevin, M.; Lemaitre, B. The Drosophila MAPK p38c Regulates Oxidative Stress and Lipid Homeostasis in the Intestine. PLoS Genet. 2014, 10, e1004659. [Google Scholar] [CrossRef] [PubMed]
  45. Nidhina, P.A.H.; Poulose, N.; Gopalakrishnapillai, A. Vanillin induces adipocyte differentiation in 3T3-L1 cells by activating extracellular signal regulated kinase 42/44. Life Sci. 2011, 88, 675–680. [Google Scholar] [CrossRef] [PubMed]
  46. Greenberg, A.S.; Shen, W.-J.; Muliro, K.; Patel, S.; Souza, S.C.; Roth, R.A.; Kraemer, F.B. Stimulation of Lipolysis and Hormone-sensitive Lipase via the Extracellular Signal-regulated Kinase Pathway. J. Biol. Chem. 2001, 276, 45456–45461. [Google Scholar] [CrossRef] [Green Version]
  47. Desvergne, B.; Wahli, W. Peroxisome Proliferator-Activated Receptors: Nuclear Control of Metabolism. Endocr. Rev. 1999, 20, 649–688. [Google Scholar] [CrossRef] [Green Version]
  48. Berger, J.; Moller, D.E. The Mechanisms of Action of PPARs. Annu. Rev. Med. 2002, 53, 409–435. [Google Scholar] [CrossRef] [Green Version]
  49. Lee, C.-H.; Olson, P.; Evans, R.M. Minireview: Lipid Metabolism, Metabolic Diseases, and Peroxisome Proliferator-Activated Receptors. Endocrinology 2003, 144, 2201–2207. [Google Scholar] [CrossRef] [Green Version]
  50. Desvergne, B.; Michalik, L.; Wahli, W. Transcriptional Regulation of Metabolism. Physiol. Rev. 2006, 86, 465–514. [Google Scholar] [CrossRef]
  51. Müller-Brüsselbach, S.; Ebrahimsade, S.; Jäkel, J.; Eckhardt, J.; Rapp, U.; Peters, J.; Moll, R.; Müller, R. Growth of transgenic RAF-induced lung adenomas is increased in mice with a disrupted PPARβ/δ gene. Int. J. Oncol. 2007, 31, 607–611. [Google Scholar] [CrossRef]
  52. Viswakarma, N.; Jia, Y.; Bai, L.; Vluggens, A.; Borensztajn, J.; Xu, J.; Reddy, J.K. Coactivators in PPAR-Regulated Gene Expression. PPAR Res. 2010, 2010, 1–21. [Google Scholar] [CrossRef] [PubMed] [Green Version]
  53. Chawla, A.; Repa, J.J.; Evans, R.M.; Mangelsdorf, D.J. Nuclear Receptors and Lipid Physiology: Opening the X-Files. Science 2001, 294, 1866–1870. [Google Scholar] [CrossRef] [PubMed] [Green Version]
  54. Bookout, A.L.; Jeong, Y.; Downes, M.; Yu, R.T.; Evans, R.M.; Mangelsdorf, D.J. Anatomical Profiling of Nuclear Receptor Expression Reveals a Hierarchical Transcriptional Network. Cell 2006, 126, 789–799. [Google Scholar] [CrossRef] [PubMed] [Green Version]
  55. Yamauchi, T.; Kamon, J.; Waki, H.; Murakami, K.; Motojima, K.; Komeda, K.; Ide, T.; Kubota, N.; Terauchi, Y.; Tobe, K.; et al. The Mechanisms by Which Both Heterozygous Peroxisome Proliferator-activated Receptor γ (PPARγ) Deficiency and PPARγ Agonist Improve Insulin Resistance. J. Biol. Chem. 2001, 276, 41245–41254. [Google Scholar] [CrossRef] [PubMed] [Green Version]
  56. Forman, B.M.; Tontonoz, P.; Chen, J.; Brun, R.P.; Spiegelman, B.M.; Evans, R. 15-Deoxy-Δ12,14-Prostaglandin J2 is a ligand for the adipocyte determination factor PPARγ. Cell 1995, 83, 803–812. [Google Scholar] [CrossRef] [PubMed] [Green Version]
  57. Bonet, M.L.; Ribot, J.; Palou, A. Lipid metabolism in mammalian tissues and its control by retinoic acid. Biochim. Biophys. Acta (BBA) Mol. Cell Biol. Lipids 2012, 1821, 177–189. [Google Scholar] [CrossRef]
  58. Blommer, J.; Fischer, M.C.; Olszewski, A.R.; Katzenberger, R.J.; Ganetzky, B.; Wassarman, D.A. Ketogenic diet reduces early mortality following traumatic brain injury in drosophila via the PPARγ ortholog Eip75B. PLoS ONE 2021, 16, e0258873. [Google Scholar] [CrossRef]
  59. Hong, J.-W.; Park, K.W. Further understanding of fat biology: Lessons from a fat fly. Exp. Mol. Med. 2010, 42, 12–20. [Google Scholar] [CrossRef] [Green Version]
  60. King-Jones, K.; Thummel, C.S. Nuclear receptors—A perspective from Drosophila. Nat. Rev. Genet. 2005, 6, 311–323. [Google Scholar] [CrossRef]
  61. Zipper, L.; Jassmann, D.; Burgmer, S.; Görlich, B.; Reiff, T. Ecdysone steroid hormone remote controls intestinal stem cell fate decisions via the PPARγ-homolog Eip75B in Drosophila. Elife 2020, 9, e55795. [Google Scholar] [CrossRef]
  62. Yao, T.-P.; Segraves, W.A.; Oro, A.E.; McKeown, M.; Evans, R.M. Drosophila ultraspiracle modulates ecdysone receptor function via heterodimer formation. Cell 1992, 71, 63–72. [Google Scholar] [CrossRef] [PubMed]
  63. Thomas, H.E.; Stunnenberg, H.G.; Stewart, A.F. Heterodimerization of the Drosophila ecdysone receptor with retinoid X receptor and ultraspiracle. Nature 1993, 362, 471–475. [Google Scholar] [CrossRef] [PubMed]
  64. Palanker, L.; Necakov, A.S.; Sampson, H.M.; Ni, R.; Hu, C.; Thummel, C.S.; Krause, H.M. Dynamic regulation of Drosophila nuclear receptor activity in vivo. Development 2006, 133, 3549–3562. [Google Scholar] [CrossRef] [PubMed] [Green Version]
  65. Iwema, T.; Chaumot, A.; Studer, R.A.; Robinson-Rechavi, M.; Billas, I.M.; Moras, D.; Laudet, V.; Bonneton, F. Structural and Evolutionary Innovation of the Heterodimerization Interface between USP and the Ecdysone Receptor ECR in Insects. Mol. Biol. Evol. 2009, 26, 753–768. [Google Scholar] [CrossRef] [PubMed] [Green Version]
  66. Techa, S.; Chung, J.S. Ecdysone and retinoid-X receptors of the blue crab, Callinectes sapidus: Cloning and their expression patterns in eyestalks and Y-organs during the molt cycle. Gene 2013, 527, 139–153. [Google Scholar] [CrossRef] [PubMed]
  67. Hopkins, P.M.; Durica, D.; Washington, T. RXR isoforms and endogenous retinoids in the fiddler crab, Uca pugilator. Comp. Biochem. Physiol. Part A Mol. Integr. Physiol. 2008, 151, 602–614. [Google Scholar] [CrossRef]
  68. Gong, J.; Huang, C.; Shu, L.; Bao, C.; Huang, H.; Ye, H.; Zeng, C.; Li, S. The retinoid X receptor from mud crab: New insights into its roles in ovarian development and related signaling pathway. Sci. Rep. 2016, 6, 1–13. [Google Scholar] [CrossRef] [Green Version]
  69. Girish, B.P.; Swetha, C.H.; Reddy, P.S. Expression of RXR, EcR, E75 and VtG mRNA levels in the hepatopancreas and ovary of the freshwater edible crab, Oziothelphusa senex senex (Fabricius, 1798) during different vitellogenic stages. Sci. Nat. 2015, 102, 20. [Google Scholar] [CrossRef]
  70. McCubrey, J.A.; Steelman, L.S.; Chappell, W.H.; Abrams, S.L.; Wong, E.W.T.; Chang, F.; Lehmann, B.; Terrian, D.M.; Milella, M.; Tafuri, A.; et al. Roles of the Raf/MEK/ERK pathway in cell growth, malignant transformation and drug resistance. Biochim. Biophys. Acta (BBA) Mol. Cell Res. 2007, 1773, 1263–1284. [Google Scholar] [CrossRef] [Green Version]
  71. Sun, Y.; Liu, W.-Z.; Liu, T.; Feng, X.; Yang, N.; Zhou, H.-F. Signaling pathway of MAPK/ERK in cell proliferation, differentiation, migration, senescence and apoptosis. J. Recept. Signal Transduct. 2015, 35, 600–604. [Google Scholar] [CrossRef]
  72. Blenis, J. Growth-regulated signal transduction by the MAP kinases and RSKs. Cancer Cells 1991, 3, 445–449. [Google Scholar] [PubMed]
  73. Bruder, J.T.; Heidecker, G.; Rapp, U.R. Serum-, TPA-, and Ras-induced expression from Ap-1/Ets-driven promoters requires Raf-1 kinase. Genes Dev. 1992, 6, 545–556. [Google Scholar] [CrossRef] [PubMed] [Green Version]
  74. Fabian, J.R.; Morrison, D.K.; Daar, I. Requirement for Raf and MAP kinase function during the meiotic maturation of Xenopus oocytes. Int. J. Biochem. Cell Biol. 1993, 122, 645–652. [Google Scholar] [CrossRef] [PubMed]
  75. Grunt, T.W. Interacting Cancer Machineries: Cell Signaling, Lipid Metabolism, and Epigenetics. Trends Endocrinol. Metab. 2018, 29, 86–98. [Google Scholar] [CrossRef]
  76. Yang, S.; Park, Y.; Kim, J.I.; Lee, Y.; Lee, T.; Jang, B. LY3009120, a pan-Raf kinase inhibitor, inhibits adipogenesis of 3T3-L1 cells by controlling the expression and phosphorylation of C/EBP-α, PPAR-γ, STAT-3, FAS, ACC, perilipin A, and AMPK. Int. J. Mol. Med. 2018, 42, 3477–3484. [Google Scholar] [CrossRef] [Green Version]
  77. Krey, G.; Braissant, O.; L’Horset, F.; Kalkhoven, E.; Perroud, M.; Parker, M.G.; Wahli, W. Fatty Acids, Eicosanoids, and Hypolipidemic Agents Identified as Ligands of Peroxisome Proliferator-Activated Receptors by Coactivator-Dependent Receptor Ligand Assay. Mol. Endocrinol. 1997, 11, 779–791. [Google Scholar] [CrossRef]
  78. Hashimoto, T.; Cook, W.S.; Qi, C.; Yeldandi, A.V.; Reddy, J.K.; Rao, M.S. Defect in Peroxisome Proliferator-activated Receptor α-inducible Fatty Acid Oxidation Determines the Severity of Hepatic Steatosis in Response to Fasting. J. Biol. Chem. 2000, 275, 28918–28928. [Google Scholar] [CrossRef] [Green Version]
  79. Wang, Y.-X.; Lee, C.-H.; Tiep, S.; Yu, R.T.; Ham, J.; Kang, H.; Evans, R.M. Peroxisome-Proliferator-Activated Receptor δ Activates Fat Metabolism to Prevent Obesity. Cell 2003, 113, 159–170. [Google Scholar] [CrossRef] [Green Version]
  80. Rosen, E.D.; Spiegelman, B.M. PPARγ: A Nuclear Regulator of Metabolism, Differentiation, and Cell Growth. J. Biol. Chem. 2001, 276, 37731–37734. [Google Scholar] [CrossRef] [Green Version]
  81. Guo, D.; Liu, W.; Zhang, X.; Zhao, M.; Zhu, B.; Hou, T.; He, H. Duck Egg White–Derived Peptide VSEE (Val-Ser-Glu-Glu) Regulates Bone and Lipid Metabolisms by Wnt/β-Catenin Signaling Pathway and Intestinal Microbiota. Mol. Nutr. Food Res. 2019, 63, e1900525. [Google Scholar] [CrossRef]
  82. Takada, I.; Kouzmenko, A.P.; Kato, S. Wnt and PPARγ signaling in osteoblastogenesis and adipogenesis. Nat. Rev. Rheumatol. 2009, 5, 442–447. [Google Scholar] [CrossRef] [PubMed]
  83. Mulholland, D.J.; Dedhar, S.; Coetzee, G.A.; Nelson, C.C. Interaction of Nuclear Receptors with the Wnt/β-Catenin/Tcf Signaling Axis: Wnt You Like to Know? Endocr. Rev. 2005, 26, 898–915. [Google Scholar] [CrossRef] [PubMed]
Figure 1. (A) Distribution of the length of unigenes and transcripts. The abscissa represents different length ranges of transcripts and unigenes, and the ordinate represents the number of transcripts and unigenes in a certain length range. (B) Functional annotation of unigenes from six databases (GO, KEGG, eggNOG, NR, Swiss-Prot, and Pfam).
Fishes 08 00145 g001
Figure 2. Annotation of the unigenes obtained from the transcriptome assembly of S. paramamosain. (A) Venn diagram of the total unigenes annotated into the six databases (NR, Siwss-Prot, Pfam, eggNOG, GO, and KEGG), the central white part is the number of common genes. (B) GO annotation results are summarized into three main categories (biological process, cellular component, and molecular function). (C) eggNOG annotation of the total unigenes; the results are classified into 23 categories. (D) KEGG annotation of the total unigenes are assigned into four main categories (metabolism, genetic information processing, environmental information processing, and cellular process).
Fishes 08 00145 g002
Figure 3. qRT-PCR validation of the DEGs from the transcriptome sequencing. The sample information represented by abscissa (see Table 1) and the ordinate represents the gene relative expression level of qRT-PCR and transcriptome sequencing (TPM). A total of 6 genes were validated (A) gene 1, (B) gene 2, (C) gene 3, (D) gene 4, (E) gene 5, (F) gene 6, (G) Sp-Vg, and (H) Sp-VgR. All the information about the genes in the qRT-PCR are listed in the Supplementary File Table S1. Different superscript letters in the column of the figures indicate a significant difference (p < 0.05).
Fishes 08 00145 g003
Figure 4. Annotation of the DEGs in the GO and KEGG databases. (A) The number of DEGs in the different comparison groups. (B) Venn diagram of the DEGs from different comparison groups. (C) GO annotation of total DEGs. (D) KEGG annotation of total DEGs.
Fishes 08 00145 g004
Figure 5. Heatmap analysis of the expression of metabolism-related genes during different ovarian stages. KEGG analysis of three metabolic pathway unigenes of up- and down-regulated during different ovarian stages: (A) Carbohydrate metabolism; (B) Amino acid metabolism; (C) Lipid metabolism. GO analysis of lipid metabolism-related genes up- and down-regulated during different ovarian stages: (D) Lipid metabolic process (GO: 0006629); (E) Lipid binding (GO: 0008289); (F) Lipid biosynthetic process (GO: 0008610). KEGG analysis of three lipid metabolism pathway genes of up- and down-regulated during different ovarian stages: (G) Fatty acid degradation (map00071).
Fishes 08 00145 g005
Figure 6. KEGG enrichment of DEGs in the different comparison groups. (A) Total number of DEGs in the vitellogenesis stages of SOMP (S_OV_4_vs_S_OV_3; S_OV_5_vs_S_OV_4); (B) Total number of DEGs in the vitellogenesis of FOMP (F_OV_4_vs_F_OV_3; F_OV_5_vs_F_OV_4); (C) Total number of DEGs in the comparison groups between the SOMP and FOMP during vitellogenesis (S_OV_3_vs_F_OV_3; S_OV_4_vs_F_OV_4; S_OV_5_vs_F_OV_5); (D) PPAR signaling pathway; (E) MAPK signaling pathway.
Fishes 08 00145 g006
Figure 7. Domain architectures of the PPARγ-homologs, Eip75B and Eip 78C, in Drosophila melanogaster and S. paramamosain. Sp-Eip75B/78C: ecdysone-induced protein E75B/78C in S. paramamosain; Dm-Eip75B/78C: ecdysone-induced protein E75B/E78C in Drosophila melanogaster. NR_LBD: Ligand-binding domain (LBD) of nuclear receptor (NR); NR_DBD: DNA binding domain (DBD) of nuclear receptor (NR).
Fishes 08 00145 g007
Figure 8. Protein-protein interaction network of MAPK and PPAR signaling pathways. All the information of the proteins in the network are listed in the Supplementary File Table S5.
Fishes 08 00145 g008
Figure 9. Schematic diagram of hypothetical mechanism of several key signaling pathways regulating lipid metabolism in S. paramamosain.
Fishes 08 00145 g009
Table 1. Information related to ovary (OV) tissue samples.
Sample IDDevelopmental Period (F/S)Developmental Stage
F_OV_1First ovarian maturation period (FOMP)Stage I
F_OV_2First ovarian maturation period (FOMP)Stage II
F_OV_3First ovarian maturation period (FOMP)Stage III
F_OV_4First ovarian maturation period (FOMP)Stage IV
F_OV_5First ovarian maturation period (FOMP)Stage V
S_OV_3Second ovarian maturation period (SOMP)Stage III
S_OV_4Second ovarian maturation period (SOMP)Stage IV
S_OV_5Second ovarian maturation period (SOMP)Stage V
Table 2. Evaluation of the assembly results.
TypeUnigeneTranscript
Total number81,893132,744
Total base92,837,704154,178,017
Largest length (bp)20,31720,317
Smallest length (bp)201201
Average length (bp)1133.651161.47
N50 length (bp)21112758
Fragment mapped percent (%)71.49783.346
GC percent (%)46.6246.75
BUSCO (%)96.698.5
Disclaimer/Publisher’s Note: The statements, opinions and data contained in all publications are solely those of the individual author(s) and contributor(s) and not of MDPI and/or the editor(s). MDPI and/or the editor(s) disclaim responsibility for any injury to people or property resulting from any ideas, methods, instructions or products referred to in the content.

