Abstract
Quantitative trait loci (QTL) are genomic regions associated with phenotype variation of quantitative traits. To date, a total of 313 QTL for 31 quantitative traits have been reported in 14 studies on flax. Of these, 200 QTL from 12 studies were identified based on genetic maps, the scaffold sequences, or the pre-released chromosome-scale pseudomolecules. Molecular markers for QTL identification differed across studies but the most used ones were simple sequence repeats (SSRs) or single nucleotide polymorphisms (SNPs). To uniquely map the SSR and SNP markers from different references onto the recently released chromosome-scale pseudomolecules, methods with several scripts and database files were developed to locate PCR- and SNP-based markers onto the same reference, co-locate QTL, and scan genome-wide candidate genes. Using these methods, 195 out of 200 QTL were successfully sorted onto the 15 flax chromosomes and grouped into 133 co-located QTL clusters; the candidate genes that co-located with these QTL clusters were also predicted. The methods and tools presented in this article facilitate marker re-mapping to a new reference, genome-wide QTL analysis, candidate gene scanning, and breeding applications in flax and other crops.
1. Introduction
Most traits of importance in plant breeding are quantitative and controlled by polygenes with minor effects on phenotypes. Traditional quantitative genetics can estimate overall genetic effects or variances of polygenes for quantitative traits through dedicated genetic designs [1], providing a theoretical guide for plant breeding. With the development of molecular markers and high-throughput genotyping techniques, individual polygenic loci on chromosomes and their effects on phenotypes can be detected and estimated using statistical genomics approaches. Such polygenic loci on chromosomes are called quantitative trait loci (QTL). They are associated with phenotype variation of quantitative traits and are usually mapped in various populations using molecular markers such as simple sequence repeats (SSRs) or single nucleotide polymorphisms (SNPs). Generally, QTL can be identified by two main approaches: linkage mapping (LM) and association mapping (AM) or genome-wide association study (GWAS) [2]. LM uses bi-parental populations, such as F2, recombinant inbred line (RIL), doubled haploid (DH), and backcross (BC) populations, to identify loci responsible for trait variation between parents based on recombination-based genetic linkage maps [3]. AM relies on linkage disequilibrium (LD) between markers and QTL. AM uses a more diverse genetic panel to overcome the phenotypic diversity limitation of bi-parental populations. This diversity limitation may include natural germplasm collections, or, more often, panels including germplasm accessions and breeding lines, or multi-parent populations such as nested association mapping (NAM) [4,5,6] and multi-parent advanced generation intercross (MAGIC) populations [7,8,9,10]. QTL can be exploited for gene cloning, marker-assisted breeding, and genomic selection or prediction.
Cultivated flax (Linum usitatissimum L.) is a self-pollinating annual crop valued for its seed oil and stem fibre. Phenotypic selection remains a major conventional breeding approach to improve traits of agronomic importance in flax. To accelerate the application of molecular breeding, a large number of molecular markers [11,12,13,14] and genetic populations [15,16,17,18] have been developed to assist QTL identification in the last decade. Using these genetic resources, a total of 313 QTL for 31 traits (13 seed yield and agronomic traits, 11 seed quality traits, four fibre traits, and three disease resistance traits) were reported in 14 studies (Table 1 and Table 2). These QTL were identified mainly using SSR or SNP markers with LM or AM/GWAS (Table 2). The studies using LM were based on genetic maps [15,18,19,20,21,22,23,24], while those using AM or GWAS were based on the flax scaffold sequences [17,25,26], the early (hereafter pre-released) version of chromosome-scale pseudomolecules (PCPs) [27,28] or the most recent release of the chromosome-scale pseudomolecules (RCPs) [14,29] (Table 2). The use of different references in the QTL identification studies made it difficult to compare the results across studies, genome-wide QTL analysis, candidate gene prediction, and breeding applications. Thus, the objectives of this study were to develop methods and corresponding software tools to uniquely map the QTL identified in different studies onto the RCPs [29]. These methods and tools were designed to be applicable to studies in flax as well as other crops.

Table 1.
Number of QTL associated with 31 traits in flax.
Table 2.
QTL identification studies in flax.
2. Materials and Methods
2.1. The Most Recent Release of the Chromosome-Scale Pseudomolecules
The chromosome-scale pseudomolecules for flax were recently released [29]. A total of 622 scaffolds from the flax reference genome [25] were sorted onto 15 chromosomes, totalling 316.2 Mb. Thus, the SNPs identified based on the scaffold reference sequences can be accurately mapped to the pseudomolecules. The 15 pseudomolecule sequences corresponding to 15 chromosomes were downloaded from the National Center for Biotechnology Information (NCBI) database. The accession numbers of the pseudomolecules for the 15 chromosomes are CP027619 (Lu1), CP027626 (Lu2), CP027627 (Lu3), CP027628 (Lu4), CP027629 (Lu5), CP027630 (Lu6), CP027631 (Lu7), CP027632 (Lu8), CP027633 (Lu9), CP027620 (Lu10), CP027621 (Lu11), CP027622 (Lu12), CP027623 (Lu13), CP027624 (Lu14), and CP027625 (Lu15). The chromosome sizes are listed in Table S1.
2.2. Marker Infomation of QTL in Flax
All 313 flax QTL reported in the 14 studies (Table 2) were identified from three types of markers: amplified fragment length polymorphisms (AFLPs), SSRs, and SNPs. PCR primer sequences of AFLPs and SSRs were retrieved from the literature [15,19,20,21,23,24]. For the SNPs named based on the scaffold sequences, their scaffold names and coordinates were collected directly from the publications [17,26]. For the SNPs identified without a reference [18], flanking sequences of the SNP markers were downloaded from the publication [18]. All available primer sequences of SSR markers and flanking sequences of SNP markers for the identified QTL are listed in Tables S2 and S3, respectively.
2.3. Mapping PCR-Based Markers to the Most Recent Release of the Chromosome-Scale Pseudomolecules
PCR primer sequences of markers were mapped onto the RCPs using the electronic PCR (E-PCR) tool [31]. A pipeline using E-PCR was developed. This pipeline includes two Perl scripts: ProgramS1_prepare_rePCR.pl (Program S1) and ProgramS2_rePCR_pipeline.pl (Program S2). Program S1 is a script that creates a search database of the RCPs, outputting two files for the downstream analysis: *.famap and *.hash. Program S2 is a script that performs electronic PCR to map paired primers onto the RCPs, generating result files with coordinates of the primers on chromosomes and their amplicon sizes. No nucleotide mismatches or gaps were allowed. The instructions of these programs are described in User guide S1.
PCR primers designed from sequences of different genotypes could not always be accurately mapped to the RCPs using the E-PCR approach. In such cases, BLASTN searches were performed to ascertain their map positions.
2.4. Mapping SNPs to the Most Recent Release of the Chromosome-Scale Pseudomolecules
If SNPs are identified using the flax scaffold sequences [25], their coordinates can be accurately converted to the RCPs’ coordinates. The Perl script ProgramS3_convert_scaffold_coordinates_to_pseudochr.pl (Program S3) executes this conversion. A database file for the accurate relationship between the scaffolds and the RCPs (Table S4) is required to run this program. The instructions of this script are described in User guide S1.
For the SNPs identified without a reference sequence [18], the flanking sequences of the SNPs were searched against the RCPs using BLASTN at an E-value of 10−30. The alignment regions of top hits were used and manually verified.
For the SNPs based on the PCPs in two publications [27,28], their scaffold names and corresponding coordinates on the scaffolds were retrieved from the raw SNP data as these SNPs were initially identified from the scaffolds, followed by conversion to the RCPs using Program S3.
2.5. Grouping QTL to Clusters
QTL mapping software tools can detect multiple quantitative trait nucleotides (QTNs) from a small region that may be grouped into the same QTL or a QTN cluster based on the LD between markers [14]. QTNs detected in different populations cannot be grouped based on population-dependent marker LD. To provide a simple solution, we opted to group in a single QTL cluster all QTL located within a 200 kb window covering the 100 kb upstream and 100 kb downstream regions of the QTN position.
2.6. Candidate Gene Analysis Based on the Most Recent Release of the Chromosome-Scale Pseudomolecules
As the RCPs [29] were generated by sorting and refining the existing scaffold sequences [25], no changes were made to the original gene annotations on the scaffold sequences. However, the new coordinates of these genes on the RCPs were not previously released [29]. The RCPs contain 42,277 protein coding genes, of which 1,327 were predicted to be resistance gene analogs (RGAs) [29]. To facilitate genome-wide candidate gene analyses, the revised version of the script “ProgramS3_convert_scaffold_coordinates_to_pseudochr.pl” was used to convert the coordinates of the genes on the scaffolds onto the RCPs. All genes and RGAs and their coordinates on the RCPs are listed in Tables S5 and S6, respectively. These genes were mapped to orthologous genes of the model species Arabidopsis thaliana using BLASTP of flax protein sequences against A. thaliana protein sequences at an E-value of 10−10. A total of 15,323 unique A. thaliana genes were mapped. Then, the flax genes were searched against the NCBI non-redundant protein database (nr) at an E-value of 10−5, and functional annotations were generated using a custom script that integrates protein annotation information of top hits and the orthologous A. thaliana genes. The annotation results were added to the gene list. A genome-wide gene scan along chromosomes for QTL was performed to characterize the underlying genomic regions and identify candidate genes. The genes within a 200-kb window covering the 100 kb upstream and downstream regions of the QTN position were scanned. A Perl script ProgramS4_flax_QTL_candidate_gene_scanning.pl was developed (Program S4) to scan potential candidate genes for given QTL based on the gene annotation database files in Table S5 (for all protein coding genes) and Table S6 (for RGAs only). The instructions for this program are described in User guide S1.
3. Results
3.1. Mapping QTL onto the Most Recent Release of the Chromosome-Scale Pseudomolecules
In all 14 publications reporting flax QTL, only 67 newly reported pasmo QTL and 46 QTNs associated with seed length, seed weight and 1000-seed weight were based on the RCPs [14,30]. Therefore, the mapping of the remaining 200 QTL onto the RCPs was performed. A total of 195 QTL uniquely mapped to the RCPs of 15 chromosomes, including 40 SSRs and 36 SNPs from genetic maps, 75 SNPs from the scaffolds, and 44 SNPs from the PCPs (Figure 1 and Table 3). Markers afB13 and afXR6 for two powdery mildew QTL were not mapped because their AFLP primer sequences were not available [24]. One QTL for branching score failed to map because its SSR marker Lu2067a could not be mapped to any region on the RCPs; this was likely because the marker was designed from a genotype different from the reference genome (cv CDC Bethune). Finally, the marker Lu8_185009 for QTL uq.C8–2 associated with plant height (PLH) and technical length (TL) [18] mapped to two different chromosomes (Chr 4 and Chr 7).
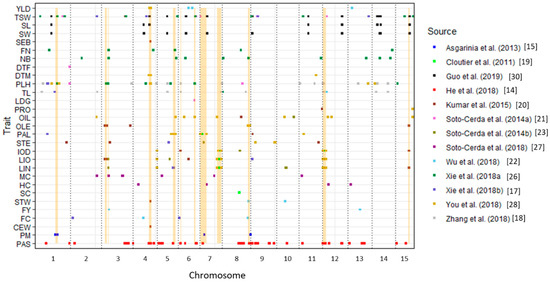
Figure 1.
Distribution of 308 QTL associated with 29 traits mapped onto flax chromosomes. Of these QTL, 67 for pasmo resistance and 46 for thousand-seed weight, seed width and seed length have been previously mapped on the most recent release of the flax chromosome-scale pseudomolecules [14,30]. Two fusarium wilt QTL [24] were not included because of incomplete information. Co-located regions are highlighted in yellow. See Table 1 for the trait name abbreviations.
Table 3.
QTL mapped to the recently released chromosome-scale pseudomolecules.
It is important to pinpoint that the SSRs/SNPs corresponding to a single marker or a pair of flanking markers from genetic maps were mapped to a genomic region on a pseudomolecule, while the SNPs from the scaffold sequences or the PCPs were anchored exclusively to single nucleotide positions representing their QTL peak locations.
3.2. Identical or Co-Located QTL
QTL that mapped to the same RCPs were comparable across studies, mapping populations, and traits. Based on the 200 kb upstream and downstream region rule, the 195 QTL/markers for the 26 traits mapped to the RCPs were grouped into 133 QTL clusters (Table 3). The QTL with the same numbers in the “Co-location” column in Table 3 were deemed to belong to the same QTL clusters, indicating identical or co-located QTL. QTL for 16 of the 29 traits were identified in two or more studies, of which 12 had one or more QTL located at the same positions or within the same QTL clusters (Table 1), thereby supporting the accuracy of the QTL through validation across studies.
Some QTL were validated in several studies that differed in marker types (SSRs or SNPs), populations (bi-parental population or diverse germplasm panel), or statistical methods used for QTL mapping (Table 1 and Table 2). For example, QTL-195 (QDTM-Lu4.1) and QTL-54 (QDm.BM.crc-LG4) on Chr 4 corresponded to the same QTL for days to maturity (DTM) identified in two different studies [20,28]. QTL-187 (QIOD-Lu7.2) and QTL-7 (QIod.crc-LG7) on Chr 7 for iodine value (IOD) [19,28], QTL-190 (QLIN-Lu7.2) and QTL-5 (QLin.crc-LG7) on Chr 7 for linolenic acid content (LIN) [19,28], QTL-6 (QLin.crc-LG16) and QTL-33 (QLin-LG12.3) on Chr 12 for LIN [19,23], and QTL-4 (QLio.crc-LG16) and QTL-30 (QLio-LG12.3) on Chr 12 for linoleic acid content (LIO) [19,23] were additional examples of the same QTL identified in different studies. Some QTL or QTNs were grouped into single QTL because their coordinates on chromosomes were close or identical and, historical recombinations may not have been present in the population; for example, QTL-144 (scaffold11-96400) and QTL-145 (scaffold11-96569) on Chr 1 for steric acid content (STE) [17], and QTL-155 (scaffold297-275131), QTL-100 (scaffold297_275113), and QTL-154 (scaffold297-275113) on Chr 1 for technical length (TL) corresponded to unique QTL (Co-location cluster No. 46 and 9 in Table 3) [17,26].
Some co-located QTL may lead to their pleiotropic effects on multiple traits. Thirteen genomic regions that had at least three identical or co-located QTL were observed (yellow highlights in Figure 1 and Table 3). For example, eight QTL—QTL-195 (QDTM-Lu4.1), QTL-168 (QYLD-Lu4.1), QTL-179 (QPLH-Lu4.3), QTL-49 (QCw.BM.crc-LG4), QTL-54 (QDm.BM.crc-LG4), QTL-52 (QSpb.BM.crc-LG4), QTL-50 (QSw.BM.crc-LG4), and QTL-53 (QYld.BM.crc-LG4)—were co-located between positions 13,170,489 and 15,040,682 bp on Chr 4 and had pleiotropic effects on phenotypes of six traits: DTM, YLD, PLH, cell wall content (%) (CEW), seeds per boll (SEB), and straw weight (STW). Thus, this is an important genomic region controlling seed yield and related agronomic traits. As noted and discussed previously [19,20,28], QTL-186 (QIOD-Lu4.1), QTL-189 (LIN-Lu4.1), and QTL-192 (QLIO-Lu4.1) were co-located at position 19,907,982 bp on Chr 4; QTL-193 (QLIO-Lu7.2), QTL-190 (QLIN-Lu7.2), QTL-187 (QIOD-Lu7.2), QTL-7 (QIod.crc-LG7), QTL-5 (QLin.crc-LG7), and QTL-3 (QLio.crc-LG7) were between positions 14,540,252 and 17,976,903 bp on Chr 7; QTL-188 (QIOD-Lu12.3), QTL-191 (QLIN-Lu12.3), and QTL-194 (QLIO-Lu12.3) located in the 489,561 and 2,981,562 bp interval on Chr 12; and QTL-6 (QLin.crc-LG16), QTL-33 (QLin-LG12.3), QTL-4 (QLio.crc-LG16), QTL-30 (QLio-LG12.3), and QTL-8 (QIod.crc-LG16) positioned between 2,036,216 and 3,802,807 bp on Chr 12. These four genomic regions contributed greatly to the genetic variation for LIO, LIN, and IOD in several flax populations [19,20,28].
3.3. Candidate Genes for QTL
The resolution of current QTL mapping or GWAS technologies is insufficient to pin QTL to accurate locations of genes or genetic features controlling traits. A simple approach for predicting candidate genes is to investigate the annotated genes in the vicinity of QTL, such as a window of 200 kb flanking the QTL [14,20]. Our ability to position most of the previously reported QTL to the RCPs makes it possible to perform an overall genome-wide candidate gene scan along chromosomes. Thus, all potential candidate genes of the 195 QTL listed in Table 3 were scanned. A total of 7,821 unique candidate genes co-located with the 133 QTL clusters (Table S7). These candidate genes can be further analysed and validated. For example, three QTL for powdery mildew resistance were identified [15] and mapped to chromosomes 1, 7, and 9 (Table 3, Figure 1). Some RGAs were found in the vicinity of the QTL, i.e., within the pre-defined window (Table 4). One nucleotide-binding-site (NBS) encoding gene (Lus10026765), one transmembrane coiled-coil (TM-CC) gene (Lus10023437), and several receptor-like protein kinase (RLK) genes co-located with these QTL.
Table 4.
Resistant gene analog (RGA) candidates near three QTL for flax powdery mildew resistance.
4. Discussion
The RCPs, representing the first chromosome-scale flax reference sequence, were released to the NCBI database in 2018 [29]. This new flax genome reference has previously been adopted for genomic studies, such as QTL identification. Prior to this release, many QTL had been identified based on different reference sequence versions (Table 2); thus, it is necessary to re-map these QTL onto the most recent and comprehensive flax reference (RCP). In addition, some research groups have already adopted the scaffold-based reference to identify SNPs and have performed other genomic studies. Consequently, more current methods and software tools are required for this re-mapping. For this purpose, we developed several utility tools, including scripts for mapping PCR- and SNP-based QTL onto the RCPs, grouping QTL in terms of a predefined window size, and performing genome-wide candidate gene analysis. These tools were successfully used to map 195 out of 200 QTL onto the new reference. Only five QTL failed to map because of incomplete information. This demonstrates the reliability and robustness of the methods, especially those for mapping the scaffold-based SNPs to the new reference, which is unique to this study. No other methods were available because this conversion must be based on the accurate coordinates of the scaffolds on pseudomolecules that were generated by the authors of this article [29]. The QTL positioned onto the RCPs and their gene candidates can be further validated and analysed on a genome-wide basis. Comparability across different studies and genetic populations will facilitate their further evaluation for applications in flax breeding.
The methods and the computer scripts described here are not only suitable for flax, but are also applicable to other crops. In wheat, for example, a large number of PCR- and SNP-based markers have been developed from different genetic maps and many versions of reference sequences, which are deposited in genome databases such as GrainGenes (https://wheat.pw.usda.gov/GG3/) and T3/Wheat (https://triticeaetoolbox.org/wheat/). However, the first version of the chromosome-based reference sequence (RefSeq v1.0) was just recently released by the International Wheat Genome Sequencing Consortium [32]. Thus, the re-mapping of existing markers onto the new wheat reference necessitates software tools. Program S1 and Program S2, which adopted the widely accepted E-PCR tool [31] to map PCR primers to a reference, can be directly used for the mapping of the existing PCR-based markers to the new reference. In addition, the basic methodology of Program S3 and Program S4 is useful for the development of new tools specifically based on the wheat reference and gene annotation databases.
It is noteworthy that the gene annotation information of the new flax reference was not available in the NCBI or in any other databases or publications. Although being reported through personal communications, this is the first release of the complete gene annotation of the chromosome-scale flax reference (Table S4). This information is presented in addition to the flax reference [29] to facilitate genome-wide candidate gene analysis of QTL along chromosomes and other genomic studies. The RGAs, a subset of the flax genes (Table S6), are also useful for candidate gene prediction of disease resistance QTL.
5. Conclusions
This article details the methods, software tools, and database files developed to uniquely map the QTL previously identified from different references onto the RCPs. The methodology can be used not only for flax, but also for other crops. Using the methodology described here, 195 out of 200 PCR- and SNP-based QTL markers that were not based on the RCPs were successfully sorted into the 15 chromosomes of the RCPs and grouped into 133 co-located QTL clusters, thereby demonstrating genomic regions associated with, and/or pleiotropic to, important agronomic and seed quality traits. These re-mapped chromosome-based QTL can be easily compared across studies and facilitate genome-wide QTL analysis, candidate gene prediction, and further validation for breeding applications.
Supplementary Materials
The following are available online at https://www.mdpi.com/2409-9279/3/2/28/s1. Table S1. Information related to the pseudomolecules of 15 chromosomes in the NCBI database. The downloaded sequences from NCBI are used as input for Program S1. Table S2. Primer sequences of SSR markers for the identified QTL. Table S3. Flanking sequences of SNP markers for the identified QTL. Table S4. Coordinates of flax scaffold sequences on the most recent release of the chromosome-scale pseudomolecules. This file is used as input for Program S2. Table S5. Coordinates and annotations of flax protein coding genes on the most recent release of the chromosome-scale pseudomolecules. This file is used as input for Program S4. Table S6. Coordinates and annotations of flax resistance gene analogs on the recently released chromosome-scale pseudomolecules. This file is used as input for Program S4. Table S7. Candidate gene prediction of the 200 QTL in Table 3. Program S1. A Perl script to prepare a search database of reference sequences for electronic PCR. Program file name: ProgramS1_prepare_rePCR.pl. Program S2. A Perl script to perform electronic PCR, i.e., map a pair of PCR primer sequences to a reference sequence. Program file name: ProgramS2_rePCR_pipeline.pl. Program S3. A Perl script to convert coordinates of flax scaffold sequences onto the chromosome-scale pseudomolecules. Program file name: ProgramS3_convert_scaffold_coordinates_to_pseudochr.pl. Program S4. A Perl script to extract all candidate genes and gene annotation information (protein-coding genes or specifically resistance gene analogs) within a genomic region of a QTL or a marker. Program file name: ProgramS4_flax_QTL_candidate_gene_scanning.pl User guide S1. A user guide for executions of Programs S1, S2, S3, and S4. All programs are also available in the gitHub site: https://github.com/ORDC-Crop-Bioinformatics/Mapping_QTL_in_Flax.
Author Contributions
Conceptualization, F.M.Y.; methodology, F.M.Y.; software, F.M.Y.; validation, F.M.Y. and S.C.; formal analysis, F.M.Y. and S.C.; investigation, F.M.Y. and S.C.; writing—original draft preparation, F.M.Y.; writing—review and editing, S.C. All authors have read and agreed to the published version of the manuscript.
Funding
This research was funded by Agriculture and Agri-Food Canada, Projects J-001672 and J-002035.
Acknowledgments
The authors thank Zhen Yao for figure editing, Chunfang Zheng for the GitHub web site and Madeleine Lévesque-Lemay for editing of the manuscript.
Conflicts of Interest
The authors declare no conflict of interest.
References
- Falconer, D.S. Introduction to Quantitative Genetics; Oliver & Boyd: Edinburgh/London, UK, 1960. [Google Scholar]
- Sehgal, D.; Singh, R.; Rajpal, V.R. Quantitative trait loci mapping in plants: Concepts and approaches. In Molecular Breeding for Sustainable Crop Improvement; Rajpal, V.R., Rao, S.R., Raina, S.N., Eds.; Springer: Berlin/Heidelberg, Germany, 2016; Volume 11, pp. 31–59. [Google Scholar]
- Price, A.H. Believe it or not, QTLs are accurate! Trends Plant Sci. 2006, 11, 213–216. [Google Scholar] [CrossRef] [PubMed]
- Yu, J.; Holland, J.B.; McMullen, M.D.; Buckler, E.S. Genetic design and statistical power of nested association mapping in maize. Genetics 2008, 178, 539–551. [Google Scholar] [CrossRef] [PubMed]
- Monir, M.M.; Zhu, J. Dominance and epistasis interactions revealed as important variants for leaf traits of maize NAM population. Front. Plant Sci. 2018, 9, 627. [Google Scholar] [CrossRef] [PubMed]
- Ren, D.; Fang, X.; Jiang, P.; Zhang, G.; Hu, J.; Wang, X.; Meng, Q.; Cui, W.; Lan, S.; Ma, X.; et al. Genetic architecture of nitrogen-deficiency tolerance in wheat seedlings based on a nested association mapping (NAM) population. Front. Plant Sci. 2018, 9, 845. [Google Scholar] [CrossRef]
- Cavanagh, C.; Morell, M.; Mackay, I.; Powell, W. From mutations to MAGIC: Resources for gene discovery, validation and delivery in crop plants. Curr. Opin. Plant Biol. 2008, 11, 215–221. [Google Scholar] [CrossRef]
- Mackay, I.; Powell, W. Methods for linkage disequilibrium mapping in crops. Trends Plant Sci. 2007, 12, 57–63. [Google Scholar] [CrossRef]
- Camargo, A.V.; Mackay, I.; Mott, R.; Han, J.; Doonan, J.H.; Askew, K.; Corke, F.; Williams, K.; Bentley, A.R. Functional mapping of quantitative trait loci (QTLs) associated with plant performance in a wheat MAGIC mapping population. Front. Plant Sci. 2018, 9, 887. [Google Scholar] [CrossRef]
- Ongom, P.O.; Ejeta, G. Mating design and genetic structure of a multi-parent advanced generation intercross (MAGIC) population of sorghum (Sorghum bicolor (L.) Moench). Genes Genomes Genet. G3 2018, 8, 331–341. [Google Scholar] [CrossRef]
- Cloutier, S.; Miranda, E.; Ward, K.; Radovanovic, N.; Reimer, E.; Walichnowski, A.; Datla, R.; Rowland, G.; Duguid, S.; Ragupathy, R. Simple sequence repeat marker development from bacterial artificial chromosome end sequences and expressed sequence tags of flax (Linum usitatissimum L.). Theor. Appl. Genet. 2012, 125, 685–694. [Google Scholar] [CrossRef]
- Cloutier, S.; Niu, Z.; Datla, R.; Duguid, S. Development and analysis of EST-SSRs for flax (Linum usitatissimum L.). Theor. Appl. Genet. 2009, 119, 53–63. [Google Scholar] [CrossRef]
- Kumar, S.; You, F.M.; Cloutier, S. Genome wide SNP discovery in flax through next generation sequencing of reduced representation libraries. BMC Genom. 2012, 13, 684. [Google Scholar] [CrossRef] [PubMed]
- He, L.; Xiao, J.; Rashid, K.Y.; Yao, Z.; Li, P.; Jia, G.; Wang, X.; Cloutier, S.; You, F.M. Genome-wide association studies for pasmo resistance in flax (Linum usitatissimum L.). Front. Plant Sci. 2018, 9, 1982. [Google Scholar] [CrossRef] [PubMed]
- Asgarinia, P.; Cloutier, S.; Duguid, S.; Rashid, K.; Mirlohi, A.; Banik, M.; Saeidi, G. Mapping quantitative trait loci for powdery mildew resistance in flax (Linum usitatissimum L.). Crop Sci. 2013, 53, 2462–2472. [Google Scholar] [CrossRef]
- Cloutier, S.; Ragupathy, R.; Miranda, E.; Radovanovic, N.; Reimer, E.; Walichnowski, A.; Ward, K.; Rowland, G.; Duguid, S.; Banik, M. Integrated consensus genetic and physical maps of flax (Linum usitatissimum L.). Theor. Appl. Genet. 2012, 125, 1783–1795. [Google Scholar] [CrossRef]
- Xie, D.; Dai, Z.; Yang, Z.; Tang, Q.; Sun, J.; Yang, X.; Song, X.; Lu, Y.; Zhao, D.; Zhang, L.; et al. Genomic variations and association study of agronomic traits in flax. BMC Genom. 2018, 19, 512. [Google Scholar] [CrossRef]
- Zhang, J.; Long, Y.; Wang, L.; Dang, Z.; Zhang, T.; Song, X.; Dang, Z.; Pei, X. Consensus genetic linkage map construction and QTL mapping for plant height-related traits in linseed flax (Linum usitatissimum L.). BMC Plant Biol. 2018, 18, 160. [Google Scholar] [CrossRef]
- Cloutier, S.; Ragupathy, R.; Niu, Z.; Duguid, S. SSR-based linkage map of flax (Linum usitatissimum L.) and mapping of QTLs underlying fatty acid composition traits. Mol. Breed. 2011, 28, 437–451. [Google Scholar] [CrossRef]
- Kumar, S.; You, F.M.; Duguid, S.; Booker, H.; Rowland, G.; Cloutier, S. QTL for fatty acid composition and yield in linseed (Linum usitatissimum L.). Theor. Appl. Genet. 2015, 128, 965–984. [Google Scholar] [CrossRef]
- Soto-Cerda, B.J.; Duguid, S.; Booker, H.; Rowland, G.; Diederichsen, A.; Cloutier, S. Genomic regions underlying agronomic traits in linseed (Linum usitatissimum L.) as revealed by association mapping. J. Integr. Plant Biol. 2014, 56, 75–87. [Google Scholar] [CrossRef]
- Wu, J.; Zhao, Q.; Zhang, L.; Li, S.; Ma, Y.; Pan, L.; Lin, H.; Wu, G.; Yuan, H.; Yu, Y.; et al. QTL mapping of fiber-related traits based on a high-density genetic map in flax (Linum usitatissimum L.). Front. Plant Sci. 2018, 9, 885. [Google Scholar] [CrossRef]
- Soto-Cerda, B.J.; Duguid, S.; Booker, H.; Rowland, G.; Diederichsen, A.; Cloutier, S. Association mapping of seed quality traits using the Canadian flax (Linum usitatissimum L.) core collection. Theor. Appl. Genet. 2014, 127, 881–896. [Google Scholar] [CrossRef] [PubMed]
- Spielmeyer, W.; Green, A.G.; Bittisnich, D.; Mendham, N.; Lagudah, E.S. Identification of quantitative trait loci contributing to Fusarium wilt resistance on an AFLP linkage map of flax (Linum usitatissimum). Theor. Appl. Genet. 1998, 97, 633–641. [Google Scholar] [CrossRef]
- Wang, Z.; Hobson, N.; Galindo, L.; Zhu, S.; Shi, D.; McDill, J.; Yang, L.; Hawkins, S.; Neutelings, G.; Datla, R.; et al. The genome of flax (Linum usitatissimum) assembled de novo from short shotgun sequence reads. Plant J. 2012, 72, 461–473. [Google Scholar] [CrossRef] [PubMed]
- Xie, D.; Dai, Z.; Yang, Z.; Sun, J.; Zhao, D.; Yang, X.; Zhang, L.; Tang, Q.; Su, J. Genome-wide association study identifying candidate genes influencing important agronomic traits of flax (Linum usitatissimum L.) using SLAF-seq. Front. Plant Sci. 2018, 8, 2232. [Google Scholar] [CrossRef]
- Soto-Cerda, B.J.; Cloutier, S.; Quian, R.; Gajardo, H.A.; Olivos, M.; You, F.M. Genome-wide association analysis of mucilage and hull content in flax (Linum usitatissimum L.) seeds. Int. J. Mol. Sci. 2018, 19, 2870. [Google Scholar] [CrossRef]
- You, F.M.; Xiao, J.; Li, P.; Yao, Z.; Jia, G.; He, L.; Kumar, S.; Soto-Cerda, B.; Duguid, S.D.; Booker, H.M.; et al. Genome-wide association study and selection signatures detect genomic regions associated with seed yield and oil quality in flax. Int. J. Mol. Sci. 2018, 19, 2303. [Google Scholar] [CrossRef]
- You, F.M.; Xiao, J.; Li, P.; Yao, Z.; Jia, G.; He, L.; Zhu, T.; Luo, M.-C.; Wang, X.; Deyholos, M.K.; et al. Chromosome-scale pseudomolecules refined by optical, physical, and genetic maps in flax. Plant J. 2018, 95, 371–384. [Google Scholar] [CrossRef]
- Guo, D.; Jiang, H.; Yan, W.; Yang, L.; Ye, J.; Wang, Y.; Yan, Q.; Chen, J.; Gao, Y.; Duan, L.; et al. Resequencing 200 flax cultivated accessions identifies candidate genes related to seed size and weight and reveals signatures of artificial selection. Front. Plant Sci. 2019, 10, 1682. [Google Scholar] [CrossRef]
- Schuler, G.D. Sequence mapping by electronic PCR. Genome Res. 1997, 7, 541–550. [Google Scholar] [CrossRef]
- Appels, R.; Eversole, K.; Feuillet, C.; Keller, B.; Rogers, J.; Stein, N.; Pozniak, C.J.; Choulet, F.; Distelfeld, A.; Poland, J.; et al. Shifting the limits in wheat research and breeding using a fully annotated reference genome. Science 2018, 361, eaar7191. [Google Scholar] [CrossRef]
© 2020 by the authors. Licensee MDPI, Basel, Switzerland. This article is an open access article distributed under the terms and conditions of the Creative Commons Attribution (CC BY) license (http://creativecommons.org/licenses/by/4.0/).