Tomography, Volume 11, Issue 8 (August 2025) – 12 articles
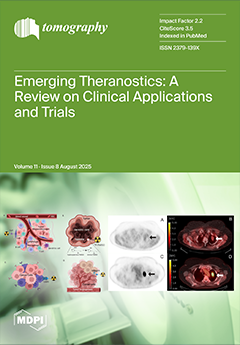
Left: Demonstration of the molecular context of radioligands targeting (A) fibroblast activation protein (FAP); (B) hypoxia; (C) gastrin-releasing peptide receptor (GRPr); and (D) integrin. Each process is part of the complex tumor microenvironment, which allows for high tumor-to-background uptake ratios on PET imaging.
Right: Representative images obtained from a patient with non-small-cell lung cancer demonstrating radiotracer-avid primary lung neoplasm at the left lung apex (arrows). (A–B) Fluorine 18 (18F)-labeled Fluoromisonidazole (FMISO) PET/CT images. (A) 18F–FMISO axial PET image; (B) axial fused 18F-FMISO PET/CT image with an SUV max of 2.5. (C–D) Fluorine 18 (18F)-labeled Fluorodeoxyglucose (FDG) PET/CT images of the same patient performed 1 week prior. (C) 18F-FDG axial PET image; (D) axial fused 18F-FDG PET/CT image demonstrating intense avidity with an SUV max of 24. View this paper
- Issues are regarded as officially published after their release is announced to the table of contents alert mailing list.
- You may sign up for e-mail alerts to receive table of contents of newly released issues.
- PDF is the official format for papers published in both, html and pdf forms. To view the papers in pdf format, click on the "PDF Full-text" link, and use the free Adobe Reader to open them.


