Abstract
Background/Objectives: Accurate prediction of pediatric appendicitis diagnosis, management, and severity is critical for clinical decision-making. We aimed to evaluate the predictive performance of a wide range of machine learning models, combined with various feature selection techniques, on a pediatric appendicitis dataset. A particular focus was placed on the role of ultrasound (US) image-descriptive features in model performance and explainability. Methods: We conducted a retrospective cohort study on a dataset of 781 pediatric patients aged 0–18 presenting to Children’s Hospital St. Hedwig in Regensburg, Germany, between January 2016 and February 2023. We developed and validated predictive models; machine learning algorithms included the random forest, logistic regression, stochastic gradient descent, and the light gradient boosting machine (LGBM). These were paired exhaustively with feature selection methods spanning filter-based (association and prediction), embedded (LGBM and linear), and a novel redundancy-aware step-up wrapper approach. We employed a machine learning benchmarking study design where AI models were trained to predict diagnosis, management, and severity outcomes, both with and without US image-descriptive features, and evaluated on held-out testing samples. Model performance was assessed using overall accuracy and area under the receiver operating characteristic curve (AUROC). A deep learner optimized for tabular data, GANDALF, was also evaluated in these applications. Results: US features significantly improved diagnostic accuracy, supporting their use in reducing model bias. However, they were not essential for maximizing accuracy in predicting management or severity. In summary, our best-performing models were, for diagnosis, the random forest with embedded LGBM feature selection (98.1% accuracy, AUROC: 0.993), for management, the random forest without feature selection (93.9% accuracy, AUROC: 0.980), and for severity, the LGBM with filter-based association feature selection (90.1% accuracy, AUROC: 0.931). Conclusions: Our results demonstrate that high-performing, interpretable machine learning models can predict key clinical outcomes in pediatric appendicitis. US image features improve diagnostic accuracy but are not critical for predicting management or severity.
1. Introduction
Pediatric appendicitis is characterized by inflammation of the appendix found in patients aged eighteen years and younger. When inflamed, the appendix causes pain and can lead to serious complications for the patient, including peritonitis and infection [1]. Symptoms can include nausea, loss of appetite, constipation, bloating, and abdominal pain [1]. Symptoms are not always easily identified or caught in time in younger patients, as they may not communicate as well and often experience fewer symptoms [2]. Appendicitis is typically caused by a blockage in the lumen, leading to an infection that then causes the appendix to expand and potentially burst [1]. While appendicitis can occur in both males and females, males have been found to be at a slightly higher risk, and most cases occur between the ages of ten and thirty [1]. A highly effective way to diagnose appendicitis is to evaluate the current state of the appendix using medical imaging. This is performed through computed tomography (CT), ultrasound (US), or magnetic resonance imaging (MRI), with CT being the most accurate of the three [3]. A shortcoming of these imaging techniques is that they are expensive and potentially time-consuming. MRI may not always be readily accessible due to high costs, limited availability, and the need for specialized interpretation, all of which can delay diagnosis and treatment. Additionally, CT relies upon ionizing radiation, which for most adults is safe, but may be risky for younger patients due to the radiation’s potential negative effects on their growing bodies [3].
Supervised machine learning is a common technology applied to predictive applications, such as diagnosing a given medical condition. The algorithms are provided with ground-truth training data, which are represented by sets of samples/instances, each containing a set of feature measurements that can inform predictions, and a target variable to be predicted. During training, algorithms establish complex correlational relationships between predictor variables and the target variable, supporting the creation of technologies that can be relied upon to make predictions on samples that were not trained upon. As such, as long as correlations exist between predictor variables and the target variable, AI has the potential to create highly accurate predictive models.
Using artificial intelligence technologies to diagnose appendicitis has been the subject of previous analyses. One study from Saudi Arabia used K-nearest neighbours (KNN), decision trees (DT), bagging, and stacking to identify acute appendicitis and found their stacking model to be the most successful with training accuracy, testing accuracy, testing precision, and testing F1 scores of 97.51%, 92.63%, 95.29%, and 92.04%, respectively [4]. From their study, they found their most important features to be neutrophils, white blood cell count, length of stay, and symptom days for their stacking model [4]. Another study [5] was conducted using results from previous studies [6,7,8,9,10,11,12,13,14,15,16,17,18,19,20,21,22,23,24,25,26,27,28,29,30,31,32,33,34] to determine whether using AI models is an effective way for diagnosing acute appendicitis in adults. This review analyzed twenty-nine studies on diagnosis and prognosis of acute appendicitis, and found that the model most commonly used was the artificial neural network (ANN) [5]. These ANNs produced accuracy scores typically above 80% with some reporting the area under the receiver operating characteristic curve (AUC) nearing 0.99 [5]. However, it should be noted that this analysis was based on an adult population, and so the findings therein may not hold in a pediatric population.
Several recent studies have applied machine learning approaches to pediatric appendicitis using subsets of the dataset analyzed in the present work. A foundational study [35] on a subset of the dataset addressed in this research [36] was previously conducted and included 430 patients. The machine learning models used were logistic regression, random forest, and generalized boosted regression model, all in the R programming language. Their results are summarized: “A random forest classifier achieved areas under the precision-recall curve of 0.94, 0.92, and 0.70, respectively, for the diagnosis, management, and severity of appendicitis”, based on held-out test samples as part of 10-fold validation [35]. A subsequent analysis, as part of a larger team, was performed using a larger subset (579 patients) of the dataset addressed in this study to diagnose pediatric appendicitis using deep learning methods with concept bottleneck models (CBMs) with a primary focus on the ultrasound images [37]. While the dataset contains images and corresponding descriptions of the images, some patients included do not contain a complete set of all of these features. The images are taken from multiple views of the same target area to help ensure imaging has captured key features of the appendix being analyzed. To handle this, the study used a semi-supervised extension in addition to the CBM [37]. They first used a shared encoder neural network to map the images to features, which are then aggregated across imaging views to produce representations and concepts understandable by humans, contributing to the prediction of the target class [37]. Results of 0.80 AUROC were reported for predicting the diagnosis of appendicitis. Two additional studies have been conducted on the updated dataset used in this analysis, focused exclusively on diagnosis [38,39]. This includes an approach achieving 94.5% accuracy with the random forest [38], and an approach based on the Hybrid Bat algorithm achieving 94% accuracy [39]. An additional analysis focused on diagnosis and severity [40] but did not report accuracy statistics.
Hypotheses and Contributions
Our objective in this study is to address the following hypotheses. We hypothesize that:
- ▪
- The use of open-source machine learning software applied to the Regensburg Pediatric Appendicitis Dataset may produce useful technology for predicting aspects of pediatric appendicitis patient care.
- ▪
- By creating technologies that can predict diagnosis, severity, and management of pediatric appendicitis, both by using and withholding US image-derived features, we can assess the apparent value of US imaging in the context of AI predictive technology.
- ▪
- Our models will be able to more accurately predict their respective target variables (diagnosis, management, and severity), as compared to previous works on this topic, by thoroughly examining a large set of combinations of machine learning and feature selection algorithms.
- ▪
- Feature selection subsets will be informative to clinicians and researchers as to factors that are predictive of diagnosis, management, and severity of pediatric appendicitis, respectively.
Contributions provided by this study include the consideration of a large selection of feature selection (FS) algorithms, including a novel redundancy-aware FS algorithm developed in our lab, consideration of novel subsets of features identified by FS, consideration of a variety of high-performing machine learning algorithms, including the computationally efficient light gradient boosting machine and a deep learner optimized for tabular data, known as Gandalf, evaluation of our study findings on an updated pediatric appendicitis dataset with more patients/samples than those included in the early work on this topic, confirmation of the value of ultrasound imaging features as assisting in mitigating bias in prediction for diagnosis of appendicitis, and finally, demonstrating strong predictive performance from the models developed across three AI applications in pediatric appendicitis.
We introduced an overview of pediatric appendicitis, related AI technological development, and closely related work on the same dataset in Section 1, as well as provided a Hypotheses and Contributions subsection. The rest of the paper will proceed as follows: we will provide a study design overview in Section 2.1, an outline of the study participants in Section 2.2, a detailed dataset description of the variables/measurements in Section 2.3, an outline of the preprocessing performed on the dataset in Section 2.4, the machine learning methods used are presented in Section 2.5, and the statistics relied upon for machine learning evaluation are presented in Section 2.6. The results for predicting diagnosis are provided in Section 3.1, the results for predicting management are provided in Section 3.2, the results for predicting severity are provided in Section 3.3, and the Gandalf deep learner results are provided in Section 3.4. A discussion of interactions between machine learning and feature selection technologies employed is provided in Section 4.1, a discussion of Gandalf results is provided in Section 4.2, a discussion of the value of Ultrasound features is provided in Section 4.3, a literature comparison is provided in Section 4.4, future work is presented in Section 4.5, followed by our conclusions in Section 5.
2. Materials and Methods
2.1. Study Design Overview
We conducted a retrospective cohort study on a dataset of 781 pediatric patients aged 0–18 presenting to Children’s Hospital St. Hedwig in Regensburg, Germany, between January 2016 and February 2023. This study employed a comparative AI benchmarking approach using publicly available benchmarking software applied to an open-access pediatric appendicitis dataset. The analysis covered three clinical tasks: diagnosis (the AI is tasked with performing a diagnosis of appendicitis or not), management (the AI is tasked with predicting the treatment option for the patient), and severity (the AI is tasked with predicting the state of the patient’s appendicitis). The potential value from the inclusion of ultrasound image features was considered for all applications. This study was performed retrospectively on a public domain dataset; as such, no ethics committee approval was required for this analysis.
2.2. Participants
The dataset examined was initially assembled by Marcinkevičs et al., and their analysis was previously published [35]. The dataset was revisited [37] with an extended observation timeline, more patients, and additionally collected ultrasound images for many of the patients. The dataset previously studied [37] included records for 579 patients, whereas we examined an updated version of this dataset with 781 observations. The data was obtained from patients admitted to the tertiary Children’s Hospital St. Hedwig in Regensburg, Germany, with suspected appendicitis between 2016 and 2021. All aspects of the methods of this study were completed by the study authors except for the patient recruitment and data acquisition/curation previously completed [35,37].
2.3. Variables/Measurements
Patient data included demographic information, clinical examinations, laboratory tests, scoring results, and (potentially multiple per patient) ultrasound (US) images and expert-interpreted findings from the images. Descriptions of the feature measurements and target variables are detailed in Table 1, Table 2 and Table 3, and their numeric feature distributions in Table 4. The categorical feature statistics tables have also been provided in Appendix A (Table A1, Table A2 and Table A3). Detailed feature descriptions are also provided in Appendix A, broken down for different feature types, see Table A4, Table A5, Table A6, Table A7, Table A8 and Table A9. Note that there was a single patient/sample with a missing diagnosis field in this dataset; as such, it needed to be excluded from the diagnosis application, resulting in a count of 780 samples for the diagnosis application, whereas we were able to maintain the full sample count of 781 for the remaining two target variable applications. Predictive models were created to target the same three variables previously targeted [35] for binary classification:

Table 1.
Diagnosis target variable.
Table 2.
Management target variable.
Table 3.
Severity target variable.
Table 4.
Numeric feature statistics for patients with and without appendicitis.
- Diagnosis: Appendicitis (n = 463, 59.36%) or no appendicitis (n = 317, 40.64%).
- Management: Surgical (n = 298, 38.16%) or conservative (n = 483, 61.84%).
- Severity: Complicated (n = 119, 15.24%) or uncomplicated (n = 662, 84.76%).
2.4. Data Preprocessing
Df-analyze, the software relied upon for our machine learning and feature selection analysis, performs its own data cleaning [41], so null value handling was left to its imputation feature with median selection. A variety of preprocessing steps were applied prior to the use of df-analyze. The US number was dropped as it acted as a unique ID. All urine sample features were converted from categorical features to an ordinal scale from 0 to 3, so the relationship between values was encapsulated in the feature encodings. The management target variable was reduced to a binary class by combining primary surgical, secondary surgical, and simultaneous appendectomy in a single surgical class, as df-analyze requires substantial class representation for all target values for its validation to function. The data summary suggests secondary surgical management indicates surgery after their initial stay, when the patient data was recorded. As part of the previous analysis [35], patients were contacted at least 6 months after discharge and classified their management as (secondary) surgical if they had since had an appendectomy. As was previously investigated [35], we predict whether a patient required surgery, as it could potentially prevent a second visit to the hospital. Length of stay was also dropped from the dataset, as we have created technologies with potential real-world utility, in which we would want to be able to predict important target variables, such as diagnosis, severity, and management as early on in their hospital admission as possible, and we cannot establish the correct length of stay value for each patient until the end of their hospitalization.
The presumptive diagnosis feature may not always match the final diagnosis and may provide additional information reinforced by the managing doctors’ education and expertise, which could be particularly useful in smaller datasets. However, the feature may bias a machine learning model, or in real-world applications, may not be available for input. As such, this feature was excluded from our dataset.
Lymph Nodes Location, Abscess Location, and Gynecological findings were excluded from our dataset, as they were all described as free-form text, mostly in German. When divided into classes by unique values, Abscess Location and Gynecological findings’ largest class had fewer than 20 instances, which is too few for informing reliable predictions in df-analyze [41]. Lymph Nodes Location had some unique values with at least 20 instances, but many of its classes were combinations of others, and the feature is null for more than 80% of records; as such, it was also excluded. To facilitate reproducibility, custom pre-processing code for this dataset is provided in clean-tabular-dataset.py [42].
2.5. Machine Learning
The machine learning software used in this study is df-analyze [41]. The models considered in this study include the light gradient boosting machine (LGBM), random forest (RF), linear regression (LR), stochastic gradient descent (SGD), k-nearest neighbours (KNN), and a dummy model that predicts the class with the largest number of samples as a baseline. Df-analyze also supports assessment of a variety of feature selection (FS) technologies [41], each of which is exhaustively combined with all supported aforementioned machine learning methods. This includes two types of filter-based FS: association (assoc) and prediction (pred) [41], two types of embedded FS: linear (embed_linear) and LGBM (embed_lgbm) [41], and an emerging redundancy-aware step-up feature selection method (wrap) unique to df-analyze [43], as well as no (none) FS. The target features in this study were predicted from exhaustive combinations of supported machine learning and FS algorithms trained and tested individually as part of a fair comparison validation. For each target variable, models are constructed with each FS method. Optuna hyperparameter tuning is supported in df-analyze [41] and was used in this analysis for all machine learning techniques.
The code for running all configurations of our dataset with command line interfaces (CLIs) is provided in run-df-analyze.sh [42]. Each target variable was run with and without US image features. Thus, our analysis involves six runs of df-analyze as follows:
- Targeting Diagnosis with US Image Features Included;
- Targeting Diagnosis without US Image Features Included;
- Targeting Management with US Image Features Included;
- Targeting Management without US Image Features Included;
- Targeting Severity with US Image Features Included;
- Targeting Severity without US Image Features Included.
2.6. Statistical Analysis
Df-analyze conducts statistical analyses of each classification model paired with each FS method, using eight different metrics. These metrics are: overall accuracy (acc—the proportion of correct predictions out of all predictions), balanced accuracy (bal-acc—the expected accuracy if the dataset classes were balanced), F1-score (f1—the harmonic mean of recall and precision), negative predicted value (npv—the proportion of negative predictions that are correct), positive predicted value (ppv—the proportion of positive predictions that are correct), sensitivity (sens—the proportion of the group of interest predicted correctly), specificity (spec—the proportion of the group not-of-interest predicted correctly), and the area under ROC curve (AUROC or AUC—the area under the curve outlining the tradeoff between sensitivity and specificity across operating points). The primary metrics used to evaluate each model are overall accuracy and AUROC. Two validation methods were employed, including holdout set validation and K-Fold validation on the hold-out set. The hold-out set was established with a large 40% of the samples randomly selected in order to assist with reliability and reproducibility. Validation was performed on the holdout set, as well as with K-Fold validation on the holdout set with K = 5. Optuna hyperparameter tuning was completed with 50 runs. After completion of the above methods, a new version of df-analyze was released with support for an emerging deep learning method designed for tabular data, known as Gated Adaptive Network for Deep Automated Learning of Features (GANDALF) [44]. Df-analyze was re-accessed to assess this method as well (df-analyze access date: November 2024), and the experiments were re-run with GANDALF enabled. Due to the additional computational demands of GANDALF relative to the other machine learning methods assessed, df-analyze was run without redundancy-aware step-up feature selection enabled, as this was the slowest of our considered feature selection methods.
3. Results
3.1. Predicting Diagnosis
For predicting diagnosis when including US image features, the best-performing model was the random forest (RF) with embedded LGBM-based feature selection, achieving an accuracy of 98.1% and an AUROC of 99.3% across both validation methods, see Appendix B. The features that this model relied upon are outlined in Appendix C, which provides a ranking of their respective apparent importance to inform prediction.
When excluding the US image-based features, the best-performing model was LGBM with no (none) feature selection, achieving an accuracy of 80.1% and an AUROC of 87.3–88.0% across both validation methods, see Appendix D.
The Optuna hyperparameter-tuned model parameters for the leading techniques are provided in Appendix E. A comparative visualization of leading findings is provided in Figure 1.
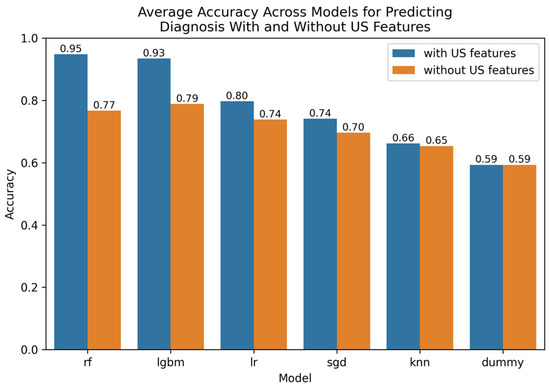
Figure 1.
Comparative bar plot of leading models for predicting diagnosis with and without US features.
3.2. Predicting Management
For predicting management, the best-performing models that included US-based image features were the random forest with association filter-based feature selection (assoc), achieving accuracies of 92.0–93.6% accuracy and an AUROC of 97.3–98.4% across both validation methods, see Appendix F. The association feature selection method selected for a large number of the available features in this dataset and is provided in detail in Appendix G. Note that a sorting of the importance of the features is provided both for numerical and categorical features, respectively. The leading features informing prediction, according to the association filter-based method’s reliance on mutual information, were C-reactive protein, Alvarado score, the appendix diameter, white blood cell count, and neutrophil percentage for the numerical variables, and ipsilateral rebound tenderness, diagnosis, peritonitis, severity, and surrounding tissue reaction for the categorical variables.
When predicting management without the US-based image features, the best-performing model was the random forest (RF) with no (none) feature selection, achieving accuracies of 92.0–93.9% and an AUROC of 97.0–98.0% across both validation methods, see Appendix H. Noteworthy is that our emerging redundancy-aware step-up feature selection method (wrap), which is biased in favour of unusually small feature sets, achieved near equal accuracies of 92.0–92.7% and an AUROC of 94.2–96.0%, based on just 11 features, as outlined in Appendix I. The leading features relied upon were peritonitis, white blood cell count, body temperature, weight, severity, and C-reactive protein.
The Optuna hyperparameter-tuned model parameters for leading techniques are provided in Appendix E. A visualization of leading findings is provided in Figure 2.
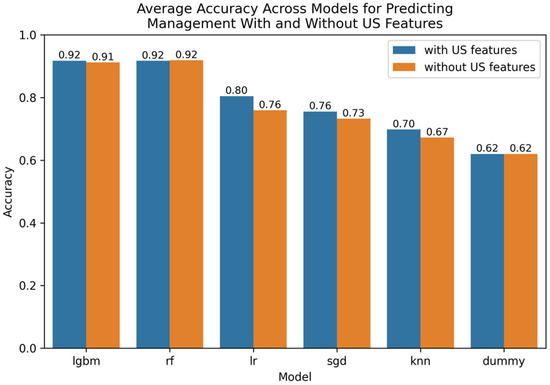
Figure 2.
Comparative bar plot of leading models for predicting management with and without US features.
3.3. Predicting Severity
For predicting severity, with US image features included, the best-performing model was logistic regression (LR) with wrapper-based redundancy-aware step-up feature selection (wrap), which achieved accuracy of 89.1–89.5% and an AUROC of 82.0–83.4% across both validation methods, see Appendix J. The feature selection results are provided in Appendix K. Leading features were meteorism (excess gas in the digestive tract), dysuria, weight, lower right abdominal pain, and free fluids.
When predicting severity with US image features excluded, the best-performing model was LGBM with filter-based association (assoc) feature selection, achieving an accuracy of 89.2–90.1% and an AUROC of 89.6–93.1% across both validation methods, see Appendix L. As is common, the association-based feature selection method selects a large number of the available features in this dataset. Also of interest, redundancy-aware step-up feature selection (wrap) produced similar results, achieving an accuracy of 88.8% and an AUROC of 80.5–81.1% when combined with logistic regression based on just five features, as outlined in Appendix M. The five features included were peritonitis, coughing pain, body temperature, thrombocyte count, and C-reactive protein.
The Optuna hyperparameter-tuned model parameters for leading techniques are provided in Appendix E. A visualization of leading findings is provided in Figure 3.
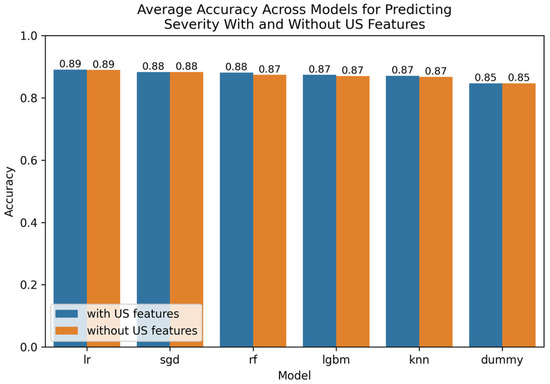
Figure 3.
Comparative bar plot of leading models for predicting severity with and without US features.
3.4. GANDALF Results
GANDALF [44] was run with an updated version of df-analyze, and so the results presented can only be roughly compared with the findings presented above due to it being run as an additional round of validation with unique randomization. When predicting diagnosis, the leading accuracy/AUROC for GANDALF was 80.5/90.6% with US features (filter-based prediction feature selection), and 66.7/75.7% without US features (filter-based prediction feature selection). When predicting management, the leading accuracy/AUROC for GANDALF was 91.5/96.9% with US features (no feature selection), and 90.5/97.5% without US features (embedded linear feature selection). When predicting severity, the leading accuracy/AUROC for GANDALF was 81.1/77.7% with US features (filter-based prediction feature selection), and 85.4/81.1% without US features (embedded linear feature selection).
4. Discussion
We performed a detailed study comparing several machine learning algorithms combined exhaustively with a variety of feature selection approaches applied to pediatric appendicitis diagnostics, management (treatment prediction), and severity. Results demonstrate that we are able to create high-performing models for each of the three main predictive tasks addressed. Our extensive use of feature selection has provided a variety of feature sets predictive of our three addressed target variables, information that can potentially assist in the clinical management of appendicitis and may inform the development of future AI technologies in this domain.
4.1. Interactions Between Machine Learning and Feature Selection Technologies
Our df-analyze benchmarking software has been previously used to assess machine learning and feature selection combinations that produce high-quality AI models to assist in schizophrenia diagnostics [45], chronic kidney disease diagnosis [46], mitigating bias in traffic stop outcomes [47], and studying proteins potentially linked with learning in the cerebral cortex [48]. In this study, we investigated the tool’s potential for use in three applications of pediatric appendicitis.
Logistic regression (LR) and stochastic gradient descent (SGD) were only among our top performers when using a feature selection method, suggesting that those methods are sensitive to being negatively biased from the inclusion of noisy, useless, and/or redundant features. In contrast, the light gradient boosting machine (LGBM) and the random forest (RF) models often performed well in predicting appendicitis diagnosis, management, and severity with and without feature selection methods. These results imply that the LGBM and RF are strong at ignoring noisy, useless, and/or redundant features in this application. These observations are expected as the LGBM and RF are both based on collections of decision tree classifiers, which are inherently capable of ignoring weak features, as they strongly tend not to be selected for in the splitting process that creates decisions at each split in each base learner decision tree. Our results also demonstrate potential from our novel redundancy-aware feature selection (FS) method, contributing to high-performing models in both management and severity prediction, based on relatively small feature sets. Such solutions have the potential to improve the explainability of our AI technologies through a greatly reduced feature set size. For management, our redundancy-aware FS method identified 11 features (see Appendix I), with the leading features relied upon being peritonitis, white blood cell count, body temperature, weight, severity, and C-reactive protein. For severity, our redundancy-aware FS method identified five features (see Appendix M): peritonitis, coughing pain, body temperature, thrombocyte count, and C-reactive protein. These feature sets are highly predictive of management and severity, respectively, and so may represent useful information for clinicians responsible for patient management.
4.2. Discussion of GANDALF Results
GANDALF [44], an emerging deep learning architecture designed for tabular data, upon which deep learners have traditionally been underperformers, was assessed as an addendum to this study. Results demonstrate overall good performance from GANDALF; however, it was not the leading AI technology in our trials in terms of predictive accuracy. That said, GANDALF was very competitive in predicting management and severity, especially in terms of AUROC scores, implying the method is capable of creating internal embeddings of feature representations that assist in delineating between our target classes of interest as assessed by AUROC. It is well known that deep learners in particular benefit from large sample sizes to train upon, and so it is expected that in this application, with relatively few samples compared with many other machine learning studies, GANDALF is disadvantaged.
4.3. Predictive Significance of US Image Features
For predicting diagnosis, the performance tables in Appendix H and Appendix J consistently show a decrease in predictive accuracy of our top-performing models of 10–20% in both performance on holdout set and 5-fold cross-validation on the holdout set when withholding US image features. The significant drop in performance suggests information in the US image features is important for diagnosing appendicitis and contributes to a mitigation in how biassed the resultant models are from predicting ground-truth diagnoses. When predicting management, there is no drop in performance across our top-performing models when US image features are removed (see Appendix C and Appendix L). Similar findings were observed in comparative performance when US image features are included/excluded when predicting Severity (see Appendix G and Appendix I). These results suggest US image-derived features are either not useful in predicting the management and severity of pediatric appendicitis or are redundant to non-US-based features available in this dataset.
4.4. Literature Comparison
The appendicitis dataset relied upon has been updated since the earliest publications focused on this work [35,37], supporting a more statistically powered analysis with 781 patients in our study, as opposed to 430 patients [35] and 579 patients [37]. Thus, any comparisons between our findings and the foundational papers on this dataset in the literature [35,37] are not exact comparisons due to the dataset size, as well as inevitably employing different validation strategies. Having more samples in the total dataset is expected to help improve predictive accuracies, as more samples are available for training, which is well known to improve the performance of machine learning models generally. Also noteworthy, our validation approach involved reserving 40% of the samples in the dataset for our hold-out testing to help ensure reliability. This has the potential to reduce our reported predictive accuracy, as only 60% of the total samples were available for training in a relatively small dataset. Previous work on this dataset employed validation with 10% of samples included in the testing pools [35]. Results indicate that our leading models produced AUROC scores of 0.993 for predicting diagnosis, 0.973–0.984 for predicting management, and 0.896–0.931 for predicting severity across our two validation methods. This compares favourably with literature work on a subset of this dataset [35], which reported AUROC scores of 0.96 (+/−0.01) for predicting diagnosis, and 0.94 (+/−0.02) for predicting management; however, our findings were approximately the same for predicting severity, with the literature reporting AUROC scores of 0.91 (+/−0.07) [35]. Our results are roughly in line with those from the literature [35], with some noteworthy improvements in AUROC scores in predicting diagnosis and management. The improved performance of our models may be attributable to the increased sample size available in our dataset, and features of df-analyze, such as Optuna hyperparameter tuning, extensive feature selection techniques evaluated, using state-of-the-art scikit learn implementations of learning machines in Python (as opposed to relying on R), and consideration of lightweight high-performing algorithms such as the light gradient boosting machine (LGBM), and LGBM-based embedded feature selection. It should also be noted that two additional studies have been conducted on the updated dataset used in this analysis, focused exclusively on diagnosis [38,39]. This includes an approach achieving 94.5% accuracy with the random forest [38], and an approach based on the Hybrid Bat algorithm achieving 94% accuracy [39]. An additional study was based on recursive feature elimination and the random forest, which did not report overall accuracies [39], but reported AUROC scores for diagnosis of 0.96 +/−0.02 [40]. In contrast, our approach, enhanced by Optuna hyperparameter tuning and feature selection, compares favourably with 98.1% accuracy and AUROC scores of 0.993 for diagnosis.
4.5. Future Work and Limitations
An interesting consideration that has resulted from this study relates to interactions between the target variables. There is potential value, for instance, in predicting diagnosis with and without knowledge of management, or predicting management with or without knowledge of the diagnosis. For instance, diagnosis is often not established until after surgical management, so the method selected for surgical management can potentially be a useful informative feature assisting in the predictive capacity of diagnosis. Conversely, management may benefit from knowledge of the final diagnosis if it is available. However, in situations where it is not (the patient’s final diagnosis is unknown), but the patient is proceeding to management/surgery, then a management prediction algorithm should not be informed as to the patient’s diagnosis when creating a technology to be relied upon clinically. Confounding issues, such as these, are important when creating a series of technologies to be relied upon for aiding clinical management of patients. Models can be created with and without knowledge of the other target variables of interest; thus, appropriate AI models can theoretically be relied upon clinically based on the availability (or not) of given target variables that may be helpful in informing prediction. Furthermore, AI technologies can be created that input a prediction of a target variable assessed by a different AI model. While this study is a research endeavour, and the models developed have not been clinically deployed, it is important for AI developers in medical applications to appreciate the various trade-offs and varying clinical utility of nearly identical models trained on almost the same set of potential predictor variables. Preliminary experiments indicate that high-performing models can be built with df-analyze for these applications with and without the inclusion of alternate target variables as features informing prediction. Limitations include that this study was performed on a single dataset, as this is the only dataset of its type publicly available; thus, independent dataset validation was not possible. Future work should involve validation on additional independent datasets in different healthcare environments to assess their generalisability across diverse pediatric populations. Future work should also involve consideration of emerging learning algorithms, such as updates to deep learners focused on tabular data.
5. Conclusions
We investigated the use of several machine learning technologies exhaustively combined with a variety of feature selection algorithms for predicting the diagnosis, management, and severity of pediatric appendicitis, with and without the inclusion of ultrasound image-derived features. Ultrasound image features were found to be important for maximizing accuracy when performing diagnostics, providing support for the value of imaging features in mitigating bias in the AI model relative to ground-truth diagnoses. However, findings imply that image-derived features are not as useful when predicting the management and severity of the condition. A variety of leading learning machines were presented based on variable subsets of the features identified by our redundancy-aware FS, providing detailed information that can potentially aid in the explainability of our AI models. The methods outlined in this study produced AI technologies with robust predictive potential in three applications focused on pediatric appendicitis as assessed by the area under the receiver operating characteristic curve. The technologies developed in this study could potentially help identify and manage young patients with suspected appendicitis. Advantages of the approach taken in this study include the consideration of a novel redundancy-aware step-up feature selection algorithm, consideration of an emerging deep learner optimized for tabular data (Gandalf), assessment of the value of US-derived features, and the creation of highly accurate AI models for three applications. Disadvantages include that this study did not consider convolutional neural networks that process the US images available in this dataset, as well as being reliant on a single dataset for all analyses. Future work will investigate the role of image analysis deep learners, including on additional datasets.
Author Contributions
Conceptualization, J.K. and G.G.; methodology, J.K. and G.G.; software, J.K., G.G. and D.B.; validation, J.K., G.G. and D.B.; formal analysis, J.K. and G.G.; investigation, J.K. and G.G.; resources, J.L.; data curation, J.K. and G.G.; writing—original draft preparation, J.K. and G.G.; writing—review and editing, J.K., G.G. and J.L.; supervision, J.L.; project administration, J.L.; funding acquisition, J.L. All authors have read and agreed to the published version of the manuscript.
Funding
This study was financially supported by a Canada Foundation for Innovation grant, a Nova Scotia Research and Innovation Trust grant, an NSERC Discovery grant, a Compute Canada Resource Allocation, and a Nova Scotia Health Authority grant to J.L.
Institutional Review Board Statement
This dataset was obtained from a public source, the IRB approval was reported by the study authors (without a specific date), as follows. The study involving human participants was reviewed and approved by the University of Regensburg institutional review board (Ethikkommission der Universität Regensburg, no. 18-1063-101). The results presented in this manuscript involved only secondary analysis of de-identified data. The dataset used in this study is publicly available and so institutional review board approval was not required to complete this retrospective analysis.
Informed Consent Statement
The study involving human participants was reviewed and approved by the University of Regensburg institutional review board (Ethikkommission der Universität Regensburg, no. 18-1063-101), which also waived informed consent to routine data analysis. The results presented in this manuscript involved only secondary analysis of de-identified data. For patients followed up after discharge, written informed consent was obtained from parents or legal representatives.
Data Availability Statement
The dataset used in this study is publicly available and can be accessed at https://archive.ics.uci.edu/dataset/938/regensburg+pediatric+appendicitis (accessed on 30 September 2024). No new data were created or collected specifically for this study. Since this was a retrospective analysis of public domain data, no institutional review board approval was necessary for conducting this study.
Conflicts of Interest
Dr. Levman is founder of Time Will Tell Technologies, Inc. The authors declare no relevant conflicts of interest. The funders had no role in the design of the study; in the collection, analyses, or interpretation of data; in the writing of the manuscript; or in the decision to publish the results.
Abbreviations
The following abbreviations are used in this manuscript:
| LGBM | Light Gradient Boosting Machine |
| RF | Random Forest |
| LR | Linear Regression |
| SGD | Stochastic Gradient Descent |
| AUROC | Area Under the Receiver Operating Characteristic Curve |
| US | Ultrasound |
| GANDALF | Gated Adaptive Network for Deep Automated Learning of Features |
Appendix A
Categorical feature statistics for each of three applications.
Table A1.
Categorical feature statistics for the target variable Diagnosis.
Table A1.
Categorical feature statistics for the target variable Diagnosis.
| Feature | Class | % Appendicitis | % No Appendicitis | % of Total |
|---|---|---|---|---|
| Sex | female | 53.19 | 46.81 | 48.33 |
| male | 65.01 | 34.99 | 51.67 | |
| Management | conservative | 35.2 | 64.8 | 61.84 |
| primary surgical | 99.26 | 0.74 | 34.57 | |
| secondary surgical | 96.15 | 3.85 | 3.46 | |
| simultaneous appendectomy | 0 | 100 | 0.13 | |
| Severity | complicated | 99.16 | 0.84 | 15.24 |
| uncomplicated | 52.19 | 47.81 | 84.76 | |
| Appendix on the US | no | 30.04 | 69.96 | 35.14 |
| yes | 75 | 25 | 64.86 | |
| Migratory Pain | no | 56.23 | 43.77 | 72.7 |
| yes | 66.82 | 33.18 | 27.3 | |
| Lower Right Abd Pain | no | 36.59 | 63.41 | 5.3 |
| yes | 60.44 | 39.56 | 94.7 | |
| Contralateral Rebound Tenderness | no | 51.6 | 48.4 | 61.15 |
| yes | 70.13 | 29.87 | 38.85 | |
| Coughing Pain | no | 55.84 | 44.16 | 71.54 |
| yes | 66.06 | 33.94 | 28.46 | |
| Nausea | no | 48.91 | 51.09 | 41.47 |
| yes | 66.45 | 33.55 | 58.53 | |
| Loss of Appetite | no | 51.05 | 48.95 | 49.22 |
| yes | 66.84 | 33.16 | 50.78 | |
| Neutrophilia | no | 44.47 | 55.53 | 50.68 |
| yes | 74.52 | 25.48 | 49.32 | |
| Dysuria | no | 58.67 | 41.33 | 94.16 |
| yes | 47.73 | 52.27 | 5.84 | |
| Stool | constipation | 59.77 | 40.23 | 11.37 |
| constipation, diarrhea | 100 | 0 | 0.13 | |
| diarrhea | 65.62 | 34.38 | 16.73 | |
| normal | 57.19 | 42.81 | 71.76 | |
| Peritonitis | generalized | 87.8 | 12.2 | 5.3 |
| local | 86.98 | 13.02 | 24.84 | |
| no | 47.04 | 52.96 | 69.86 | |
| Psoas Sign | no | 60.67 | 39.33 | 68.59 |
| yes | 52.56 | 47.44 | 31.41 | |
| Ipsilateral Rebound Tenderness | no | 47.68 | 52.32 | 93.86 |
| yes | 73.68 | 26.32 | 6.14 | |
| US_Performed | no | 71.43 | 28.57 | 1.93 |
| yes | 59.11 | 40.89 | 98.07 | |
| Free_Fluids | no | 50.61 | 49.39 | 56.88 |
| yes | 71.94 | 28.06 | 43.12 | |
| Appendix Wall Layers | intact | 77.27 | 22.73 | 60.55 |
| partially raised | 100 | 0 | 4.13 | |
| raised | 96.05 | 3.95 | 34.86 | |
| upset | 100 | 0 | 0.46 | |
| Target Sign | no | 49.02 | 50.98 | 36.96 |
| yes | 94.25 | 5.75 | 63.04 | |
| Appendicolith | no | 90.91 | 9.09 | 47.83 |
| suspected | 100 | 0 | 4.35 | |
| yes | 100 | 0 | 47.83 | |
| Perfusion | hyperperfused | 96.77 | 3.23 | 49.21 |
| hypoperfused | 96.43 | 3.57 | 44.44 | |
| no | 100 | 0 | 4.76 | |
| present | 100 | 0 | 1.59 | |
| Perforation | no | 88.24 | 11.76 | 41.98 |
| not excluded | 100 | 0 | 18.52 | |
| suspected | 66.67 | 33.33 | 3.7 | |
| yes | 100 | 0 | 35.8 | |
| Surrounding Tissue Reaction | no | 63.64 | 36.36 | 17.46 |
| yes | 94.23 | 5.77 | 82.54 | |
| Appendicular Abscess | no | 86.15 | 13.85 | 76.47 |
| suspected | 100 | 0 | 1.18 | |
| yes | 100 | 0 | 22.35 | |
| Pathological Lymph Nodes | no | 59.18 | 40.82 | 24.14 |
| yes | 53.25 | 46.75 | 75.86 | |
| Bowel Wall Thickening | no | 50 | 50 | 44.44 |
| yes | 85.45 | 14.55 | 55.56 | |
| Conglomerate of Bowel Loops | no | 81.82 | 18.18 | 51.16 |
| yes | 90.48 | 9.52 | 48.84 | |
| Ileus | no | 83.78 | 16.22 | 61.67 |
| yes | 100 | 0 | 38.33 | |
| Coprostasis | no | 100 | 0 | 35.21 |
| yes | 50 | 50 | 64.79 | |
| Meteorism | no | 100 | 0 | 7.86 |
| yes | 45.74 | 54.26 | 92.14 | |
| Enteritis | no | 86.67 | 13.33 | 22.73 |
| yes | 31.37 | 68.63 | 77.27 |
Table A2.
Categorical feature statistics for the target variable management.
Table A2.
Categorical feature statistics for the target variable management.
| Feature | Class | Conservative | Primary Surgical | Secondary Surgical |
|---|---|---|---|---|
| Sex | female | 65.52 | 29.97 | 4.24 |
| male | 58.56 | 38.96 | 2.48 | |
| Severity | complicated | 0 | 96.64 | 3.36 |
| uncomplicated | 72.96 | 23.41 | 3.47 | |
| Diagnosis | appendicitis | 36.72 | 57.88 | 5.4 |
| no appendicitis | 98.74 | 0.63 | 0.32 | |
| Appendix_on_US | no | 68.86 | 26.74 | 4.03 |
| yes | 58.53 | 38.89 | 2.58 | |
| Migratory_Pain | no | 63.17 | 33.81 | 2.85 |
| yes | 60.66 | 36.02 | 3.32 | |
| Lower_Right_Abd_Pain | no | 73.17 | 24.39 | 2.44 |
| yes | 61.8 | 35.06 | 3 | |
| Contralateral_Rebound_Tenderness | no | 70.79 | 27.29 | 1.71 |
| yes | 50.67 | 44.63 | 4.7 | |
| Coughing_Pain | no | 64.6 | 32.85 | 2.55 |
| yes | 59.17 | 38.07 | 2.29 | |
| Nausea | no | 73.83 | 23.36 | 2.8 |
| yes | 54.3 | 42.6 | 2.87 | |
| Loss_of_Appetite | no | 71.05 | 27.63 | 1.32 |
| yes | 54.34 | 41.33 | 4.08 | |
| Neutrophilia | no | 79.51 | 17.52 | 2.96 |
| yes | 46.26 | 50.69 | 2.77 | |
| Dysuria | no | 64.32 | 32.58 | 2.96 |
| yes | 61.36 | 36.36 | 2.27 | |
| Stool | constipation | 63.22 | 35.63 | 1.15 |
| constipation, diarrhea | 0 | 100 | 0 | |
| diarrhea | 57.81 | 39.06 | 3.12 | |
| normal | 64.48 | 32.24 | 3.1 | |
| Peritonitis | generalized | 14.63 | 82.93 | 2.44 |
| local | 19.79 | 74.48 | 5.21 | |
| no | 81.3 | 16.67 | 2.04 | |
| Psoas_Sign | no | 63.8 | 34.05 | 2.15 |
| yes | 66.24 | 29.49 | 4.27 | |
| Ipsilateral_Rebound_Tenderness | no | 80.03 | 18.76 | 1.2 |
| yes | 47.37 | 50 | 2.63 | |
| US_Performed | no | 26.67 | 46.67 | 26.67 |
| yes | 62.78 | 34.34 | 2.75 | |
| Free_Fluids | no | 74.57 | 22.49 | 2.93 |
| yes | 46.45 | 50.32 | 2.9 | |
| Appendix_Wall_Layers | intact | 71.97 | 26.52 | 1.52 |
| partially raised | 0 | 100 | 0 | |
| raised | 17.11 | 76.32 | 6.58 | |
| upset | 0 | 100 | 0 | |
| Target_Sign | no | 60.78 | 31.37 | 7.84 |
| yes | 29.89 | 68.97 | 1.15 | |
| Appendicolith | no | 54.55 | 36.36 | 9.09 |
| suspected | 100 | 0 | 0 | |
| yes | 9.09 | 87.88 | 3.03 | |
| Perfusion | hyperperfused | 48.39 | 45.16 | 6.45 |
| hypoperfused | 14.29 | 78.57 | 7.14 | |
| no | 0 | 100 | 0 | |
| present | 0 | 100 | 0 | |
| Perforation | no | 44.12 | 50 | 5.88 |
| not excluded | 0 | 100 | 0 | |
| suspected | 66.67 | 33.33 | 0 | |
| yes | 0 | 100 | 0 | |
| Surrounding_Tissue_Reaction | no | 77.27 | 22.73 | 0 |
| yes | 26.44 | 69.71 | 3.85 | |
| Appendicular_Abscess | no | 38.46 | 58.46 | 3.08 |
| suspected | 0 | 100 | 0 | |
| yes | 0 | 89.47 | 10.53 | |
| Pathological_Lymph_Nodes | no | 59.18 | 38.78 | 2.04 |
| yes | 68.83 | 27.27 | 3.9 | |
| Bowel_Wall_Thickening | no | 68.18 | 27.27 | 4.55 |
| yes | 23.64 | 67.27 | 9.09 | |
| Conglomerate_of_Bowel_Loops | no | 31.82 | 63.64 | 4.55 |
| yes | 9.52 | 85.71 | 4.76 | |
| Ileus | no | 27.03 | 62.16 | 8.11 |
| yes | 0 | 95.65 | 4.35 | |
| Coprostasis | no | 4 | 88 | 8 |
| yes | 69.57 | 30.43 | 0 | |
| Meteorism | no | 0 | 90.91 | 9.09 |
| yes | 66.67 | 27.91 | 4.65 | |
| Enteritis | no | 20 | 73.33 | 6.67 |
| yes | 90.2 | 9.8 | 0 |
Table A3.
Categorical feature statistics for target variable severity.
Table A3.
Categorical feature statistics for target variable severity.
| Feature | Class | Complicated | Uncomplicated | % of Total |
|---|---|---|---|---|
| Sex | female | 14.85 | 85.15 | 48.33 |
| male | 15.63 | 84.37 | 51.67 | |
| Management | conservative | 0 | 100 | 61.84 |
| primary surgical | 42.59 | 57.41 | 34.57 | |
| secondary surgical | 14.81 | 85.19 | 3.46 | |
| simultaneous appendectomy | 0 | 100 | 0.13 | |
| Diagnosis | appendicitis | 25.49 | 74.51 | 59.36 |
| no appendicitis | 0.32 | 99.68 | 40.64 | |
| Appendix_on_US | no | 17.22 | 82.78 | 35.14 |
| yes | 14.09 | 85.91 | 64.86 | |
| Migratory_Pain | no | 15.12 | 84.88 | 72.7 |
| yes | 15.17 | 84.83 | 27.3 | |
| Lower_Right_Abd_Pain | no | 19.51 | 80.49 | 5.3 |
| yes | 14.87 | 85.13 | 94.7 | |
| Contralateral_Rebound_Tenderness | no | 11.73 | 88.27 | 61.15 |
| yes | 19.46 | 80.54 | 38.85 | |
| Coughing_Pain | no | 14.05 | 85.95 | 71.54 |
| yes | 16.97 | 83.03 | 28.46 | |
| Nausea | no | 5.61 | 94.39 | 41.47 |
| yes | 21.85 | 78.15 | 58.53 | |
| Loss_of_Appetite | no | 7.37 | 92.63 | 49.22 |
| yes | 22.7 | 77.3 | 50.78 | |
| Neutrophilia | no | 5.12 | 94.88 | 50.68 |
| yes | 23.82 | 76.18 | 49.32 | |
| Dysuria | no | 13.96 | 86.04 | 94.16 |
| yes | 18.18 | 81.82 | 5.84 | |
| Stool | constipation | 17.24 | 82.76 | 11.37 |
| constipation, diarrhea | 100 | 0 | 0.13 | |
| diarrhea | 19.53 | 80.47 | 16.73 | |
| normal | 13.11 | 86.89 | 71.76 | |
| Peritonitis | generalized | 51.22 | 48.78 | 5.3 |
| local | 29.17 | 70.83 | 24.84 | |
| no | 7.22 | 92.78 | 69.86 | |
| Psoas_Sign | no | 15.66 | 84.34 | 68.59 |
| yes | 10.26 | 89.74 | 31.41 | |
| Ipsilateral_Rebound_Tenderness | no | 6.54 | 93.46 | 93.86 |
| yes | 23.68 | 76.32 | 6.14 | |
| US_Performed | no | 13.33 | 86.67 | 1.93 |
| yes | 15.07 | 84.93 | 98.07 | |
| Free_Fluids | no | 7.58 | 92.42 | 56.88 |
| yes | 23.55 | 76.45 | 43.12 | |
| Appendix_Wall_Layers | intact | 5.3 | 94.7 | 60.55 |
| partially raised | 66.67 | 33.33 | 4.13 | |
| raised | 32.89 | 67.11 | 34.86 | |
| upset | 100 | 0 | 0.46 | |
| Target_Sign | no | 19.61 | 80.39 | 36.96 |
| yes | 21.84 | 78.16 | 63.04 | |
| Appendicolith | no | 9.09 | 90.91 | 47.83 |
| suspected | 0 | 100 | 4.35 | |
| yes | 48.48 | 51.52 | 47.83 | |
| Perfusion | hyperperfused | 16.13 | 83.87 | 49.21 |
| hypoperfused | 28.57 | 71.43 | 44.44 | |
| no | 0 | 100 | 4.76 | |
| present | 100 | 0 | 1.59 | |
| Perforation | no | 11.76 | 88.24 | 41.98 |
| not excluded | 66.67 | 33.33 | 18.52 | |
| suspected | 33.33 | 66.67 | 3.7 | |
| yes | 68.97 | 31.03 | 35.8 | |
| Surrounding_Tissue_Reaction | no | 6.82 | 93.18 | 17.46 |
| yes | 30.29 | 69.71 | 82.54 | |
| Appendicular_Abscess | no | 21.54 | 78.46 | 76.47 |
| suspected | 100 | 0 | 1.18 | |
| yes | 78.95 | 21.05 | 22.35 | |
| Pathological_Lymph_Nodes | no | 16.33 | 83.67 | 24.14 |
| yes | 9.74 | 90.26 | 75.86 | |
| Bowel_Wall_Thickening | no | 11.36 | 88.64 | 44.44 |
| yes | 36.36 | 63.64 | 55.56 | |
| Conglomerate_of_Bowel_Loops | no | 22.73 | 77.27 | 51.16 |
| yes | 71.43 | 28.57 | 48.84 | |
| Ileus | no | 10.81 | 89.19 | 61.67 |
| yes | 82.61 | 17.39 | 38.33 | |
| Coprostasis | no | 28 | 72 | 35.21 |
| yes | 21.74 | 78.26 | 64.79 | |
| Meteorism | no | 27.27 | 72.73 | 7.86 |
| yes | 13.18 | 86.82 | 92.14 | |
| Enteritis | no | 20 | 80 | 22.73 |
| yes | 5.88 | 94.12 | 77.27 |
Table A4.
Demographic/Other.
Table A4.
Demographic/Other.
| Variable | Variable Name in Data Files | Explanation | Mode and Time of Measurement | Variable Type and Values |
|---|---|---|---|---|
| Age, years | Age | Obtained from the date of birth | At hospital admission | Continuous |
| Sex | Sex | Registered gender | At hospital admission | Binary: female/male |
| Height, cm | Height | Patient’s height | At hospital admission | Continuous |
| Weight, kg | Weight | Patient’s weight | At hospital admission | Continuous |
| Body mass index (BMI), kg/m2 | BMI | Measures body fat; patient’s weight divided by the square of the height | At hospital admission | Continuous |
| Length of stay, days | Length_of_Stay | Length of stay in the hospital | At discharge | Continuous |
Table A5.
Scoring.
Table A5.
Scoring.
| Variable | Variable Name in Data Files | Explanation | Mode and Time of Measurement | Variable Type and Values |
|---|---|---|---|---|
| Alvarado score (AS), pts | Alvarado_Score | Patient’s score according to the scoring system | At hospital admission, after clinical examination and laboratory data | Discrete |
| Pediatric appendicitis score (PAS), pts | Pediatric_Appendicitis_Score | Patient’s score according to the scoring system | At hospital admission, after clinical examination and laboratory data | Discrete |
Table A6.
Clinical features.
Table A6.
Clinical features.
| Variable | Variable Name in Data Files | Explanation | Mode and Time of Measurement | Variable Type and Values |
|---|---|---|---|---|
| Peritonitis/ abdominal guarding | Peritonitis | Spasm of abdominal wall muscles detected on palpation, usually a result of inflammation | At hospital admission, during clinical examination, or after a few hours of observation, if needed, after analgesia | Categorical: no localized generalized |
| Migration of pain | Migratory_Pain | Abdominal pain; usually starts in the epigastrium and moves to the right lower quadrant | At hospital admission, during clinical examination or anamnesis | Binary: no/yes |
| Tenderness in right lower quadrant (RLQ) | Lower_Right_Abd_Pain | Right iliac fossa pain detected on palpation | At hospital admission, during clinical examination | Binary: no/yes |
| Contralateral rebound tnderness | Contralateral_Rebound_Tenderness | A state in which pain of the contralateral side (usually, the right lower quadrant) is felt on the release of pressure (usually, in the left lower quadrant) over the abdomen | At hospital admission, during clinical examination | Binary: no/yes |
| Ipsilateral rebound tenderness | Ipsilateral_Rebound_Tenderness | A state in which pain of the ipsilateral side is felt on the release of pressure over the abdomen | At hospital admission, during clinical examination | Binary: no/yes |
| Cough tenderness | Coughing_Pain | Abdominal pain from forced cough | At hospital admission, during clinical examination | Binary: no/yes |
| Psoas sign | Psoas_Sign | Abdominal pain produced by extension of the hip | At hospital admission, during clinical examination | Binary: negative/positive |
| Nausea/vomiting | Nausea | Feeling of sickness/ejection of contents from the stomach through the mouth | Anamnesis | Binary: no/yes |
| Anorexia | Loss_of_Appetite | Loss of appetite | Anamnesis | Binary: no/yes |
| Body temperature, °C | Body_Temperature | Measured by a thermometer placed in the rectum or in the auditory canal | At hospital admission or after a few hours of observation | Continuous |
| Dysuria | Dysuria | Pain or other difficulty during urination | Anamnesis | Binary: no/yes |
| Stool | Stool | Characteristics of bowel movements | Anamnesis | Categorical: · normal · diarrhea · obstipation |
Table A7.
Laboratory Features.
Table A7.
Laboratory Features.
| Variable | Variable Name in Data Files | Explanation | Mode and Time of Measurement | Variable Type and Values |
|---|---|---|---|---|
| White blood cell count (WBC), 103/µL | WBC_Count | The number of leucocytes in a unit volume of blood; inflammation parameter | At hospital admission, obtained from a routine hemogram | Continuous |
| Red blood cell count (RBC), /pL | RBC_Count | The number of erythrocytes in a unit volume of bood | At hospital admission, obtained from a routine hemogram | Continuous |
| Hemoglobin, g/dL | Hemoglobin | Hemoglobin level; a red protein in the red blood cells that contains iron and is responsible for transporting oxygen | At hospital admission, obtained from a routine hemogram | Continuous |
| Red cell distribution width (RDW), % | RDW | A blood test that measures the differences in the volume and size of the erythrocytes | At hospital admission, obtained from a routine hemogram | Continuous |
| Thrombocyte count, /nL | Thrombocyte_Count | The number of platelets in a unit volume of bood | At hospital admission, obtained from a routine hemogram | Continuous |
| Neutrophils, % | Neutrophil_Percentage | Mature WBC in the granulocytic series | At hospital admission, obtained from differential WBC | Continuous |
| Neutrophilia, >= 75% | Neutrophilia | Relative neutrophilic leucocytosis, often a result of a bacterial infection | At hospital admission, obtained from differential WBC | Binary: no/yes |
| Segmented neutrophils, % | Segmented_Neutrophils | Most mature neutrophilic granulocytes present in circulating blood, increased during an inflammatory disorder | At hospital admission, obtained from differential WBC | Continuous |
| C-reactive protein (CRP), mg/L | CRP | Protein produced by the liver, elevated in case of inflammation, infection, or injury | At hospital admission, obtained from blood sample | Continuous |
| Ketones in urine | Ketones_in_Urine | Presence of ketone bodies in urine, e.g., in case of anorexia | At hospital admission, obtained from routine urine status | Categorical: o + ++ +++ |
| Erythrocytes in urine | RBC_in_Urine | Blood in urine | At hospital admission, obtained from routine urine status | Categorical: neg: <5 ery/µL +: approx. 5–10 ery/µL ++: approx. 25 ery/µL +++: approx. 50 ery/µL |
| White blood cells in urine | WBC_in_Urine | Leucocytes in urine, e.g., in case of infection | At hospital admission, obtained from routine urine status | Categorical: no + ++ +++ |
Table A8.
Ultrasound Features.
Table A8.
Ultrasound Features.
| Variable | Variable Name in Data Files | Explanation | Mode and Time of Measurement | Variable Type and Values |
|---|---|---|---|---|
| Performed ultrasound (US) | US_Performed | If an abdominal ultrasonography was performed or not | At hospital admission, after clinical examination, or after a few hours of observation | Binary: no/yes |
| Visibility of appendix | Appendix_on_US | Detectability of the vermiform appendix during sonographic examination | At hospital admission, after clinical examination, or after a few hours of observation | Binary: no/yes |
| Appendix diameter, mm | Appendix_Diameter | Maximal outer diameter of the appendix | At hospital admission, after clinical examination, or after a few hours of observation | Continuous |
| Free intraperitoneal fluid | Free_Fluids | Free fluids inside the abdomen | At hospital admission, after clinical examination, or after a few hours of observation | Binary: no/yes |
| Appendix layer structure | Appendix_Wall_Layers | Distribution and characteristics of appendix layers, e.g., irregular in case of increasing inflammation | At hospital admission, after clinical examination, or after a few hours of observation | Binary: regular/irregular |
| Target sign | Target_Sign | Axial image of appendix with a fluid-filled centre surrounded by echogenic mucosa and submucosa and hypoechoic muscularis | At hospital admission, after clinical examination, or after a few hours of observation | Binary: no/yes |
| Appendix perfusion | Perfusion | Blood flow to the appendix wall | At hospital admission, after clinical examination, or after a few hours of observation | Categorical: unremarkable hypoperfused hyperperfused |
| Surrounding tissue reaction | Surrounding_Tissue_Reaction | Inflammation signs in tissue (i.a. in omentum/fat tissue) surrounding appendix | At hospital admission, after clinical examination, or after a few hours of observation | Binary: no/yes |
| Pathological lymph nodes | Pathological_Lymph_Nodes | Enlarged and inflamed intra-abdominal lymph nodes | At hospital admission, after clinical examination, or after a few hours of observation | Binary: no/yes |
| Location of pathological lymph nodes | Lymph_Node_Location | The location of pathological lymph nodes in the abdomen | At hospital admission, after clinical examination, or after a few hours of observation | Free-form text (in German) |
| Thickening of the bowel wall | Bowel_Wall_Thickening | Edema of the intestinal wall, >2–3 mm for small bowel wall thickening | At hospital admission, after clinical examination, or after a few hours of observation | Binary: no/yes |
| Ileus | Ileus | Sonographic signs of paralytic ileus (e.g., dilated intestinal loops, pendulum peristalsis or absence of peristalsis) | At hospital admission, after clinical examination, or after a few hours of observation | Binary: no/yes |
| Coprostasis | Coprostasis | Fecal impaction in the colon | At hospital admission, after clinical examination, or after a few hours of observation | Binary: no/yes |
| Meteorism | Meteorism | Accumulation of gas in the intestine | At hospital admission. after clinical examination, or after a few hours of observation | Binary: no/yes |
| Enteritis | Enteritis | Sonographic features of gastroenteritis, e.g., wall thickening of the ileum, increased peristalsis | At hospital admission, after clinical examination, or after a few hours of observation | Binary: no/yes |
| Appendicolith | Apendicolith | Presence of fecalith in the appendix, e.g., acoustic shadow | At hospital admission, after clinical examination, or after a few hours of observation | Binary: no/yes |
| Perforation | Perforation | Signs of appendix perforation in US | At hospital admission, after clinical examination, or after a few hours of observation | Binary: no/yes |
| Appendicular abscess | Appendicular_Abscess | Appendiceal mass | At hospital admission, after clinical examination, or after a few hours of observation | Binary: no/yes |
| Location of abscess | Abscess_Location | Location of the abscess intraperitoneal | At hospital admission, after clinical examination, or after a few hours of observation | Free-form text (in German) |
| Conglomerate of bowel loops | Conglomerate_of_Bowel_Loops | Small intestine conglomerate as a sign of intraperitoneal inflammation | At hospital admission, after clinical examination, or after a few hours of observation | Binary: no/yes |
| Gynecological findings | Gynecological_Findings | Gynecological abnormalities, e.g., cysts, ovarian torsion | At hospital admission, after clinical examination, or after a few hours of observation | Free-form text (in German) |
| Ultrasound images | NA | Snapshots from the abdominal ultrasound exams | At hospital admission, after clinical examination, or after a few hours of observation | Images in BMP format |
Table A9.
Diagnosis/management/severity target variables.
Table A9.
Diagnosis/management/severity target variables.
| Variable | Variable Name in Data Files | Explanation | Mode and Time of Measurement | Variable Type and Values |
|---|---|---|---|---|
| Presumptive diagnosis | Diagnosis_Presumptive | Patient’s suspected diagnosis | At hospital admission, after clinical examination, or after a few hours of observation | Free-form text (in German) |
| Diagnosis | Diagnosis | Patient’s diagnosis, histologically confirmed for operated patients. Conservatively managed patients were labelled as having appendicitis if they had an AS or PAS of ≥ 4 and an appendix diameter of ≥6 mm | At hospital admission, after clinical examination, or after a few hours of observation | Binary: no appendicitis/appendicitis |
| Management | Management | Management of the patient assigned by a senior pediatric surgeon: operative (appendectomy: laparoscopic, open or conversion) or conservative (without antibiotics). In case of the secondary surgery after prior stay, the patient was labelled as operatively managed. | At hospital admission after clinical examination, or after a few hours of observation; or during follow-up. | Categorical: conservative primary surgical secondary surgical |
| Severity | Severity | Severity of appendicitis: uncomplicated: subacute/catharral, fibrosis; phlegmonous or complicated: gangrenous, perforated, abscessed | At hospital admission after clinical examination, or after a few hours of observation; or during follow-up. | Binary: uncomplicated or no appendicitis/complicated appendicitis |
Appendix B
Results from predicting Diagnosis with US image features.
Table A10.
Diagnosis with US image features holdout set performance.
Table A10.
Diagnosis with US image features holdout set performance.
| Model | Selection | Embed_Selector | Acc | Auroc | Bal-Acc | F1 | Npv | Ppv | Sens | Spec |
|---|---|---|---|---|---|---|---|---|---|---|
| rf | embed_lgbm | lgbm | 0.981 | 0.993 | 0.978 | 0.980 | 0.992 | 0.974 | 0.978 | 0.961 |
| lgbm | embed_linear | linear | 0.981 | 0.993 | 0.979 | 0.980 | 0.984 | 0.979 | 0.979 | 0.969 |
| rf | pred | none | 0.981 | 0.993 | 0.979 | 0.980 | 0.984 | 0.979 | 0.979 | 0.969 |
| lgbm | none | none | 0.981 | 0.994 | 0.979 | 0.980 | 0.984 | 0.979 | 0.979 | 0.969 |
| lgbm | pred | none | 0.978 | 0.996 | 0.976 | 0.977 | 0.976 | 0.978 | 0.976 | 0.969 |
| rf | embed_linear | linear | 0.978 | 0.991 | 0.974 | 0.977 | 0.992 | 0.968 | 0.974 | 0.953 |
| lgbm | assoc | none | 0.978 | 0.994 | 0.975 | 0.977 | 0.984 | 0.973 | 0.975 | 0.961 |
| lgbm | embed_lgbm | lgbm | 0.978 | 0.996 | 0.976 | 0.977 | 0.976 | 0.978 | 0.976 | 0.969 |
| rf | none | none | 0.965 | 0.992 | 0.958 | 0.963 | 0.992 | 0.948 | 0.958 | 0.921 |
| rf | assoc | none | 0.952 | 0.993 | 0.942 | 0.949 | 0.991 | 0.929 | 0.942 | 0.890 |
| rf | wrap | none | 0.875 | 0.945 | 0.867 | 0.870 | 0.861 | 0.884 | 0.867 | 0.827 |
| lr | pred | none | 0.865 | 0.947 | 0.864 | 0.862 | 0.820 | 0.899 | 0.864 | 0.858 |
| lgbm | wrap | none | 0.862 | 0.950 | 0.857 | 0.857 | 0.833 | 0.882 | 0.857 | 0.827 |
| sgd | pred | none | 0.837 | 0.843 | 0.823 | 0.828 | 0.833 | 0.838 | 0.823 | 0.748 |
| lr | assoc | none | 0.833 | 0.910 | 0.827 | 0.827 | 0.795 | 0.859 | 0.827 | 0.795 |
| lr | none | none | 0.833 | 0.910 | 0.827 | 0.827 | 0.795 | 0.859 | 0.827 | 0.795 |
| lr | embed_linear | linear | 0.833 | 0.910 | 0.827 | 0.827 | 0.795 | 0.859 | 0.827 | 0.795 |
| lr | embed_lgbm | lgbm | 0.804 | 0.893 | 0.794 | 0.796 | 0.770 | 0.826 | 0.794 | 0.740 |
| sgd | embed_linear | linear | 0.779 | 0.798 | 0.759 | 0.765 | 0.769 | 0.784 | 0.759 | 0.654 |
| sgd | none | none | 0.766 | 0.753 | 0.753 | 0.755 | 0.725 | 0.792 | 0.753 | 0.685 |
| sgd | assoc | none | 0.760 | 0.748 | 0.748 | 0.749 | 0.713 | 0.789 | 0.748 | 0.685 |
| sgd | wrap | none | 0.760 | 0.795 | 0.753 | 0.752 | 0.700 | 0.802 | 0.753 | 0.717 |
| lr | wrap | none | 0.753 | 0.847 | 0.724 | 0.730 | 0.766 | 0.748 | 0.724 | 0.567 |
| sgd | embed_lgbm | lgbm | 0.753 | 0.743 | 0.743 | 0.743 | 0.702 | 0.787 | 0.743 | 0.685 |
| knn | none | none | 0.683 | 0.715 | 0.651 | 0.653 | 0.649 | 0.697 | 0.651 | 0.480 |
| knn | embed_linear | linear | 0.683 | 0.721 | 0.644 | 0.644 | 0.671 | 0.687 | 0.644 | 0.433 |
| knn | assoc | none | 0.683 | 0.721 | 0.644 | 0.644 | 0.671 | 0.687 | 0.644 | 0.433 |
| knn | pred | none | 0.676 | 0.722 | 0.634 | 0.633 | 0.667 | 0.679 | 0.634 | 0.409 |
| knn | embed_lgbm | lgbm | 0.657 | 0.677 | 0.627 | 0.628 | 0.602 | 0.682 | 0.627 | 0.465 |
| knn | wrap | none | 0.622 | 0.601 | 0.601 | 0.602 | 0.539 | 0.670 | 0.601 | 0.488 |
| dummy | embed_lgbm | lgbm | 0.593 | 0.500 | 0.500 | 0.372 | nan | 0.593 | 0.500 | 0.000 |
| dummy | wrap | none | 0.593 | 0.500 | 0.500 | 0.372 | nan | 0.593 | 0.500 | 0.000 |
| dummy | pred | none | 0.593 | 0.500 | 0.500 | 0.372 | nan | 0.593 | 0.500 | 0.000 |
| dummy | none | none | 0.593 | 0.500 | 0.500 | 0.372 | nan | 0.593 | 0.500 | 0.000 |
| dummy | embed_linear | linear | 0.593 | 0.500 | 0.500 | 0.372 | nan | 0.593 | 0.500 | 0.000 |
| dummy | assoc | none | 0.593 | 0.500 | 0.500 | 0.372 | nan | 0.593 | 0.500 | 0.000 |
nan = Not a Number.
Table A11.
Diagnosis with US image features 5-fold performance on the holdout set.
Table A11.
Diagnosis with US image features 5-fold performance on the holdout set.
| Model | Selection | Embed_Selector | Acc | Auroc | Bal-Acc | F1 | Npv | Ppv | Sens | Spec |
|---|---|---|---|---|---|---|---|---|---|---|
| rf | embed_linear | linear | 0.984 | 0.993 | 0.981 | 0.983 | 0.992 | 0.979 | 0.981 | 0.968 |
| lgbm | assoc | none | 0.984 | 0.995 | 0.983 | 0.983 | 0.985 | 0.984 | 0.983 | 0.976 |
| lgbm | pred | none | 0.981 | 0.997 | 0.980 | 0.980 | 0.977 | 0.984 | 0.980 | 0.976 |
| lgbm | none | none | 0.981 | 0.997 | 0.977 | 0.980 | 0.992 | 0.974 | 0.977 | 0.960 |
| rf | embed_lgbm | lgbm | 0.981 | 0.993 | 0.977 | 0.980 | 0.992 | 0.974 | 0.977 | 0.960 |
| rf | pred | none | 0.978 | 0.994 | 0.975 | 0.977 | 0.985 | 0.974 | 0.975 | 0.960 |
| lgbm | embed_linear | linear | 0.974 | 0.993 | 0.971 | 0.973 | 0.985 | 0.969 | 0.971 | 0.952 |
| rf | none | none | 0.962 | 0.992 | 0.956 | 0.960 | 0.977 | 0.954 | 0.956 | 0.929 |
| rf | assoc | none | 0.926 | 0.988 | 0.932 | 0.925 | 0.880 | 0.971 | 0.932 | 0.960 |
| lgbm | wrap | none | 0.859 | 0.944 | 0.851 | 0.851 | 0.848 | 0.881 | 0.851 | 0.810 |
| rf | wrap | none | 0.859 | 0.949 | 0.849 | 0.852 | 0.853 | 0.868 | 0.849 | 0.794 |
| lr | pred | none | 0.856 | 0.939 | 0.853 | 0.851 | 0.810 | 0.891 | 0.853 | 0.842 |
| lgbm | embed_lgbm | lgbm | 0.827 | 0.909 | 0.819 | 0.819 | 0.792 | 0.853 | 0.819 | 0.778 |
| lr | embed_linear | linear | 0.811 | 0.900 | 0.805 | 0.803 | 0.763 | 0.851 | 0.805 | 0.778 |
| lr | none | none | 0.811 | 0.899 | 0.805 | 0.803 | 0.763 | 0.851 | 0.805 | 0.778 |
| lr | assoc | none | 0.811 | 0.899 | 0.805 | 0.803 | 0.763 | 0.851 | 0.805 | 0.778 |
| sgd | pred | none | 0.792 | 0.801 | 0.785 | 0.784 | 0.737 | 0.832 | 0.785 | 0.755 |
| lr | embed_lgbm | lgbm | 0.785 | 0.873 | 0.774 | 0.773 | 0.746 | 0.817 | 0.774 | 0.715 |
| sgd | embed_linear | linear | 0.750 | 0.806 | 0.747 | 0.743 | 0.678 | 0.806 | 0.747 | 0.731 |
| sgd | assoc | none | 0.750 | 0.743 | 0.743 | 0.741 | 0.685 | 0.798 | 0.743 | 0.707 |
| sgd | none | none | 0.743 | 0.741 | 0.737 | 0.734 | 0.674 | 0.799 | 0.737 | 0.707 |
| sgd | embed_lgbm | lgbm | 0.731 | 0.726 | 0.726 | 0.723 | 0.659 | 0.787 | 0.726 | 0.700 |
| lr | wrap | none | 0.712 | 0.809 | 0.686 | 0.688 | 0.685 | 0.728 | 0.686 | 0.550 |
| knn | embed_linear | linear | 0.683 | 0.719 | 0.641 | 0.640 | 0.683 | 0.684 | 0.641 | 0.417 |
| knn | assoc | none | 0.683 | 0.719 | 0.641 | 0.640 | 0.683 | 0.684 | 0.641 | 0.417 |
| sgd | wrap | none | 0.682 | 0.684 | 0.675 | 0.672 | 0.605 | 0.744 | 0.675 | 0.636 |
| knn | pred | none | 0.679 | 0.725 | 0.645 | 0.643 | 0.641 | 0.695 | 0.645 | 0.462 |
| knn | none | none | 0.676 | 0.739 | 0.646 | 0.649 | 0.639 | 0.696 | 0.646 | 0.487 |
| knn | embed_lgbm | lgbm | 0.670 | 0.717 | 0.643 | 0.642 | 0.606 | 0.701 | 0.643 | 0.503 |
| dummy | embed_lgbm | lgbm | 0.593 | 0.500 | 0.500 | 0.372 | nan | 0.593 | 0.500 | 0.000 |
| dummy | wrap | none | 0.593 | 0.500 | 0.500 | 0.372 | nan | 0.593 | 0.500 | 0.000 |
| dummy | pred | none | 0.593 | 0.500 | 0.500 | 0.372 | nan | 0.593 | 0.500 | 0.000 |
| dummy | none | none | 0.593 | 0.500 | 0.500 | 0.372 | nan | 0.593 | 0.500 | 0.000 |
| dummy | embed_linear | linear | 0.593 | 0.500 | 0.500 | 0.372 | nan | 0.593 | 0.500 | 0.000 |
| dummy | assoc | none | 0.593 | 0.500 | 0.500 | 0.372 | nan | 0.593 | 0.500 | 0.000 |
| knn | wrap | none | 0.580 | 0.561 | 0.561 | 0.560 | 0.484 | 0.643 | 0.561 | 0.463 |
nan = Not a Number.
Appendix C
Feature selection results for leading wrapper-based embedded LGBM feature selection for predicting Diagnosis with US image features.
Table A12.
Selection scores (Importances: Larger magnitude = More important).
Table A12.
Selection scores (Importances: Larger magnitude = More important).
| Feature | Score |
|---|---|
| Management_surgical | 6.800 × 101 |
| Appendix_Diameter | 5.800 × 101 |
| Appendix_Diameter_NAN | 4.900 × 101 |
| Thrombocyte_Count | 3.400 × 101 |
| Age | 3.400 × 101 |
| Paedriatic_Appendicitis_Score | 2.900 × 101 |
| WBC_Count | 2.700 × 101 |
| Alvarado_Score | 2.500 × 101 |
| CRP | 2.200 × 101 |
| Appendix_on_US_yes | 1.800 × 101 |
| Hemoglobin | 1.400 × 101 |
| RDW | 1.400 × 101 |
| Neutrophil_Percentage | 1.300 × 101 |
| BMI | 1.000 × 101 |
| Body_Temperature | 9.000 × 100 |
| RBC_Count | 8.000 × 100 |
| Coughing_Pain_yes | 7.000 × 100 |
| Height | 4.000 × 100 |
| Surrounding_Tissue_Reaction_nan | 2.000 × 100 |
| Peritonitis_no | 2.000 × 100 |
| Weight | 1.000 × 100 |
| Contralateral_Rebound_Tenderness_yes | 1.000 × 100 |
| Psoas_Sign_yes | 1.000 × 100 |
Appendix D
Results from predicting diagnosis without US image features.
Table A13.
Diagnosis without US image features holdout set performance.
Table A13.
Diagnosis without US image features holdout set performance.
| Model | Selection | Embed_Selector | Acc | Auroc | Bal-Acc | F1 | Npv | Ppv | Sens | Spec |
|---|---|---|---|---|---|---|---|---|---|---|
| lgbm | none | none | 0.801 | 0.873 | 0.798 | 0.796 | 0.744 | 0.844 | 0.798 | 0.780 |
| sgd | wrap | none | 0.792 | 0.780 | 0.780 | 0.782 | 0.758 | 0.812 | 0.780 | 0.717 |
| lgbm | assoc | none | 0.782 | 0.882 | 0.778 | 0.776 | 0.722 | 0.827 | 0.778 | 0.756 |
| rf | embed_lgbm | lgbm | 0.779 | 0.864 | 0.778 | 0.774 | 0.710 | 0.833 | 0.778 | 0.772 |
| lgbm | embed_lgbm | lgbm | 0.776 | 0.871 | 0.766 | 0.767 | 0.728 | 0.807 | 0.766 | 0.717 |
| rf | none | none | 0.769 | 0.861 | 0.772 | 0.765 | 0.690 | 0.838 | 0.772 | 0.787 |
| rf | embed_linear | linear | 0.766 | 0.859 | 0.768 | 0.762 | 0.688 | 0.833 | 0.768 | 0.780 |
| rf | assoc | none | 0.766 | 0.861 | 0.751 | 0.754 | 0.733 | 0.786 | 0.751 | 0.669 |
| rf | wrap | none | 0.760 | 0.862 | 0.742 | 0.746 | 0.732 | 0.775 | 0.742 | 0.646 |
| rf | pred | none | 0.760 | 0.858 | 0.744 | 0.747 | 0.724 | 0.781 | 0.744 | 0.661 |
| lgbm | embed_linear | linear | 0.753 | 0.872 | 0.746 | 0.745 | 0.692 | 0.797 | 0.746 | 0.709 |
| lr | wrap | none | 0.750 | 0.823 | 0.730 | 0.734 | 0.725 | 0.764 | 0.730 | 0.622 |
| lgbm | pred | none | 0.747 | 0.855 | 0.735 | 0.736 | 0.697 | 0.779 | 0.735 | 0.669 |
| lgbm | wrap | none | 0.744 | 0.858 | 0.734 | 0.734 | 0.685 | 0.784 | 0.734 | 0.685 |
| lr | pred | none | 0.740 | 0.847 | 0.726 | 0.728 | 0.695 | 0.768 | 0.726 | 0.646 |
| lr | embed_linear | linear | 0.734 | 0.814 | 0.710 | 0.715 | 0.712 | 0.745 | 0.710 | 0.583 |
| lr | assoc | none | 0.728 | 0.815 | 0.704 | 0.708 | 0.702 | 0.740 | 0.704 | 0.575 |
| sgd | embed_linear | linear | 0.724 | 0.753 | 0.707 | 0.710 | 0.678 | 0.751 | 0.707 | 0.614 |
| lr | none | none | 0.715 | 0.809 | 0.692 | 0.695 | 0.679 | 0.733 | 0.692 | 0.567 |
| sgd | pred | none | 0.715 | 0.785 | 0.699 | 0.701 | 0.661 | 0.747 | 0.699 | 0.614 |
| lr | embed_lgbm | lgbm | 0.712 | 0.769 | 0.684 | 0.688 | 0.687 | 0.723 | 0.684 | 0.535 |
| sgd | none | none | 0.712 | 0.766 | 0.695 | 0.697 | 0.658 | 0.744 | 0.695 | 0.606 |
| sgd | embed_lgbm | lgbm | 0.708 | 0.689 | 0.689 | 0.691 | 0.661 | 0.735 | 0.689 | 0.583 |
| sgd | assoc | none | 0.705 | 0.763 | 0.675 | 0.678 | 0.684 | 0.714 | 0.675 | 0.512 |
| knn | wrap | none | 0.689 | 0.682 | 0.659 | 0.662 | 0.656 | 0.704 | 0.659 | 0.496 |
| knn | none | none | 0.686 | 0.713 | 0.654 | 0.656 | 0.656 | 0.699 | 0.654 | 0.480 |
| knn | embed_lgbm | lgbm | 0.673 | 0.721 | 0.633 | 0.632 | 0.654 | 0.680 | 0.633 | 0.417 |
| knn | assoc | none | 0.660 | 0.659 | 0.623 | 0.623 | 0.621 | 0.676 | 0.623 | 0.425 |
| knn | pred | none | 0.647 | 0.667 | 0.616 | 0.617 | 0.588 | 0.674 | 0.616 | 0.449 |
| knn | embed_linear | linear | 0.644 | 0.620 | 0.620 | 0.621 | 0.574 | 0.681 | 0.620 | 0.488 |
| dummy | wrap | none | 0.593 | 0.500 | 0.500 | 0.372 | nan | 0.593 | 0.500 | 0.000 |
| dummy | embed_linear | linear | 0.593 | 0.500 | 0.500 | 0.372 | nan | 0.593 | 0.500 | 0.000 |
| dummy | none | none | 0.593 | 0.500 | 0.500 | 0.372 | nan | 0.593 | 0.500 | 0.000 |
| dummy | pred | none | 0.593 | 0.500 | 0.500 | 0.372 | nan | 0.593 | 0.500 | 0.000 |
| dummy | embed_lgbm | lgbm | 0.593 | 0.500 | 0.500 | 0.372 | nan | 0.593 | 0.500 | 0.000 |
| dummy | assoc | none | 0.593 | 0.500 | 0.500 | 0.372 | nan | 0.593 | 0.500 | 0.000 |
nan = Not a Number.
Table A14.
Diagnosis without US image features 5-fold performance on the holdout set.
Table A14.
Diagnosis without US image features 5-fold performance on the holdout set.
| Model | Selection | Embed_Selector | Acc | Auroc | Bal-Acc | F1 | Npv | Ppv | Sens | Spec |
|---|---|---|---|---|---|---|---|---|---|---|
| lgbm | embed_lgbm | lgbm | 0.808 | 0.878 | 0.805 | 0.802 | 0.756 | 0.855 | 0.805 | 0.794 |
| lgbm | none | none | 0.801 | 0.880 | 0.798 | 0.795 | 0.753 | 0.847 | 0.798 | 0.779 |
| lgbm | embed_linear | linear | 0.795 | 0.894 | 0.788 | 0.787 | 0.751 | 0.833 | 0.788 | 0.755 |
| lgbm | assoc | none | 0.785 | 0.883 | 0.784 | 0.780 | 0.720 | 0.840 | 0.784 | 0.779 |
| rf | wrap | none | 0.782 | 0.865 | 0.776 | 0.774 | 0.730 | 0.826 | 0.776 | 0.747 |
| rf | pred | none | 0.779 | 0.867 | 0.776 | 0.773 | 0.714 | 0.831 | 0.776 | 0.763 |
| rf | assoc | none | 0.772 | 0.870 | 0.765 | 0.764 | 0.715 | 0.816 | 0.765 | 0.731 |
| lgbm | pred | none | 0.772 | 0.864 | 0.763 | 0.762 | 0.720 | 0.809 | 0.763 | 0.715 |
| lgbm | wrap | none | 0.769 | 0.866 | 0.775 | 0.765 | 0.686 | 0.856 | 0.775 | 0.810 |
| lr | pred | none | 0.766 | 0.831 | 0.750 | 0.752 | 0.728 | 0.790 | 0.750 | 0.667 |
| rf | none | none | 0.763 | 0.853 | 0.748 | 0.751 | 0.728 | 0.785 | 0.748 | 0.670 |
| rf | embed_linear | linear | 0.759 | 0.866 | 0.766 | 0.755 | 0.671 | 0.851 | 0.766 | 0.802 |
| rf | embed_lgbm | lgbm | 0.747 | 0.861 | 0.741 | 0.739 | 0.692 | 0.794 | 0.741 | 0.709 |
| lr | wrap | none | 0.747 | 0.815 | 0.733 | 0.734 | 0.704 | 0.778 | 0.733 | 0.660 |
| lr | assoc | none | 0.743 | 0.800 | 0.729 | 0.730 | 0.696 | 0.773 | 0.729 | 0.652 |
| lr | embed_linear | linear | 0.737 | 0.799 | 0.722 | 0.723 | 0.687 | 0.768 | 0.722 | 0.644 |
| lr | none | none | 0.730 | 0.798 | 0.714 | 0.716 | 0.682 | 0.761 | 0.714 | 0.628 |
| sgd | wrap | none | 0.718 | 0.710 | 0.710 | 0.708 | 0.648 | 0.771 | 0.710 | 0.668 |
| sgd | pred | none | 0.718 | 0.775 | 0.698 | 0.700 | 0.667 | 0.746 | 0.698 | 0.596 |
| lr | embed_lgbm | lgbm | 0.708 | 0.754 | 0.686 | 0.686 | 0.657 | 0.738 | 0.686 | 0.573 |
| sgd | assoc | none | 0.695 | 0.759 | 0.677 | 0.676 | 0.636 | 0.735 | 0.677 | 0.580 |
| sgd | none | none | 0.692 | 0.750 | 0.678 | 0.676 | 0.626 | 0.741 | 0.678 | 0.604 |
| knn | wrap | none | 0.686 | 0.706 | 0.671 | 0.671 | 0.625 | 0.728 | 0.671 | 0.590 |
| knn | pred | none | 0.683 | 0.716 | 0.669 | 0.670 | 0.618 | 0.727 | 0.669 | 0.598 |
| sgd | embed_lgbm | lgbm | 0.679 | 0.670 | 0.670 | 0.668 | 0.602 | 0.738 | 0.670 | 0.621 |
| sgd | embed_linear | linear | 0.676 | 0.736 | 0.665 | 0.663 | 0.597 | 0.737 | 0.665 | 0.612 |
| knn | none | none | 0.670 | 0.735 | 0.639 | 0.640 | 0.634 | 0.689 | 0.639 | 0.472 |
| knn | embed_lgbm | lgbm | 0.657 | 0.722 | 0.619 | 0.617 | 0.613 | 0.673 | 0.619 | 0.416 |
| knn | assoc | none | 0.654 | 0.680 | 0.638 | 0.639 | 0.580 | 0.702 | 0.638 | 0.552 |
| dummy | embed_lgbm | lgbm | 0.593 | 0.500 | 0.500 | 0.372 | nan | 0.593 | 0.500 | 0.000 |
| dummy | pred | none | 0.593 | 0.500 | 0.500 | 0.372 | nan | 0.593 | 0.500 | 0.000 |
| dummy | embed_linear | linear | 0.593 | 0.500 | 0.500 | 0.372 | nan | 0.593 | 0.500 | 0.000 |
| dummy | none | none | 0.593 | 0.500 | 0.500 | 0.372 | nan | 0.593 | 0.500 | 0.000 |
| dummy | wrap | none | 0.593 | 0.500 | 0.500 | 0.372 | nan | 0.593 | 0.500 | 0.000 |
| dummy | assoc | none | 0.593 | 0.500 | 0.500 | 0.372 | nan | 0.593 | 0.500 | 0.000 |
| knn | embed_linear | linear | 0.570 | 0.569 | 0.557 | 0.556 | 0.474 | 0.641 | 0.557 | 0.487 |
nan = Not a Number.
Appendix E
Hyperparameters established by Optuna hyperparameter tuning for each of our leading models.
Table A15.
Optuna hyperparameters, for example, leading models.
Table A15.
Optuna hyperparameters, for example, leading models.
| Target | US Features | Model | Feature Selection | Hyperparameters |
|---|---|---|---|---|
| Diagnosis | Yes | rf | embed_linear | {‘verbosity’: −1, ‘boosting_type’: ‘rf’, ‘bagging_freq’: 1, ‘bagging_fraction’: 0.6424705933428012, ‘n_estimators’: 100, ‘reg_alpha’: 0.0003532789339921058, ‘reg_lambda’: 0.004369030571226374, ‘num_leaves’: 8, ‘colsample_bytree’: 0.8437223587619459, ‘subsample’: 0.403473633073295, ‘subsample_freq’: 1, ‘min_child_samples’: 5} |
| Diagnosis | No | lgbm | embed_lgbm | {‘verbosity’: −1, ‘n_estimators’: 50, ‘reg_alpha’: 0.06466023097198124, ‘reg_lambda’: 0.022294761212156983, ‘num_leaves’: 15, ‘colsample_bytree’: 0.5464250771120893, ‘subsample’: 0.5536293838457955, ‘subsample_freq’: 7, ‘min_child_samples’: 29} |
| Management | Yes | lgbm | assoc | {‘verbosity’: −1, ‘n_estimators’: 150, ‘reg_alpha’: 0.01918207182498792, ‘reg_lambda’: 7.461771397395436, ‘num_leaves’: 2,’colsample_bytree’: 0.5614712282427238, ‘subsample’: 0.8168115609573287, ‘subsample_freq’: 5, ‘min_child_samples’: 7} |
| Management | No | lgbm | no_select | {‘verbosity’: −1, ‘n_estimators’: 50, ‘reg_alpha’: 1.2550179156417959 × 10⁻⁸, ‘reg_lambda’: 1.9742923076305905 × 10⁻⁸, ‘num_leaves’: 2, ‘colsample_bytree’: 0.9856142911837322, ‘subsample’: 0.7805261984723494, ‘subsample_freq’: 0, ‘min_child_samples’: 5} |
| Severity | Yes | lr | wrap | {‘max_iter’: 2000, ‘penalty’: ‘elasticnet’, ‘solver’: ‘saga’, ‘l1_ratio’: 0.09092139813688659, ‘C’: 0.0007760418893874168} |
| Severity | No | lgbm | assoc | {‘verbosity’: −1, ‘n_estimators’: 200, ‘reg_alpha’: 0.025561180230324252, ‘reg_lambda’: 0.0020714646371430326, ‘num_leaves’: 67, ‘colsample_bytree’: 0.4887103613060258, ‘subsample’: 0.5044229983427804, ‘subsample_freq’: 3, ‘min_child_samples’: 18} |
Appendix F
Results from predicting management with US image features.
Table A16.
Management with US image features holdout set performance.
Table A16.
Management with US image features holdout set performance.
| Model | Selection | Embed_Selector | Acc | Auroc | Bal-Acc | F1 | Npv | Ppv | Sens | Spec |
|---|---|---|---|---|---|---|---|---|---|---|
| rf | assoc | none | 0.936 | 0.984 | 0.922 | 0.931 | 0.963 | 0.922 | 0.922 | 0.866 |
| rf | embed_linear | linear | 0.936 | 0.978 | 0.922 | 0.931 | 0.963 | 0.922 | 0.922 | 0.866 |
| rf | none | none | 0.933 | 0.980 | 0.917 | 0.927 | 0.971 | 0.914 | 0.917 | 0.849 |
| lgbm | none | none | 0.930 | 0.982 | 0.916 | 0.924 | 0.953 | 0.917 | 0.916 | 0.857 |
| rf | pred | none | 0.930 | 0.977 | 0.914 | 0.924 | 0.962 | 0.913 | 0.914 | 0.849 |
| lgbm | pred | none | 0.927 | 0.980 | 0.911 | 0.920 | 0.953 | 0.913 | 0.911 | 0.849 |
| rf | wrap | none | 0.923 | 0.946 | 0.902 | 0.916 | 0.980 | 0.897 | 0.902 | 0.815 |
| rf | embed_lgbm | lgbm | 0.923 | 0.980 | 0.909 | 0.917 | 0.944 | 0.913 | 0.909 | 0.849 |
| lgbm | assoc | none | 0.923 | 0.981 | 0.907 | 0.917 | 0.952 | 0.909 | 0.907 | 0.840 |
| lgbm | embed_lgbm | lgbm | 0.923 | 0.982 | 0.906 | 0.916 | 0.961 | 0.905 | 0.906 | 0.832 |
| lgbm | embed_linear | linear | 0.920 | 0.983 | 0.903 | 0.913 | 0.952 | 0.904 | 0.903 | 0.832 |
| lgbm | wrap | none | 0.920 | 0.943 | 0.900 | 0.912 | 0.970 | 0.897 | 0.900 | 0.815 |
| lr | pred | none | 0.879 | 0.949 | 0.855 | 0.866 | 0.909 | 0.864 | 0.855 | 0.756 |
| lr | embed_linear | linear | 0.866 | 0.929 | 0.838 | 0.851 | 0.905 | 0.849 | 0.838 | 0.723 |
| lr | none | none | 0.866 | 0.929 | 0.838 | 0.851 | 0.905 | 0.849 | 0.838 | 0.723 |
| lr | assoc | none | 0.863 | 0.924 | 0.834 | 0.847 | 0.904 | 0.845 | 0.834 | 0.714 |
| lr | embed_lgbm | lgbm | 0.853 | 0.920 | 0.823 | 0.836 | 0.892 | 0.836 | 0.823 | 0.697 |
| sgd | pred | none | 0.847 | 0.890 | 0.837 | 0.837 | 0.798 | 0.876 | 0.837 | 0.798 |
| sgd | assoc | none | 0.827 | 0.839 | 0.823 | 0.819 | 0.756 | 0.876 | 0.823 | 0.807 |
| lr | wrap | none | 0.827 | 0.897 | 0.784 | 0.801 | 0.911 | 0.799 | 0.784 | 0.605 |
| sgd | none | none | 0.805 | 0.789 | 0.789 | 0.791 | 0.754 | 0.834 | 0.789 | 0.723 |
| sgd | embed_linear | linear | 0.802 | 0.872 | 0.785 | 0.788 | 0.752 | 0.830 | 0.785 | 0.714 |
| sgd | wrap | none | 0.780 | 0.792 | 0.759 | 0.762 | 0.727 | 0.808 | 0.759 | 0.672 |
| sgd | embed_lgbm | lgbm | 0.776 | 0.852 | 0.746 | 0.754 | 0.747 | 0.790 | 0.746 | 0.622 |
| knn | embed_lgbm | lgbm | 0.741 | 0.772 | 0.699 | 0.706 | 0.721 | 0.749 | 0.699 | 0.521 |
| knn | pred | none | 0.719 | 0.779 | 0.656 | 0.659 | 0.746 | 0.712 | 0.656 | 0.395 |
| knn | none | none | 0.696 | 0.757 | 0.617 | 0.606 | 0.773 | 0.684 | 0.617 | 0.286 |
| knn | embed_linear | linear | 0.696 | 0.757 | 0.617 | 0.606 | 0.773 | 0.684 | 0.617 | 0.286 |
| knn | assoc | none | 0.696 | 0.757 | 0.617 | 0.606 | 0.773 | 0.684 | 0.617 | 0.286 |
| knn | wrap | none | 0.687 | 0.720 | 0.637 | 0.640 | 0.630 | 0.707 | 0.637 | 0.429 |
| dummy | embed_lgbm | lgbm | 0.620 | 0.500 | 0.500 | 0.383 | nan | 0.620 | 0.500 | 0.000 |
| dummy | wrap | none | 0.620 | 0.500 | 0.500 | 0.383 | nan | 0.620 | 0.500 | 0.000 |
| dummy | pred | none | 0.620 | 0.500 | 0.500 | 0.383 | nan | 0.620 | 0.500 | 0.000 |
| dummy | none | none | 0.620 | 0.500 | 0.500 | 0.383 | nan | 0.620 | 0.500 | 0.000 |
| dummy | embed_linear | linear | 0.620 | 0.500 | 0.500 | 0.383 | nan | 0.620 | 0.500 | 0.000 |
| dummy | assoc | none | 0.620 | 0.500 | 0.500 | 0.383 | nan | 0.620 | 0.500 | 0.000 |
nan = Not a Number.
Table A17.
Management with US image features 5-fold performance on the holdout set.
Table A17.
Management with US image features 5-fold performance on the holdout set.
| Model | Selection | Embed_Selector | Acc | Auroc | Bal-Acc | F1 | Npv | Ppv | Sens | Spec |
|---|---|---|---|---|---|---|---|---|---|---|
| lgbm | assoc | none | 0.930 | 0.976 | 0.918 | 0.924 | 0.945 | 0.922 | 0.918 | 0.866 |
| lgbm | embed_linear | linear | 0.930 | 0.973 | 0.918 | 0.924 | 0.944 | 0.923 | 0.918 | 0.867 |
| rf | embed_lgbm | lgbm | 0.927 | 0.973 | 0.912 | 0.920 | 0.953 | 0.914 | 0.912 | 0.850 |
| rf | none | none | 0.920 | 0.968 | 0.907 | 0.913 | 0.937 | 0.914 | 0.907 | 0.850 |
| rf | embed_linear | linear | 0.920 | 0.971 | 0.905 | 0.913 | 0.944 | 0.909 | 0.905 | 0.841 |
| rf | assoc | none | 0.920 | 0.973 | 0.908 | 0.914 | 0.929 | 0.917 | 0.908 | 0.858 |
| lgbm | embed_lgbm | lgbm | 0.920 | 0.969 | 0.910 | 0.914 | 0.919 | 0.922 | 0.910 | 0.866 |
| lgbm | wrap | none | 0.911 | 0.937 | 0.893 | 0.902 | 0.942 | 0.897 | 0.893 | 0.816 |
| rf | pred | none | 0.911 | 0.968 | 0.896 | 0.902 | 0.928 | 0.905 | 0.896 | 0.833 |
| lgbm | none | none | 0.907 | 0.976 | 0.895 | 0.900 | 0.914 | 0.909 | 0.895 | 0.841 |
| lgbm | pred | none | 0.907 | 0.971 | 0.895 | 0.900 | 0.911 | 0.906 | 0.895 | 0.841 |
| rf | wrap | none | 0.904 | 0.938 | 0.886 | 0.895 | 0.936 | 0.892 | 0.886 | 0.808 |
| lr | pred | none | 0.882 | 0.938 | 0.864 | 0.871 | 0.890 | 0.881 | 0.864 | 0.790 |
| lr | embed_linear | linear | 0.805 | 0.892 | 0.778 | 0.786 | 0.795 | 0.812 | 0.778 | 0.664 |
| lr | none | none | 0.805 | 0.892 | 0.778 | 0.786 | 0.795 | 0.812 | 0.778 | 0.664 |
| sgd | pred | none | 0.801 | 0.861 | 0.789 | 0.789 | 0.748 | 0.839 | 0.789 | 0.739 |
| lr | assoc | none | 0.799 | 0.888 | 0.771 | 0.779 | 0.786 | 0.808 | 0.771 | 0.656 |
| lr | embed_lgbm | lgbm | 0.782 | 0.877 | 0.750 | 0.759 | 0.773 | 0.789 | 0.750 | 0.614 |
| sgd | wrap | none | 0.770 | 0.778 | 0.756 | 0.756 | 0.711 | 0.814 | 0.756 | 0.697 |
| lr | wrap | none | 0.754 | 0.837 | 0.710 | 0.719 | 0.759 | 0.755 | 0.710 | 0.529 |
| sgd | none | none | 0.750 | 0.730 | 0.730 | 0.733 | 0.690 | 0.788 | 0.730 | 0.647 |
| sgd | embed_linear | linear | 0.744 | 0.812 | 0.724 | 0.726 | 0.684 | 0.783 | 0.724 | 0.639 |
| sgd | assoc | none | 0.741 | 0.791 | 0.716 | 0.720 | 0.687 | 0.775 | 0.716 | 0.614 |
| sgd | embed_lgbm | lgbm | 0.725 | 0.814 | 0.702 | 0.704 | 0.649 | 0.768 | 0.702 | 0.605 |
| knn | pred | none | 0.716 | 0.782 | 0.644 | 0.640 | 0.795 | 0.702 | 0.644 | 0.344 |
| knn | none | none | 0.697 | 0.755 | 0.615 | 0.599 | 0.778 | 0.684 | 0.615 | 0.276 |
| knn | embed_linear | linear | 0.697 | 0.755 | 0.615 | 0.599 | 0.778 | 0.684 | 0.615 | 0.276 |
| knn | assoc | none | 0.697 | 0.755 | 0.615 | 0.599 | 0.778 | 0.684 | 0.615 | 0.276 |
| knn | embed_lgbm | lgbm | 0.693 | 0.750 | 0.656 | 0.658 | 0.623 | 0.728 | 0.656 | 0.504 |
| knn | wrap | none | 0.690 | 0.718 | 0.658 | 0.660 | 0.617 | 0.731 | 0.658 | 0.522 |
| dummy | embed_lgbm | lgbm | 0.620 | 0.500 | 0.500 | 0.383 | nan | 0.620 | 0.500 | 0.000 |
| dummy | embed_linear | linear | 0.620 | 0.500 | 0.500 | 0.383 | nan | 0.620 | 0.500 | 0.000 |
| dummy | wrap | none | 0.620 | 0.500 | 0.500 | 0.383 | nan | 0.620 | 0.500 | 0.000 |
| dummy | none | none | 0.620 | 0.500 | 0.500 | 0.383 | nan | 0.620 | 0.500 | 0.000 |
| dummy | pred | none | 0.620 | 0.500 | 0.500 | 0.383 | nan | 0.620 | 0.500 | 0.000 |
| dummy | assoc | none | 0.620 | 0.500 | 0.500 | 0.383 | nan | 0.620 | 0.500 | 0.000 |
nan = Not a Number.
Appendix G
Filter-based Association Feature Selection Results for Predicting Management with US image derived features.
Table A18.
Continuous Feature scores (Mutual Information: Higher = More important).
Table A18.
Continuous Feature scores (Mutual Information: Higher = More important).
| Mut_Info | |
|---|---|
| CRP__Management.0 | 1.396 × 10⁻¹ |
| CRP__Management.1 | 1.358 × 10⁻¹ |
| Alvarado_Score__Management.1 | 1.052 × 10⁻¹ |
| Appendix_Diameter__Management.0 | 9.615 × 10⁻² |
| Appendix_Diameter__Management.1 | 8.457 × 10⁻² |
| WBC_Count__Management.1 | 7.696 × 10⁻² |
| Neutrophil_Percentage__Management.0 | 7.531 × 10⁻² |
| Paedriatic_Appendicitis_Score__Management.0 | 7.084 × 10⁻² |
| Neutrophil_Percentage__Management.1 | 6.487 × 10⁻² |
| Alvarado_Score__Management.0 | 6.183 × 10⁻² |
| WBC_Count__Management.0 | 6.059 × 10⁻² |
| Height__Management.1 | 5.915 × 10⁻² |
| RDW__Management.0 | 5.379 × 10⁻² |
| Segmented_Neutrophils__Management.0 | 5.172 × 10⁻² |
| Paedriatic_Appendicitis_Score__Management.1 | 4.978 × 10⁻² |
| RDW__Management.1 | 4.709 × 10⁻² |
| Ketones_in_Urine__Management.0 | 4.477 × 10⁻² |
| Weight__Management.0 | 4.001 × 10⁻² |
| Weight__Management.1 | 3.639 × 10⁻² |
| Hemoglobin__Management.0 | 3.513 × 10⁻² |
| Height__Management.0 | 3.048 × 10⁻² |
| Body_Temperature__Management.0 | 2.882 × 10⁻² |
| Ketones_in_Urine__Management.1 | 2.756 × 10⁻² |
| RBC_Count__Management.1 | 1.856 × 10⁻² |
| Body_Temperature__Management.1 | 1.781 × 10⁻² |
| Hemoglobin__Management.1 | 1.754 × 10⁻² |
| WBC_in_Urine__Management.1 | 1.720 × 10⁻² |
| RBC_Count__Management.0 | 1.283 × 10⁻² |
| Age__Management.0 | 9.069 × 10⁻³ |
| Age__Management.1 | 8.695 × 10⁻³ |
| RBC_in_Urine__Management.1 | 8.061 × 10⁻³ |
| Segmented_Neutrophils__Management.1 | 0.000 × 100 |
| Thrombocyte_Count__Management.0 | 0.000 × 100 |
| Thrombocyte_Count__Management.1 | 0.000 × 100 |
| BMI__Management.1 | 0.000 × 100 |
| RBC_in_Urine__Management.0 | 0.000 × 100 |
| WBC_in_Urine__Management.0 | 0.000 × 100 |
| BMI__Management.0 | 0.000 × 100 |
Table A19.
Categorical Feature scores (Mutual Information: Higher = More important).
Table A19.
Categorical Feature scores (Mutual Information: Higher = More important).
| Feature_Targetclass | Mut_Info |
|---|---|
| Ipsilateral_Rebound_Tenderness__Management.surgical | 2.827 × 10⁻¹ |
| Ipsilateral_Rebound_Tenderness__Management.conservative | 2.827 × 10⁻¹ |
| Ipsilateral_Rebound_Tenderness | 2.827 × 10⁻¹ |
| Diagnosis | 2.553 × 10⁻¹ |
| Diagnosis__Management.surgical | 2.553 × 10⁻¹ |
| Diagnosis__Management.conservative | 2.553 × 10⁻¹ |
| Peritonitis__Management.conservative | 1.963 × 10⁻¹ |
| Peritonitis | 1.963 × 10⁻¹ |
| Peritonitis__Management.surgical | 1.963 × 10⁻¹ |
| Severity | 1.800 × 10⁻¹ |
| Severity__Management.conservative | 1.800 × 10⁻¹ |
| Severity__Management.surgical | 1.800 × 10⁻¹ |
| Surrounding_Tissue_Reaction__Management.conservative | 1.077 × 10⁻¹ |
| Surrounding_Tissue_Reaction | 1.077 × 10⁻¹ |
| Surrounding_Tissue_Reaction__Management.surgical | 1.077 × 10⁻¹ |
| Neutrophilia__Management.surgical | 6.087 × 10⁻² |
| Neutrophilia | 6.087 × 10⁻² |
| Neutrophilia__Management.conservative | 6.087 × 10⁻² |
| Appendix_Wall_Layers__Management.conservative | 5.302 × 10⁻² |
| Appendix_Wall_Layers | 5.302 × 10⁻² |
| Appendix_Wall_Layers__Management.surgical | 5.302 × 10⁻² |
| Ileus__Management.conservative | 4.696 × 10⁻² |
| Ileus__Management.surgical | 4.696 × 10⁻² |
| Ileus | 4.696 × 10⁻² |
| Dysuria__Management.conservative | 3.966 × 10⁻² |
| Dysuria | 3.966 × 10⁻² |
| Dysuria__Management.surgical | 3.966 × 10⁻² |
| Free_Fluids__Management.surgical | 3.871 × 10⁻² |
| Free_Fluids__Management.conservative | 3.871 × 10⁻² |
| Free_Fluids | 3.871 × 10⁻² |
| Perforation__Management.conservative | 3.749 × 10⁻² |
| Perforation__Management.surgical | 3.749 × 10⁻² |
| Perforation | 3.749 × 10⁻² |
| Appendicolith | 3.328 × 10⁻² |
| Appendicolith__Management.surgical | 3.328 × 10⁻² |
| Appendicolith__Management.conservative | 3.328 × 10⁻² |
| Psoas_Sign | 3.245 × 10⁻² |
| Psoas_Sign__Management.surgical | 3.245 × 10⁻² |
| Psoas_Sign__Management.conservative | 3.245 × 10⁻² |
| Target_Sign__Management.surgical | 3.087 × 10⁻² |
| Target_Sign__Management.conservative | 3.087 × 10⁻² |
| Target_Sign | 3.087 × 10⁻² |
| Contralateral_Rebound_Tenderness | 2.795 × 10⁻² |
| Contralateral_Rebound_Tenderness__Management.surgical | 2.795 × 10⁻² |
| Contralateral_Rebound_Tenderness__Management.conservative | 2.795 × 10⁻² |
| Coprostasis__Management.conservative | 2.749 × 10⁻² |
| Coprostasis | 2.749 × 10⁻² |
| Coprostasis__Management.surgical | 2.749 × 10⁻² |
| Perfusion__Management.conservative | 2.600 × 10⁻² |
| Perfusion__Management.surgical | 2.600 × 10⁻² |
| Perfusion | 2.600 × 10⁻² |
| Nausea | 2.583 × 10⁻² |
| Nausea__Management.surgical | 2.583 × 10⁻² |
| Nausea__Management.conservative | 2.583 × 10⁻² |
| Loss_of_Appetite__Management.surgical | 2.467 × 10⁻² |
| Loss_of_Appetite__Management.conservative | 2.467 × 10⁻² |
| Loss_of_Appetite | 2.467 × 10⁻² |
| Enteritis__Management.surgical | 2.135 × 10⁻² |
| Enteritis | 2.135 × 10⁻² |
| Enteritis__Management.conservative | 2.135 × 10⁻² |
| Stool__Management.conservative | 2.133 × 10⁻² |
| Stool__Management.surgical | 2.133 × 10⁻² |
| Stool | 2.133 × 10⁻² |
| Conglomerate_of_Bowel_Loops__Management.conservative | 2.066 × 10⁻² |
| Conglomerate_of_Bowel_Loops__Management.surgical | 2.066 × 10⁻² |
| Conglomerate_of_Bowel_Loops | 2.066 × 10⁻² |
| Bowel_Wall_Thickening__Management.surgical | 1.697 × 10⁻² |
| Bowel_Wall_Thickening__Management.conservative | 1.697 × 10⁻² |
| Bowel_Wall_Thickening | 1.697 × 10⁻² |
| Appendicular_Abscess | 1.666 × 10⁻² |
| Appendicular_Abscess__Management.conservative | 1.666 × 10⁻² |
| Appendicular_Abscess__Management.surgical | 1.666 × 10⁻² |
| Coughing_Pain__Management.conservative | 1.565 × 10⁻² |
| Coughing_Pain__Management.surgical | 1.565 × 10⁻² |
| Coughing_Pain | 1.565 × 10⁻² |
| Meteorism | 1.319 × 10⁻² |
| Meteorism__Management.surgical | 1.319 × 10⁻² |
| Meteorism__Management.conservative | 1.319 × 10⁻² |
| Appendix_on_US | 1.000 × 10⁻² |
| Appendix_on_US__Management.conservative | 1.000 × 10⁻² |
| Appendix_on_US__Management.surgical | 1.000 × 10⁻² |
| US_Performed | 6.948 × 10⁻³ |
| US_Performed__Management.surgical | 6.948 × 10⁻³ |
| US_Performed__Management.conservative | 6.948 × 10⁻³ |
| Lower_Right_Abd_Pain__Management.conservative | 6.616 × 10⁻³ |
| Lower_Right_Abd_Pain__Management.surgical | 6.616 × 10⁻³ |
| Lower_Right_Abd_Pain | 6.616 × 10⁻³ |
| Migratory_Pain__Management.surgical | 6.200 × 10⁻³ |
| Migratory_Pain | 6.200 × 10⁻³ |
| Migratory_Pain__Management.conservative | 6.200 × 10⁻³ |
| Pathological_Lymph_Nodes__Management.conservative | 5.161 × 10⁻³ |
| Pathological_Lymph_Nodes__Management.surgical | 5.161 × 10⁻³ |
| Pathological_Lymph_Nodes | 5.161 × 10⁻³ |
| Sex__Management.conservative | 4.313 × 10⁻⁴ |
| Sex__Management.surgical | 4.313 × 10⁻⁴ |
| Sex | 4.313 × 10⁻⁴ |
Appendix H
Results from predicting management without US image features.
Table A20.
Management without US image features holdout set performance.
Table A20.
Management without US image features holdout set performance.
| Model | Selection | Embed_Selector | Acc | Auroc | Bal-Acc | F1 | Npv | Ppv | Sens | Spec |
|---|---|---|---|---|---|---|---|---|---|---|
| rf | none | none | 0.939 | 0.980 | 0.925 | 0.934 | 0.972 | 0.923 | 0.925 | 0.866 |
| rf | assoc | none | 0.936 | 0.980 | 0.922 | 0.931 | 0.963 | 0.922 | 0.922 | 0.866 |
| lgbm | embed_linear | linear | 0.936 | 0.977 | 0.921 | 0.930 | 0.971 | 0.918 | 0.921 | 0.857 |
| lgbm | embed_lgbm | lgbm | 0.933 | 0.975 | 0.918 | 0.927 | 0.962 | 0.918 | 0.918 | 0.857 |
| rf | embed_linear | linear | 0.933 | 0.979 | 0.918 | 0.927 | 0.962 | 0.918 | 0.918 | 0.857 |
| lgbm | none | none | 0.930 | 0.978 | 0.916 | 0.924 | 0.953 | 0.917 | 0.916 | 0.857 |
| rf | embed_lgbm | lgbm | 0.930 | 0.979 | 0.916 | 0.924 | 0.953 | 0.917 | 0.916 | 0.857 |
| lgbm | assoc | none | 0.930 | 0.977 | 0.914 | 0.924 | 0.962 | 0.913 | 0.914 | 0.849 |
| rf | pred | none | 0.927 | 0.981 | 0.911 | 0.920 | 0.953 | 0.913 | 0.911 | 0.849 |
| rf | wrap | none | 0.920 | 0.960 | 0.901 | 0.913 | 0.961 | 0.900 | 0.901 | 0.824 |
| lgbm | pred | none | 0.917 | 0.978 | 0.896 | 0.909 | 0.970 | 0.893 | 0.896 | 0.807 |
| lgbm | wrap | none | 0.917 | 0.953 | 0.894 | 0.908 | 0.979 | 0.889 | 0.894 | 0.798 |
| lr | pred | none | 0.856 | 0.932 | 0.819 | 0.836 | 0.940 | 0.825 | 0.819 | 0.664 |
| lr | none | none | 0.837 | 0.925 | 0.802 | 0.816 | 0.886 | 0.818 | 0.802 | 0.655 |
| lr | embed_linear | linear | 0.837 | 0.925 | 0.802 | 0.816 | 0.886 | 0.818 | 0.802 | 0.655 |
| lr | assoc | none | 0.837 | 0.925 | 0.802 | 0.816 | 0.886 | 0.818 | 0.802 | 0.655 |
| sgd | none | none | 0.834 | 0.822 | 0.822 | 0.823 | 0.786 | 0.862 | 0.822 | 0.773 |
| lr | embed_lgbm | lgbm | 0.824 | 0.916 | 0.788 | 0.802 | 0.864 | 0.809 | 0.788 | 0.639 |
| sgd | assoc | none | 0.824 | 0.813 | 0.813 | 0.813 | 0.771 | 0.856 | 0.813 | 0.765 |
| lr | wrap | none | 0.815 | 0.903 | 0.771 | 0.786 | 0.886 | 0.791 | 0.771 | 0.588 |
| sgd | pred | none | 0.802 | 0.788 | 0.788 | 0.789 | 0.744 | 0.837 | 0.788 | 0.731 |
| sgd | embed_linear | linear | 0.767 | 0.862 | 0.744 | 0.748 | 0.713 | 0.795 | 0.744 | 0.647 |
| sgd | embed_lgbm | lgbm | 0.754 | 0.750 | 0.738 | 0.739 | 0.678 | 0.800 | 0.738 | 0.672 |
| knn | assoc | none | 0.719 | 0.732 | 0.666 | 0.671 | 0.707 | 0.723 | 0.666 | 0.445 |
| knn | embed_linear | linear | 0.719 | 0.732 | 0.666 | 0.671 | 0.707 | 0.723 | 0.666 | 0.445 |
| knn | wrap | none | 0.709 | 0.723 | 0.642 | 0.642 | 0.741 | 0.702 | 0.642 | 0.361 |
| knn | pred | none | 0.706 | 0.748 | 0.633 | 0.629 | 0.765 | 0.695 | 0.633 | 0.328 |
| sgd | wrap | none | 0.703 | 0.802 | 0.677 | 0.680 | 0.618 | 0.749 | 0.677 | 0.571 |
| knn | embed_lgbm | lgbm | 0.703 | 0.739 | 0.653 | 0.657 | 0.662 | 0.717 | 0.653 | 0.445 |
| knn | none | none | 0.626 | 0.588 | 0.588 | 0.589 | 0.510 | 0.681 | 0.588 | 0.429 |
| dummy | embed_lgbm | lgbm | 0.620 | 0.500 | 0.500 | 0.383 | nan | 0.620 | 0.500 | 0.000 |
| dummy | wrap | none | 0.620 | 0.500 | 0.500 | 0.383 | nan | 0.620 | 0.500 | 0.000 |
| dummy | pred | none | 0.620 | 0.500 | 0.500 | 0.383 | nan | 0.620 | 0.500 | 0.000 |
| dummy | none | none | 0.620 | 0.500 | 0.500 | 0.383 | nan | 0.620 | 0.500 | 0.000 |
| dummy | embed_linear | linear | 0.620 | 0.500 | 0.500 | 0.383 | nan | 0.620 | 0.500 | 0.000 |
| dummy | assoc | none | 0.620 | 0.500 | 0.500 | 0.383 | nan | 0.620 | 0.500 | 0.000 |
nan = Not a Number.
Table A21.
Management without US image features 5-fold performance on the holdout set.
Table A21.
Management without US image features 5-fold performance on the holdout set.
| Model | Selection | Embed_Selector | Acc | Auroc | Bal-Acc | F1 | Npv | Ppv | Sens | Spec |
|---|---|---|---|---|---|---|---|---|---|---|
| lgbm | none | none | 0.930 | 0.971 | 0.916 | 0.923 | 0.952 | 0.919 | 0.916 | 0.858 |
| rf | wrap | none | 0.927 | 0.942 | 0.914 | 0.920 | 0.945 | 0.920 | 0.914 | 0.858 |
| rf | embed_lgbm | lgbm | 0.927 | 0.968 | 0.912 | 0.920 | 0.952 | 0.914 | 0.912 | 0.850 |
| lgbm | assoc | none | 0.920 | 0.973 | 0.905 | 0.913 | 0.944 | 0.910 | 0.905 | 0.841 |
| rf | assoc | none | 0.920 | 0.969 | 0.905 | 0.913 | 0.943 | 0.909 | 0.905 | 0.841 |
| rf | none | none | 0.920 | 0.970 | 0.907 | 0.913 | 0.934 | 0.913 | 0.907 | 0.849 |
| lgbm | embed_linear | linear | 0.917 | 0.970 | 0.903 | 0.909 | 0.935 | 0.910 | 0.903 | 0.841 |
| lgbm | pred | none | 0.914 | 0.974 | 0.905 | 0.907 | 0.903 | 0.922 | 0.905 | 0.867 |
| rf | embed_linear | linear | 0.914 | 0.964 | 0.898 | 0.906 | 0.933 | 0.904 | 0.898 | 0.833 |
| rf | pred | none | 0.907 | 0.968 | 0.892 | 0.899 | 0.925 | 0.900 | 0.892 | 0.825 |
| lgbm | embed_lgbm | lgbm | 0.898 | 0.960 | 0.885 | 0.889 | 0.895 | 0.905 | 0.885 | 0.833 |
| lgbm | wrap | none | 0.895 | 0.948 | 0.875 | 0.884 | 0.927 | 0.884 | 0.875 | 0.791 |
| lr | pred | none | 0.776 | 0.863 | 0.743 | 0.751 | 0.767 | 0.785 | 0.743 | 0.605 |
| lr | assoc | none | 0.760 | 0.864 | 0.725 | 0.733 | 0.735 | 0.772 | 0.725 | 0.580 |
| lr | none | none | 0.760 | 0.864 | 0.725 | 0.733 | 0.735 | 0.772 | 0.725 | 0.580 |
| lr | embed_linear | linear | 0.760 | 0.864 | 0.725 | 0.733 | 0.735 | 0.772 | 0.725 | 0.580 |
| lr | wrap | none | 0.751 | 0.841 | 0.713 | 0.721 | 0.728 | 0.761 | 0.713 | 0.554 |
| sgd | pred | none | 0.751 | 0.735 | 0.735 | 0.735 | 0.675 | 0.800 | 0.735 | 0.672 |
| lr | embed_lgbm | lgbm | 0.748 | 0.854 | 0.713 | 0.720 | 0.708 | 0.766 | 0.713 | 0.571 |
| sgd | none | none | 0.738 | 0.722 | 0.722 | 0.722 | 0.661 | 0.789 | 0.722 | 0.656 |
| sgd | embed_linear | linear | 0.735 | 0.815 | 0.718 | 0.718 | 0.657 | 0.784 | 0.718 | 0.647 |
| sgd | wrap | none | 0.732 | 0.787 | 0.708 | 0.711 | 0.665 | 0.773 | 0.708 | 0.613 |
| sgd | assoc | none | 0.731 | 0.715 | 0.715 | 0.715 | 0.659 | 0.782 | 0.715 | 0.647 |
| sgd | embed_lgbm | lgbm | 0.709 | 0.712 | 0.691 | 0.691 | 0.626 | 0.763 | 0.691 | 0.614 |
| knn | wrap | none | 0.700 | 0.721 | 0.639 | 0.638 | 0.693 | 0.705 | 0.639 | 0.386 |
| knn | pred | none | 0.697 | 0.759 | 0.612 | 0.592 | 0.812 | 0.681 | 0.612 | 0.260 |
| knn | embed_lgbm | lgbm | 0.684 | 0.723 | 0.648 | 0.650 | 0.610 | 0.722 | 0.648 | 0.496 |
| knn | embed_linear | linear | 0.658 | 0.708 | 0.622 | 0.622 | 0.571 | 0.705 | 0.622 | 0.471 |
| knn | assoc | none | 0.658 | 0.708 | 0.622 | 0.622 | 0.571 | 0.705 | 0.622 | 0.471 |
| knn | none | none | 0.636 | 0.620 | 0.620 | 0.617 | 0.522 | 0.715 | 0.620 | 0.555 |
| dummy | embed_lgbm | lgbm | 0.620 | 0.500 | 0.500 | 0.383 | nan | 0.620 | 0.500 | 0.000 |
| dummy | wrap | none | 0.620 | 0.500 | 0.500 | 0.383 | nan | 0.620 | 0.500 | 0.000 |
| dummy | pred | none | 0.620 | 0.500 | 0.500 | 0.383 | nan | 0.620 | 0.500 | 0.000 |
| dummy | none | none | 0.620 | 0.500 | 0.500 | 0.383 | nan | 0.620 | 0.500 | 0.000 |
| dummy | embed_linear | linear | 0.620 | 0.500 | 0.500 | 0.383 | nan | 0.620 | 0.500 | 0.000 |
| dummy | assoc | none | 0.620 | 0.500 | 0.500 | 0.383 | nan | 0.620 | 0.500 | 0.000 |
nan = Not a Number.
Appendix I
Redundancy-Aware Step-Up Feature Selection Results for predicting Management without US image features.
Table A22.
Selection scores (Accuracy: Higher = More important) for redundancy-aware feature selection predicting management without US features.
Table A22.
Selection scores (Accuracy: Higher = More important) for redundancy-aware feature selection predicting management without US features.
| Feature | Score |
|---|---|
| Ipsilateral_Rebound_Tenderness_nan | 8.312 × 10⁻¹ |
| Severity_uncomplicated | 8.932 × 10⁻¹ |
| RDW | 8.953 × 10⁻¹ |
| Peritonitis_no | 9.359 × 10⁻¹ |
| WBC_Count | 9.359 × 10⁻¹ |
| Peritonitis_local | 9.295 × 10⁻¹ |
| Body_Temperature | 9.274 × 10⁻¹ |
| Weight | 8.932 × 10⁻¹ |
| CRP | 8.720 × 10⁻¹ |
| Segmented_Neutrophils | 8.397 × 10⁻¹ |
| Height | 7.884 × 10⁻¹ |
| Thrombocyte_Count | 7.478 × 10⁻¹ |
Appendix J
Results from predicting Severity with US image features.
Table A23.
Severity with US image features holdout set performance.
Table A23.
Severity with US image features holdout set performance.
| Model | Selection | Embed_Selector | Acc | Auroc | Bal-Acc | F1 | Npv | Ppv | Sens | Spec |
|---|---|---|---|---|---|---|---|---|---|---|
| lgbm | pred | none | 0.891 | 0.908 | 0.723 | 0.756 | 0.911 | 0.719 | 0.723 | 0.966 |
| lr | wrap | none | 0.891 | 0.834 | 0.706 | 0.745 | 0.905 | 0.750 | 0.706 | 0.974 |
| lr | pred | none | 0.891 | 0.879 | 0.706 | 0.745 | 0.905 | 0.750 | 0.706 | 0.974 |
| lgbm | embed_lgbm | lgbm | 0.891 | 0.939 | 0.782 | 0.787 | 0.933 | 0.652 | 0.782 | 0.940 |
| lr | assoc | none | 0.888 | 0.893 | 0.704 | 0.741 | 0.905 | 0.724 | 0.704 | 0.970 |
| sgd | assoc | none | 0.888 | 0.854 | 0.712 | 0.746 | 0.908 | 0.710 | 0.712 | 0.966 |
| rf | embed_lgbm | lgbm | 0.888 | 0.929 | 0.780 | 0.783 | 0.932 | 0.638 | 0.780 | 0.936 |
| lr | none | none | 0.888 | 0.895 | 0.704 | 0.741 | 0.905 | 0.724 | 0.704 | 0.970 |
| lgbm | assoc | none | 0.888 | 0.932 | 0.755 | 0.771 | 0.923 | 0.659 | 0.755 | 0.947 |
| rf | wrap | none | 0.885 | 0.879 | 0.727 | 0.753 | 0.913 | 0.667 | 0.727 | 0.955 |
| rf | pred | none | 0.885 | 0.906 | 0.753 | 0.766 | 0.923 | 0.643 | 0.753 | 0.943 |
| lr | embed_linear | linear | 0.885 | 0.892 | 0.702 | 0.736 | 0.905 | 0.700 | 0.702 | 0.966 |
| sgd | none | none | 0.882 | 0.857 | 0.700 | 0.732 | 0.904 | 0.677 | 0.700 | 0.962 |
| sgd | embed_linear | linear | 0.882 | 0.864 | 0.700 | 0.732 | 0.904 | 0.677 | 0.700 | 0.962 |
| rf | assoc | none | 0.882 | 0.933 | 0.811 | 0.788 | 0.945 | 0.596 | 0.811 | 0.913 |
| lr | embed_lgbm | lgbm | 0.882 | 0.883 | 0.691 | 0.726 | 0.901 | 0.690 | 0.691 | 0.966 |
| sgd | wrap | none | 0.882 | 0.825 | 0.700 | 0.732 | 0.904 | 0.677 | 0.700 | 0.962 |
| lgbm | none | none | 0.882 | 0.933 | 0.751 | 0.762 | 0.922 | 0.628 | 0.751 | 0.940 |
| lgbm | embed_linear | linear | 0.882 | 0.930 | 0.743 | 0.758 | 0.919 | 0.634 | 0.743 | 0.943 |
| knn | none | none | 0.882 | 0.833 | 0.674 | 0.713 | 0.896 | 0.720 | 0.674 | 0.974 |
| knn | embed_linear | linear | 0.882 | 0.788 | 0.691 | 0.726 | 0.901 | 0.690 | 0.691 | 0.966 |
| knn | embed_lgbm | lgbm | 0.882 | 0.826 | 0.666 | 0.706 | 0.893 | 0.739 | 0.666 | 0.977 |
| knn | assoc | none | 0.882 | 0.788 | 0.691 | 0.726 | 0.901 | 0.690 | 0.691 | 0.966 |
| rf | embed_linear | linear | 0.879 | 0.933 | 0.809 | 0.784 | 0.945 | 0.586 | 0.809 | 0.909 |
| sgd | pred | none | 0.879 | 0.846 | 0.698 | 0.728 | 0.904 | 0.656 | 0.698 | 0.958 |
| rf | none | none | 0.872 | 0.920 | 0.780 | 0.766 | 0.934 | 0.574 | 0.780 | 0.913 |
| sgd | embed_lgbm | lgbm | 0.872 | 0.846 | 0.720 | 0.736 | 0.912 | 0.600 | 0.720 | 0.940 |
| lgbm | wrap | none | 0.869 | 0.869 | 0.709 | 0.726 | 0.909 | 0.590 | 0.709 | 0.940 |
| knn | wrap | none | 0.869 | 0.753 | 0.650 | 0.682 | 0.889 | 0.640 | 0.650 | 0.966 |
| knn | pred | none | 0.856 | 0.743 | 0.625 | 0.651 | 0.882 | 0.560 | 0.625 | 0.958 |
| dummy | embed_lgbm | lgbm | 0.847 | 0.500 | 0.500 | 0.458 | 0.847 | nan | 0.500 | 1.000 |
| dummy | wrap | none | 0.847 | 0.500 | 0.500 | 0.458 | 0.847 | nan | 0.500 | 1.000 |
| dummy | pred | none | 0.847 | 0.500 | 0.500 | 0.458 | 0.847 | nan | 0.500 | 1.000 |
| dummy | none | none | 0.847 | 0.500 | 0.500 | 0.458 | 0.847 | nan | 0.500 | 1.000 |
| dummy | embed_linear | linear | 0.847 | 0.500 | 0.500 | 0.458 | 0.847 | nan | 0.500 | 1.000 |
| dummy | assoc | none | 0.847 | 0.500 | 0.500 | 0.458 | 0.847 | nan | 0.500 | 1.000 |
nan = Not a Number.
Table A24.
Severity with US image features 5-fold performance on the holdout set.
Table A24.
Severity with US image features 5-fold performance on the holdout set.
| Model | Selection | Embed_Selector | Acc | Auroc | Bal-Acc | F1 | Npv | Ppv | Sens | Spec |
|---|---|---|---|---|---|---|---|---|---|---|
| lr | wrap | none | 0.895 | 0.820 | 0.699 | 0.744 | 0.903 | 0.813 | 0.699 | 0.981 |
| lr | assoc | none | 0.891 | 0.873 | 0.707 | 0.746 | 0.905 | 0.753 | 0.707 | 0.974 |
| lr | none | none | 0.891 | 0.875 | 0.707 | 0.746 | 0.905 | 0.753 | 0.707 | 0.974 |
| lr | embed_lgbm | lgbm | 0.891 | 0.873 | 0.707 | 0.746 | 0.905 | 0.753 | 0.707 | 0.974 |
| lr | embed_linear | linear | 0.891 | 0.870 | 0.707 | 0.746 | 0.905 | 0.753 | 0.707 | 0.974 |
| rf | assoc | none | 0.888 | 0.926 | 0.790 | 0.785 | 0.936 | 0.628 | 0.790 | 0.932 |
| sgd | assoc | none | 0.888 | 0.845 | 0.696 | 0.735 | 0.902 | 0.747 | 0.696 | 0.974 |
| knn | pred | none | 0.888 | 0.767 | 0.695 | 0.734 | 0.902 | 0.750 | 0.695 | 0.974 |
| rf | embed_linear | linear | 0.885 | 0.924 | 0.789 | 0.781 | 0.936 | 0.617 | 0.789 | 0.928 |
| lr | pred | none | 0.885 | 0.856 | 0.687 | 0.724 | 0.899 | 0.753 | 0.687 | 0.974 |
| sgd | embed_lgbm | lgbm | 0.885 | 0.842 | 0.711 | 0.742 | 0.908 | 0.695 | 0.711 | 0.962 |
| sgd | embed_linear | linear | 0.885 | 0.855 | 0.695 | 0.730 | 0.902 | 0.716 | 0.695 | 0.970 |
| rf | none | none | 0.885 | 0.924 | 0.770 | 0.775 | 0.929 | 0.632 | 0.770 | 0.936 |
| sgd | none | none | 0.885 | 0.845 | 0.695 | 0.730 | 0.902 | 0.716 | 0.695 | 0.970 |
| lgbm | wrap | none | 0.885 | 0.837 | 0.694 | 0.730 | 0.902 | 0.713 | 0.694 | 0.970 |
| knn | none | none | 0.882 | 0.781 | 0.649 | 0.688 | 0.888 | 0.800 | 0.649 | 0.985 |
| rf | pred | none | 0.879 | 0.874 | 0.707 | 0.735 | 0.907 | 0.660 | 0.707 | 0.955 |
| rf | wrap | none | 0.879 | 0.856 | 0.707 | 0.734 | 0.907 | 0.656 | 0.707 | 0.955 |
| sgd | pred | none | 0.879 | 0.840 | 0.692 | 0.719 | 0.902 | 0.699 | 0.692 | 0.962 |
| lgbm | pred | none | 0.876 | 0.867 | 0.693 | 0.714 | 0.902 | 0.642 | 0.693 | 0.958 |
| lgbm | embed_linear | linear | 0.876 | 0.916 | 0.675 | 0.701 | 0.896 | 0.664 | 0.675 | 0.966 |
| sgd | wrap | none | 0.876 | 0.824 | 0.689 | 0.718 | 0.901 | 0.652 | 0.689 | 0.958 |
| lgbm | embed_lgbm | lgbm | 0.876 | 0.924 | 0.714 | 0.733 | 0.910 | 0.629 | 0.714 | 0.947 |
| rf | embed_lgbm | lgbm | 0.872 | 0.928 | 0.645 | 0.676 | 0.887 | 0.680 | 0.645 | 0.974 |
| knn | embed_linear | linear | 0.872 | 0.718 | 0.634 | 0.667 | 0.884 | 0.733 | 0.634 | 0.977 |
| knn | assoc | none | 0.872 | 0.718 | 0.634 | 0.667 | 0.884 | 0.733 | 0.634 | 0.977 |
| lgbm | none | none | 0.866 | 0.897 | 0.651 | 0.677 | 0.889 | 0.600 | 0.651 | 0.962 |
| lgbm | assoc | none | 0.866 | 0.915 | 0.615 | 0.644 | 0.878 | 0.687 | 0.615 | 0.977 |
| knn | wrap | none | 0.866 | 0.716 | 0.648 | 0.675 | 0.889 | 0.668 | 0.648 | 0.962 |
| dummy | embed_lgbm | lgbm | 0.847 | 0.500 | 0.500 | 0.458 | 0.847 | nan | 0.500 | 1.000 |
| knn | embed_lgbm | lgbm | 0.847 | 0.815 | 0.500 | 0.458 | 0.847 | nan | 0.500 | 1.000 |
| dummy | wrap | none | 0.847 | 0.500 | 0.500 | 0.458 | 0.847 | nan | 0.500 | 1.000 |
| dummy | pred | none | 0.847 | 0.500 | 0.500 | 0.458 | 0.847 | nan | 0.500 | 1.000 |
| dummy | none | none | 0.847 | 0.500 | 0.500 | 0.458 | 0.847 | nan | 0.500 | 1.000 |
| dummy | embed_linear | linear | 0.847 | 0.500 | 0.500 | 0.458 | 0.847 | nan | 0.500 | 1.000 |
| dummy | assoc | none | 0.847 | 0.500 | 0.500 | 0.458 | 0.847 | nan | 0.500 | 1.000 |
nan = Not a Number.
Appendix K
Redundancy-Aware Step-Up Feature Selection Results for predicting Severity with US image features.
Table A25.
Selection scores (Accuracy: Higher = More important) for redundancy-aware feature selection predicting severity with US features.
Table A25.
Selection scores (Accuracy: Higher = More important) for redundancy-aware feature selection predicting severity with US features.
| Feature | Score |
|---|---|
| CRP | 8.697 × 10⁻¹ |
| Peritonitis_no | 8.846 × 10⁻¹ |
| Neutrophil_Percentage | 8.889 × 10⁻¹ |
| Thrombocyte_Count | 8.954 × 10⁻¹ |
| Weight_NAN | 8.996 × 10⁻¹ |
| Dysuria_nan | 8.996 × 10⁻¹ |
| Meteorism_nan | 8.997 × 10⁻¹ |
| Lower_Right_Abd_Pain_nan | 8.975 × 10⁻¹ |
| Free_Fluids_nan | 8.975 × 10⁻¹ |
| Nausea_nan | 8.954 × 10⁻¹ |
| Lower_Right_Abd_Pain_yes | 8.932 × 10⁻¹ |
| Peritonitis_generalized | 8.846 × 10⁻¹ |
| Segmented_Neutrophils | 8.740 × 10⁻¹ |
| Height | 8.654 × 10⁻¹ |
Appendix L
Results from predicting Severity without US image features.
Table A26.
Severity without US image features holdout set performance.
Table A26.
Severity without US image features holdout set performance.
| Model | Selection | Embed_Selector | Acc | Auroc | Bal-Acc | F1 | Npv | Ppv | Sens | Spec |
|---|---|---|---|---|---|---|---|---|---|---|
| lgbm | assoc | none | 0.901 | 0.931 | 0.788 | 0.801 | 0.933 | 0.698 | 0.788 | 0.951 |
| rf | assoc | none | 0.891 | 0.933 | 0.782 | 0.787 | 0.933 | 0.652 | 0.782 | 0.940 |
| lr | wrap | none | 0.888 | 0.811 | 0.695 | 0.735 | 0.902 | 0.741 | 0.695 | 0.974 |
| lr | pred | none | 0.888 | 0.881 | 0.695 | 0.735 | 0.902 | 0.741 | 0.695 | 0.974 |
| lr | embed_lgbm | lgbm | 0.888 | 0.878 | 0.695 | 0.735 | 0.902 | 0.741 | 0.695 | 0.974 |
| lgbm | none | none | 0.888 | 0.931 | 0.755 | 0.771 | 0.923 | 0.659 | 0.755 | 0.947 |
| lr | assoc | none | 0.885 | 0.889 | 0.693 | 0.730 | 0.902 | 0.714 | 0.693 | 0.970 |
| sgd | pred | none | 0.885 | 0.827 | 0.676 | 0.718 | 0.896 | 0.750 | 0.676 | 0.977 |
| sgd | embed_lgbm | lgbm | 0.885 | 0.854 | 0.702 | 0.736 | 0.905 | 0.700 | 0.702 | 0.966 |
| rf | wrap | none | 0.885 | 0.873 | 0.702 | 0.736 | 0.905 | 0.700 | 0.702 | 0.966 |
| lr | none | none | 0.885 | 0.889 | 0.693 | 0.730 | 0.902 | 0.714 | 0.693 | 0.970 |
| sgd | wrap | none | 0.885 | 0.788 | 0.685 | 0.724 | 0.899 | 0.731 | 0.685 | 0.974 |
| knn | embed_linear | linear | 0.885 | 0.807 | 0.702 | 0.736 | 0.905 | 0.700 | 0.702 | 0.966 |
| sgd | none | none | 0.882 | 0.855 | 0.700 | 0.732 | 0.904 | 0.677 | 0.700 | 0.962 |
| knn | assoc | none | 0.882 | 0.829 | 0.666 | 0.706 | 0.893 | 0.739 | 0.666 | 0.977 |
| lr | embed_linear | linear | 0.882 | 0.889 | 0.691 | 0.726 | 0.901 | 0.690 | 0.691 | 0.966 |
| knn | none | none | 0.882 | 0.795 | 0.700 | 0.732 | 0.904 | 0.677 | 0.700 | 0.962 |
| knn | wrap | none | 0.882 | 0.817 | 0.666 | 0.706 | 0.893 | 0.739 | 0.666 | 0.977 |
| lgbm | embed_linear | linear | 0.882 | 0.929 | 0.768 | 0.770 | 0.929 | 0.617 | 0.768 | 0.932 |
| sgd | assoc | none | 0.882 | 0.855 | 0.700 | 0.732 | 0.904 | 0.677 | 0.700 | 0.962 |
| lgbm | pred | none | 0.879 | 0.928 | 0.749 | 0.758 | 0.922 | 0.614 | 0.749 | 0.936 |
| sgd | embed_linear | linear | 0.879 | 0.817 | 0.681 | 0.715 | 0.898 | 0.679 | 0.681 | 0.966 |
| knn | embed_lgbm | lgbm | 0.875 | 0.772 | 0.696 | 0.723 | 0.904 | 0.636 | 0.696 | 0.955 |
| rf | embed_linear | linear | 0.875 | 0.933 | 0.781 | 0.770 | 0.935 | 0.585 | 0.781 | 0.917 |
| rf | pred | none | 0.875 | 0.930 | 0.798 | 0.777 | 0.941 | 0.579 | 0.798 | 0.909 |
| lgbm | wrap | none | 0.872 | 0.850 | 0.660 | 0.693 | 0.892 | 0.654 | 0.660 | 0.966 |
| rf | embed_lgbm | lgbm | 0.872 | 0.926 | 0.805 | 0.776 | 0.945 | 0.567 | 0.805 | 0.902 |
| rf | none | none | 0.872 | 0.926 | 0.797 | 0.773 | 0.941 | 0.569 | 0.797 | 0.906 |
| lgbm | embed_lgbm | lgbm | 0.869 | 0.930 | 0.735 | 0.741 | 0.918 | 0.578 | 0.735 | 0.928 |
| dummy | embed_linear | linear | 0.847 | 0.500 | 0.500 | 0.458 | 0.847 | nan | 0.500 | 1.000 |
| dummy | none | none | 0.847 | 0.500 | 0.500 | 0.458 | 0.847 | nan | 0.500 | 1.000 |
| dummy | wrap | none | 0.847 | 0.500 | 0.500 | 0.458 | 0.847 | nan | 0.500 | 1.000 |
| dummy | pred | none | 0.847 | 0.500 | 0.500 | 0.458 | 0.847 | nan | 0.500 | 1.000 |
| dummy | embed_lgbm | lgbm | 0.847 | 0.500 | 0.500 | 0.458 | 0.847 | nan | 0.500 | 1.000 |
| dummy | assoc | none | 0.847 | 0.500 | 0.500 | 0.458 | 0.847 | nan | 0.500 | 1.000 |
| knn | pred | none | 0.843 | 0.717 | 0.618 | 0.637 | 0.880 | 0.483 | 0.618 | 0.943 |
nan = Not a Number.
Table A27.
Severity without US image features 5-fold performance on the holdout set.
Table A27.
Severity without US image features 5-fold performance on the holdout set.
| Model | Selection | Embed_Selector | Acc | Auroc | Bal-Acc | F1 | Npv | Ppv | Sens | Spec |
|---|---|---|---|---|---|---|---|---|---|---|
| lgbm | assoc | none | 0.892 | 0.896 | 0.741 | 0.768 | 0.917 | 0.717 | 0.741 | 0.958 |
| sgd | none | none | 0.891 | 0.850 | 0.699 | 0.739 | 0.903 | 0.783 | 0.699 | 0.977 |
| lr | assoc | none | 0.891 | 0.869 | 0.707 | 0.745 | 0.906 | 0.770 | 0.707 | 0.974 |
| lr | embed_lgbm | lgbm | 0.891 | 0.864 | 0.707 | 0.745 | 0.906 | 0.770 | 0.707 | 0.974 |
| lr | none | none | 0.891 | 0.869 | 0.707 | 0.745 | 0.906 | 0.770 | 0.707 | 0.974 |
| lr | embed_linear | linear | 0.891 | 0.869 | 0.707 | 0.745 | 0.906 | 0.770 | 0.707 | 0.974 |
| lgbm | embed_lgbm | lgbm | 0.888 | 0.907 | 0.721 | 0.753 | 0.911 | 0.709 | 0.721 | 0.962 |
| sgd | embed_lgbm | lgbm | 0.888 | 0.846 | 0.696 | 0.735 | 0.902 | 0.747 | 0.696 | 0.974 |
| knn | none | none | 0.888 | 0.746 | 0.696 | 0.735 | 0.902 | 0.747 | 0.696 | 0.974 |
| lr | wrap | none | 0.888 | 0.805 | 0.686 | 0.727 | 0.899 | 0.767 | 0.686 | 0.977 |
| rf | assoc | none | 0.885 | 0.923 | 0.712 | 0.742 | 0.908 | 0.687 | 0.712 | 0.962 |
| sgd | assoc | none | 0.885 | 0.853 | 0.695 | 0.730 | 0.902 | 0.716 | 0.695 | 0.970 |
| rf | wrap | none | 0.885 | 0.821 | 0.694 | 0.731 | 0.902 | 0.728 | 0.694 | 0.970 |
| lr | pred | none | 0.885 | 0.847 | 0.678 | 0.717 | 0.896 | 0.777 | 0.678 | 0.977 |
| sgd | wrap | none | 0.885 | 0.770 | 0.685 | 0.724 | 0.899 | 0.737 | 0.685 | 0.974 |
| sgd | pred | none | 0.882 | 0.780 | 0.684 | 0.720 | 0.899 | 0.741 | 0.684 | 0.970 |
| knn | embed_linear | linear | 0.882 | 0.731 | 0.691 | 0.725 | 0.902 | 0.702 | 0.691 | 0.966 |
| rf | pred | none | 0.876 | 0.921 | 0.726 | 0.731 | 0.914 | 0.593 | 0.726 | 0.943 |
| rf | embed_lgbm | lgbm | 0.876 | 0.918 | 0.816 | 0.781 | 0.949 | 0.570 | 0.816 | 0.902 |
| rf | embed_linear | linear | 0.875 | 0.925 | 0.689 | 0.717 | 0.901 | 0.645 | 0.689 | 0.958 |
| knn | embed_lgbm | lgbm | 0.872 | 0.719 | 0.634 | 0.667 | 0.884 | 0.733 | 0.634 | 0.977 |
| lgbm | embed_linear | linear | 0.869 | 0.928 | 0.593 | 0.605 | 0.872 | 0.700 | 0.593 | 0.992 |
| lgbm | wrap | none | 0.869 | 0.807 | 0.684 | 0.709 | 0.900 | 0.620 | 0.684 | 0.951 |
| knn | pred | none | 0.869 | 0.738 | 0.658 | 0.687 | 0.892 | 0.634 | 0.658 | 0.962 |
| sgd | embed_linear | linear | 0.866 | 0.845 | 0.711 | 0.716 | 0.911 | 0.601 | 0.711 | 0.936 |
| lgbm | none | none | 0.856 | 0.876 | 0.609 | 0.629 | 0.877 | 0.567 | 0.609 | 0.966 |
| lgbm | pred | none | 0.847 | 0.887 | 0.500 | 0.458 | 0.847 | nan | 0.500 | 1.000 |
| rf | none | none | 0.847 | 0.906 | 0.500 | 0.458 | 0.847 | nan | 0.500 | 1.000 |
| knn | assoc | none | 0.847 | 0.804 | 0.500 | 0.458 | 0.847 | nan | 0.500 | 1.000 |
| dummy | wrap | none | 0.847 | 0.500 | 0.500 | 0.458 | 0.847 | nan | 0.500 | 1.000 |
| dummy | pred | none | 0.847 | 0.500 | 0.500 | 0.458 | 0.847 | nan | 0.500 | 1.000 |
| dummy | none | none | 0.847 | 0.500 | 0.500 | 0.458 | 0.847 | nan | 0.500 | 1.000 |
| knn | wrap | none | 0.847 | 0.816 | 0.500 | 0.458 | 0.847 | nan | 0.500 | 1.000 |
| dummy | embed_linear | linear | 0.847 | 0.500 | 0.500 | 0.458 | 0.847 | nan | 0.500 | 1.000 |
| dummy | embed_lgbm | lgbm | 0.847 | 0.500 | 0.500 | 0.458 | 0.847 | nan | 0.500 | 1.000 |
| dummy | assoc | none | 0.847 | 0.500 | 0.500 | 0.458 | 0.847 | nan | 0.500 | 1.000 |
nan = Not a Number.
Appendix M
Redundancy-Aware Step-Up Feature Selection Results for predicting Severity without US image features.
Table A28.
Selection scores (Accuracy: Higher = More important) for redundancy-aware feature selection predicting severity without ultrasound features.
Table A28.
Selection scores (Accuracy: Higher = More important) for redundancy-aware feature selection predicting severity without ultrasound features.
| Feature | Score |
|---|---|
| CRP | 8.697 × 10⁻¹ |
| Peritonitis_no | 8.868 × 10⁻¹ |
| Coughing_Pain_nan | 8.868 × 10⁻¹ |
| Body_Temperature | 8.847 × 10⁻¹ |
| Thrombocyte_Count | 8.718 × 10⁻¹ |
References
- “Appendicitis,” Mayo Clinic. Available online: https://www.mayoclinic.org/diseases-conditions/appendicitis/symptoms-causes/syc-20369543 (accessed on 28 September 2024).
- “Does This Child Have Appendicitis?” Johns Hopkins Medicine. Available online: https://www.hopkinsmedicine.org/health/conditions-and-diseases/does-this-child-have-appendicitis#:~:text=Up%20to%2080%20percent%20of,easy%20to%20miss%20or%20delay. (accessed on 5 October 2024).
- “Appendicitis Tests: Medlineplus Medical Test,” MedlinePlus. Available online: https://medlineplus.gov/lab-tests/appendicitis-tests/#:~:text=CT%20scan%20(computed%20tomography%20scan,up%20better%20in%20the%20pictures (accessed on 28 September 2024).
- Gollapalli, M.; Rahman, A.; Kudos, S.A.; Foula, M.S.; Alkhalifa, A.M.; Albisher, H.M.; Al-Hariri, M.T.; Mohammad, N. Appendicitis Diagnosis: Ensemble Machine Learning and Explainable Artificial Intelligence-Based Comprehensive Approach. Big Data Cogn. Comput. 2024, 8, 108. [Google Scholar] [CrossRef]
- Issaiy, M.; Zarei, D.; Saghazadeh, A. Artificial Intelligence and Acute Appendicitis: A Systematic Review of Diagnostic and Prognostic Models. World J. Emerg. Surg. 2023, 18, 59. [Google Scholar] [CrossRef]
- Kang, C.B.; Li, X.W.; Hou, S.Y.; Chi, X.Q.; Shan, H.F.; Zhang, Q.J. Preoperatively predicting the pathological types of acute appendicitis using machine learning based on peripheral blood biomarkers and clinical features: A retrospective study. Ann. Transl. Med. 2021, 9, 835. [Google Scholar] [CrossRef]
- Park, J.J.; Kim, K.A.; Nam, Y.; Choi, M.H.; Choi, S.Y.; Rhie, J. Convolutional-neural-network-based diagnosis of appendicitis via CT scans in patients with acute abdominal pain presenting in the emergency department. Sci. Rep. 2020, 10, 9556. [Google Scholar] [CrossRef]
- Akbulut, S.; Yagin, F.H.; Cicek, I.B.; Koc, C.; Colak, C.; Yilmaz, S. Prediction of perforated and nonperforated acute appendicitis using machine learning-based explainable artificial intelligence. Diagnostics 2023, 13, 1173. [Google Scholar] [CrossRef]
- Rajpurkar, P.; Park, A.; Irvin, J.; Chute, C.; Bereket, M.; Mastrodicasa, D. AppendiXNet: Deep learning for diagnosis of appendicitis from a small dataset of CT exams using video pretraining. Sci. Rep. 2020, 10, 3958. [Google Scholar] [CrossRef]
- Prabhudesai, S.G.; Gould, S.; Rekhraj, S.; Tekkis, P.P.; Glazer, G.; Ziprin, P. Artificial neural networks: Useful aid in diagnosing acute appendicitis. World J. Surg. 2008, 32, 305–309. [Google Scholar] [CrossRef]
- Park, S.H.; Kim, Y.J.; Kim, K.G.; Chung, J.-W.; Kim, H.C.; Choi, I.Y.; You, M.-W.; Lee, G.P.; Hwang, J.H. Comparison between single and serial computed tomography images in classification of acute appendicitis, acute right-sided diverticulitis, and normal appendix using EfficientNet. PLoS ONE 2023, 18, e0281498. [Google Scholar] [CrossRef]
- Zhao, Y.; Yang, L.; Sun, C.; Li, Y.; He, Y.; Zhang, L. Discovery of urinary proteomic signature for differential diagnosis of acute appendicitis. Biomed. Res. Int. 2020, 2020, 3896263. [Google Scholar] [CrossRef]
- Hsieh, C.H.; Lu, R.H.; Lee, N.H.; Chiu, W.T.; Hsu, M.H.; Li, Y.C. Novel solutions for an old disease: Diagnosis of acute appendicitis with random forest, support vector machines, and artificial neural networks. Surgery 2011, 149, 87–93. [Google Scholar] [CrossRef]
- Phan-Mai, T.A.; Thai, T.T.; Mai, T.Q.; Vu, K.A.; Mai, C.C.; Nguyen, D.A. Validity of machine learning in detecting complicated appendicitis in a resource-limited setting: Findings from Vietnam. Biomed. Res. Int. 2023, 2023, 5013812. [Google Scholar] [CrossRef]
- Sakai, S.; Kobayashi, K.; Toyabe, S.; Mandai, N.; Kanda, T.; Akazawa, K. Comparison of the levels of accuracy of an artificial neural network model and a logistic regression model for the diagnosis of acute appendicitis. J. Med. Syst. 2007, 31, 357–364. [Google Scholar] [CrossRef]
- Lin, H.A.; Lin, L.T.; Lin, S.F. Application of artificial neural network models to differentiate between complicated and uncomplicated acute appendicitis. J. Med. Syst. 2023, 47, 38. [Google Scholar] [CrossRef]
- Bunn, C.; Kulshrestha, S.; Boyda, J.; Balasubramanian, N.; Birch, S.; Karabayir, I. Application of machine learning to the prediction of postoperative sepsis after appendectomy. Surgery 2021, 169, 671–677. [Google Scholar] [CrossRef]
- Eickhoff, R.M.; Bulla, A.; Eickhoff, S.B.; Heise, D.; Helmedag, M.; Kroh, A. Machine learning prediction model for postoperative outcome after perforated appendicitis. Langenbecks Arch. Surg. 2022, 407, 789–795. [Google Scholar] [CrossRef]
- Ghareeb, W.M.; Emile, S.H.; Elshobaky, A. Artificial intelligence compared to alvarado scoring system alone or combined with ultrasound criteria in the diagnosis of acute appendicitis. J. Gastrointest. Surg. 2022, 26, 655–658. [Google Scholar] [CrossRef]
- Ramirez-GarciaLuna, J.L.; Vera-Bañuelos, L.R.; Guevara-Torres, L.; Martínez-Jiménez, M.A.; Ortiz-Dosal, A.; Gonzalez, F.J.; Kolosovas-Machuca, E.S. Infrared thermography of abdominal wall in acute appendicitis: Proof of concept study. Infrared Phys. Technol. 2020, 105, 103165. [Google Scholar] [CrossRef]
- Forsström, J.J.; Irjala, K.; Selén, G.; Nyström, M.; Eklund, P. Using data preprocessing and single layer perceptron to analyze laboratory data. Scand. J. Clin. Lab. Investig. Suppl. 1995, 222, 75–81. [Google Scholar] [CrossRef]
- Afshari Safavi, A.; Zand Karimi, E.; Rezaei, M.; Mohebi, H.; Mehrvarz, S.; Khorrami, M.R. Comparing the accuracy of neural network models and conventional tests in diagnosis of suspected acute appendicitis. J. Maz. Univ. Med. Sci. 2015, 25, 58–65. [Google Scholar]
- Pesonen, E.; Eskelinen, M.; Juhola, M. Comparison of different neural network algorithms in the diagnosis of acute appendicitis. Int. J. Biomed. Comput. 1996, 40, 227–233. [Google Scholar] [CrossRef]
- Ting, H.W.; Wu, J.T.; Chan, C.L.; Lin, S.L.; Chen, M.H. Decision model for acute appendicitis treatment with decision tree technology–a modification of the Alvarado scoring system. J. Chin. Med. Assoc. 2021, 73, 401–406. [Google Scholar] [CrossRef]
- Son, C.S.; Jang, B.K.; Seo, S.T.; Kim, M.S.; Kim, Y.N. A hybrid decision support model to discover informative knowledge in diagnosing acute appendicitis. BMC Med. Inform. Decis. Mak. 2012, 12, 17. [Google Scholar] [CrossRef]
- Yoldaş, Ö.; Tez, M.; Karaca, T. Artificial neural networks in the diagnosis of acute appendicitis. Am. J. Emerg. Med. 2012, 30, 1245–1247. [Google Scholar] [CrossRef]
- Park, S.Y.; Kim, S.M. Acute appendicitis diagnosis using artificial neural networks. Technol. Health Care 2015, 23, S559–S565. [Google Scholar] [CrossRef]
- Jamshidnezhad, A.; Azizi, A.; Zadeh, S.R.; Shirali, S.; Shoushtari, M.H.; Sabaghan, Y. A computer based model in comparison with sonography imaging to diagnosis of acute appendicitis in Iran. J. Acute Med. 2017, 7, 10–18. [Google Scholar]
- Gudelis, M.; Lacasta Garcia, J.D.; Trujillano Cabello, J.J. Diagnosis of pain in the right iliac fossa. A new diagnostic score based on decision-tree and artificial neural network methods. Cir. Esp. (Engl. Ed.) 2019, 97, 329–335. [Google Scholar] [CrossRef]
- Kang, H.J.; Kang, H.; Kim, B.; Chae, M.S.; Ha, Y.R.; Oh, S.B.; Ahn, J.H. Evaluation of the diagnostic performance of a decision tree model in suspected acute appendicitis with equivocal preoperative computed tomography findings compared with Alvarado, Eskelinen, and adult appendicitis scores: A STARD compliant article. Medicine 2019, 98, e17368. [Google Scholar] [CrossRef]
- Shahmoradi, L.; Safdari, R.; Mir Hosseini, M.; Arji, G.; Jannt, B.; Abdar, M. Predicting risk of acute appendicitis: A comparison of artificial neural network and logistic regression models. Acta Med. Iran. 2019, 56, 785. [Google Scholar]
- Li, P.; Zhang, Z.; Weng, S.; Nie, H. Establishment of predictive models for acute complicated appendicitis during pregnancy-a retrospective case-control study. Int. J. Gynaecol. Obstet. 2023, 162, 744–751. [Google Scholar] [CrossRef]
- Lee, Y.H.; Hu, P.J.; Cheng, T.H.; Huang, T.C.; Chuang, W.Y. A preclustering-based ensemble learning technique for acute appendicitis diagnoses. Artif. Intell. Med. 2013, 58, 115–124. [Google Scholar] [CrossRef]
- Xia, J.; Wang, Z.; Yang, D.; Li, R.; Liang, G.; Chen, H. Performance optimization of support vector machine with oppositional grasshopper optimization for acute appendicitis diagnosis. Comput. Biol. Med. 2022, 143, 105206. [Google Scholar] [CrossRef]
- Marcinkevičs, R.; Reis Wolfertstetter, P.; Wellmann, S.; Knorr, C.; Vogt, J.E. Using machine learning to predict the diagnosis, management and severity of pediatric appendicitis. Front. Pediatr. 2021, 9, 662183. [Google Scholar] [CrossRef]
- Regensburg Pediatric Appendicitis. Available online: https://archive.ics.uci.edu/dataset/938/regensburg+pediatric+appendicitis (accessed on 30 September 2024).
- Marcinkevičs, R.; Wolfertstetter, P.R.; Klimiene, U.; Chin-Cheong, K.; Paschke, A.; Zerres, J.; Denzinger, M.; Niederberger, D.; Wellmann, S.; Ozkan, E.; et al. Interpretable and intervenable ultrasonography-based machine learning models for pediatric appendicitis. Med. Image Anal. 2024, 91, 103042. Available online: https://www.sciencedirect.com/science/article/pii/S136184152300302X?via%3Dihub (accessed on 15 November 2024). [CrossRef]
- Navaei, M.; Doogchi, Z.; Gholami, F.; Tavakoli, M.K. Leveraging Machine Learning for Pediatric Appendicitis Diagnosis: A Retrospective Study Integrating Clinical, Laboratory, and Imaging Data. Health Sci. Rep. 2025, 8, e70756. [Google Scholar] [CrossRef]
- Chadaga, K.; Khanna, V.; Prabhu, S.; Sampathila, N.; Chadaga, R.; Umakanth, S.; Bhat, D.; Swathi, K.S.; Kamath, R. An interpretable and transparent machine learning framework for appendicitis detection in pediatric patients. Sci. Rep. 2024, 14, 24454. Available online: https://www.nature.com/articles/s41598-024-75896-y (accessed on 15 November 2024). [CrossRef]
- Thapa, A.; Timilsina, S.; Chapagain, B. Dharma: A novel machine learning framework for pediatric appendicitis-diagnosis, severity assessment and evidence-based clinical decision support. medRxiv 2025. [Google Scholar] [CrossRef]
- Berger, D. DF-analyze/readme.md. GitHub. Available online: https://github.com/stfxecutables/df-analyze/blob/02e546f50d66ba2b27faae94758f5f69d29ad8f8/README.md#feature-type-and-cardinality-inference (accessed on 18 October 2024).
- Kendall, J. appendicitis-ml. GitHub. Available online: https://github.com/johnkxl/appendicitis-ml (accessed on 1 December 2024).
- Berger, D. df-analyze: Redundancy-Aware Feature Selection [Experimental Branch], GitHub. Available online: https://github.com/stfxecutables/df-analyze/tree/experimental?tab=readme-ov-file#redundancy-aware-feature-selection-new (accessed on 15 November 2024).
- Joseph, M.; Raj, H. GANDALF: Gated Adaptive Network For Deep Automated Learning of Features. 2024. Available online: https://arxiv.org/abs/2207.08548 (accessed on 15 October 2024).
- Levman, J.; Jennings, M.; Rouse, E.; Berger, D.; Kabaria, P.; Nangaku, M.; Gondra, I.; Takahashi, E. A Morphological Study of Schizophrenia with Magnetic Resonance Imaging, Advanced Analytics, and Machine Learning. Front. Neurosci. 2022, 16, 926426. [Google Scholar] [CrossRef]
- Figueroa, J.; Etim, P.; Shibu, A.; Berger, D.; Levman, J. Diagnosing and Characterizing Chronic Kidney Disease with Machine Learning: The Value of Clinical Patient Characteristics as Evidenced from an Open Dataset. Electronics 2024, 13, 4326. [Google Scholar] [CrossRef]
- Saville, K.; Berger, D.; Levman, J. Mitigating Bias Due to Race and Gender in Machine Learning Predictions of Traffic Stop Outcomes. Information 2024, 11, 687. [Google Scholar] [CrossRef]
- Huang, X.; Gauthier, C.; Berger, D.; Cai, H.; Levman, J. Identifying Cortical Molecular Biomarkers Potentially Associated with Learning in Mice Using Artificial Intelligence. Int. J. Mol. Sci. 2025, 26, 6878. [Google Scholar] [CrossRef]
Disclaimer/Publisher’s Note: The statements, opinions and data contained in all publications are solely those of the individual author(s) and contributor(s) and not of MDPI and/or the editor(s). MDPI and/or the editor(s) disclaim responsibility for any injury to people or property resulting from any ideas, methods, instructions or products referred to in the content. |
© 2025 by the authors. Licensee MDPI, Basel, Switzerland. This article is an open access article distributed under the terms and conditions of the Creative Commons Attribution (CC BY) license (https://creativecommons.org/licenses/by/4.0/).