Abstract
Households and businesses produce high levels of electrical and electronic waste (e-waste), fueled by modernization and rapid obsolescence. While the challenges imposed by e-waste are similar everywhere in the world, disparities in progress to deal with it exist, with developing nations lagging. The increase in e-waste generation highlights the need to develop ways to manage it. This paper reviews global and South African e-waste management practices with a specific case study on Cathode Ray Tube (CRT) waste. CRTs present the biggest problem for recyclers and policy makers because they contain lead and antimony. Common disposal practices have been either landfilling or incineration. Research into South African CRT waste management practices showed there is still more to do to manage this waste stream effectively. However, recent developments have placed e-waste into a priority waste stream, which should lead to intensified efforts in dealing with it. Overall, these efforts aim to increase diversion from landfill and create value-adding opportunities, leading to social and environmental benefits.
1. Introduction
The modernization of the 21st century, buoyed by rapid urbanization, population growth, and the once-booming economy, has led to high levels of end-of-life electronic waste (e-waste) [1,2,3,4,5]. The rapid obsolescence of consumer electronics and accessories such as cellular phones and computers is also adding disproportionately to the e-waste stream. The world production of e-waste sits between 20 and 50 million tons yearly, with current recycling rates ranging between 15 and 20 percent worldwide [6,7]. In 2014, the total e-waste produced on the African continent was 1.9 million tons. Egypt (0.37 million tons), South Africa (0.35 million tons), and Nigeria (0.22 million tons) were the leading producers [6]. There are few current reports available on e-waste in the African continent, which further blunts efforts towards managing this waste stream. Pérez-Belis et al. captured the existing body of knowledge spanning from 1992 to August 2014 [8]. In developing countries, Africa included, besides the increase in e-waste produced locally, shipping of e-waste from countries such as the USA is a problem [9]. Developing nations encouraged the practice since waste senders paid the receivers. Besides the willingness of the receivers, the lack of government regulations against such practices worsened the problem. Such diffusion of e-waste further diluted the accurate tracking of growth of this waste, especially in developing countries. Globally, volumes of e-waste are increasing by nearly 3 to 5 percent yearly since the 1990s, and e-waste continues to grow three times faster than municipal solid waste [10].
E-waste growth presents equally a problem, due to the toxicity of its parts, and an opportunity, as valuable minerals contained in the waste are recoverable [11]. Several studies have shown that the purity of metal parts in e-waste can easily be superior to that of rich-content minerals [12,13,14]. Waste printed circuit boards (WPCBs) are an example of a waste stream that holds high economic value [15]. Cucchiella et al. showed that WPCBs from information technology and telecommunications equipment have NPVs equal to 19,966,000 € and 6,606,000 € for mobile plants of 240 tons/year and 576 tons/year. The NPV for consumer equipment was a positive 1,050,000 €. Interest in electronic waste (e-waste) recovery and recycling has therefore been on the rise over the past two decades. The rise in recycling is attributable to other causes, including depleting mineral deposits, declining metal recoveries, and grades. Deepening mineral deposits, a concentration of strategic minerals in politically unstable regions, and general risks associated with primary mining are some of the causes [16].
The increase in waste produced from electronic and electrical equipment (EEE) has increased the need to create interventions to manage this waste. The level of interventions differs from country to country, with other countries having progressed. Like most other developing countries, South Africa’s e-waste management industry is still in the early stages. Until recently, South Africa did not recognize e-waste as a threatening waste stream. According to the Department of Environmental Affairs (2015), e-waste currently makes up between 5% and 8% of the municipal solid waste in South Africa. There is an expectation that this will grow steadily over the coming years. According to the United Nations Environment Program (UNEP), obsolete computers in both South Africa and China will increase by 500% in 2020 compared with 2007 levels [17]. This has prompted the government and other supporting institutions to develop e-waste management methods whose focus is not only on waste disposal but also waste reduction, waste reuse, recycling, and metal recovery.
By definition, e-waste is a term used to refer to all EEE that has reached the end of its useful life. There are 10 different categories of e-waste according to the European Waste Electric and Electronics Equipment (WEEE) Directives 2002/96/ European Commission and 2012/19/ European Union. These include all products driven by electricity, and include small and large household products, IT equipment, electrical and electronic tools, etc. [18].
There are three main components of electronic equipment: metals (ferrous and nonferrous), plastics, and glass. For example, a typical computer contains about 32% ferrous metals, 23% plastic, and 15% glass [19]. Recovering metals from e-waste has been the focus for most recyclers, and extensive research is advancing to develop environmentally sound recovery methods to salvage valuable metals from e-waste. Early efforts included crude methods such as acid-washing and open incineration, which led to serious environmental problems [20,21,22].
2. Global E-Waste State
South Africa, Brazil, Russia, China and India form part of the BRICS consortium (BRICS—acronym for the five member countries). BRICS is a group of countries characterized by their strong economic growths and a need for a stronger political voice in world governance [23]. Although diverse, the BRICS group of countries still accounted for 17.7% of extra-EU exports in 2014, making it the most important EU export destination [24]. This is a sevenfold increase compared to 1999. BRICS countries contributed one-fifth of the world’s economy, producing 27% of the world Gross Domestic Product, and accounts for 43% of the world population [25]. A Goldman Sachs report highlighted the importance of BRICS, arguing that the bloc will eclipse the current G7 richest countries of the world by 2050 [26].
This analysis makes it clear that the BRICS region deserves a lot more attention in any technological developmental studies. There are big differences between the BRICS countries including social, economic, and political features according to their history and region. Studies have shown that this group of countries is diverse and its economic features must be studied country by country [27]. The above observations called for the current study to focus solely on South Africa in contrast to global practices. The following sections present several countries and their approach to e-waste management and relevant legislation.
2.1. United States of America (USA)
The USA has one of the fastest-growing e-waste streams in the world because of citizens’ high buying power and frequent upgrading/discarding of electronic products. According to UNU-IAS SCYCLE (2015), the USA produced 7072 metric kilotons of e-waste in 2014 [28]. This equates to 22.1 kg per inhabitant. Although e-waste accounts only for 10% of the total municipal solid waste produced in the USA, it is growing at a rate 2–3 times faster than any other waste produced [29]. Usually, the USA has had two alternatives of dealing with this waste: (1) disposal in U.S. landfills or (2) export of the waste from the USA. Between 2003 and 2005, about 80%–85% of all e-waste produced in the USA ended in U.S. landfills [30]. Further studies showed that lead exceeded the U.S. Environmental Protection Agency’s (EPA) Toxicity Characteristics Leaching Procedure federal limits [31]. Realizing the environmental and human impact of landfill disposal of e-waste led to an exploration of reusing and recycling of e-waste and discouraging e-waste landfilling.
The second approach to deal with e-waste has been export to developing countries, which has received much attention worldwide. The practice of exporting e-waste to developing nations is sometimes in contravention of the Basel Convention Agreement. However, for a long time there were no U.S. national laws banning this practice. A notice to the receiving country was seen as compliance with the Basel Convention Agreement [32].
Different U.S. states developed various ways to deal with e-waste in the form of incentives or penalties. One of these ways was passing an Electronic Waste Recycling Fee by the State of California, imposed on certain video display devices (laptops, televisions, monitors, etc.). Covered Electronic Devices (CEDs) was the term referring to products subject to that fee [33]. Shown in Table 1 is the fee schedule [34]. Fees were to be paid upon purchase of the items. The e-waste fees income funded safe and affordable collection and recycling of CEDs that contain dangerous materials.

Table 1.
California’s electronic waste recycling fees.
The EPA drafted the Plug-In to eCycling Guidelines for Materials Management in 2004. This guided eCycling partners on handling and discarding end-of-life electronics [35]. The Hazardous Waste Management and Cathode Ray Tubes Final Rule 40, CFR Parts 9, 260, 261, 271 law followed in 2006. This focused on reuse and recycling as well as exporting obsolete CRT parts. The U.S. Department of the Interior drafted the Responsible Recycling (R2) Practices for Use in Accredited Certification Programs for Electronics Recyclers, Best Practice Document in 2008 [36]. The purpose of the document was to come up with an accepted set of practices for the electronics recycling industry. At the same time several U.S. states developed and passed bills on electronic waste handling and treatment. These included Arkansas, California, Connecticut, Georgia, Hawaii, Illinois, Indiana, Kentucky, Louisiana, Massachusetts, Maine, Maryland, Michigan, Minnesota, Mississippi, Missouri, Nebraska, Nevada, and New Hampshire. Others were New Jersey, New Mexico, North Carolina, Oklahoma, Oregon, Pennsylvania, Rhode Island, South Carolina, Texas, Virginia, Washington, West Virginia, and Wisconsin.
All the different bills passed in the USA centered on several collection methods, such as curbside, special drop-off events, permanent drop-off, take back, and point of purchase [37]. Although these alternatives presented the best-case scenarios in the world, there is still room to improve, since most big U.S. companies export their electronic products throughout the world. Fragmentation between many different U.S. states complicates this further.
The efforts by the USA in dealing with e-waste provide a good lesson for developing countries such as South Africa. The number and ages of bills passed in the USA in the last decade shows the scale of the challenge and the time needed to achieve success in e-waste management.
2.2. European Union
E-waste in the European Union is also the fastest-growing waste stream, with an expected growth to more than 10 million tons by year 2021 [38]. The EU member states produced an estimated 9523 metric kilotons of e-waste in 2014, equivalent to 18.7 kg per inhabitant [38]. The USA levels dwarf the 9523 metric kilotons, but the per-person rate closely matches.
The EU passed the WEEE Directive 2002/96/EC and 2012/19/EU limiting the use of certain hazardous substances in EEE (RoHS Directive 2002/95/EC). Directive 2002/96/EC came into force in 2003, providing for e-waste collection schemes whereby consumers returned their end-of-life electronics for free as well as setting up collection points. The directives centered on five areas, namely:
- electronic product design
- e-waste collection
- e-waste recovery
- e-waste treatment and financing and
- electronics user awareness.
Directive 2012/19/EU came into force in 2012, reflecting the growing need for an all-inclusive regulation of e-waste. RoHS Directive 2002/95/EC came into force in 2003, aimed at regulating heavy metals such as lead, mercury, cadmium, and chromium (VI), and flame retardants such as polybrominated biphenyls (PBB) or polybrominated diphenyl ethers (PBDE), to be substituted with safer alternatives. Further revision took place and became effective in 2013 (RoHS Directive 2011/65/EU), further including a normative document named Logistics of Waste Electrical and Electronic Equipment, WEEELABEX Standard Version 9.0 dealing with e-waste handling before treatment. Following this, the Collection, Logistics & Treatment Requirements for End-of-Life Household Appliances Containing Volatile Fluorocarbons or Volatile Hydrocarbons, Standard EN 50574-1, 2012 and EN 50574-2, 2014 came into force in 2012 and 2013. These documents gave normative requirements for assessing depollution for treatment of household e-waste containing volatile fluorocarbons or volatile hydrocarbons.
The EU, Switzerland, Norway, Belgium, Sweden, and the Netherlands have all exceeded the minimum requirements for collection and recycling targets. These countries have systems that perform above the rest in scope and compliance levels [38,39].
2.3. Japan
Japan enforced e-waste regulations in 2001. These laws require that manufacturers and importers take back end-of-life electronics for recycling [40]. The “Home Appliance Recycling Law”, enacted in 1998 and enforceable from 2001, required importers and producers to recycle televisions, refrigerators, washing machines, and air conditioners. The end users paid the recycling fee, the retail outlet provided the collection points, and the producing company did the recycling. Collection was extended to local government authorities, who also provided collection services of goods for disposal. In cases where a producer was not available or it was impracticable to route goods back, an alternative, appointed company assumed that role. Recycling fees ranged between ¥1800 and ¥5000 depending on the e-waste item for recycling. An assessment of the Japanese methods shows that 74% of e-waste reached a recycler compared to the U.S. average of 12.5% [41].
Japan produced 2200 metric kilotons of waste in 2014, an equivalent of 17.3/kg per inhabitant [42].
2.4. China
China is one of the largest producers and consumers of e-waste in the world [43]. According to UNU-IAS SCYCLE (2015), China produced 6033 metric kilotons of e-waste in 2014 alone [44]. This is equal to 4.4 kg per inhabitant. Estimates showed that 90% of the 70%–80% of the global e-waste exported to Asia ends up in China [45].
China has signed the Basel Convention and has several regulations on e-waste. These are:
- Pollution Control Management Method for Electronic Information Products
- Administrative Measures for the Prevention and Control of Environmental Pollution by Electronic Waste and Regulation on the Administration of the Recovery and Disposal of Waste Electrical and Electronic Products.
The content of these regulations include:
- the control and restraining the use of hazardous and toxic substances in electronic and electric products,
- registration of dismantlers, recyclers, and disposers with the local Environmental Protection Bureau (EPB) and
- e-waste recycler permits and the establishment of a fund for e-waste recycling and disposal. Producers pay the recycling fund.
There are about 105 enterprises dedicated to dismantling e-waste in China at fixed places. However, a trade-in incentive was discontinued in 2011 for these enterprises and this led to most of the recycling going to small, informal traders [46]. These informal recyclers recycle for income, and endanger their lives and the environment because of a lack of knowledge. This has resulted in a complex informal network that works outside the laws and makes legislation useless. A lack of proper penalties for noncompliance with the applicable laws made enforcement nearly impossible [47].
2.5. India
India faces an increasing problem of e-waste mainly because of the growth rate of the country’s Information Technology (IT) and electronics industry. These have increased India’s consumption of electronic items and IT hardware, which afterwards leads to high obsolescence rates and thus high e-waste production [48]. In 2014, India produced 1641 metric kilotons of e-waste (1.3 kg per inhabitant) [49]. For an emerging economy like that of India, these levels of e-waste offer an alternative livelihood for the urban and rural poor through recycling, but it comes at a cost. There are significant risks to health and the environment as these recyclers often use primitive methods.
An unorganized, informal sector collects, transports, and dismantles most of India’s e-waste. According to a Greenpeace report, only 3% of the e-waste produced in India is collected by the institutions approved to recycle it [50].
India signed the Management of e-Waste, Guidelines in 2008. The objective of the guideline was to provide guidance for the identification of various sources of e-waste and prescribe procedures for handling it in an environmentally sound manner. These guidelines provided guidance and a broad outline, and pit the onus on the recyclers to determine specific treatment methods according to the risk potential. In 2013 India drafted a law, Electronic Waste (Handling and Disposal), which specified the responsibilities of producers. The responsibilities were:
- collecting e-waste produced during manufacture of equipment
- collection of e-waste produced from end-of-life of the producers’ product
- setting up collection centers
- financing and organizing a method to meet costs involved in e-waste management
- providing contact details of approved collection centers to consumers and
- creating awareness though publications, advertisement, posters, etc.
The Ministry of Environment, Forest and Climate Change of India issued E-Waste (Management) Rules in March 2013.
2.6. South Africa
South Africa is another important developing country that has significant e-waste. According to UNU-IAS SCYCLE, South Africa produced 346 metric kilotons in 2014, a rate of 6.6 kg per inhabitant [51]. The rate per inhabitant is in the range of that of China, with that of India far lower (1.3 kg per inhabitant). No lessons can be drawn from the state of Chinese e-waste recycling. Instead, several deficiencies are common to both countries. First, e-waste collection is a complex combination of formal and informal methods for both countries. In South Africa, usually all the collected materials end with government-linked recycling centers, where processing takes place. There are few buy-back schemes in South Africa.
South Africa does not have a dedicated legislation for this waste stream compared with other developed countries. The next sections present some existing legislation that covers this waste stream in general.
3. Case Study: Cathode Ray Tubes
CRTs have multiple recyclable parts and so present good opportunities as compared to different e-waste streams. Recycling of CRTs is not usually efficient because of the dangerous nature of its various parts. CRT glass is the biggest problem because it contains lead, strontium, antimony, and barium, among other dangerous chemicals. These elements have the potential to harm the environment and human health if not handled properly. Currently, CRT glass waste handling is mainly through incineration or dumping in landfills, resulting in soil and groundwater pollution. With limited landfill capacities, there is an increasing need to find applications for waste CRT glass to minimize the volume going to landfills and create business opportunities from the waste material.
The authors based their review on this background for South Africa. The study assessed current research done on CRT recovery and recycling, aiming to provide an understanding of the current gaps and opportunities that exist within the South Africa. This study serves as a background to further experimental work by the authors. This work includes pyrometallurgical recovery of metals and recovery of plastics from CRTs.
4. CRT Characteristics and Composition
Cathode ray tubes have been used for more than 70 years as critical parts for televisions and Personal Computers (PCs). The development of the first CRT was during the 1890s as an oscilloscope to view and measure electrical signals [52]. Since then, CRTs have been a popular medium used to send and receive images electronically in television units. Although CRT technology has undergone many revisions, the core design and role have mainly remained the same over the last few decades [53,54,55,56,57,58,59,60].
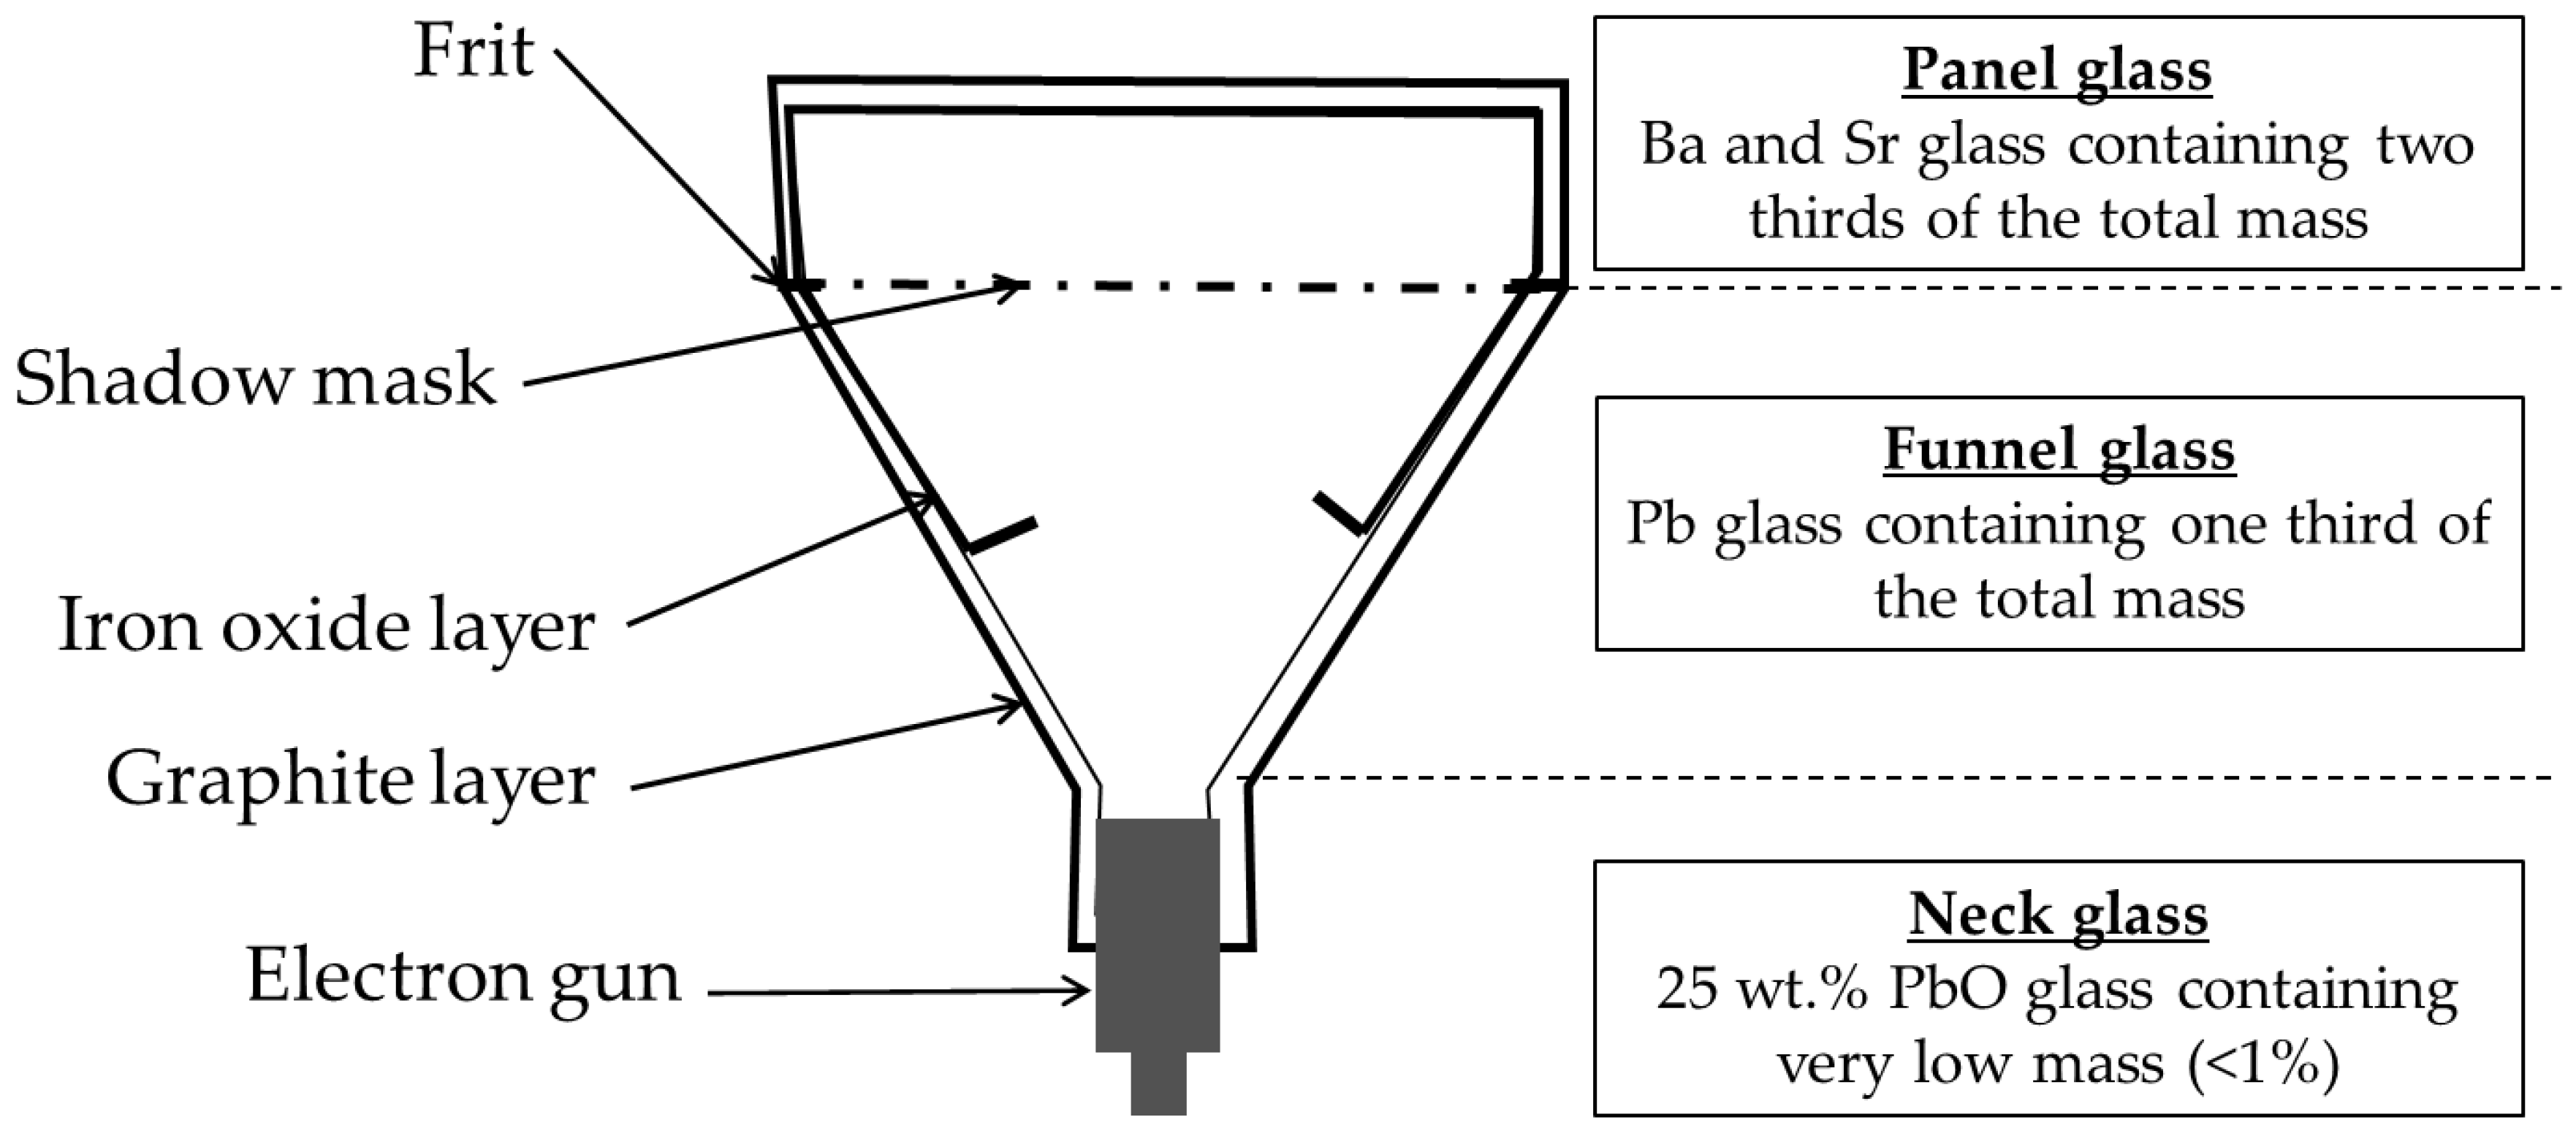
Estimates are that CRTs make up between 60 and 70 percent of the weight of a computer monitor or television [30]. The remaining material consists of plastic, a printed circuit board (PCB), cabling, and wires [31]. There are two types of CRTs, namely monochrome (black and white) and color. The monochrome and color are structurally similar with only a few technical differences. The major difference between the two CRTs is the chemical composition of the glass contained in the CRT. Figure 1 shows the structure of a CRT.

Figure 1.
Schematic diagram showing CRT components: the panel glass, funnel glass, and neck glass, with brief information on each section.
Panel, funnel, and neck glass are the three main parts of CRTs [61,62,63]. The panel glass makes up about 65 percent of the total weight. The funnel glass accounts for about 30 percent of the weight and the funnel glass occupies only 5 percent [64].
The chemical composition of CRTs varies from manufacturer to manufacturer, version, and time of production [65]. In addition, the different types of glass parts have different chemical compositions. Table 2 provides a typical chemical composition of both the monochrome and the color CRTs [66].
Table 2.
Typical chemical composition of monochromatic and color CRT [34].
Based on the chemical composition, there are no big differences between the monochromatic and color CRTs. Silica (SiO2) forms the highest percentage in both CRTs. In both types, the panel glass contains little lead (Pb). Panel glass manufacturing only involves a barium–strontium glass, which is free of lead. Lead in CRTs is found in the funnel and neck components, and concentrated in the neck glass [67]. The role of lead is absorbing UV and X-ray radiation produced by the CRT [68]. Given the overall composition of the CRT, the main concern is the presence of lead. This is because lead is toxic and has adverse health and environmental effects if not handled properly [69,70].
5. CRT Mass Flow
As previously noted, advances in e-waste recovery and recycling differ from country to country. Some countries such as the United States have progressed more than others, especially when compared to developing countries [11,22,70,71,72,73]. However, EEE production and the challenges it brings are a worldwide phenomenon. Globally, the need to recover and recycle e-waste is increasing as the landfilling the dangerous substances contained in the waste is no longer a good option. Most landfills are getting full. Also, environmental laws are stricter and e-waste is regarded as high-risk [74].
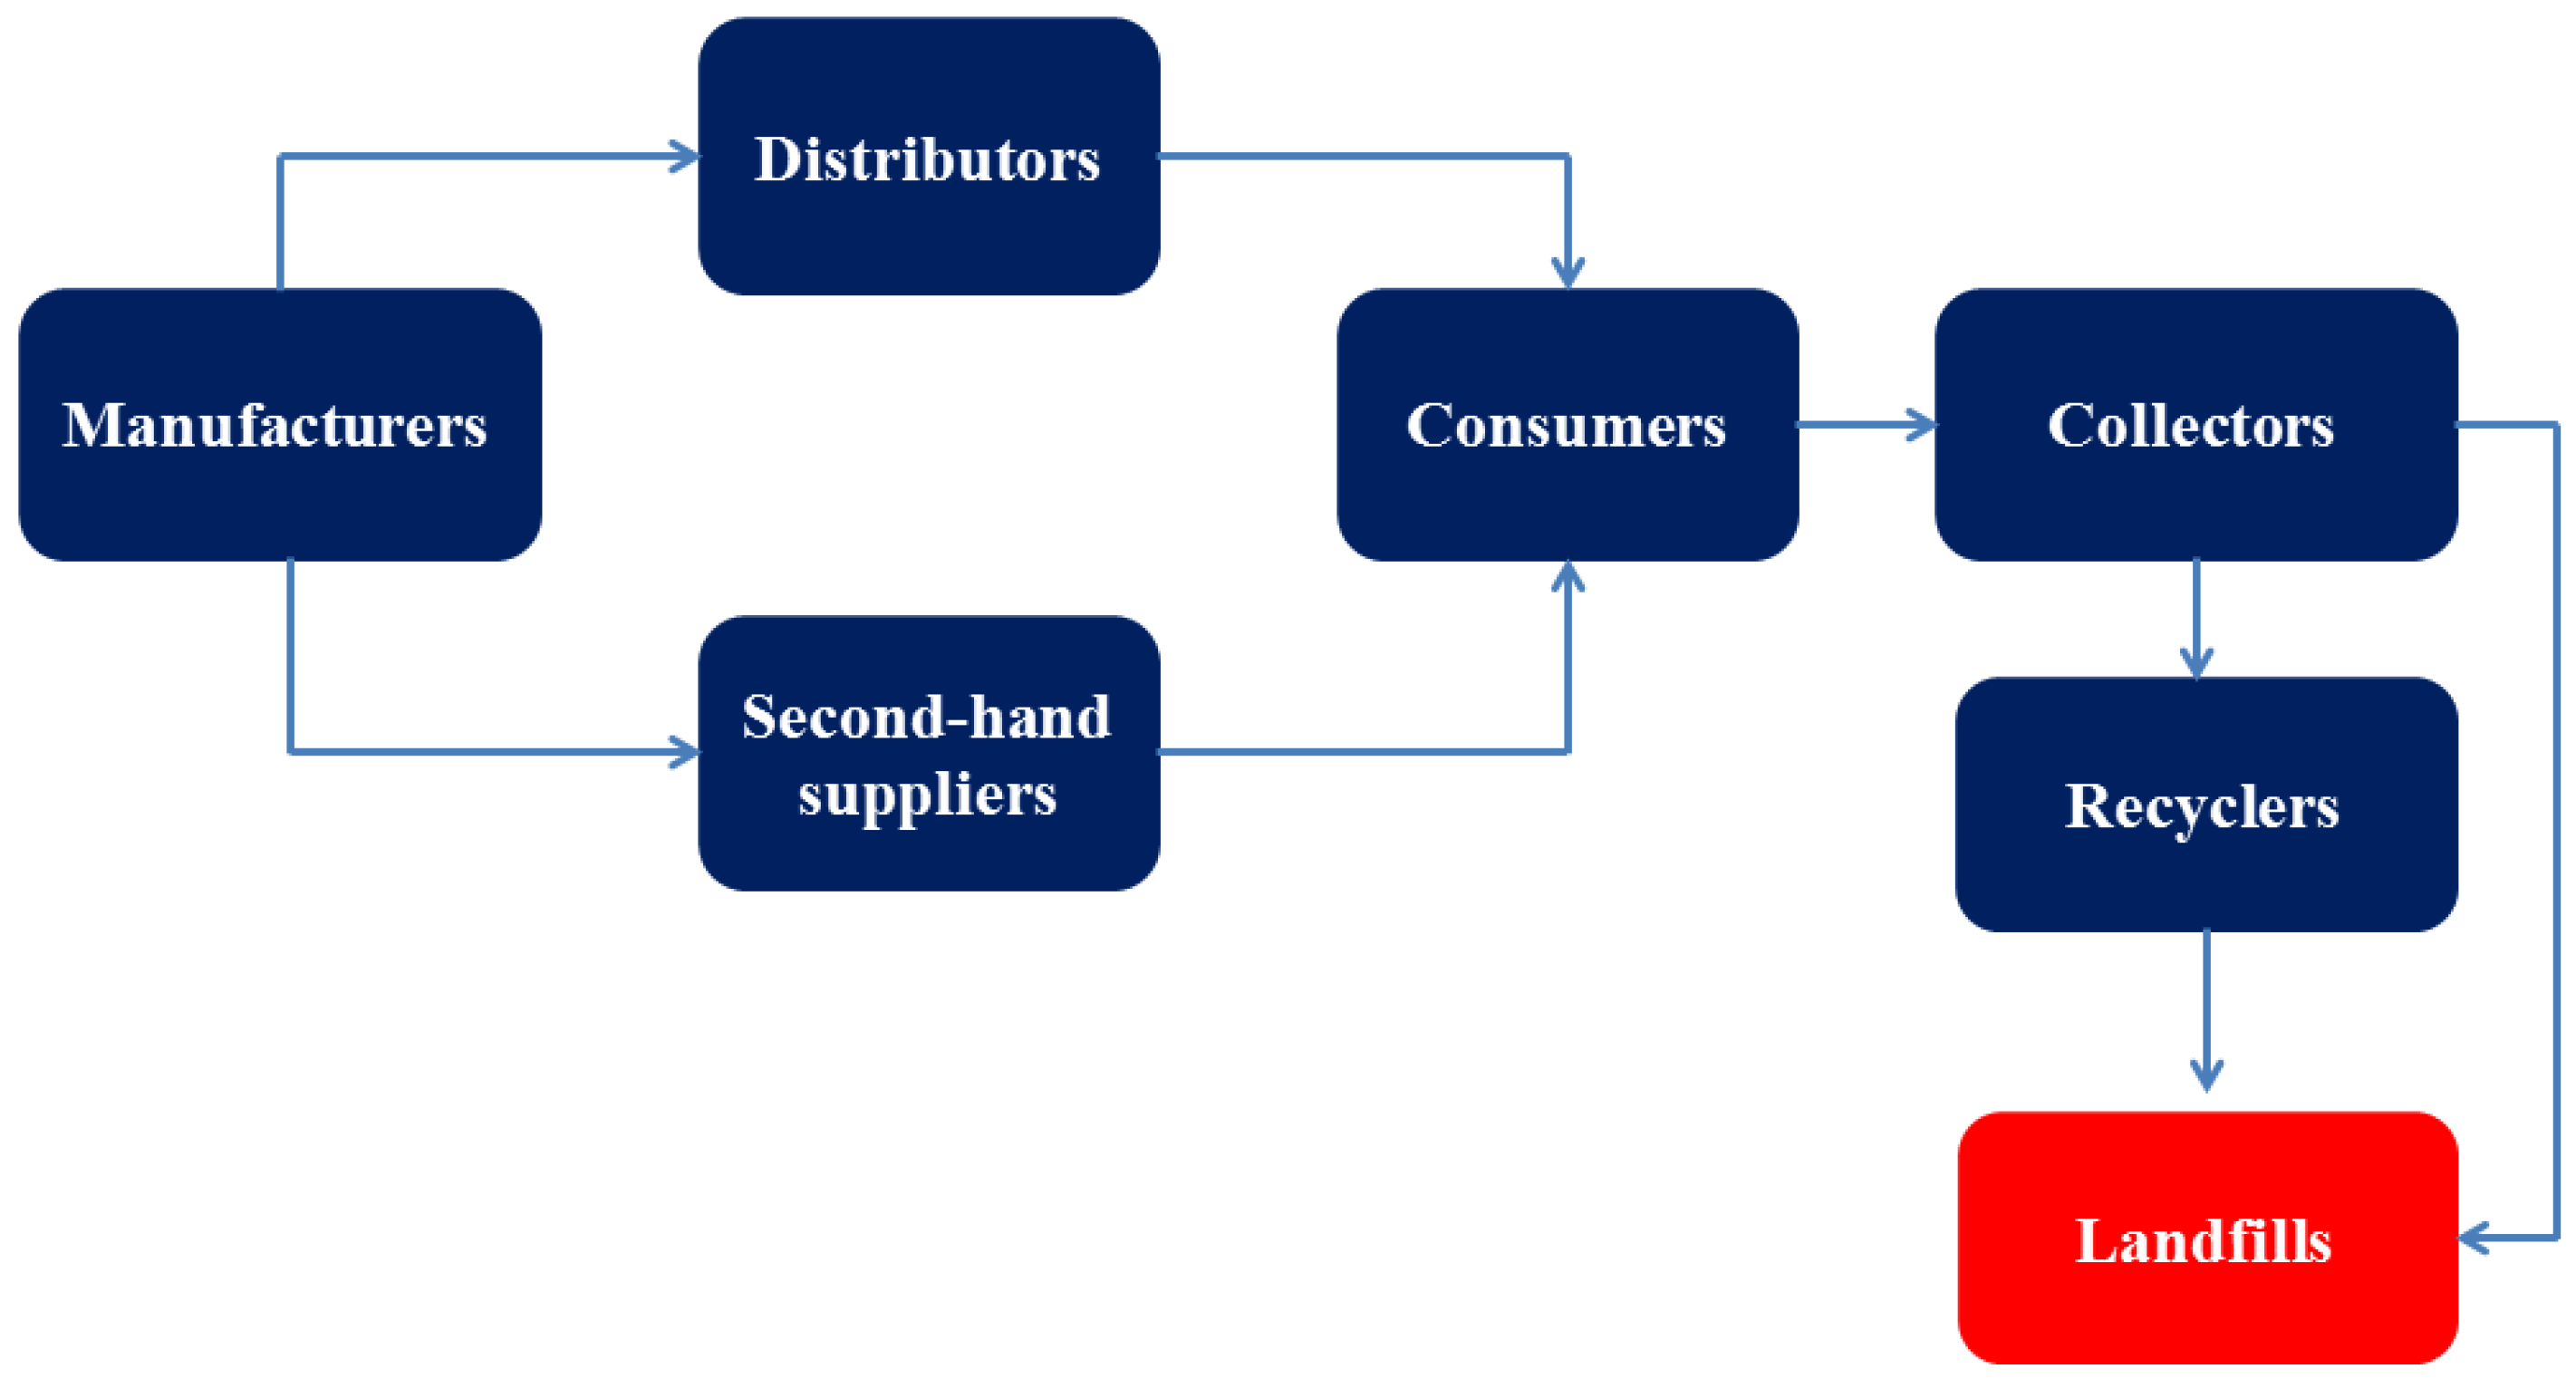
In South Africa, the e-waste industry is still developing and therefore there are still many barriers that exist. One of the main challenges slowing the development of e-waste management strategies is the lack of baseline data. An extensive body of knowledge exists for other waste streams, and there are enough government and private initiatives to deal with these forms of waste [75,76,77,78]. Limited qualitative and quantitative data are available on e-waste in South Africa. However, things have begun moving in the right direction, with South Africa having now recognized e-waste as one of six priority waste streams. The number of e-waste research studies is now increasing. Dominik Zumbuehl conducted one such study that was specific to CRT recycling [79]. The research was a mass flow assessment of CRT in the Cape Metropolitan Municipality, South Africa. The main aim of the research was providing the basis for development of CRT management systems. As part of the assessment, Zumbuehl mapped out the CRT value chain, showing all key role players. Figure 2 shows a typical mass flow of CRT monitors and televisions.

Figure 2.
A typical mass flow of CRT monitors and televisions.
South Africa imports CRT monitors as there are no local producers in the country. The major brands manufacturing CRTs are Samsung, Proline, Sony, Mecer, etc. South African distributors sell CRT products to consumers. There is also a choice of buying from second-hand suppliers that import obsolete computers and refurbish them for the secondary market. Once the products have reached their end-of-life, they are regarded as waste. The recovery begins at this point. Several companies collect e-waste material to either sell the valuable material (that is, PCBs) to recyclers or to dispose of it in landfills. The collectors dismantle the monitors or televisions to separate plastics, PCBs, wires, metals, and glass. Selling or landfilling of the different parts then takes place.
As mentioned above, minimal data exist on the number CRTs entering landfills. Zumbuehl estimated landfilling of 7950 CRT monitors in Cape Metropolitan Municipality, yearly [79]. There are no up-to-date national figures per province, except for the annual estimate of 0.35 million tons quoted by Balde et al. [6]. A high percentage of CRTS still ends up in landfills or incinerators.
5.1. CRT Recycling Technologies
Figure 3 provides a CRT processing flow chart. E-waste recycling comprises four main steps: collection, pre-processing, sorting, separation, and processing. The first stage of recycling is collection from consumers once the EEE have reached their EOL.

Figure 3.
A generic CRT processing flow sheet.
The next stage after collection is pre-processing. Sorting and separation follow. After separation, the different e-waste parts go through to the different streams of production. The following subsections discuss the different stages of handling CRT waste (and other e-waste).
5.1.1. Collection
As noted above, the main consumers are private, corporate, and government institutions. Collection of obsolete ICT equipment from these three main sources forms most of the waste. The collection is not yet widely accessible in South Africa. However, the main collection method used today is the door-to-door approach. Collectors or recyclers usually facilitate the collection. Most of the recyclers or collectors have now placed e-waste containers in public places such as shopping malls to try to entice consumers.
5.1.2. Pre-Processing
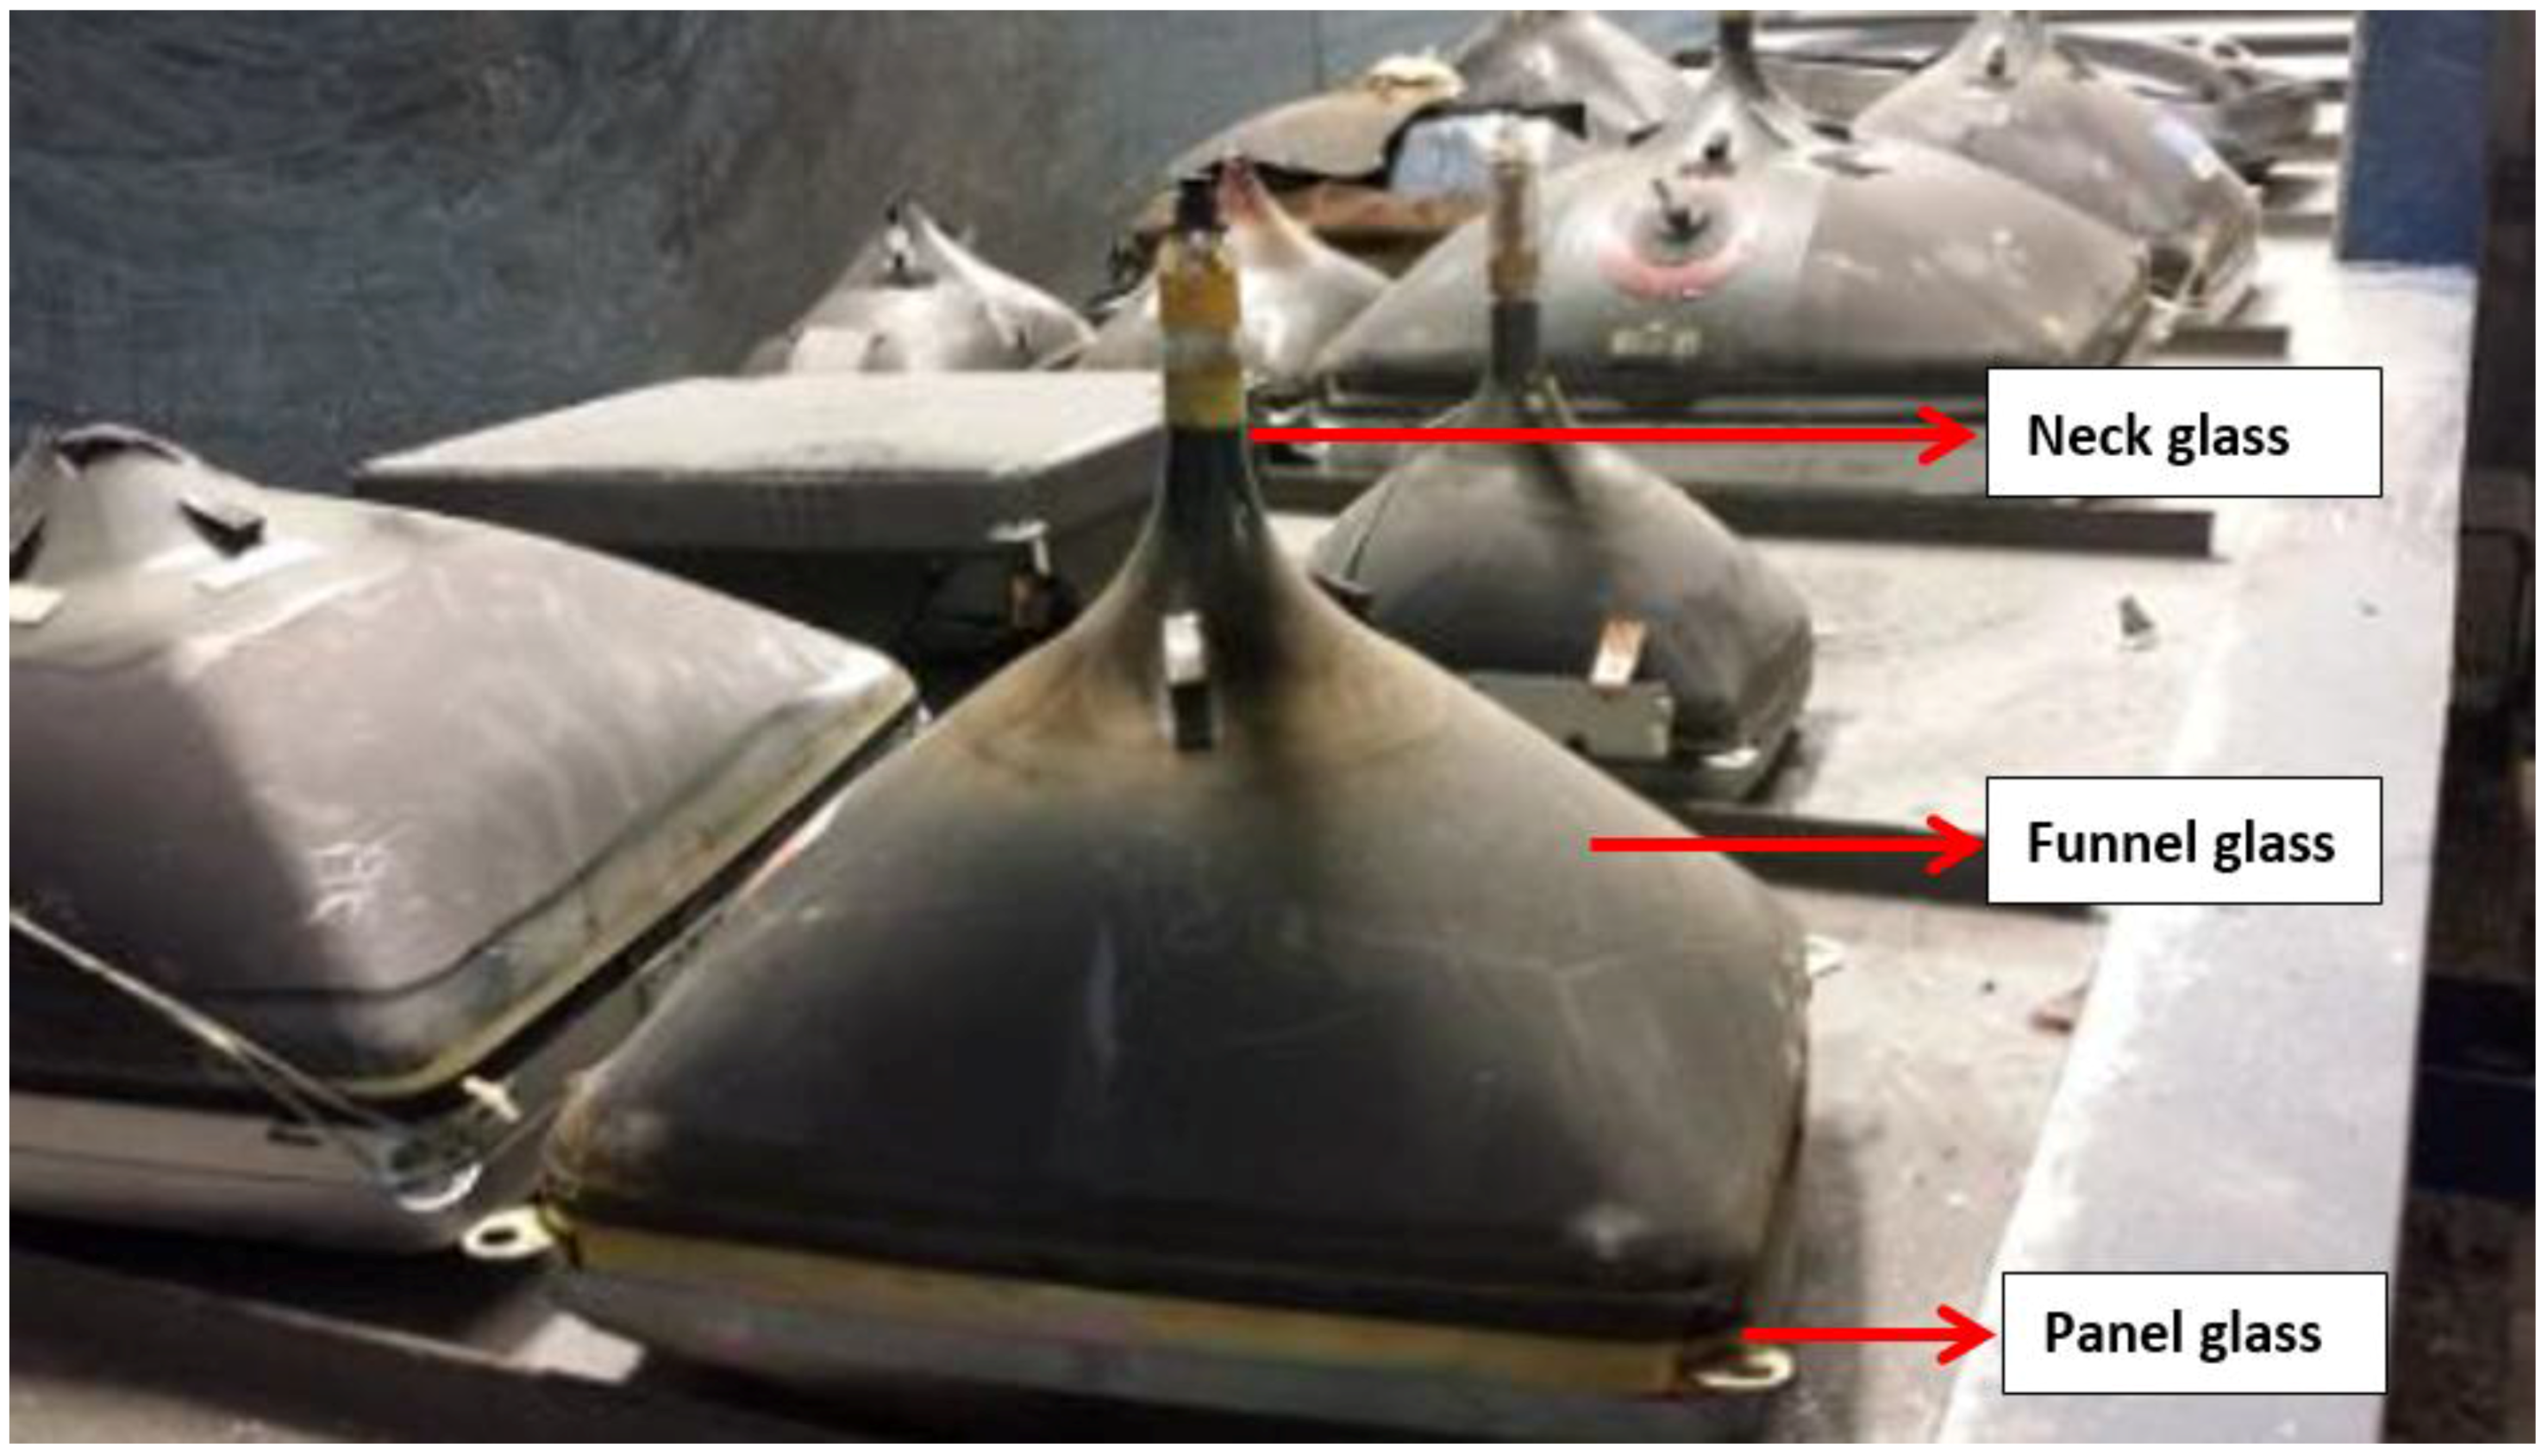
The next stage in the value chain is pre-processing. This step involves stripping and dismantling of CRT monitors and TVs. This process is manual, using hand tools such as screwdrivers, grippers, and hammers. The process starts with the removal of the plastic casing, followed by the cables and wires, and then circuit boards. Removal of the CRT glass is the last step. Figure 4 shows the CRT monitors after the removal of all the other parts.

Figure 4.
Stripped CRT monitors.
5.1.3. Sorting and Separation
The method used during sorting and separation stages depends on the final application of the parts. Certain applications require crushing of CRTs into different size fractions and separation according to the different types of glass (i.e., leaded or non-leaded glass). SwissGlas, in Switzerland, does this on an industrial scale, processing nearly five tons of CRT cullets hourly [80]. Different glass types can be separated before crushing. Several techniques exist for separating the panel glass from the funnel glass. The next bullet points discuss these briefly.
- Hotwire technique: The hotwire technique involves the use of a heated electric wire, wound at the panel–funnel glass boundary. Heating is kept up for a certain time before cool air is blown onto the surface, leading to thermal shock. This is the preferred method for processors because it is cheap, easy to use, and efficient. The hotwire technology is suitable for small to medium processing plants. The current market price of the technology is between R900,000 and R2 million [65,81].
- Laser cutting method: Proventia Automation from Finland developed this method. The technology uses a carbon dioxide laser beam that cuts the CRT below the frit and separates the CRT into the funnel and panel glass. This method has distinct advantages as it does not use any chemicals or water [36]. However, this method is expensive, costing roughly 500,000 euros (R8.9 million). This device can separate up to 75 CRTs an hour [82].
- Diamond cutting method: This technology uses a diamond wire to separate the two glasses. A continuous loop of wire cuts into the glass as the CRT passes through the cutting plane. This method is slow and produces dust. This technology can process up to 70 CRTs an hour. It costs between R4 million and R5 million [81].
- Acid melting: Acid melting separates the funnel and the panel glass using nitric acid. During this method, the boundary dissolves in a hot acid bath. This method is not efficient—it produces large amounts of wastewater, resulting in high disposal costs [65].
- Water jet technique: This technology uses a high-pressure spray of water containing an abrasive, directed at the target surface. The water is focused through a single or double nozzle-spraying arrangement set at a specific distance. It is also efficient and only takes 30 s to separate a CRT monitor. China is piloting this technology [80].
- Comparison of separation techniques: Table 3 is a comparison of the different separation techniques. There are several technologies available on the market for CRT separation. The setup costs for these technologies are high.
Table 3. Comparison of separation techniques.
Laser and hot wire technologies are the most attractive solutions in the market because of the low variable costs. Despite difference in the costs, all available technologies can provide a separation that leads to a high-quality product. However, health and safety and potential environmental issues should be taken into consideration when making the choice.
5.1.4. Processing
Normal disposal methods for CRTs have been landfilling and incineration because of their low recyclable value. Landfilling is no longer the cheapest alternative because not only do landfills occupy massive amounts of land, but there is a risk of soil contamination and groundwater pollution. Incineration was at one point a solution to reduce the space needed for disposal; however, it now poses serious threats of air pollution. Thus there is a need for new and efficient methods for CRT waste management. Subsequent sections discuss the different recycling strategies.
5.2. Overview of Recycling Strategies
Extensive research exists at an international level on the different CRT recycling approaches [63,64,65,66,78,79]. Proposals exist on how to deal with CRT waste. Two categories exist, namely closed-loop recycling (waste to new CRT) and open-loop recycling (waste CRT to new products) [18,67]. Figure 5 shows the two recycling routes with key end-products. The next section further discusses the two methods.
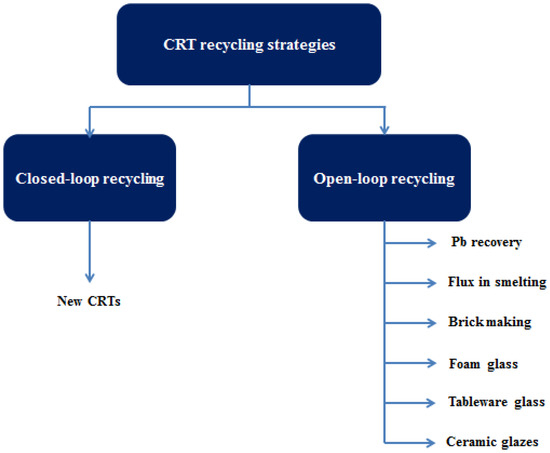
Figure 5.
Potential recycling strategies for CRT glass.
5.2.1. Closed-Loop Recycling
Closed-loop recycling is the industrial-scale recycling of waste CRT to produce new CRTs [54]. During this process, the waste CRT glass is divided into the nonleaded panel glass and the lead-containing glass. Electric-wire or laser cutting or acid melting methods separate the panel and the funnel glass, as discussed above. According to Yu-Gong et al., this method has shown great progress in managing CRTs [36]. Compared with landfilling and incineration, this method is environmentally and economically sound. According to Zumbuehl, Samsung Corning in Germany and Thomson-Polcolor in Poland are manufacturing new CRT glass from waste material [80]. Added benefits from the use of waste CRT are energy and raw material savings. Introduction of LCD technologies in the market threaten the sustainability of this business. With advances in ICT, CRT demand is decreasing rapidly.
5.2.2. Open-Loop Recycling
The second proposed form of recycling is open-loop recycling. Open-loop recycling involves the use of waste CRTs to produce a wide variety of new products. Open-loop recycling is attractive because it offers both environmental and economic benefits [65]. A brief discussion of the various areas where waste CRT is used follows.
- Smelting: In smelting, CRT glass can replace sand as a flux. This works if the metals contained in the glass (lead) are compatible and recoverable. Metal recovery ensures the slag is free of toxic chemicals [79].
- Brick manufacturing: Various studies have investigated the use of CRT glass in brick manufacturing. This application is only suitable for panel glass since it contains no lead. Results have been promising so far, according to the first published studies by Staffordshire University in the United Kingdom. Tests showed that the physical properties of the product made it suitable for non-engineering applications, such as decorative bricks and cladding tiles [53].
- Foam glass production: Foam glass is an insulating material made from post-consumer waste glass. Production of foam glass from waste glass has reached a commercial scale. The use of waste CRT therefore stands to be successful in this application as manufacturers have showed no technical barriers [18,83,84].
- Tableware glass: Researchers in Murano, Italy used CRT glass in tableware production. The project test-work was in collaboration with a commercial glass factory. The project yielded positive results with good-quality glass products produced. The leaching tests conducted on the products also came out positive [18].
- Insulating glass: Recytube, one of the more popular CRT research projects, studied the use of CRT during manufacturing fiberglass. The quality of fiberglass from CRT glass was comparable to commercial fiberglass. Even though the laboratory test results proved positive, there is still some resistance from manufacturers [18].
- Ceramic glazes: Different raw materials compose glaze suspensions. Various studies have examined the use of CRT glass as one of the raw materials. Because CRT glass contains barium, strontium, and zirconium, it gives brightness, chemical resistance, and a matte effect to the glaze mixture [18].
A wide range of applications exist for dealing with waste CRT. Concerns about introducing hazardous substances into new products remain, though. Most current work involves lab testing of this.
6. CRT-Specific Legislation
As previously noted, the e-waste industry in South Africa is still at its infancy. South Africa only recognized e-waste as a priority waste stream recently. Currently, there is no specific legislation that regulates e-waste management in the country. South Africa has progressive legislation that recognizes principles of environmental protection and rehabilitation. The following few paragraphs provide a discussion from an international perspective.
The USA is one of the few countries that have CRT-specific legislation, namely the Hazardous Waste Management and Cathode Ray Tubes, Final Rule, 40 CFR Parts 9, 260,261,271 of 2006. This CRT Rule streamlines the management standards for used CRTs and encourages reuse and recycling instead of landfilling or incineration. This legislation proposes several CRT reuse and recycling methods.
The EPA has the following requirements:
- annual reports from exporters of used CRTs for recycling,
- notice when CRTs are exported for recycling,
- notice when CRTs are exported for reuse and,
- normal business records kept by exporters of used CRTs for reuse and translated into English on request.
In addition, the state of Iowa (Cathode Ray Tube Device Recycling Rules, IAC 567 Chapter 122, 2004) and the state of Virginia (Cathode Ray Tubes and Mercury Thermostat Recycling, Va. Code 10.1-1425.26, as Amended 2010) have passed their own state legislation dedicated to CRTs. Most other developed countries have included terms for CRTs within other e-waste legislations (discussed in Section 2).
China, as a developing nation, has legislation specifically for CRTs, namely the Requirements of Disassembly and Treatment for Waste CRT Televisions and Display Devices, Standard GB/T 31377-2015.
6.1. South African Legislation
The Constitution of the Republic of South Africa guides the industry, first and foremost, along with the National Environmental Management Act under the Waste Act 59 of 2008. Legislation that is applicable to e-waste includes: Environment and Conservation Act (No. 73 of 1989), Occupational Health and Safety Act (No. 85 of 1993), and the Hazardous Substances Act (No. 15 of 1973). The next section discusses these in detail.
6.1.1. The Constitution of the Republic of South Africa
The Constitution of the Republic of South Africa is the main legislation in the country and ensures that basic human rights are upheld. Environmental protection is of prime importance in South Africa, given the many environmental problems left behind by past apartheid policies and practices. Section 24 of the Constitution stipulates that: “everyone has the right to an environment that is not harmful to their health or well-being; and the right to have the environment protected, for the benefit of the present and future generations, through reasonable legislative and other measures that prevent pollution and ecological degradation; promote conservation and secure ecologically sustainable development and use of natural resources while promoting justifiable economic and social development” [85]. This gives all citizens the right to live in an environment that is not harmful to their health.
6.1.2. The National Environmental Management Act: Waste Act
The National Environmental Management Act (Waste Act) is founded on the principles of the Constitution. The Waste Act gives a framework for sound environmental management practices for all development practices. The Act, passed in 2008, regulates and controls management of all waste, including e-waste. Before this Act, there was no specific legislation to manage waste in the country. The Act refers to avoidance or minimization and remediation of pollution, including waste reduction, reuse, recycling, and proper waste disposal [86].
6.1.3. Environment Conservation Act (No. 73 of 1989)
The Environment Conservation Act (ECA) provides for protection and controlled use of the environment. Section 20 of the ECA makes specific reference to waste disposal and assigns the role of issuing permits for waste disposal to the Department of Water Affairs and Forestry.
6.1.4. Hazardous Substances Act (No. 15 of 1973)
E-waste contains many hazardous substances. The Hazardous Substances Act regulates hazardous substances and their disposal. The Act classifies different types of hazardous substances into four groups and imposes detailed requirements when handling, selling, using, and applying them.
6.1.5. The Occupational Health and Safety Act (No. 85 of 1993)
The main objective of Occupational Health and Safety Act (OHSA) is to ensure that people work in an environment that is not harmful to their wellbeing. Other rules in the Act deal with handling, use, exposure control, use of PPE, and storage or disposal of hazardous chemicals. These include:
- Lead Regulations,
- Hazardous Chemical Substances Regulations,
- Environmental Regulations for Workplaces and
- General Safety Regulations.
6.1.6. Other Applicable Legislation
Other applicable laws are:
- National Water Act (No. 36 of 1998)
- Atmospheric Pollution Prevention Act (No. 45 of 1965)
- Air Quality Act (No. 39 of 2004)
- National Health Act (No. 61 of 2003)
- Precious Metal Regulation
- Second-Hand Goods Legislation
- Consumer Protection Act (No. 68 of 2008)
6.1.7. The Path forward for South Africa: Waste Research Development and Innovation (RDI) Roadmap (2015—2025)
The Department of Science and Technology (DST) leads the RDI roadmap to stimulate waste R&D, waste innovation, and human capital development in the waste sector. The government recognizes the waste sector as an important platform contributing to job creation and economic development. The basis for the Waste RDI Program is:
- increasing diversion of waste from landfill,
- creating value-adding opportunities,
- optimization of value-adds,
- leading to significant economic, social and environmental benefits, and
- creating a sustainable regional secondary economy.
The Waste RDI roadmap provides strategic direction, to coordinate and manage the country’s waste investment in the following areas:
- Strategic Planning
- Modeling and Analytics
- Technology Solutions
- Waste Logistics Performance
- Waste and Environment
- Waste and Society
E-waste is a priority waste stream in the roadmap. E-waste currently makes up between 5% and 8% of the municipal solid waste in South Africa. The volumes of e-waste are continually increasing. There is an urgent need to develop e-waste management systems that address the current challenges. The challenges are consumer awareness, collection, recycling, and waste disposal. The roadmap plans to divert 50 percent of e-waste from landfills by 2024 [87].
7. Conclusions
There has been massive interest in e-waste the world over, fueled by the continued increase in producing EEE and the volumes of waste EEE produced. The problems emanating from poor disposal and management of e-waste, and the possible economic opportunities, have pushed countries to reconsider old ways of managing e-waste. Research is being conducted at an international level to come up with efficient solutions to deal with e-waste.
CRT-related research is one of the fastest-growing areas and receives a good deal of attention. For some time, landfilling and incineration were the best solutions for managing CRT waste. This has changed since, largely due to the strict environmental laws and policies. There is a trend towards recovering and recycling waste CRTs because they pose a risk to the environment and human health.
In South Africa, the e-waste recycling industry is fairly young, and therefore limited baseline data are available at the country level. E-waste currently forms between 5% and 8% of municipal solid waste in South Africa and there is an expectation that these volumes will soon increase significantly. The per-inhabitant e-waste production rates for South Africa are similar to those of China. However, the Chinese e-waste management methods are not effective owing to lax enforcement of laws. Similarly to China, South Africa has ended up with a mixture of formal and informal collection methods that is a lot harder to regulate. However, several initiatives are under consideration to solve the e-waste problem using a customized approach that recognizes local complexities.
Acknowledgments
The authors thank Mintek (SA) for permission to publish the results and financial support.
Author Contributions
P.L. conceived the project; P.L. and N.S collected and analyzed literature data. P.L. drafted the first manuscript; N.S. supervised and edited the manuscript.
Conflicts of Interest
The authors declare no conflict of interest.
References
- Kiddee, P.; Naidu, R.; Wong, M.H. Electronic waste management approaches: An overview. Waste Manag. 2013, 33, 1237–1250. [Google Scholar] [CrossRef] [PubMed]
- Kiddee, P.; Naidu, R.; Wong, M.H. Metals and polybrominated diphenyl ethers leaching from electronic waste in simulated landfills. J. Hazard Mater. 2013, 252, 243–249. [Google Scholar] [CrossRef] [PubMed]
- Li, J.; Zeng, X.; Chen, M.; Ogunseitan, O.A.; Stevels, A. “Control-alt-delete”: Rebooting solutions for the e-waste problem. Environ. Sci. Technol. 2015, 49, 7095–7108. [Google Scholar] [CrossRef] [PubMed]
- Babu, B.R.; Parande, A.K.; Basha, C.A. Electrical and electronic waste: A global environmental problem. Waste Manag. Res. 2007, 25, 307–318. [Google Scholar]
- Li, J.; Zeng, X.; Stevels, A. Ecodesign in consumer electronics: Past, present, and future. Crit. Rev. Environ. Sci. Technol. 2015, 45, 840–860. [Google Scholar] [CrossRef]
- The Global E-Waste Monitor 2014: Quantities Flows and Resources. Available online: http://i.unu.edu/media/ias.unu.edu-en/news/7916/Global-E-waste-Monitor-2014-small.pdf (accessed on 1 August 2016).
- Mundada, M.N.; Kumar, S.; Shekdar, A.V. E-waste: A new challenge for waste management in India. Int. J. Environ. Stud. 2004, 61, 265–279. [Google Scholar] [CrossRef]
- Pérez-Belis, V.; Bovea, M.D.; Ibáñez-Forés, V. An in-depth literature review of the waste electrical and electronic equipment context: Trends and evolution. Waste Manag. Res. 2015, 33, 3–29. [Google Scholar] [CrossRef] [PubMed]
- Osibanjo, O.; Nnorom, I.C. The challenge of electronic waste (e-waste) management in developing countries. Waste Manag. Res. 2007, 25, 489–501. [Google Scholar] [CrossRef] [PubMed]
- E-waste Facts: Causes International. Available online: https://www.causesinternational.com/ewaste/e-waste-facts (accessed on 1 August 2016).
- Sahin, M.A.A.; Erust, C.; Altynbek, S.; Gahan, C.S.; Tuncuk, A. A Potential Alternative for Precious Metal Recovery from E-waste: Iodine Leaching. Sep. Sci. Technol. 2015, 50, 2587–2595. [Google Scholar] [CrossRef]
- Jujun, R.; Yiming, Q.; Zhenming, X. Environment-friendly technology for recovering nonferrous metals from e-waste: Eddy current separation. Resour. Conserv. Recycl. 2014, 87, 109–116. [Google Scholar] [CrossRef]
- Laner, D.; Rechberger, H. Treatment of cooling appliances: Interrelations between environmental protection, resource conservation, and recovery rates. Resour. Conserv. Recycl. 2007, 52, 136–155. [Google Scholar] [CrossRef]
- Ilgin, M.A.; Gupta, S.M. Environmentally conscious manufacturing and product recovery (ECMPRO): A review of the state of the art. J. Environ. Manag. 2010, 91, 563–591. [Google Scholar] [CrossRef] [PubMed]
- Cucchiella, F.; D’Adamo, I.; Koh, S.L.; Rosa, P. A profitability assessment of European recycling processes treating printed circuit boards from waste electrical and electronic equipments. Renew. Sust. Energ. Rev. 2016, 64, 749–760. [Google Scholar] [CrossRef]
- Nyanjowa, W.; James, Y. Material Flow Analysis of Printed Circuit Boards and Lithium Ion Batteries in Gauteng, South Africa; Internal report; Mintek: Randburg, South Africa, 2015. [Google Scholar]
- National Consultative Conference on Electronic and Electrical Waste (E-Waste) Management in South Africa. Available online: https://www.environment.gov.za/speech/molewa_government_e-waste_conference (accessed on 1 August 2016).
- Andreola, F.; Barbieri, L.; Corradi, A.; Lancellotti, I. CRT glass state of the art: A case study: Recycling in ceramic glazes. J. Eur. Ceram. Soc. 2007, 27, 1623–1629. [Google Scholar] [CrossRef]
- Buekens, A.; Yang, J. Recycling of WEEE plastics: A review. J. Mater. Cycles. Waste 2014, 16, 415–434. [Google Scholar] [CrossRef]
- Ruan, J.; Xu, Z. Approaches to improve separation efficiency of eddy current separation for recovering aluminum from waste toner cartridges. Environ. Sci. Technol. 2012, 46, 6214–6221. [Google Scholar] [CrossRef] [PubMed]
- Ruan, J.; Xue, M.; Xu, Z. Risks in the physical recovery system of waste refrigerator cabinets and the controlling measure. Environ. Sci. Technol. 2012, 46, 13386–13392. [Google Scholar] [CrossRef] [PubMed]
- Huo, X.; Peng, L.; Xu, X.; Zheng, L.; Qiu, B.; Qi, Z.; Zhang, B.; Han, D.; Piao, Z. Elevated blood lead levels of children in Guiyu, an electronic waste recycling town in China. Environ. Health Perspect. 2007, 115, 1113–1117. [Google Scholar] [CrossRef] [PubMed]
- The Role of BRICS in the Developing World. Available online: http://www.ab.gov.tr/files/ardb/evt/1_avrupa_birligi/1_9_politikalar/1_9_8_dis_politika/The_role_of_BRICS_in_the_developing_world.pdf (accessed on 10 October 2016).
- Fedoseeva, S.; Zeidan, R. A dead-end tunnel or the light at the end of it: The role of BRICs in European exports. Econ. Mod. 2016, 59, 237–248. [Google Scholar] [CrossRef]
- Yao, X.; Watanabe, C.; Li, Y. Institutional structure of sustainable development in BRICs: Focusing on ICT utilization. Technol. Soc. 2009, 31, 9–28. [Google Scholar] [CrossRef]
- Wilson, D.; Puruthaman, R. Dreaming with BRICs: The Path to 2050; Global Economics Paper No. 99; Goldman Sachs: New York, NY, USA, 2003. [Google Scholar]
- Armijo, L.E. The BRICs countries (Brazil, Russia, India, and China) as analytical category: Mirage or insight? Asian Perspect. 2007, 31, 7–42. [Google Scholar]
- United Nations University Sustainable Cycles (2015) Step E-Waste World Map. Database Available from STEP—Solving the E-waste Problem 2015. Available online: http://www.step-initiative.org/Overview_USA.html#Regulatory (accessed on 10 October 2016).
- From the EPA: E-Waste News and Statistics. Available online: http://ewastecollective.org/from-the-epa-e-waste-facts-and-statistics/ (accessed on 10 October 2016).
- Jang, Y.-C.; Townsend, T.G. Leaching of Lead from Computer Printed Wire Boards and Cathode Ray Tubes by Municipal Solid Waste Landfill Leachates. Environ. Sci. Technol. 2003, 37, 4778–4784. [Google Scholar] [CrossRef] [PubMed]
- Basel Convention on the Control of Transboundary Movements of Hazardous Wastes and Their Disposal. Available online: http://www.basel.int/portals/4/basel%20convention/docs/text/baselconventiontext-e.pdf (accessed on 10 October 2016).
- Electronic Waste Recycling Fee. Available online: http://www.boe.ca.gov/pdf/pub95.pdf (accessed on 10 October 2016).
- Tax Rates—Special Taxes and Fees. Available online: http://www.boe.ca.gov/sptaxprog/tax_rates_stfd.htm (accessed on 10 October 2016).
- Plug-In to eCycling Guidelines for Materials Management. Available online: http://www.epeat.net/documents/reference-docs/epa-plug-in-to-ecycling-guidelines.2004-05.pdf (accessed on 10 October 2016).
- Responsible Recycling (“R2”) for Use in Accredited Certification Programs for Electronics Recyclers. Available online: https://www.doi.gov/sites/doi.gov/files/migrated/greening/electronics/upload/R2-Document-2.pdf (accessed on 10 October 2016).
- Kang, H.Y.; Schoenung, J.M. Electronic waste recycling: A review of US infrastructure and technology options. Resour. Conserv. Recycl. 2005, 45, 368–400. [Google Scholar] [CrossRef]
- Study on Collection Rates of Waste Electrical and Electronic Equipment (WEEE). Available online: http://ec.europa.eu/environment/waste/weee/pdf/Final_Report_Art7_publication.pdf (accessed on 10 October 2016).
- Sthiannopkao, S.; Wong, M.H. Handling e-waste in developed and developing countries: Initiatives, practices, and consequences. Sci. Total Environ. 2013, 463, 1147–1153. [Google Scholar] [CrossRef] [PubMed]
- Widmer, R.; Oswald-Krapf, H.; Sinha-Khetriwal, D.; Schnellmann, M.; Böni, H. Global perspectives on e-waste. Environ. Impact Assess. Rev. 2005, 25, 436–458. [Google Scholar] [CrossRef]
- Honda, S. Japan’s experiences in environmentally sound management of e-waste. In Proceedings of the E-waste Workshop at IETC, Osaka, Japan, 6–9 July 2010.
- United Nations University Sustainable Cycles (2015) Step E-Waste World Map. Database available from STEP—Solving the E-waste Problem 2015. Available online: http://www.step-initiative.org/Overview_Japan.html (accessed on 10 October 2016).
- Chi, X.; Streicher-Porte, M.; Wang, M.Y.; Reuter, M.A. Informal electronic waste recycling: A sector review with special focus on China. Waste Manag. 2011, 31, 731–742. [Google Scholar] [CrossRef] [PubMed]
- United Nations University Sustainable Cycles (2015) Step E-Waste World Map. Database Available from STEP—Solving the E-waste Problem 2015. Available online: http://www.step-initiative.org/Overview_China.html (accessed on 10 October 2016).
- Ongondo, F.O.; Williams, I.D.; Cherrett, T.J. How are WEEE doing? A global review of the management of electrical and electronic wastes. Waste Manag. 2011, 31, 714–730. [Google Scholar] [CrossRef] [PubMed]
- Wang, Z.; Guo, D.; Wang, X. Determinants of residents’ e-waste recycling behavior intentions: Evidence from China. J. Clean. Prod. 2016, 137, 850–860. [Google Scholar] [CrossRef]
- State Council. Regulations for the Administration of the Recovery and Disposal of Electric and Electronic Products. Order of the State Council of the People’s Republic of China, No. 551; 2009. Available online: http://www.chinarohs.com/chinaweee-decree551.pdf (accessed on 10 October 2016).
- Wath, S.B.; Dutt, P.S.; Chakrabarti, T. E-waste scenario in India, its management and implications. Environmental monitoring and assessment. Environ. Monit. Assess. 2011, 172, 249–262. [Google Scholar] [CrossRef] [PubMed]
- United Nations University Sustainable Cycles (2015) Step E-Waste World Map. Database Available from STEP—Solving the E-waste Problem 2015. Available online: http://www.step-initiative.org/ (accessed on 10 October 2016).
- Takeback Blues: An Assessment of E-waste Takeback in India. Available online: http://www.greenpeace.org/india/Global/india/report/2008/8/take-back-blues.pdf (accessed on 10 October 2016).
- United Nations University Sustainable Cycles (2015) Step E-Waste World Map. Database available from STEP—Solving the E-waste Problem 2015. Available online: http://www.step-initiative.org/Overview_South_Africa.html (accessed on 10 October 2016).
- Thomson, J.J. Cathode rays. Philos. Mag. 1897, 44, 293–316. [Google Scholar] [CrossRef]
- Merlin, D. Cathode Ray Tube. U.S. Patent 2,053,268, 8 September 1936. [Google Scholar]
- Branson, H. Cathode Ray Tube. U.S. Patent 2,274,586, 24 February 1942. [Google Scholar]
- Gabor, D. Cathode Ray Tube. U.S. Patent 2,795,729, 11 June 1957. [Google Scholar]
- Yoshiharu, K.; Senri, M.; Akio, O.; Susumu, Y. Cathode Ray Tube. U.S. Patent 3,448,316, 3 June 1969. [Google Scholar]
- Nobuo, K.; Akio, O.; Takizo, S. Cathode Ray Tube. U.S. Patent 3,909,524, 30 September 1975. [Google Scholar]
- Osakabe, K. Cathode Ray Tube. U.S. Patent 4,772,827, 20 September 1988. [Google Scholar]
- Kawamura, H.; Kobara, K.; Kawamura, T.; Miura, K. Cathode-Ray Tube. U.S. Patent 5,291,097, 1 March 1994. [Google Scholar]
- Kim, D.N.; Lee, B.W. Cathode Ray Tube. U.S. Patent 6,335,588, 1 January 2002. [Google Scholar]
- Andreola, F.; Barbieri, L.; Corradi, A.; Lancellotti, I. Cathode ray tube glass recycling: An example of clean technology. Waste Manag. Res. 2005, 23, 314–321. [Google Scholar] [CrossRef] [PubMed]
- Méar, F.; Yot, P.; Cambon, M.; Ribes, M. The characterization of waste cathode-ray tube glass. Waste Manag. 2006, 26, 1468–1476. [Google Scholar] [CrossRef] [PubMed]
- Sua-iam, G.; Makul, N. Use of limestone powder during incorporation of Pb-containing cathode ray tube waste in self-compacting concrete. J. Environ. Manag. 2013, 128, 931–940. [Google Scholar] [CrossRef] [PubMed]
- Mueller, J.R.; Boehm, M.W.; Drummond, C. Direction of CRT waste glass processing: Electronics recycling industry communication. Waste Manag. 2012, 32, 1560–1565. [Google Scholar] [CrossRef] [PubMed]
- Tian, X.M.; Wu, Y.F. Recent development of recycling lead from scrap CRTs: A technological review. Waste Manag. 2015, in press. [Google Scholar] [CrossRef]
- Shi, X.; Li, G.; Xu, Q.; He, W.; Liang, H. Research Progress on Recycling Technology of End-of-life CRT Glass. Mater. Rev. 2011, 11, 1–29. [Google Scholar]
- Tsydenova, O.; Bengtsson, M. Chemical hazards associated with treatment of waste electrical and electronic equipment. Waste Manag. 2011, 31, 45–58. [Google Scholar] [CrossRef] [PubMed]
- Pant, D.; Singh, P. Chemical modification of waste glass from cathode ray tubes (CRTs) as low cost adsorbent. J. Environ. Chem. Eng. 2013, 1, 226–232. [Google Scholar] [CrossRef]
- Pant, D.; Joshi, D.; Upreti, M.K.; Kotnala, R.K. Chemical and biological extraction of metals present in E waste: A hybrid technology. Waste Manag. 2012, 32, 979–990. [Google Scholar] [CrossRef] [PubMed]
- Garlapati, V.K. E-waste in India and developed countries: Management, recycling, business and biotechnological initiatives. Renew. Sust. Energ. Rev. 2016, 54, 874–881. [Google Scholar] [CrossRef]
- Iqbal, M.; Breivik, K.; Syed, J.H.; Malik, R.N.; Li, J.; Zhang, G.; Jones, K.C. Emerging issue of e-waste in Pakistan: A review of status, research needs and data gaps. Environ. Pollut. 2015, 207, 308–318. [Google Scholar] [CrossRef] [PubMed]
- Milovantseva, N.; Fitzpatrick, C. Barriers to electronics reuse of transboundary e-waste shipment regulations: An evaluation based on industry experiences. Resour. Conserv. Recycl. 2015, 102, 170–177. [Google Scholar] [CrossRef]
- Song, Q.; Li, J. Environmental effects of heavy metals derived from the e-waste recycling activities in China: A systematic review. Waste Manag. 2014, 34, 2587–2594. [Google Scholar] [CrossRef] [PubMed]
- Cucchiella, F.; D’Adamo, I.; Koh, S.L.; Rosa, P. Recycling of WEEEs: An economic assessment of present and future e-waste streams. Renew. Sust. Energ. Rev. 2015, 51, 263–272. [Google Scholar] [CrossRef]
- National Waste Information Baseline Report. Available online: http://sawic.environment.gov.za/documents/1880.pdf (accessed on 1 August 2016).
- South African Waste Snapshot. UrbanEarth. Available online: http://www.urbanearth.co.za/sites/default/files/urban_earth_sa_waste_snapshot.pdf (accessed on 1 August 2016).
- South African Waste Sector—2012: An Analysis of the Formal Private and Public Waste Sector in South Africa. Available online: http://www.wasteroadmap.co.za/download/waste_sector_survey_2012.pdf (accessed on 1 August 2016).
- Environmental Protection and Infrastructure Programmes: 15 Years of Innovative Environmental Protection and Job Creation: 1999–2014. Available online: https://www.environment.gov.za/sites/default/files/reports/epip15years_review.pdf (accessed on 1 August 2016).
- Guerrero, L.A.; Maas, G.; Hogland, W. Solid waste management challenges for cities in developing countries. Waste Manag. 2013, 33, 220–232. [Google Scholar] [CrossRef] [PubMed]
- Zumbuehl, D. Mass Flow Assessment (MFA) and Assessment of Recycling Strategies for Cathode Ray Tubes (CRTs) for the Cape Metropolian Area (CMA), South Africa; Swiss Federal Institute of Technology Zurich: Zürich, St. Gallen, Switzerland, 2006. [Google Scholar]
- MRT CRT Separator: Diamond Cutting Technology. Karlskrona: MRT System. Available online: http://www.mrtsystem.com/wp-content/uploads/2013/05/CRT-Separator-diamond-cutting.pdf (accessed on 1 August 2016).
- Materials Recovery from Waste Cathode Ray Tubes (CRTs). Available online: http://ewasteguide.info/files/ICER_2004_WRAP.pdf (accessed on 1 August 2016).
- Menad, N. Cathode ray tube recycling. Resour. Conserv. Recycl. 1999, 26, 143–154. [Google Scholar] [CrossRef]
- König, J.; Petersen, R.R.; Yue, Y. Fabrication of highly insulating foam glass made from CRT panel glass. Ceram. Int. 2015, 41, 9793–9800. [Google Scholar] [CrossRef]
- Guo, H.W.; Gong, Y.X.; Gao, S.Y. Preparation of high strength foam glass–Ceramics from waste cathode ray tube. Mater. Lett. 2010, 64, 997–999. [Google Scholar] [CrossRef]
- Republic of South Africa. Constitution of the Republic of South Africa, Act 108 of 1996; Government Gazette: London, UK, 1996; Volume 378.
- Republic of South Africa. National Environmental Management: Waste Act; Government Gazette: London, UK, 2009; Volume 525.
- A Waste Research, Development and Innovation (RDI) Roadmap for South Africa (2015–2025): Towards a Secondary Economy. Available online: https://www.environment.gov.za/sites/default/files/docs/roadmappresentation.pdf (accessed on 1 August 2016).


© 2017 by the authors; licensee MDPI, Basel, Switzerland. This article is an open access article distributed under the terms and conditions of the Creative Commons Attribution (CC BY) license (http://creativecommons.org/licenses/by/4.0/).