Abstract
From the 1950s to the 1970s, approximately 80,000 kg of tea seeds were introduced from mainland China to the Xizang Autonomous Region for experimental cultivation. To assess the genetic diversity patterns of these tea accessions following more than half a century of acclimatization to plateau environments, we analyzed genetic variation, population structure, and genetic distinctiveness among fifty tea germplasm using nine phenotypic traits and 30 SSR markers. Phenotypic analysis revealed a moderately high level of genetic diversity, as indicated by the mean Shannon diversity index (H′ = 1.29). Principal component analysis (PCA) indicated that phenotypic variation was not geographically structured across the collection sites. The SSR markers exhibited a high degree of polymorphism, with an average polymorphic information content (PIC) of 0.610 and a genetic diversity index (I) of 1.437, indicating substantial genetic variation. Analysis of molecular variance (AMOVA) revealed that genetic differentiation occurred predominantly within populations, accounting for 91.49% of the total genetic variation. Similarly, 97.86% of the variation was attributed to differences within elevational gradients. Discriminant analysis of principal components (DAPC) and Bayesian population structure modeling (STRUCTURE) both identified two genetic clusters among the studied genotypes. Our results have practical implications for tea breeding programs by providing guidance for parental selection, informing germplasm collection management, and supporting the conservation of genetic resources.
1. Introduction
Tea (Camellia sinensis L., 2n = 2x = 30) is one of the most widely consumed and economically significant non-alcoholic beverages worldwide [1]. In the society of Xizang, a sustained and substantial demand has rendered it both a socio-cultural cornerstone and a vital economic commodity for over a millennium [2,3,4]. However, the severe environmental conditions of the Xizang Plateau pose significant challenges to tea cultivation. Consequently, for an extended historical period, Tibetans relied on the Ancient Tea Horse Road to trade items such as sturdy horses for tea from external regions [5,6]. From the 1950s to the 1970s, approximately 80,000 kg of tea seeds were introduced from mainland China to the Nyingchi, Shannan, and Shigatse regions of Xizang for experimental cultivation. These genetic resources have since adapted to the distinctive environmental conditions of the Tibetan Plateau through a combination of natural and artificial selection. Consequently, their genetic characteristics have markedly diverged from the progenitor populations, exhibiting a high degree of variation and numerous rare traits, which provide a valuable foundation for the conservation and utilization of Tibetan tea germplasm for breeding improvement. Despite their breeding potential, the genetic background and phylogenetic relationships of Tibetan tea germplasm collections remain largely uninvestigated. Moreover, these resources have long been in a state of neglect, compounded by insufficient conservation awareness among local communities. This situation has resulted in progressive habitat degradation and a marked decline in the genetic diversity of these germplasm.
Genetic diversity analysis is essential for breeding programs, as it provides critical insights into the efficient conservation and utilization of existing germplasm resources [7] and enables plant breeders to develop new and improved cultivars with desirable characteristics [8,9]. Phenotypic and genotypic characterizations are two of the most widely used approaches for assessing the genetic diversity of tea germplasm [10,11,12,13,14]. The evaluation of phenotypic traits is a conventional method for analyzing genetic diversity [15]. Tea genotypes can be classified into distinct groups based on phenotypic traits such as leaf and shoot morphology, flower characteristics, and fruit and seed attributes [16]. However, phenotypic traits are susceptible to variation due to environmental influences, which can limit their reliability for assessing genetic diversity. With the advent of high-throughput DNA sequencing, PCR-based molecular markers, particularly those derived from non-coding genomic regions, have become invaluable tools for evaluating genetic diversity across a wide range of plant species [17]. Among the most commonly employed markers, techniques such as random amplification of polymorphic DNA (RAPD) [18], restriction fragment length polymorphism (RFLP) [19], and simple sequence repeats (SSR) [20] have been widely used in genetic diversity studies. SSR markers are often preferred over other DNA marker types for analyzing genetic diversity in crops due to their high degree of polymorphism, co-dominant inheritance, broad cross-species transferability, amenability to simple PCR-based assays, abundance, and high reproducibility [21,22].
This study examined the genetic variation and population structure of Tibetan tea germplasm using nine leaf phenotypic traits and 30 SSR markers distributed across all chromosomal linkage groups. The aims were to understand the genetic diversity and population structure of these germplasm resources, thereby providing a theoretical basis for their effective use, conservation, and breeding of superior cultivars.
2. Materials and Methods
2.1. Plant Material
A total of 50 tea germplasm accessions collected from Nyingchi, Shannan, and Shigatse in Xizang were subjected to comprehensive phenotypic and genotypic characterization (Table 1 and Figure 1). These accessions represent genetic resources originally introduced for experimental cultivation between the 1950s and 1970s, and are now established across an elevational gradient ranging from 700 to 2600 m above sea level. For the purpose of this analysis, the collection sites were stratified into three ecological zones based on elevation: low altitude (L; <1500 m), medium altitude (M; 1500–2000 m), and high altitude (H; >2000 m). An additional set of 40 tea cultivars, originating from Hunan (HN; n = 10), Sichuan (SC; n = 10), Yunnan (YN; n = 10), and Anhui (AH; n = 10) provinces, was collected from the China National Germplasm Hangzhou Tea Repository for a comparative population structure analysis.

Table 1.
Collection sites and geographical coordinates of the 50 tea germplasm accessions.
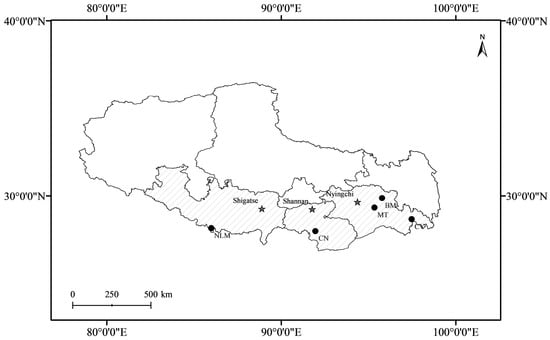
Figure 1.
Geographic distribution of tea germplasm accessions collected from five populations. Codes for the populations are given in Table 1.
2.2. Measurement of Phenotypic Traits
In this study, we systematically recorded quantitative traits, including plant height (PH), basal stem diameter (BSD; cm), leaf length (LL; cm), leaf width (LW; cm), and lamina area (LA; cm2), along with qualitative descriptions of leaf phenotype. The qualitative traits included mature leaf color (LC; 1 = green, 2 = purple), immature leaf color (ILC; 1 = whitish, 2 = light green, 3 = medium green, 4 = dark green, 5 = yellow green, 6 = purple green, 7 = purple, 8 = brown, 9 = dark brown), leaf shape (LS; 1 = very narrow elliptic, 2 = narrow elliptic, 3 = medium elliptic, 4 = broad elliptic), and leaf shape in cross section (LSCS; 1 = folded upwards, 2 = flat, 3 = recurved). All traits were assessed according to the standardized descriptors established by the International Plant Genetic Resources Institute (IPGRI) [23] and the International Union for the Protection of New Varieties of Plants (UPOV) [24].
2.3. DNA Extraction
During field collection, fresh leaf tissues from the apical meristems of each sampled tree were immediately flash-frozen in liquid nitrogen, maintained in liquid nitrogen during transport, and subsequently cryopreserved at −80 °C pending nucleic acid isolation. Genomic DNA was extracted from the preserved tissues using the DP360 Plant Genomic DNA Kit (TIANGEN Biotech, Beijing, China) following the manufacturer’s specifications. The resulting DNA aliquots were stored at −20 °C for downstream applications. The integrity and purity of the extracted DNA were assessed. Integrity was verified via 0.8% agarose gel electrophoresis (120 V for 45 min), while concentration and purity were quantified using a NanoDrop™ 2000 spectrophotometer (Thermo Scientific, Waltham, MA, USA). Samples selected for further analysis were required to exhibit A260/A280 ratios between 1.8 and 2.0 and A260/A230 ratios greater than 2.0.
2.4. Primers
A total of 30 core SSR primer pairs selected from previously published literature [25] were uniformly distributed across 15 linkage groups. These markers were originally developed based on the tea plant transcriptome sequences. All primer sequences utilized in this study were commercially synthesized by Hangzhou Cred Technology (Hangzhou, China). Detailed information regarding these primers, including primer names, and sequences is listed in Supplementary Table S1.
2.5. Genotyping with SSR Marker
Polymerase chain reaction (PCR) amplifications were performed in duplicate for each genotype. Each reaction was conducted in a 25 µL volume containing 1 μL of template DNA, 1 μL each of the forward and reverse primers (10 μmol∙L−1), 12.5 μL of KAPA 2G Robust Mix, and 9.5 μL of sterile, nuclease-free water. The thermal cycling conditions were as follows: an initial denaturation at 94 °C for 4 min; followed by 35 cycles of denaturation at 94 °C for 30 s, annealing at 58 °C for 30 s, and extension at 72 °C for 30 s; and a final extension at 72 °C for 7 min. The resulting PCR amplicons were commercially sequenced by Hangzhou Cred Technology (Hangzhou, China) using an ABI 3730 DNA analyzer (Applied Biosystems, Carlsbad, CA, USA).
2.6. Data Analysis
All descriptive statistical analyses were performed using SPSS software (Statistical Package for the Social Sciences, v26.0, IBM Corp., Armonk, NY, USA). The value was calculated for each trait, population, and altitudinal class following the methodology described by Wu et al. [26]. Principal component analysis (PCA) was performed using the R package ‘ggfortify (version: 0.4.19)’ [27].
To evaluate the resolving power of the 30 SSR markers, a genotype accumulation curve was plotted using the genotype curve function of the ‘pegas (version: 1.4)’ R package [28]. The number of observed alleles (Na), number of efficient alleles (Ne), observed heterozygosity (Ho), expected heterozygosity (He), genetic differentiation index (Fst), Shannon’s diversity index (I), fixation index (F), percentage of polymorphic loci (PPL), and analysis of molecular variance (AMOVA) were determined using GenAlEx 6.5. The inbreeding coefficient of an individual relative to the subpopulation (Fis), the inbreeding coefficient of an individual relative to the total population (Fit), gene flow (Nm), and polymorphic information content (PIC) were calculated using Cervus 3.0 software [29]. Pairwise genetic distances were calculated using Nei’s standard genetic distance formula [30]. A phylogenetic tree was reconstructed using MEGA 7 [31] and subsequently annotated and visually refined using the Interactive Tree of Life (iTOL, (https://itol.embl.de/) online platform [32] to enhance the graphical presentation.
Population structure was investigated using the Bayesian model-based clustering algorithm implemented in STRUCTURE v2.3.4 [33]. The analysis was run assuming an admixture model with correlated allele frequencies to infer the optimal number of genetic clusters (K), with a burn-in period of 10,000 iterations followed by 150,000 Markov Chain Monte Carlo (MCMC) iterations. Ten independent runs were conducted for each potential K value (from 1 to 5). The most probable value of K was selected by the ΔK methodology using the StructureSelector (https://lmme.ac.cn/StructureSelector/, accessed on 25 December 2025) web tool [34]. To complement the STRUCTURE analysis, a Discriminant Analysis of Principal Components (DAPC) was performed to assess genetic clustering in relation to predefined populations and altitudinal groups using the ‘adegenet (version: 2.1.11)’ R package [35]. Finally, the admixture structure was visualized in a geographic context using the ‘mapmixture (version: 1.2.0)’ R package [36].
3. Results
3.1. Phenotypical Diversity
3.1.1. Variation of Phenotypic Traits Among 50 Tea Accessions
Descriptive statistics for the nine phenotypic traits measured across the 50 tea accessions are summarized in Table 2. The mean values for the quantitative traits were as follows: plant height (PH), 4.16 m; basal stem diameter (BSD), 5.41 cm; leaf length (LL), 10.40 cm; leaf width (LW), 4.15 cm; and lamina area (LA), 30.86 cm2. The average scores for the categorical traits were 4.84 for mature leaf color (LC), 5.48 for immature leaf color (ILC), 2.20 for leaf shape (LS), and 1.54 for leaf shape in cross-section (LSCS). Among the traits evaluated, basal stem diameter exhibited the highest coefficient of variation (CV = 47.80%), followed by leaf shape in cross-section (CV = 43.92%).
Table 2.
Descriptive statistics for nine phenotypic traits in 50 tea accessions.
3.1.2. Shannon Diversity Index
This analysis revealed moderate phenotypic variability across nine phenotypic traits, as evidenced by a mean Shannon diversity index (H′) of 1.29 (Table 3). Population-level analyses demonstrated intermediate H′ values for all examined traits except NLM, with leaf color (LC) exhibiting the lowest diversity indices in most populations. The H′ for PH, BSD, LL, LW, and LA in all populations was middle. Phenotypical traits also varied from one altitudinal class to another. Mid-altitude populations and high-altitude populations both demonstrated moderate levels of genetic diversity.
Table 3.
Shannon diversity index (H′) of phenotypic traits across populations and altitudinal categories in 50 tea accessions.
3.1.3. Principal Component Analysis (PCA)
Principal component analysis (PCA) is a multivariate statistical technique used for dimensionality reduction that identifies orthogonal axes of maximum variance within a dataset by analyzing the covariance structure among variables. This method provides a systematic framework for interpreting latent patterns of phenotypic variation and quantifying interdependencies among variables through eigenvalue decomposition. As a technique widely applied in genetic resource research, PCA facilitates the elucidation of population structure, the optimization of trait selection through feature extraction, and the overall characterization of germplasm. In the present study, PCA was conducted on the nine phenotypic traits measured across the 50 tea accessions to identify the primary drivers of phenotypic variability. The first two principal components (PCs), PC1 and PC2, collectively accounted for 54.49% of the total phenotypic variance, with PC1 contributing 34.04% and PC2 contributing 20.45%. Analysis of the component loadings indicated that PC1 was primarily associated with leaf characteristics, exhibiting high positive loadings for mature leaf color (LC), leaf shape (LS), leaf width (LW), lamina area (LA), and leaf length (LL). In contrast, PC2 primarily reflected traits related to plant architecture, with significant positive loadings for basal stem diameter (BSD), plant height (PH), leaf shape in cross-section (LSCS), and immature leaf color (ILC) (Figure 2).
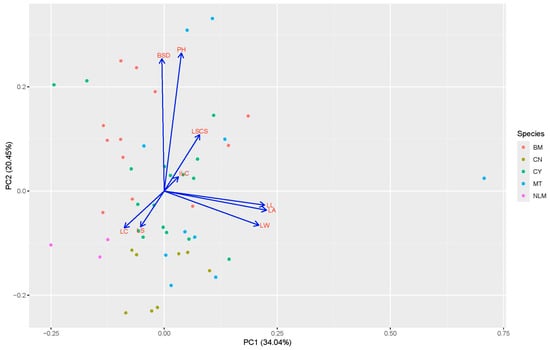
Figure 2.
PCA-based analysis for 50 tea accessions with their contribution value based on nine phenotypic traits.
3.2. SSR Diversity
3.2.1. Level of Polymorphism of the SSR Markers
The 30 SSR markers utilized in this study proved to be highly informative for genotyping the 50 tea accessions. Analysis of the polymorphism parameters revealed a high degree of genetic variation among the accessions. The polymorphic information content (PIC), a measure of locus informativeness, ranged from 0.213 (TM585) to 0.937 (MSE0191), with a mean value of 0.614 across all loci (Table 4). All markers were highly polymorphic, with a total of 274 alleles detected across the 30 loci. The Shannon diversity index (I) ranged from 0.516 (TM585) to 3.053 (MSE0191), with a mean of 1.437, further indicating substantial genetic diversity at the loci examined. Notably, locus MSE0191 was the most informative marker, exhibiting the highest values for several key parameters: number of alleles (Na = 30.000), number of effective alleles (Ne = 16.667), heterozygosity indices (Ho = 0.922, He = 0.940), gene flow (Nm = 3.733), and polymorphic information content (PIC = 0.937). Furthermore, a genotype accumulation curve analysis demonstrated that a minimum of five markers was sufficient to reliably differentiate the genetic profiles of all 50 tea accessions (Figure 3).
Table 4.
Diversity indices of 30 SSR markers across five populations.
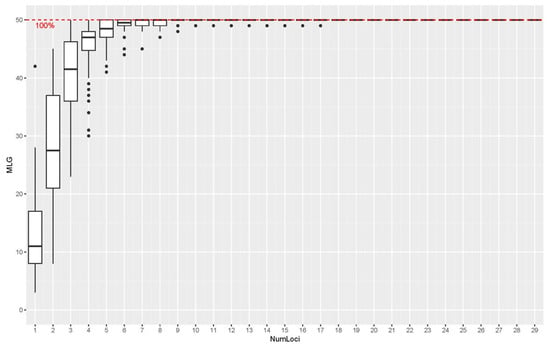
Figure 3.
Genotype accumulation curves for 50 tea accessions. Notes: The dots represent the number of multilocus genotypes identified for each number of loci, and the horizontal dashed line indicates the 100% threshold where all 50 tea accessions are successfully distinguished.
3.2.2. Level of Polymorphism of the Five Population
Analysis of genetic diversity indices revealed substantial variation across the studied populations. The number of observed alleles (Na) ranged from 2.000 (NLM) to 6.033 (CY), with a mean of 4.580. The number of effective alleles (Ne) ranged from 1.901 (NLM) to 3.610 (BM), with a mean of 3.069. Shannon’s information index (I) values ranged from 0.554 (NLM) to 1.317 (BM), with a mean of 1.101. Observed heterozygosity (Ho) ranged from 0.500 (NLM) to 0.750 (BM) (mean = 0.654), whereas expected heterozygosity (He) ranged from 0.361 (NLM) to 0.640 (CY) (mean = 0.566). The fixation index (F) values ranged from −0.359 (NLM) to −0.021 (MT), with a mean of −0.143. The percentage of polymorphic loci (PPL) ranged from 70% (NLM) to 100%, with a mean of 93% across all populations (Table 5).
Table 5.
Descriptive statistics for nine agronomic traits in 50 tea accessions.
3.2.3. Analysis of Molecular Variance (AMOVA)
The analysis revealed that 8.15% of the total genetic variation was attributable to differences among populations (p ≤ 0.001), whereas differences among altitudinal classes accounted for only 2.14% of the variation (p = 0.016). In contrast, the majority of genetic variation was partitioned within populations (91.49%) and within altitudinal classes (97.86%). This spatial genetic structure coincided with significant population differentiation (Fst = 0.0815) and substantial inter-population gene flow (Nm = 2.686). Notably, gene flow across altitudinal gradients was particularly high (Nm = 11.433). This corresponds with the weak, albeit statistically significant, genetic differentiation observed among elevation gradients (Fst = 0.021) despite formal statistical thresholds (Table 6).
Table 6.
AMOVA-based partitioning of genetic variation within and among populations and altitudinal classes.
3.2.4. Cluster Analysis
To elucidate the phylogeographic origins and phylogenetic relationships of the Tibetan tea germplasm, we conducted a phylogenetic analysis that included 40 accessions from the major tea-producing provinces of Sichuan (SC), Hunan (HN), Anhui (AH), and Yunnan (YN), together with the 50 Tibetan tea accessions from this study. The resulting Neighbor-Joining (NJ) phylogenetic tree revealed that all 50 Tibetan tea accessions clustered into a distinct monophyletic clade (Figure 4). Within this Tibetan clade, however, the topological structure was largely unresolved, with individuals from the same collection sites not forming distinct, cohesive subclades. Instead, accessions from geographically distant Tibetan locations were intermingled throughout the clade, suggesting a complex history of admixture. This lack of clear phylogeographic structure provides strong evidence for a heterogeneous genetic background among the Tibetan tea populations.
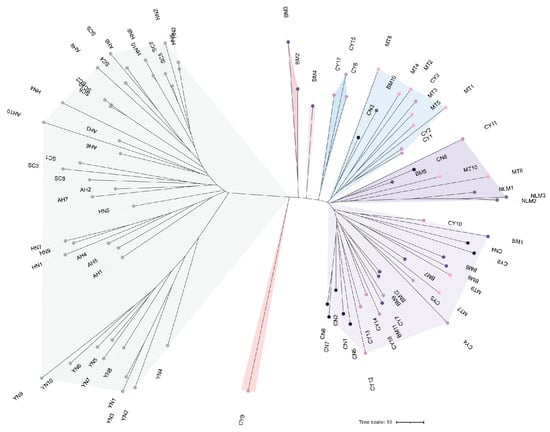
Figure 4.
Neighbor-joining phylogenetic tree analysis.
3.2.5. Discriminant Analysis of Principal Components (DAPC)
The Discriminant Analysis of Principal Components (DAPC), when based on predefined populations, showed a clear separation of the NLM population from the MT, BM, CY, and CN populations (Figure 5A). The clustering of individuals based on group membership probabilities further supported this pattern, clearly differentiating the NLM population from a second group comprising the MT, BM, CY, and CN populations (Figure 5B). Within this second major group, the DAPC plot indicated a closer genetic relationship between the BM population and the CY and CN populations, suggesting a higher degree of allele sharing. When analyzed by altitudinal zones, the DAPC showed that the low-altitude population formed a more genetically distinct cluster compared to the medium- and high-altitude populations (Figure 5C). Furthermore, the medium- and high-altitude populations clustered more closely together, indicating greater genetic similarity between them than either shared with the low-altitude population (Figure 5D).
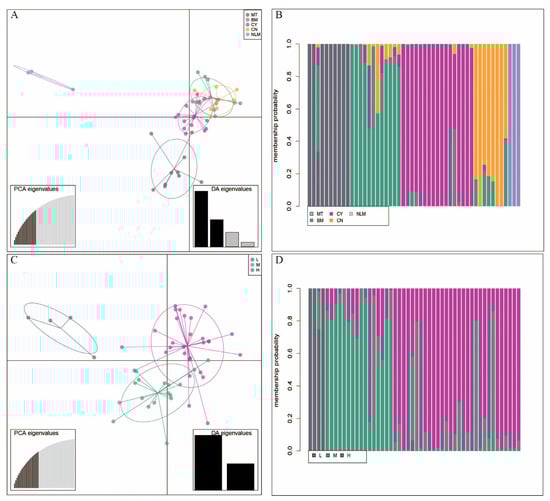
Figure 5.
Genetic structure of the fifty tea accession genotypes studied by discriminant analysis of principal components (DAPC). (A) DAPC scatterplot for MT, BM, CY, CN, and NLM populations. (B) Group membership probability analysis for 5 populations. (C) DAPC scatterplot for L, M, and H altitudes. (D) Group membership probability analysis for 3 altitudes.
3.2.6. Population Structure
To elucidate the population genetic architecture of Tibetan tea plant germplasm, we performed a Bayesian clustering analysis using STRUCTURE software (version: 2.3.4), which determined K = 2 as the optimal population subdivision (ΔK = 34.79), with K = 4 identified as a secondary clustering solution (ΔK = 1.27) through cross-validation of likelihood distributions (Figure 6A). This primary partitioning revealed two distinct gene pools that constitute the underlying genetic structure of the sampled tea plant accessions (Figure 6D). The STRUCTURE bar plot for K = 2 indicated that most individuals were admixed, exhibiting ancestry from both genetic clusters. The degree of admixture varied considerably among populations, with the MT, BM, and CY populations displaying particularly high levels (Figure 6D,E). When the inferred ancestry proportions were mapped geographically, no clear spatial pattern corresponding to the two genetic clusters was observed, further suggesting extensive gene flow among the locations (Figure 6B,C).
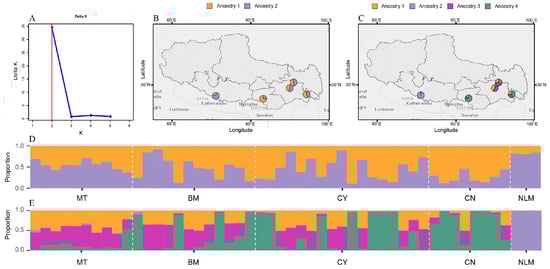
Figure 6.
Genetic structure of the fifty genotypes of tea plants. (A) STRUCTURE analysis determined K = 2 as the optimal population subdivision, with K = 4 identified as a secondary clustering solution. (B) The admixture structure of five populations in geographic space for K = 2. (C) The admixture structure of four populations in geographic space for K = 4. (D,E) The genetic structure of the 50 analyzed tea plant genotypes, identified by the STRUCTURE algorithm at K = 2 and K = 4.
4. Discussion
4.1. Genetic Diversity of Tibetan Tea Germplasm
Genetic diversity is the foundation of a species’ ability to adapt to environmental changes and serves as a primary resource for genetic improvement [9]. Consequently, the systematic collection, identification, and genetic diversity assessment of tea germplasm are pivotal for its effective conservation and utilization [7]. In this study, the 50 Tibetan tea accessions exhibited a high level of genetic diversity. The mean Shannon’s information index (H′) was 1.29 for phenotypic traits and 1.01 based on SSR marker analysis. These diversity estimates are comparable to or exceed those reported in other tea germplasm collections. For instance, regarding phenotypic traits, average I values of 1.02, 0.97, and 0.67 were documented in Shiqian Taicha [37], Henan Local Tea Germplasm Resources [38], and populations from Guizhou Province [39], respectively. In terms of molecular markers, indices of 0.640, 1.02, 0.898, and 0.932 have been reported for collections in China [10], Russian [14], Sri Lanka, and India [12]. The high genetic diversity observed in the Tibetan population can be largely attributed to its unique introduction history. Unlike modern tea plantations that rely on clonal propagation, the Tibetan tea germplasm was established through the introduction from four provinces in mainland China between the 1950s and the 1970s.
The mean observed heterozygosity (Ho = 0.654) exceeded the expected heterozygosity (He = 0.566), resulting a negative fixation index (F = −0.143), which indicates a substantial excess of heterozygotes. This pattern aligns with the reproductive biology of tea as a self-incompatible, cross-pollinating species, in which seed propagation preserves high levels of heterozygosity and allelic richness. Notably, the mean of Ho and He values in this study exceeded those reported in numerous previous investigations [40,41,42]. This elevated diversity is likely attributed to the use of seed-propagated accessions originating from diverse genetic backgrounds. Consequently, these Tibetan tea populations have retained the rich genetic basis of their progenitors, representing a valuable gene pool for the genetic improvement of tea.
4.2. Genetic Differentiation and Population Structure Analysis
Elucidating genetic differentiation and population structure is a prerequisite for effective conservation [43]. The Analysis of Molecular Variance (AMOVA) revealed that most of the genetic variation (91.49%) resided within populations, whereas only 8.51% was attributed to differentiation among populations. This partitioning pattern is highly congruent with previous studies on tea [44,45,46] and other cross-pollinated woody perennials [47,48], where intra-population variation typically dominates due to self-incompatibility and long-life cycles. Despite the fact that DAPC and STRUCTURE analysis (K = 2) identified two potential genetic clusters, the geographic mapping (Figure 6) and the neighbor-joining (NJ) tree (Figure 4) revealed a highly intermingled distribution pattern, consistent with the low genetic differentiation (Fst = 0.085) observed among the five Tibetan populations. Unlike natural populations that often show strict isolation by distance [10,49], the Tibetan accessions did not cluster according to their collection sites. This lack of geographic substructure is strongly corroborated by historical records. Chronicles document that approximately 80,000 kg of tea seeds were introduced from four provinces in mainland China—Sichuan, Hunan, Yunnan, and Anhui—between the 1950s and the 1970s. These seeds were pooled and systematically distributed from a centralized hub in Pai Township, Nyingchi City, effectively homogenizing the genetic background across different sites. Consequently, the current genetic structure is likely a result of human-mediated introduction rather than natural geographic isolation. The extensive gene flow (Nm = 2.686) observed in this study further corroborates that these populations share a common, highly admixed ancestry, rather than representing distinct, locally evolved landraces.
4.3. Phylogenetic Relationships and Breeding Implications
Despite the weak internal substructure, the Neighbor-Joining (NJ) tree analysis revealed that the Tibetan accessions formed a distinct genetic cluster, sharply differentiated from reference cultivars originating from mainland provinces. This pattern of geographic divergence mirrors findings in other regionally acclimatized tea populations, such as those in the marginal growing regions of Russia [14], where geographic isolation and local environmental screening significantly shape genetic architecture. This implies that the Tibetan germplasm has undergone substantial genetic differentiation from its progenitors driven by genetic drift and local adaptation.
The initial introduction of seeds likely constituted a founder event; however, unlike typical bottlenecks that drastically reduce diversity in clonally propagated crops [50], this introduction involved a pooled composite gene pool derived from four major Chinese tea-producing provinces. Consequently, the high genetic diversity maintained within these populations aligns with reports on other sexually propagated landraces, such as the Camellia sinensis populations in Yunnan province [51]. This suggests that the combination of a diverse genetic basis and sexual re-production has effectively mitigated the loss of allelic richness. Over the past 50 years, this unique anthropogenic admixture, coupled with putative natural selection imposed by the high-altitude environment, has driven the population to evolve into a zone of extensive secondary admixture. Such evolutionary breeding under natural pressure is likely to facilitate substantial allele frequency shifts adaptive to specific eco-geographic constraints [52].
The substantial phenotypic and genotypic diversity maintained within these populations challenges the conventional concern of genetic erosion associated with introduced crops. Furthermore, as a reservoir of alleles recombined under environmental stress, these populations are likely to harbor novel allelic combinations conferring tolerance to cold, drought, and high UV radiation, which are critical for sustaining agroecological resilience in indigenous communities amidst climate volatility. Ultimately, the observed high heterozygosity positions this germplasm as a critical genetic resource for not only mining adaptive alleles but also exploiting heterosis to develop novel tea cultivars with enhanced environmental resilience.
Supplementary Materials
The following supporting information can be downloaded at: https://www.mdpi.com/article/10.3390/horticulturae12010050/s1. Table S1. SSR Primers.
Author Contributions
Conceptualization, J.M., D.H. and X.C.; methodology, K.W. and L.J.; software, Y.M. and L.J.; formal analysis, H.W., R.T. and Y.L. (Ying Long).; investigation, J.M., H.P., X.Y., O.T. and W.T.; resources, W.W.; data curation, X.Y.; writing—original draft preparation, J.M.; writing—review and editing, D.H., L.C. and X.C.; supervision, L.C.; project administration, Y.L. (Yang Leng); funding acquisition, L.C., X.C. and Y.L. (Yang Leng). All authors have read and agreed to the published version of the manuscript.
Funding
This research was funded by the National Key Research and Development Program of China (2021YFD1601100), the Linzhi City Key Research and Development Plan (QYCX2024-01), and the Natural Science Foundation of Xizang Autonomous Region of China: XZ202401ZR0082; Xizang Autonomous Region Budgetary Project: 2025 Agricultural and Animal Husbandry Science and Technology Innovation Program: 323001.
Data Availability Statement
The original contributions presented in this study are included in the article/Supplementary Material. Further inquiries can be directed to the corresponding authors.
Acknowledgments
The authors wish to thank the Motuo County Bureau of Agriculture and Rural Affairs, Bomi County Bureau of Agriculture and Rural Affairs, Chayu County Bureau of Agriculture and Rural Affairs.
Conflicts of Interest
The author declares no conflicts of interest.
References
- Ma, J.Q.; Kamunya, S.M.; Yamaguchi, S.; Ranatunga, M.A.; Chen, L. Classic genetics and traditional breeding of tea plant. In The Tea Plant Genome; Springer: Singapore, 2024; pp. 79–120. [Google Scholar]
- Chen, Z. Roads, riding stables, and highland barley: Livelihood diversification as climate change adaptation among Tibetans in Shangri-La, China. In Routledge Handbook of Climate Change Impacts on Indigenous Peoples and Local Communities; Routledge: Abingdon, UK, 2023; pp. 336–347. [Google Scholar]
- Sina, B. Exploring the Symbolic and Socio-Cultural Meanings of Yak Butter Tea in Tibet. Master’s Thesis, Auckland University of Technology, Auckland, New Zealand, 2019. [Google Scholar]
- Zhiyang, L. The Spread and Changes of Tea and Tea Drinking Customs in Minority Areas of North and the Tibetan Plateau in China. Int. J. Bus. Anthropol. 2024, 14, 64–79. [Google Scholar]
- Xingang, C. Investigation and Analysis of the Development of Tea-Horse Trade between the Hans and Tibetans During the Period of Early Tang and Late Qing Dynasties. Acad. J. Humanit. Soc. Sci. 2022, 5, 112–118. [Google Scholar] [CrossRef]
- Haitao, L. The strategic significance of the ancient tea horse road from the perspective of history. In Proceedings of the IConSES 2021, Chicago, IL, USA, 21–24 October 2021; pp. 170–177. [Google Scholar]
- Salgotra, R.K.; Chauhan, B.S. Genetic diversity, conservation, and utilization of plant genetic resources. Genes 2023, 14, 174. [Google Scholar] [CrossRef]
- Swarup, S.; Cargill, E.J.; Crosby, K.; Flagel, L.; Kniskern, J.; Glenn, K.C. Genetic diversity is indispensable for plant breeding to improve crops. Crop Sci. 2021, 61, 839–852. [Google Scholar] [CrossRef]
- Govindaraj, M.; Vetriventhan, M.; Srinivasan, M. Importance of genetic diversity assessment in crop plants and its recent advances: An overview of its analytical perspectives. Genet. Res. Int. 2015, 1, 431487. [Google Scholar] [CrossRef]
- Yao, M.Z.; Ma, C.L.; Qiao, T.T.; Jin, J.Q.; Chen, L. Diversity distribution and population structure of tea germplasms in China revealed by EST-SSR markers. Tree Genet. Genomes 2012, 8, 205–220. [Google Scholar] [CrossRef]
- He, Z.; Liu, C.; Wang, X.; Wang, R.; Chen, Y.; Tian, Y. Assessment of genetic diversity in Camellia oleifera Abel. accessions using morphological traits and simple sequence repeat (SSR) markers. Breed. Sci. 2020, 70, 586–593. [Google Scholar] [CrossRef]
- Kottawa-Arachchi, J.D.; Ranatunga, M.A.; Sharma, R.K.; Chaudhary, H.; Attanayake, R.N.; Amarakoon, A.; Gunasekare, M.K.; Sharma, B.; Kumar, N.; Sood, V. Morpho-molecular genetic diversity and population structure analysis to enrich core collections in tea [Camellia sinensis (L) O. Kuntze] germplasm of Sri Lanka and India. Genet. Resour. Crop Evol. 2024, 71, 2597–2616. [Google Scholar] [CrossRef]
- Clarke, C.; Richter, B.S.; Rathinasabapathi, B. Genetic and morphological characterization of United States tea (Camellia sinensis): Insights into crop history, breeding strategies, and regional adaptability. Front. Plant Sci. 2023, 14, 1149682. [Google Scholar] [CrossRef]
- Samarina, L.S.; Matskiv, A.O.; Shkhalakhova, R.M.; Koninskaya, N.G.; Hanke, M.-V.; Flachowsky, H.; Shumeev, A.N.; Manakhova, K.A.; Malyukova, L.S.; Liu, S.; et al. Genetic diversity and genome size variability in the Russian genebank collection of tea plant [Camellia sinensis (L). O. Kuntze]. Front. Plant Sci. 2022, 12, 800141. [Google Scholar] [CrossRef] [PubMed]
- Zaman, F.; Zhang, E.; Xia, L.; Deng, X.; Ilyas, M.; Ali, A.; Guo, F.; Wang, P.; Wang, M.; Wang, Y.; et al. Natural variation of main biochemical components, morphological and yield traits among a panel of 87 tea [Camellia sinensis (L.) O. Kuntze] cultivars. Hortic. Plant J. 2023, 9, 563–576. [Google Scholar] [CrossRef]
- Chen, J.; Wang, P.; Xia, Y.; Xu, M.; Pei, S. Genetic diversity and differentiation of Camellia sinensis L. (cultivated tea) and its wild relatives in Yunnan province of China, revealed by morphology, biochemistry and allozyme studies. Genet. Resour. Crop Evol. 2005, 52, 41–52. [Google Scholar] [CrossRef]
- Kalendar, R.; Glazko, V.I. Types of molecular-genetic markers and their application. Physiol. Biochem. Cultiv. Plants 2002, 34, 279–296. [Google Scholar]
- Bardakci, F. Random amplified polymorphic DNA (RAPD) markers. Turk. J. Biol. 2001, 25, 185–196. [Google Scholar]
- Osborn, A.M.; Moore, E.R.; Timmis, K.N. An evaluation of terminal-restriction fragment length polymorphism (T-RFLP) analysis for the study of microbial community structure and dynamics. Environ. Microbiol. 2000, 2, 39–50. [Google Scholar] [CrossRef]
- Ellegren, H. Microsatellites: Simple sequences with complex evolution. Nat. Rev. Genet. 2004, 5, 435–445. [Google Scholar] [CrossRef]
- Fang, W.; Cheng, H.; Duan, Y.; Jiang, X.; Li, X. Genetic diversity and relationship of clonal tea (Camellia sinensis) cultivars in China as revealed by SSR markers. Plant Syst. Evol. 2012, 298, 469–483. [Google Scholar] [CrossRef]
- Paux, E.; Sourdille, P.; Mackay, I.; Feuillet, C. Sequence-based marker development in wheat: Advances and applications to breeding. Biotechnol. Adv. 2012, 30, 1071–1088. [Google Scholar] [CrossRef]
- International Plant Genetic Resources Institute. Descriptors for Tea (Camellia Sinensis); Bioversity International: Rome, Italy, 1997.
- International Union for Protection of New Varieties of Plants. Descriptor List of UPOV for Tea; International Union for Protection of New Varieties of Plants: Geneva, Switzerland, 2022. [Google Scholar]
- Ma, J.Q.; Yao, M.Z.; Ma, C.L.; Wang, X.C.; Jin, J.Q.; Wang, X.M.; Chen, L. Construction of a SSR-based genetic map and identification of QTLs for catechins content in tea plant (Camellia sinensis). PLoS ONE 2014, 9, e93131. [Google Scholar] [CrossRef] [PubMed]
- Wu, S.M.; Li, T.Q.; Yang, W.K.; Liu, Q.; Gao, J.Y. Ancient tea gardens play important role on in situ conservation of epiphytic orchids in southwest Yunnan, China. Glob. Ecol. Conserv. 2024, 49, e02778. [Google Scholar] [CrossRef]
- Yuan, Y.; Horikoshi, M.; Li, W. ggfortify: Unified interface to visualize statistical results of popular R packages. R J. 2016, 8, 474–485. [Google Scholar] [CrossRef]
- Paradis, E. pegas: An R package for population genetics with an integrated-modular approach. Bioinformatics 2010, 26, 419–420. [Google Scholar] [CrossRef]
- Marshall, T.C. Statistical confidence for likelihood-based paternity inference in natural populations. Mol. Ecol. 1998, 7, 639–655. [Google Scholar] [CrossRef]
- Nei, M.; Li, W.H. Mathematical model for studying genetic variation in terms of restriction endonucleases. Proc. Natl. Acad. Sci. USA 1979, 76, 5269–5273. [Google Scholar] [CrossRef] [PubMed]
- Sudhir, K.; Glen, S.; Koichiro, T. MEGA7: Molecular Evolutionary Genetics Analysis Version 7.0 for Bigger Datasets. Mol. Biol. Evol. 2016, 33, 1870–1874. [Google Scholar] [PubMed]
- Letunic, I.; Bork, P. Interactive Tree Of Life (iTOL): An online tool for phylogenetic tree display and annotation. Bioinformatics 2007, 23, 127–128. [Google Scholar] [CrossRef] [PubMed]
- Pritchard, J.K.; Stephens, M.; Donnelly, P. Inference of population structure using multilocus genotype data. Genetics 2000, 155, 945–959. [Google Scholar] [CrossRef]
- Li, Y.L.; Liu, J.X. StructureSelector: A web-based software to select and visualize the optimal number of clusters using multiple methods. Mol. Ecol. Resour. 2018, 18, 176–177. [Google Scholar] [CrossRef]
- Jombart, T. adegenet: A R package for the multivariate analysis of genetic markers. Bioinformatics 2008, 24, 1403–1405. [Google Scholar] [CrossRef]
- Xia, E.H.; Tong, W.; Wu, Q.; Wei, S.; Zhao, J.; Zhang, Z.Z.; Wei, C.L.; Wan, X.C. Tea plant genomics: Achievements, challenges and perspectives. Hortic. Res. 2020, 7, 1–19. [Google Scholar] [CrossRef]
- Lin, K.; Wang, A.; Li, Y.; Li, L.; Wei, J.; Zhou, F.; Zhao, D.; Yan, D. Exploring Genetic Variation and Trait Correlations in ‘Shiqian Taicha’Tea Based on Comprehensive Analyses of Morphological and Biochemical Diversity. Horticulturae 2024, 10, 1128. [Google Scholar] [CrossRef]
- Pan, Y.T.; Yuan, Z.F.; Yuan, H.Y.; Ban, Q.Y.; Jiang, C.J. Diversity analysis of phenotypic characteristics for Henan local tea germplasm resources. J. Xinyang Norm. Univ. (Nat. Sci. Ed. ) 2018, 31, 578–585. [Google Scholar]
- Xu, J.J.; Zhu, Y.Y.; Wang, W. Comprehensive Evaluation and Phenotypic Diversity Analysis of Camellia meiocarpa in Guizhou. J. Zhejiang For. Sci. Technol. 2021, 41, 15–23. [Google Scholar]
- Liu, C.G.; Yu, W.T.; Cai, C.P.; Huang, S.J.; Wu, H.H.; Wang, Z.H.; Wang, P.; Zheng, Y.C.; Wang, P.J.; Ye, N.X. Genetic diversity of tea plant (Camellia sinensis (L.) Kuntze) germplasm resources in Wuyi Mountain of China based on Single Nucleotide Polymorphism (SNP) markers. Horticulturae 2022, 8, 932. [Google Scholar] [CrossRef]
- Huang, F.F.; Duan, J.H.; Lei, Y.; Liu, Z.; Kang, Y.K.; Luo, Y.; Chen, Y.Y.; Li, Y.Y.; Liu, S.Q.; Li, S.J.; et al. Genetic diversity, population structure and core collection analysis of Hunan tea plant germplasm through genotyping-by-sequencing. Beverage Plant Res. 2022, 2, 5. [Google Scholar] [CrossRef]
- Ji, P.; Li, H.; Gao, L.Z.; Zhang, J.; Cheng, Z.; Huang, X. ISSR diversity and genetic differentiation of ancient tea (Camellia sinensis var. assamica) plantations from China: Implications for precious tea germplasm conservation. Pak. J. Bot. 2011, 43, 281–291. [Google Scholar]
- Younger, J.L.; Clucas, G.V.; Kao, D.; Rogers, A.D.; Gharbi, K.; Hart, T.; Miller, K.J. The challenges of detecting subtle population structure and its importance for the conservation of emperor penguins. Mol. Ecol. 2017, 26, 3883–3897. [Google Scholar] [CrossRef] [PubMed]
- Borthakur, D.; Wang, B.; Meinhardt, L.; Zhou, L.; Tan, H. Multiple distinctive lineages of Camellia sinensis var. assamica from India and China revealed by Single Nucleotide Polymorphism markers. Beverage Plant Res. 2025, 5, e026. [Google Scholar] [CrossRef]
- Liu, Y.; Yang, S.X.; Ji, P.Z.; Gao, L.Z. Phylogeography of Camellia taliensis (Theaceae) inferred from chloroplast and nuclear DNA: Insights into evolutionary history and conservation. BMC Evol. Biol. 2012, 12, 92. [Google Scholar] [CrossRef]
- Zhao, D.W.; Yang, J.B.; Yang, S.B.; Kato, K.; Luo, J.P. Genetic diversity and domestication origin of tea plant Camellia taliensis (Theaceae) as revealed by microsatellite markers. BMC Plant Biol. 2014, 14, 14. [Google Scholar] [CrossRef]
- Yi, M.; Hu, R.; Huang, W.D.; Chen, T.X.; Xie, W.L.; Xie, H.P.; Luo, X.; Lai, M. Genetic Diversity and Population Structure Analysis of Pinus elliottii Germplasm Resources in Jiangxi Province. Life 2024, 14, 1401. [Google Scholar] [CrossRef] [PubMed]
- Miao, Y.C.; Gao, C.J.; Li, J.; Liu, Z.R.; Cui, K. Genetic diversity, population structure and a core collection establishment of Pinus yunnanensis using microsatellite markers. Eur. J. For. Res. 2023, 142, 1439–1451. [Google Scholar] [CrossRef]
- Taniguchi, F.; Kimura, K.; Saba, T.; Ogino, A.; Yamaguchi, S.; Tanaka, J. Worldwide core collections of tea (Camellia sinensis) based on SSR markers. Tree Genet. Genomes 2014, 10, 1555–1565. [Google Scholar] [CrossRef]
- Khoury, C.K.; Brush, S.; Costich, D.E.; Curry, H.A.; De Haan, S.; Engels, J.M.; Guarino, L.; Hoban, S.; Mercer, K.L.; Miller, A.J. Crop genetic erosion: Understanding and responding to loss of crop diversity. New Phytol. 2022, 233, 84–118. [Google Scholar] [CrossRef]
- Li, M.M.; Meegahakumbura, M.K.; Wambulwa, M.C.; Burgess, K.S.; Möller, M.; Shen, Z.F.; Li, D.Z.; Gao, L.M. Genetic analyses of ancient tea trees provide insights into the breeding history and dissemination of Chinese Assam tea (Camellia sinensis var. assamica). Plant Divers. 2024, 46, 229–237. [Google Scholar] [CrossRef] [PubMed]
- Arnold, M.L.; Kunte, K. Adaptive genetic exchange: A tangled history of admixture and evolutionary innovation. Trends Ecol. Evol. 2017, 32, 601–611. [Google Scholar] [CrossRef] [PubMed]
Disclaimer/Publisher’s Note: The statements, opinions and data contained in all publications are solely those of the individual author(s) and contributor(s) and not of MDPI and/or the editor(s). MDPI and/or the editor(s) disclaim responsibility for any injury to people or property resulting from any ideas, methods, instructions or products referred to in the content. |
© 2025 by the authors. Licensee MDPI, Basel, Switzerland. This article is an open access article distributed under the terms and conditions of the Creative Commons Attribution (CC BY) license.