Article

Influence of Microencapsulation on Fermentative Behavior of Hanseniaspora osmophila in Wine Mixed Starter Fermentation

1
Scuola di Scienze Agrarie, Forestali, Alimentari ed Ambientali, Università degli Studi della Basilicata, Viale dell’Ateneo Lucano 10, 85100 Potenza, Italy
2
Department of Agricultural Sciences, University of Naples Federico II, Via Università 100, 80055 Portici, Italy
3
Grupo VIENAP, Instituto de Ciencias de la Vid y del Vino, CSIC, Gobierno de La Rioja, Universidad de La Rioja, Ctra. de Burgos Km. 6, 26007 Logroño, Spain
4
Dipartimento di Economia, Universitas Mercatorum, 00186 Roma, Italy
*
Authors to whom correspondence should be addressed.
Fermentation 2021, 7(3), 112; https://doi.org/10.3390/fermentation7030112
Submission received: 22 June 2021 / Revised: 9 July 2021 / Accepted: 9 July 2021 / Published: 13 July 2021
(This article belongs to the Special Issue New Insight and Current Trends in Oenological Microbiology)

Abstract

:
In recent years, as a consequence of the re-evaluation of the role of non-Saccharomyces yeasts, several studies have been conducted on the use of controlled mixed fermentations with Saccharomyces and different non-Saccharomyces yeast species from the winemaking environment. To benefit from the metabolic particularities of some non-Saccharomyces yeasts, the management of a non-Saccharomyces strain in mixed fermentation is a crucial step, in particular the use of procedures addressed to increase the persistence of non-Saccharomyces strains during the fermentative process. The use of microencapsulation for cell immobilization might represent a strategy for enhancing the competitiveness of non-Saccharomyces yeasts during mixed fermentation. This study was aimed to assess the fermentative performance of a mixed starter culture, composed by a wild Hanseniaspora osmophila strain (ND1) and a commercial Saccharomyces cerevisiae strain (EC1118). For this purpose, free and microencapsulated cells of ND1 strain were tested in co-culture with EC1118 during mixed fermentations in order to evaluate the effect of the microencapsulation on fermentative behavior of mixed starter and final wine composition. The data have shown that H. osmophila cell formulation affects the persistence of both ND1 and EC1118 strains during fermentations and microencapsulation resulted in a suitable system to increase the fermentative efficiency of ND1 strain during mixed starter fermentation.

Graphical Abstract

1. Introduction

Although Saccharomyces cerevisiae represents the main microorganism involved in the alcoholic fermentation of grape must, many other species of yeasts belonging to various non-Saccharomyces genera occur in grape juice and contribute to the fermentation and to the organoleptic characteristics of the final wine [1]. Although in the past these yeasts were considered as undesirable agents, in recent years the role of non-Saccharomyces yeasts has been revalued and several studies reported the use of controlled mixed fermentations with different indigenous non-Saccharomyces yeast species and Saccharomyces [2,3,4].
The use of non-Saccharomyces selected yeasts for winemaking is becoming a promising tool to improve the complexity and enhance specific characteristics of wine, satisfying winemakers’ requests for product differentiation. Therefore, the combined use of non-Saccharomyces and Saccharomyces yeasts represents a biotechnological tool to ensure the fermentation performance and, at the same time, to modify both the chemical and the aromatic composition of wines [5,6]. In fact, non-Saccharomyces yeasts, which are naturally present in un-inoculated spontaneous fermentations, can contribute to improving the final wine flavor due to their ability to produce favorable metabolites and the activity of certain enzymes that interact with the precursors of aromatic compounds [7,8], such as glycerol, 2-3 butanediol, polyols, alcohols, mannoproteins and esters [1,9]. A further application of non-Saccharomyces yeasts relies on the use of these yeasts for producing wine with reduced alcohol content [10,11]. In recent decades, climate changes have determined the production of grapes with high sugar content and consequently an increase of the alcohol content in wine, representing a healthy and economic problem [12]. A promising strategy for producing wine with reduced alcohol content, as alternative approaches focused on vineyard management and winemaking practices [13,14], take advantage of non-Saccharomyces wine yeasts, which metabolize sugar with low efficiency in ethanol conversion [15]. Different studies reported a reduction in ethanol concentration using different non-Saccharomyces species in co-cultures or in sequential inoculation with S. cerevisiae wine strain [16,17]. The various metabolic traits typical of the different non-Saccharomyces species, such as ethanol yield, fermentation efficiency, biomass production, by-product formation and respiro-fermentative metabolism, can be exploited to reduce the ethanol concentration in wine.
To benefit from the metabolic particularities of some non-Saccharomyces yeasts in mixed fermentation, the management of non-Saccharomyces strains in mixed fermentation is a crucial step. In particular, the use of a procedure aimed to increase the persistence of non-Saccharomyces strains during the fermentative process. One of the strategies proposed to increase the competitiveness of non-Saccharomyces yeasts during mixed fermentation is cell immobilization, which was also reported as an instrument to increase the expression of some metabolic activities [18,19]. Various techniques have been investigated for microbial cell immobilization, such as adsorption or attachment of cells to an inert substrate, self-aggregation by flocculation and entrapment or encapsulation using polymers [20,21]. In the microencapsulation technique, the polymeric matrix isolates the cells from the external environment and protects the microorganism from the principal stress agent, it is permeable to low weight molecular nutrient, metabolites and oxygen and maintains a hospitable internal condition. This structure protects the microbial cells from environmental stress, preserves some metabolic activities, enhances the production of secondary compounds and removes some odors [22,23].
In this study, the fermentative performance of a mixed starter culture, composed by a selected Hanseniaspora osmophila strain and a commercial S. cerevisiae strain was evaluated. The non-Saccharomyces strain was tested as free and microencapsulated cells, in order to evaluate the effect of the microencapsulation on the fermentative behavior of the mixed starter and chemical characteristics of the final wines.

2. Materials and Methods

2.1. Yeast Strains

The yeast strains tested in this study were H. osmophila ND1, belonging to the Yeast Collection of University of Basilicata (UBYC), and the commercial strain, S. cerevisiae EC1118, purchased from Lallemand Inc. (Toulose, France). The presumptive identification of the ND1 strain was performed by PCR amplification of the internal transcribed spacers between the 18S and 26S rDNA genes (ITS1-5.8S-ITS2) and subsequent restriction analysis, by following the protocol reported by Esteve-Zarzoso et al. [24]. The identification as H. osmophila was confirmed by sequencing of the ITS region, performed at Eurofins Genomics Srl (Vimodrone, Italy). The sequences were compared with those deposited in the GenBank database (National Center for Biotechnology Information, Bethesda, Maryland, USA) using the Basic Local Alignment Search Tool (BLAST).
The ND1 strain was selected on the basis of some desirable oenological criteria, such as the ability to tolerate high concentration of sugar and ethanol, very high β-glucosidase activity and good resistance to osmotic stress [25].
The yeast strains were stored at −20 °C in YPD broth (1% (w/v) yeast extract, 2% (w/v) peptone; 2% (w/v) glucose; Oxoid, Hampshire, UK) supplemented with 50% glycerol (Sigma, St. Louis, MO 63304, USA) as protective agent, until further analysis.

2.2. Biomass Production

S. cerevisiae (C) and H. osmophila (ND1) strains were refreshed on YPD plates and incubated at 26 °C for 24 h. A loopful of 24 h culture of each strain was inoculated in 300 mL of YPD broth and incubated at 26 °C for 24 h in a rotary shaker at 180 rpm. The biomass of each strain was produced by the BioFlo/CelliGen 110 bioreactor (Eppendorf, Hamburg, Germany) in a vessel containing 2 L of YPD liquid. The growth parameters used were: controlled temperature at 26 °C; stirring at 200 rpm; oxygen at 2 vvm. After overnight growth in the bioreactor, the yeast biomass was collected and centrifuged at 4700 rpm for 10 min. The recovered biomass was stored for limited times at 4 °C until use. For the ND1 strain, the biomass obtained was divided in two parts, one was used for the production of microencapsulated cells, whereas the other was used as inoculum for mixed fermentation.

2.3. Microencapsulation of ND1 Strain

The microencapsulation of ND1 strain was performed by using the Encapsulator B-395 Pro (BÜCHI, Flawil, Switzerland). A scheme of the BÜCHI Encapsulator is reported in De Prisco et al. [26]. Overnight yeast culture was centrifuged (4700 rpm for 10 min at 4 °C) and the solution to be encapsulated was prepared by suspending the cell pellet in 500 mL of 15 g/L alginic acid sodium salt (Sigma, Milan, Italy). The feeding solution was loaded in the syringe, forced into the pulsation chamber and finally extruded through the nozzle (80 µ) [27]. The microencapsulation conditions used were: flow rate 3.5 mL/min, vibration frequency 2500 Hz and electrode voltage of 950 V. Droplets containing yeast cells were hardened in 500 mL of a sterile 0.5 mol/L CaCl2 solution, continuously stirred at 300 rpm. After sedimentation (30 min at room temperature) and discarding of hardening solution, microcapsules were stored at 4 °C for further experiments.

2.4. Efficiency of Microencapsulation Process

According to De Prisco et al. [26] the microencapsulation efficiency was calculated by dividing the viable count of disrupted microcapsules by the cell load of the feeding solution. Microcapsules were disrupted by serially dilution in 0.5 mol/L citrate buffer solution pH 7.0 and viable counting of the yeast cells was performed on YPD Agar (YPD medium with addition of 7.5 g/L agar) at 26 °C for 24 h.

2.5. Mixed Inoculated Fermentations at Laboratory Scale with ND1 Strain in Different Formulations

The H. osmophila ND1 strain was tested in mixed fermentations with commercial S. cerevisiae strain EC1118. The H. osmophila strain was used in free (NF) and microencapsulated (NM) form, whereas the S. cerevisiae strain was used onlyin free form. Fermentation with free cells of S. cerevisiae(C) was used as control.
The fermentations were performed in natural grape must, Aglianico del Vulture, a red grape variety cultivated in Basilicata (Southern Italy). The main analytical parameters of the grape juice were the following: total acidity 5.37 g/L; pH 3.6; °TSS 22.2; density, 1.097 g/L; yeast assimilable nitrogen 211.9 mg N/L and malic acid 1.66 g/L.
The fermentations at laboratory scale were conducted in triplicate at 26 °C in 2 L of pasteurized (T = 90 °C; t = 20 min) grape must; the absence of viable cells in grape must before inoculation was checked by plate counting on Wallerstein Laboratory Nutrient Agar medium (WL, Oxoid, Hampshire, UK). The two yeast strains were simultaneously inoculated in the grape must, by using different inoculation ratio. In each mixed fermentation, S. cerevisiae strain was inoculated as free cells at concentration of 2 × 10³ cell/mL, whereas 2 × 10⁷ cells/mL of H. osmophila were inoculated as free and microencapsulated cells. In the control fermentation, S. cerevisiae strain was inoculated at 2 × 10⁷ cells/mL.
All the experiments were monitored until the end of fermentation by determination of weight loss due to CO2 production and sugar consumption. The fermentation process was stopped when weight and °Brix reductions were constant for three consecutive days.

2.6. Evaluation of Yeast Viable Population during the Fermentations

At different time intervals, a fermenting must aliquot was taken from each sample to analyze the evolution of the two inoculated species during the mixed fermentations by plate counting. The sample was diluted in saline solution, plated on WL Nutrient Agar (Oxoid, Hampshire, UK), a differential yeast growth medium in which H. osmophila (ND1) develops small and intense brilliant green colonies, whereas EC1118 strain grows as cream-green colonies. Furthermore, the H. osmophila population was also analyzed by using LA (Lysine agar, Oxoid, Hampshire, UK) medium, a substrate inhibiting S. cerevisiae growth.
In order to verify the integrity of microcapsules, aliquots of must during the fermentation were periodically sampled and observed under microscope. Furthermore, the total number of viable encapsulated cells during the fermentation process was also determined, by diluting the must sample 1:10 in citrate buffer solution (citric acid 0.2 M, sodium citrate 0.2 M, pH 4.3, Sigma, St. Louis, MO 63304, USA) to dissolve the alginate matrix and promote cell release.
After incubation at 26 °C for 5 d, the dilution plates statistically representative were counted; from each fermentation sample, around 30 colonies (showing the two different morphologies of the two inoculated strains) were randomly selected and purified on YPD for yeast identification, by restriction analysis of amplified ITS region [24].

2.7. Analytical Determination of Experimental Wines

The experimental wines obtained from fermentations were analyzed by a Fourier transfer infrared WineScan instrument (FOSS, Hillerød, Denmark) for determination of conventional chemical parameters, such as residual sugar concentration, ethanol content, total and volatile acidities and malic acid. Furthermore, the content of the main secondary compounds affecting wine aroma were analyzed by direct injection of 1 µL of sample into a glass column packed with 80/120 Carbopak B/5% Carbowax 20 M (Supelco, Sigma-Aldrich, Milano, Italy) by an Agilent 7890A gas-chromatograph, equipped with an integrated flame ionization detector (GC-FID), following the procedures previously described [28]. The secondary compounds detected were acetaldehyde, ethyl acetate, acetoin, n-propanol, isobutanol, 2-methyl-1-butanol and 3-methyl-1-butanol. Other volatile compounds, usually present in lower concentrations, such as 1-hexanol, methionol, isoamyl acetate, 2-phenylethyl acetate, ethyl hexanoate, ethyl lactate, ethyl octanoate and diethyl succinate, were identified by gas chromatographic analysis performed using a gas chromatograph (GC) 7890B with triple quadrupole mass detector (MS/MS) 7000C, following the protocol described by Rubio-Bretón et al. [29].

2.8. Influence of Acetic Acid Addition on S. cerevisiae EC1118 Fermentative Performance

The influence of acetic acid on commercial strain EC1118 was evaluated by determining the effect of acetic acid addition on fermentative performance of this strain.
The strain was grown overnight in YPD broth at 26 °C with agitation, and an aliquot of biomass containing about 1 × 10⁶ cells/mL, detected by measuring optical density at 600 nm, was used to inoculate 100 mL of Aglianico del Vulture grape must, thermally treated at 90 °C for 20 min.
Each microfermentation trial was carried out in duplicate under static conditions at 26 °C, for about 13 d. At different time intervals (C-0 h = at the beginning; C-48 = 48 h after inoculum and C-72 = 72 h after inoculum) 1.5 g/L of acetic acid (Sigma, St. Louis, MO 63304, USA) was supplemented.
The evolution of the fermentations was evaluated by measuring the sugar consumption daily with a bench-top refractometer. Fermentations were considered to be finished when the °Brix was constant for 2–3 consecutive days. At the end of the process, the experimental wines were analyzed for residual sugars by OenoFOSS and the acetic acid content by GC analysis, as described in Section 2.7.

2.9. Data Analysis

The experimental data were analyzed by one-way ANOVA and the homogeneity of variance was verified applying the Levene’s test.
In order to compare the main oenological parameters and the volatile compounds content in wines obtained by the mixed starters with S. cerevisiae EC1118 (C) and H. osmophila (ND1) as free (NF) and microencapsulated (NM) cells and single starter wine with EC1118 (C), the Tukey’s test was used. The differences were considered significant when the associated p-value was ≤0.05. Principal component analysis (PCA) was performed on all the parameters detected in the experimental wines.
Data regarding the volatile compounds of the experimental wines were analyzed by a heatmap, a method used to reduce the dimensionality of the data. The amount of each analyzed compound was converted to Z-scores, to easily visualize which starter is relevant aroma producers in relation to average production, which was calculated as follows: Z-score = (X − μ)/σ, where, for each parameter, X is the concentration, μ is the mean value and σ is the standard deviation among all the starters.
Paleontological Statistics Software (PAST) ver. 3.26 (Natural History Museum– University of Oslo, Norway) [30] was used for all statistical analyses.

3. Results

In order to evaluate the feasibility of using the H. osmophila ND1 strain as mixed starter culture for wine fermentation, we evaluated the fermentative behavior of this strain as free and microencapsulated cells (Figure 1) in co-culture with the commercial S. cerevisiae strain EC1118.

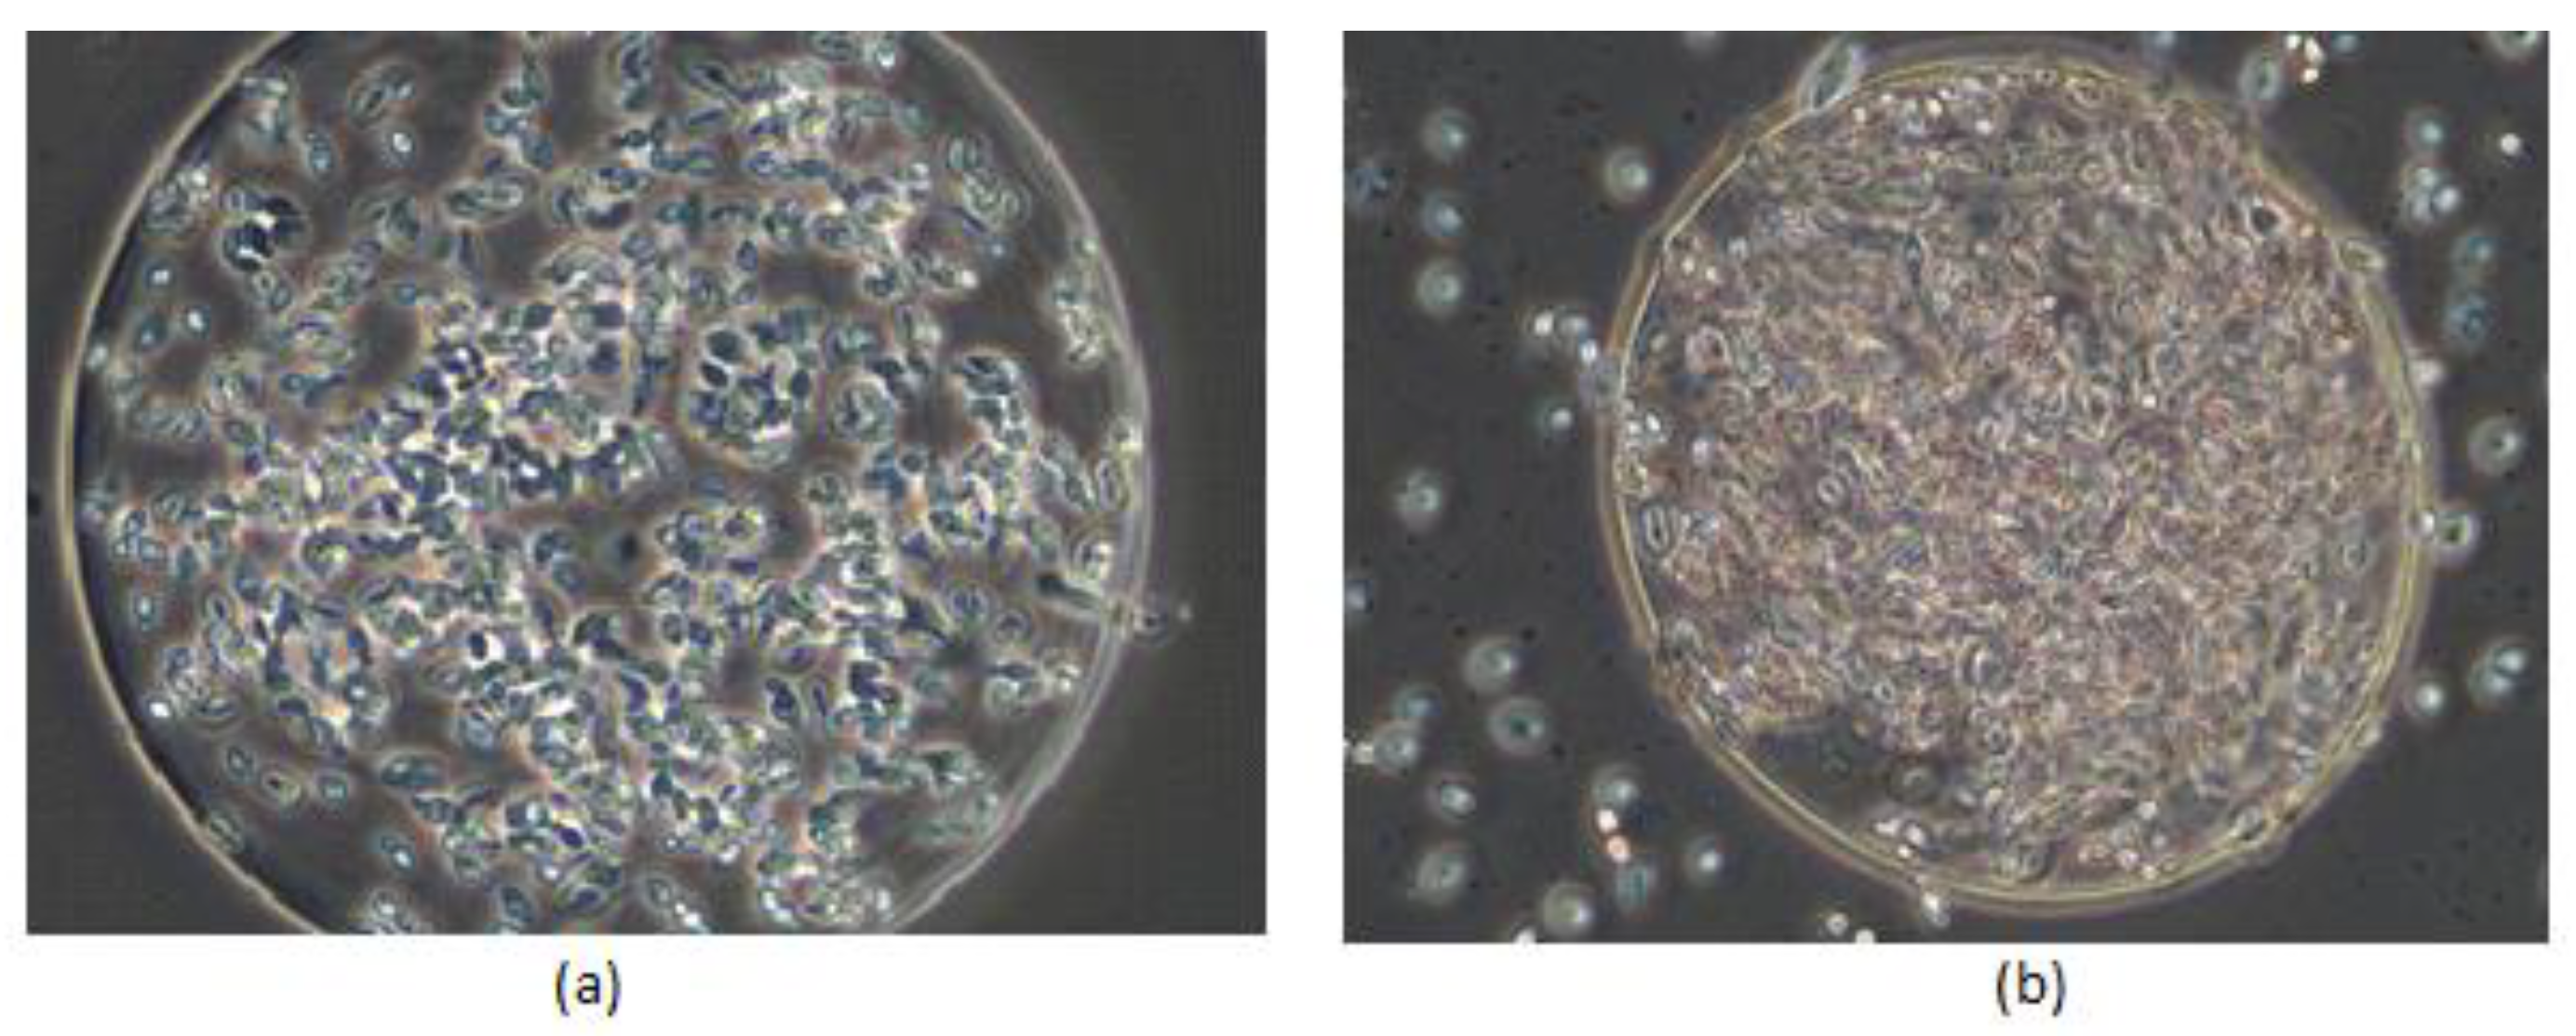
3.1. Efficiency of Microencapsulation Process

Results of cell counting on alginate cell suspension (8.2 × 10⁸ CFU/g) and disrupted microcapsules (7.7 × 10⁷ CFU/g) showed an encapsulation efficiency of 94%.

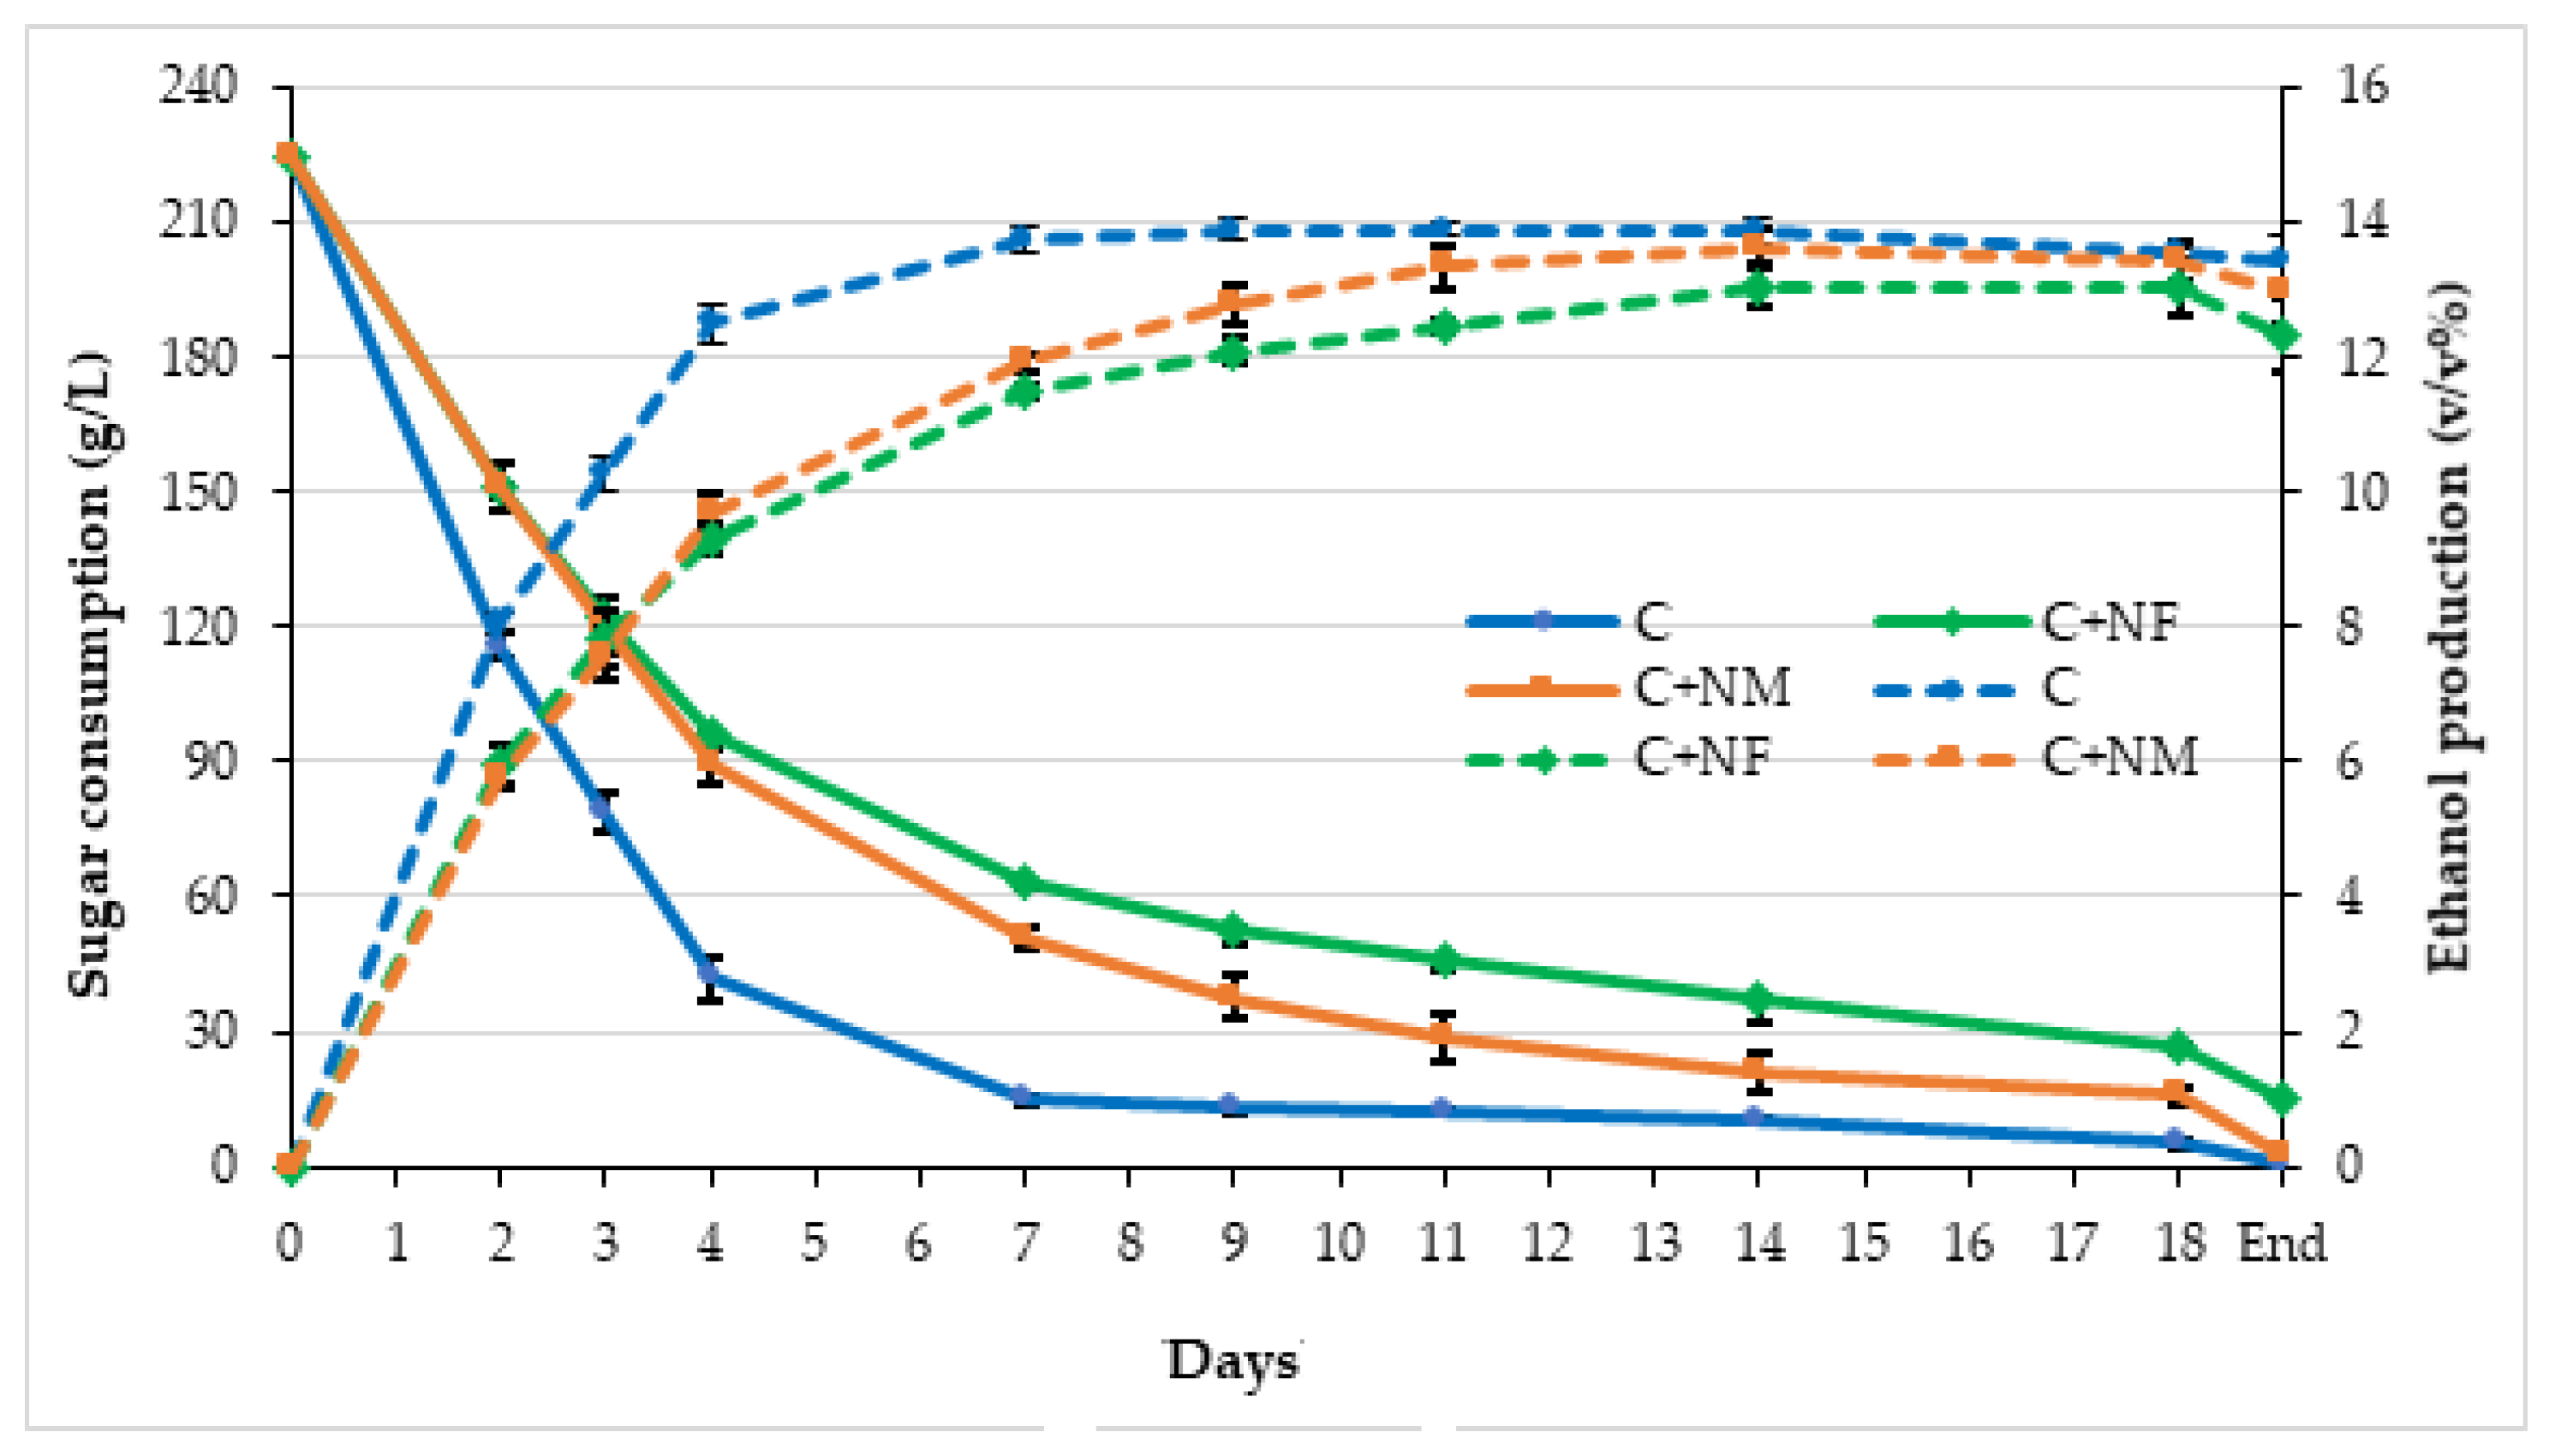
3.2. Fermentation Kinetics

The sugar depletion during the mixed fermentations, using H.osmophila strain as free and microencapsulated cells (NF and NM, respectively), in comparison to EC1118 single fermentation (C) is shown in Figure 2. High differences in sugar consumption between the control and the mixed starter cultures were found from the first step of the process till the end of fermentation and the fermentation dynamic was faster for the control fermentation, as expected, which consumed the majority of sugars within seven days. As regards the mixed fermentations, in the first days of fermentation, the sugar consumption was very similar among them, whereas after T4 the sugar depletion in C + NM was faster than in the mixed fermentation with free cells of ND strain. At the end of the process, the residual sugars detected in NM mixed fermentation was similar to the sugar content detected in the control fermentation, whereas the mixed fermentation including ND1 strain as free cells (C + NF) contained the highest residual sugar.
As expected, the kinetics of ethanol increase during the time reflects the same trend of sugar consumption (Figure 2). The control fermentation yielded the highest final content of ethanol and also the ethanol production during the time was faster than the ethanol increase observed in the mixed fermentations. The slowest rate of ethanol production over the time was observed in the process driven by ND1 as free cells (C + NF), such as the lowest final content of ethanol, corresponding to the highest residual sugar.

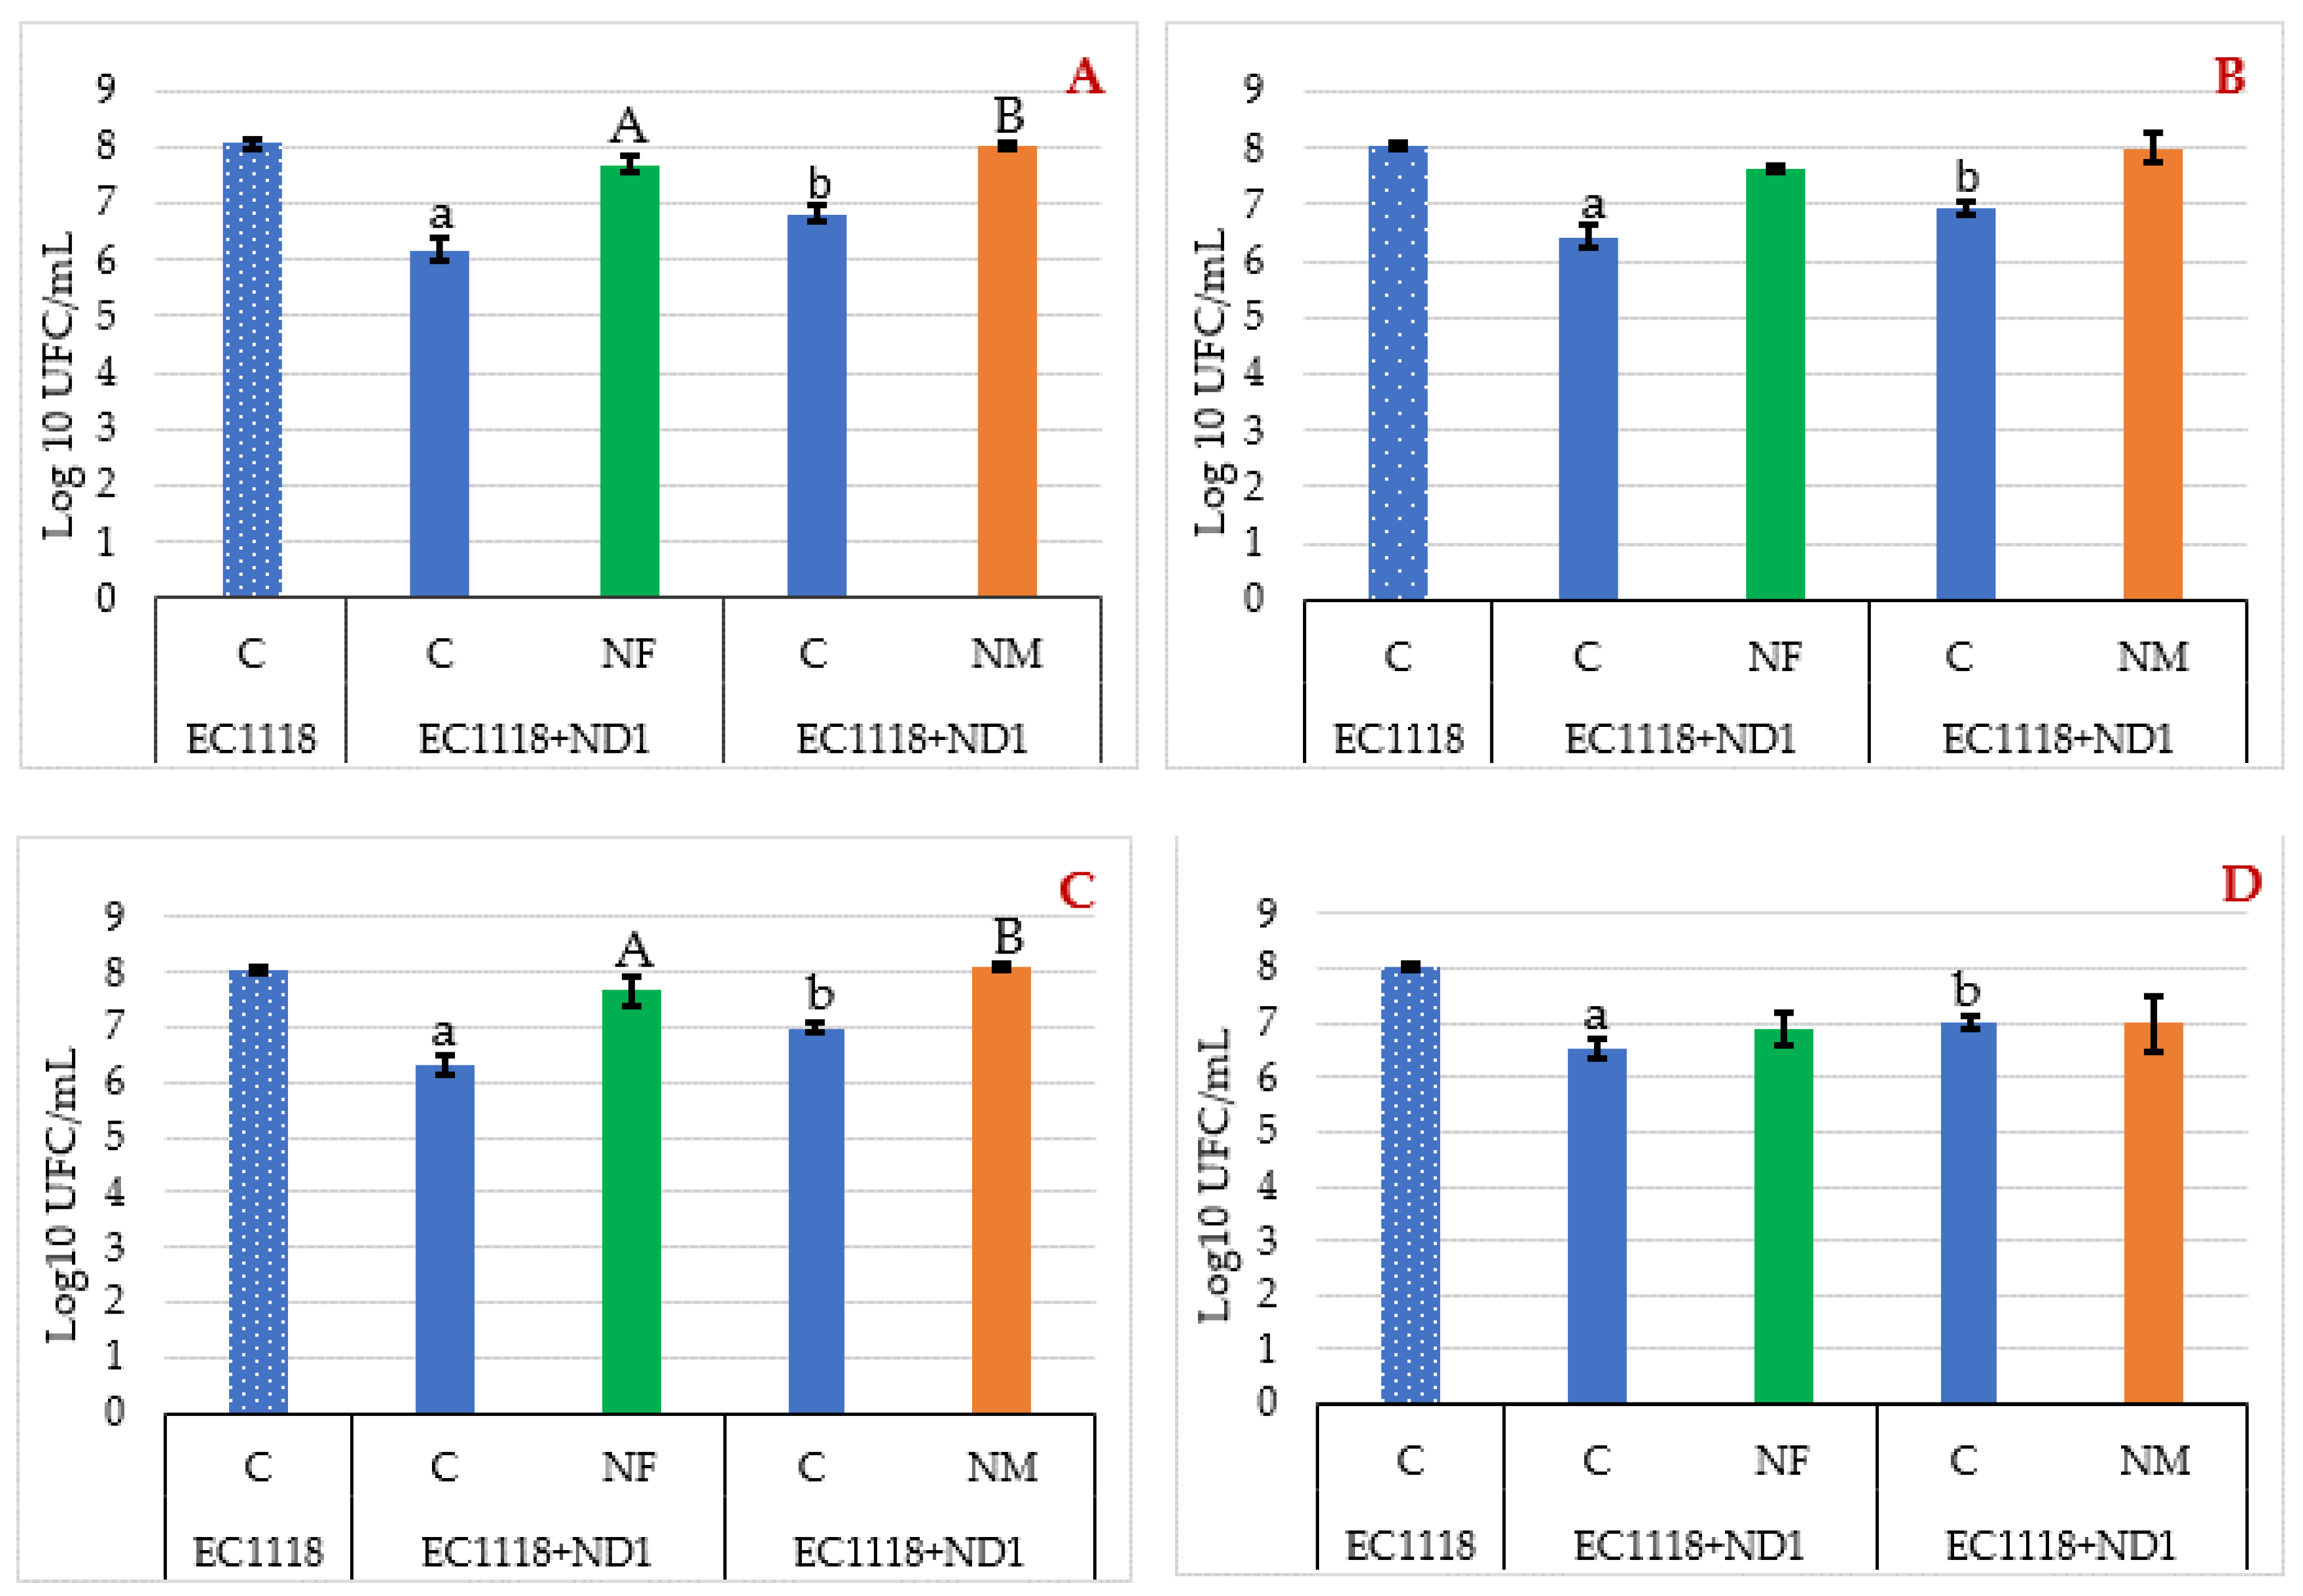
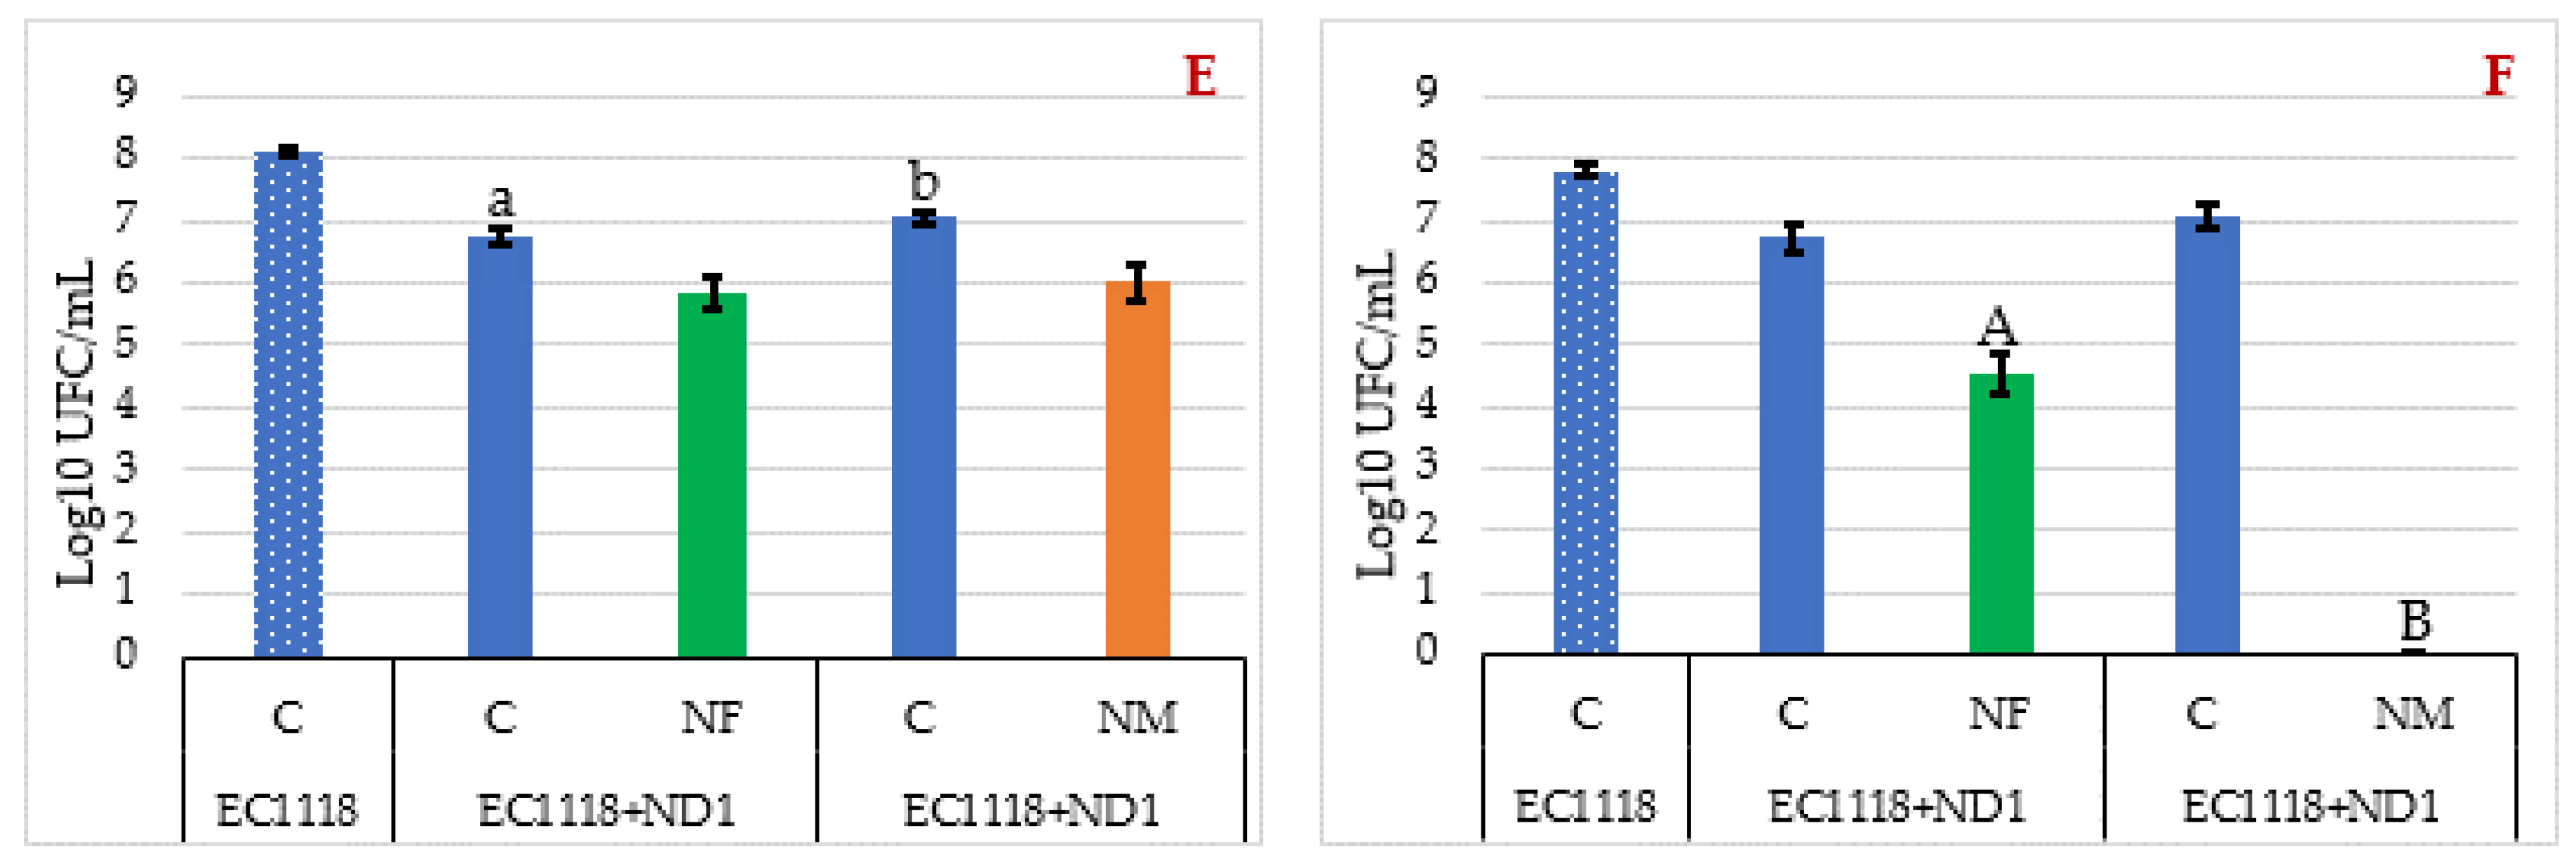
3.3. Evaluation of Yeast Viable Population during the Fermentations

The concentration of viable cells during micro fermentations for each yeast population was monitored by yeast isolation at different steps of mixed and control fermentations (Figure 3A–F).
At T2 (2nd day after inoculum, Figure 3A), when the sugar content was reduced by about 50% for the control fermentation and 35% for both the mixed starters (Figure 2), the highest number of viable cells was found for the H. osmophila strain as microencapsulated cells (C + NM mixed fermentation), whereas the number of viable cells for ND1 in free form (NF) was very similar to S. cerevisiae viable cells, present in the control fermentation (C). Concerning S. cerevisiae cells in mixed fermentation, the number of viable cells was significantly higher in C + NM mixed fermentation than in the C + NF trial. However, at this time, in all the fermentations an increase of cell number was observed with respect to inoculation level, mainly for S. cerevisiae cells in both the mixed fermentations (6.9 × 10⁶ and 1.57 × 10⁶ CFU/mL in C + NM and C + NF, respectively).
After three days of fermentation (Figure 3B), the number of S. cerevisiae viable cells remains similar to the first isolation for the control fermentation (C). In mixed fermentations, the number of ND1 viable cells was similar to the levels found after 48 h both in C + NM (1.12 × 10⁸ CFU/mL) and C + NF (4.43 × 10⁷ CFU/mL) trials, whereas the number of S. cerevisiae cells increased in both the mixed fermentations. However, the number of EC1118 cells was significantly higher in the fermentation inoculated with ND1 microencapsulated cells (9.18 × 10⁶ CFU/mL) than in the trial inoculated with free cells of H. osmophila (3 × 10⁶ CFU/mL). A similar trend was also observed after 4 fermentation days (Figure 3C).
After 7 days of fermentation (Figure 3D), the cell number of the ND1 strain decreased in both the mixed fermentations (1.37 × 10⁷ and 8.67 × 10⁶ CFU/mL for C + NM and C + NF, respectively), probably as a consequence of the increase in ethanol concentration, which at this time reached values of about 9% v/v in the two mixed fermentations (Figure 2). The S. cerevisiae population remained stable for C + NM, whereas it increases for C + NF. In this step, the cell populations of S. cerevisiae and H. osmophila were very similar in both C + NM and C + NF mixed fermentations. A similar trend was also observed after 9 days of fermentation (Figure 3E), with a reduction of H. osmophila cells for both the mixed fermentations and the dominance of S. cerevisiae strain.
In the last isolation steps, H. osmophila cells were found only at the eleventh day of fermentation in the trial inoculated with ND1 cells in free form (Figure 3F), whereas in the mixed fermentation with ND1 microencapsulated cells only S. cerevisiae cells were found. In C + NF fermentation, H. osmophila cells were detected until the 14th day of the process, after that only S. cerevisiae cells were found. At the end of fermentations, the number of S. cerevisiae cells isolated from C + NF (4.23 × 10⁶ CFU/mL) was lower than S. cerevisiae cells isolated from C + NM (8.28 × 10⁶) and from the control fermentation (6.8 × 10⁷). This could be related to the highest residual sugar found at the end of C + NF fermentation (about 15 g/L, Figure 2).

3.4. Analysis of Experimental Wines for Main Oenological Parameters

The wines obtained by the mixed starters with EC1118 and H. osmophila ND1 as free (NF) and microencapsulated cells (NM), in comparison to the single starter wine (C), were analyzed for parameters of oenological interest, such as ethanol, volatile acidity, residual sugar and sugars, and malic acid, which are presented in Table 1. The data highlighted that statistically significant differences were found for almost all the parameters, with the exception of ethanol. About the alcohol concentration obtained at the end of the fermentation, the values ranged between 12.32 ± 0.55 and 13.45 ± 0.35 (v/v%), for C + NF and C, respectively. Although the differences were not statistically significant, these results indicated a reduction of ethanol content in wines obtained by the mixed starters in comparison to the single starter fermentation. However, the wine from the C + NF mixed starter contained too high residual sugars (15.16 ± 1.00 g/L), in particular, the wine obtained by using this starter showed the highest glucose and fructose content (11.30 ± 1.97 and 2.77 ± 0.90 g/L), with values significantly different from both the wines obtained by single starter inoculum and microencapsulated cells of ND1.
The volatile acidity was included in the acceptable level (1.2 g/L) [31], except for the wine obtained by the C + NF starter, in which the detected level was 1.56 ± 0.20 g/L (Table 1). Furthermore, both the wines obtained with the mixed starters exhibited a level of volatile acidity statistically different from that of the single starter wine, but also different among them, with the highest level in wine from free ND1 cells (NF).
Finally, significantly lower values of malic acid were detected in samples fermented with the starters containing ND1 as free and microencapsulated cells (1.29 ± 0.07 and 1.30 ± 0.04 g/L, respectively) in comparison to the single starter wine (1.60 ± 0.09 g/L).

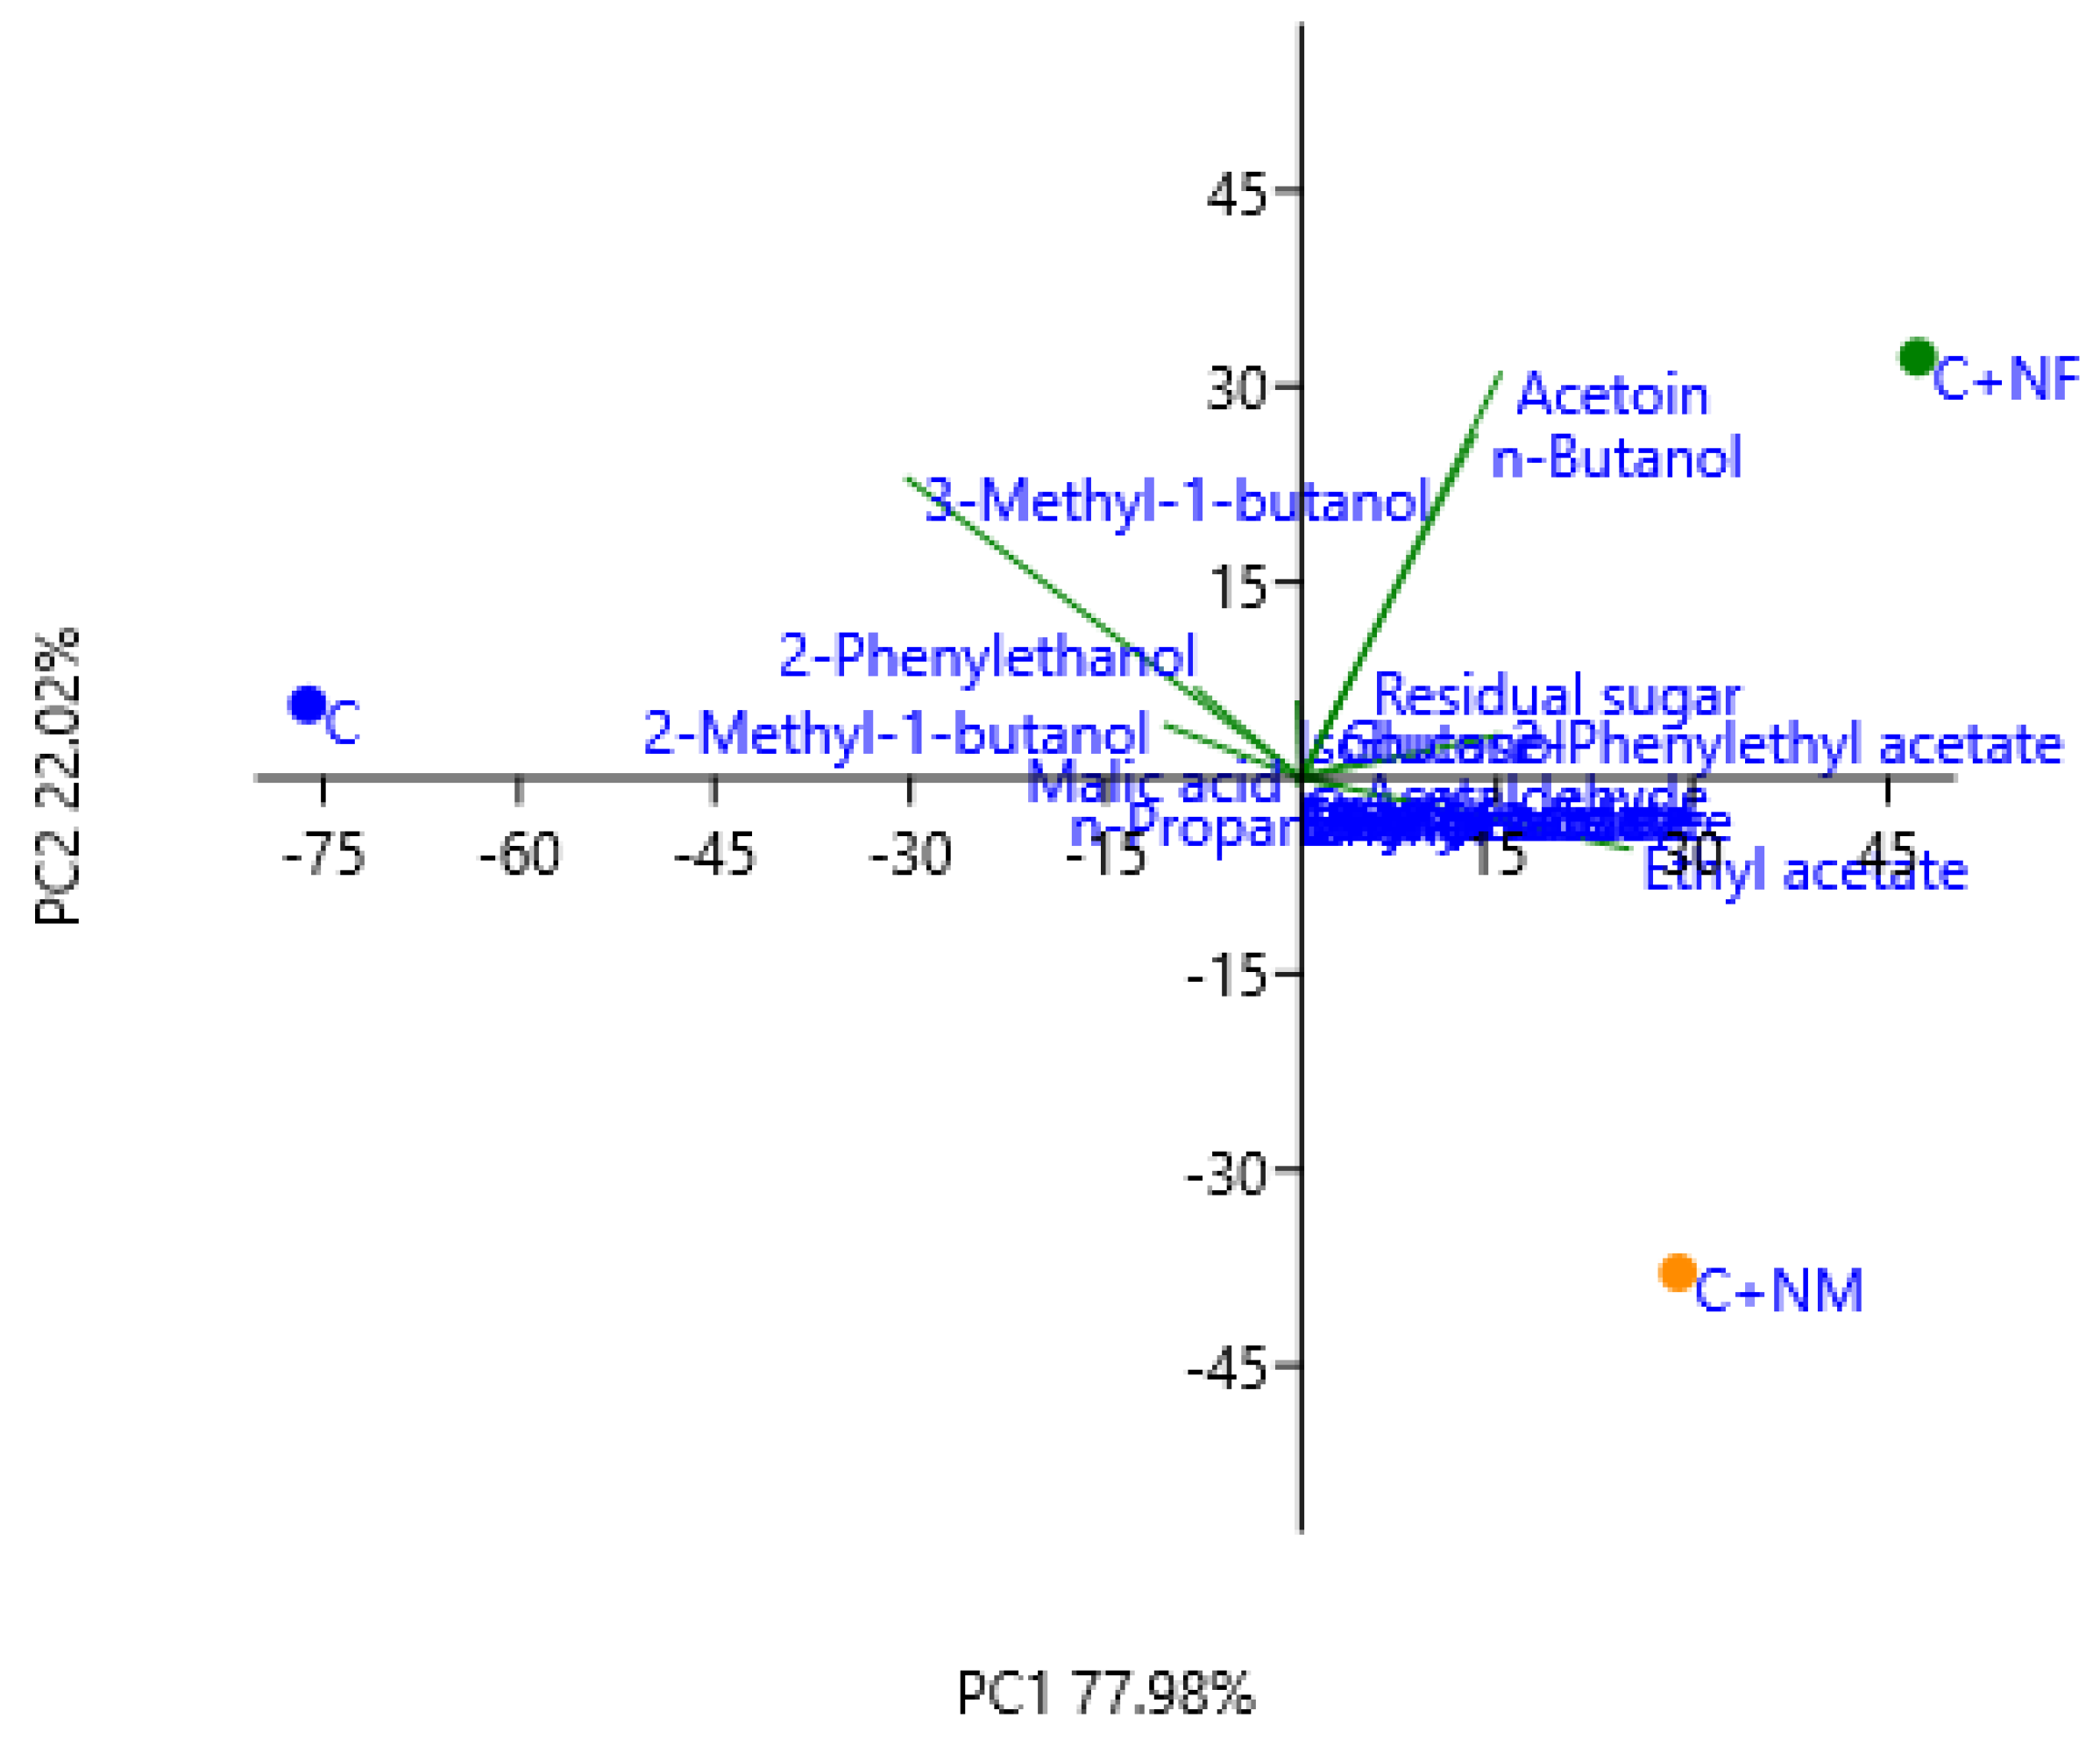
3.5. Aromatic Compounds of Experimental Wines

The experimental wines were also analyzed for the content of some secondary compounds affecting wine aroma, reported in Table 2.
Statistically significant differences were found between the control and the wines from mixed starters for almost all the compounds, with the exception of isobutanol. Conversely, for the majority of detected aromatic compounds no differences were recorded between the wines fermented with free (NF) and microencapsulated (NM) ND1 cells.
The acetaldehyde content was significantly higher in wines from the mixed starters than in the control wine, although the detected values were included in the usual level for all the samples (10–75 mg/L) [32].
The sample fermented with free ND1 cells contained a much higher level of acetoin (60 mg/L) than the other two experimental wines, in which the values were below 10 mg/L. The highest levels of higher alcohols were found in the wine fermented with single starter, with the exception of n-butanol. Mixed starters significantly improved the production of this higher alcohol, mainly the inoculation with free cells of H. osmophila. In this fermentation (NF), the n-butanol content was 8-fold higher than the level detected in monoculture wine (C).
The mixed starters inoculation increased the content of ethyl acetate and 2-phenylethyl acetate (Table 2). High content of ethyl acetate was found in the wines from mixed starters including free and microencapsulated cells of H. osmophila strain, with the concentration of ethyl acetate approximately 3-fold greater than that produced by S. cerevisiae pure culture. Furthermore, the level of 2-phenylethyl acetate was highly increased by co-inoculation with the ND1 strain; the content of this ester was also influenced by the ND1 formulation, with levels significantly higher in wines fermented with free cells of H. osmophila strain (NF) than the sample fermented with microencapsulated ND1 cells (NM).
With regard to the esters present at lower concentrations, such as ethyl hexanoate, ethyl lactate, ethyl octanoate and diethyl succinate, higher levels were found in the control wine than in the samples from mixed fermentations (Table 2). In particular, the use of microencapsulated cells of ND1 (NM) increased the level of these esters in comparison to free ND1 cells (NF), mainly of ethyl lactate and diethyl succinate.
For easy visualization of contributions of each starter to the production of aromatic compounds, all these data were converted to Z-scores and used for the heatmap reported in Figure 4. As already reported, the single S. cerevisiae EC1118 starter produced wine characterized by the highest content of some higher alcohols (2-methyl-1-butanol, 3-methyl-1-butanol, 2-phenylethanol and methionol) and some esters, such as ethyl hexanoate, ethyl lactate, ethyl octanoate and diethyl succinate. Conversely, both the mixed starter cultures were characterized as producing the highest amount of acetaldehyde, n-propanol, 1-hexanol, ethyl acetate and 2-phenylethyl acetate. Furthermore, the wine produced with free ND1 cells contained the highest level of acetoin and n-butanol.
Principal component analysis (PCA) was applied to all the parameters determined in the experimental wines obtained by the mixed starters with S. cerevisiae EC1118 and H. osmophila (ND1) as free (NF) and microencapsulated (NM) cells in comparison with the single starter EC1118 (C). The first principal component (PC1) explained 77.98% of data variability and it was mainly correlated with acetaldehyde, ethyl acetate and 2-phenylethyl acetate, while acetoin, n-butanol, 3-methyl-1-butanol, 2-phenylethanol and ethyl hexanoate contributed more strongly to the second principal component (PC2), which explained 22.02% of data variability. The scatter plot of the three wines on the plane defined by these first two components is shown in Figure 5. The PCA showed that the wines were located in three different quadrants in function of the starter formulation. In fact, the wines from mixed starters obtained by ND1 in the two different formulations (free (NF) and microencapsulated cells (NM)) were located far from each other and also in different quadrants in comparison to the monoculture wine (C).

3.6. Influence of Acetic Acid Addition on S. cerevisiae EC1118 Fermentative Performance

This assay was carried out in order to evaluate the existence of a potential correlation between the lowest number of S. cerevisiae cells in NF fermentation and the higher acetic acid level in the produced wine. Therefore, single fermentation trials with EC1118 were performed in grape must with 1.5 g/L acetic acid added. Acetic acid was added at different time intervals, i.e., at the start of the process (time 0), after 24 and 48 h of fermentation. The monitoring of fermentative performance of EC1118 in different conditions, evaluated by sugar depletion, is reported in Figure 6. High differences in sugar consumption were found between the control (C without acetic acid addition) and C-48 h and C-72 h (addition of acetic acid after 48 and 72 h, respectively). At day six of the process, the residual sugar was lower in the control C (about 20 g/L) than in C-48 h andC-72 h, with values of 41 and 52 g/L, respectively. This trend was maintained until the end of the micro fermentation process. No differences were detected between the control and the fermentation with addition of acetic acid at time 0 (C-0 h) during the overall process.
The data regarding the amount the residual sugar and the acetic acid detected at the end of the fermentative process are shown in the Table 3. Significant statistical differences were found for both parameters analyzed in the function of the addition time of acetic acid. Regarding the residual sugar, the highest values (3.7 ± 0.15 and 3.1 ± 0.14 g/L) were recorded in C-72 h and C-48 h samples, whereas values very similar were found in the control and in the experimental wine C-0 h (acetic acid added at the beginning of the process). The same trend was also recorded for acetic acid content. These data demonstrated a significant influence of acetic acid on the fermentative behavior of EC1118, when added after 24 and 48 h, whereas no influence was recorded when acetic acid was added at the beginning of the process.
The later addition of acetic acid reduced the fermentative performance of this strain, which was not able to consume all the sugar present in the grape must. This result might be due to the potential ability of this S. cerevisiae strain to reduce the acetic acid, when the compound was added at time 0. This ability was reduced when the compound was added later and this is confirmed by the acetic acid content detected in the final wines, which was higher in the samples obtained by C-72 h and C-48 h than the level detected in C and C-0 h.

4. Discussion

The management of non-Saccharomyces yeasts in the mixed fermentation is one of the tools useful to increase the limited persistence of these species during mixed fermentation trials. In this context, the use of the microencapsulation for the cell immobilization increased the resistance against toxic compounds, such as ethanol formed during wine fermentation. Although different studies reported the use of immobilization of non-Saccharomyces strains for wine fermentation, in particular for sequential inoculations [18,19], as far as we know this is the first time that H. osmophila was used as calcium alginate microcapsules for wine fermentation in comparison to inoculum of free cells.
Although the slow fermentation rate observed in the first fermentation days for the mixed starter in comparison to S. cerevisiae strain (Figure 2), the H. osmophila strain tested in this study, mainly as microencapsulated cells, confirmed the good fermentative performance already reported for H. osmophila (and H. vineae), compared with other Hanseniaspora species. In general, Hanseniaspora species are considered poor fermenters, but it was demonstrated that the different species of this genus exhibit different fermentative behaviors [33,34]. Valera et al. [35] demonstrated the existence of a high degree of similarity between glycolytic and alcoholic fermentation enzymes of H. vineae and H. osmophila with S. cerevisiae. In consequence of the presence in these species of active genes typically related to wine fermentation capacities, such as sulfite tolerance (SSU1) and sucrose hydrolyzing invertase (SUC2), these two species should be classified as fermenters, while the remaining Hanseniaspora species were included in the fruit group.
In our study, the use of the microencapsulated cells increased the fermentative efficiency of H. osmophila cells in comparison to free formulation. These results were in contrast with previous work performed on microencapsulated cells of S. cerevisiae strain [36], in which it was found that encapsulated yeast consumed the fermentable brewing sugars slowly with respect to the free form. It is demonstrated that cell immobilization affects cell growth, physiology and metabolic activity, but the induced effects are hard to predict [37].
However, our study tested a mixed starter culture, in which the interaction mechanisms between different strains play a fundamental role in fermentative kinetics and the confinement of H. osmophila cells in microspheres might offer protection against environmental stresses [22], such as the presence of toxic compounds, usually ethanol, or contact with other yeast cells.
The evaluation of cell population evolution during the mixed fermentations showed a different persistence for both ND1 and EC1118 strains in the function of H. osmophila cell formulation. When inoculated as microencapsulated cells, the ND1 strain was able to persist until the 9th day of fermentation, whereas a longer persistence was found for free H. osmophila cells (Figure 3). With regards S. cerevisiae cells, during the entire process the number of S. cerevisiae cells isolated from the mixed fermentation with free ND1 cells was lower than that of S. cerevisiae cells isolated from the process inoculated with microencapsulated cells of ND1.
These results seem to indicate an inhibition by the ND1 strain on S. cerevisiae populations when it was inoculated as free cells, also justifying the higher presence of residual sugar in the experimental wine obtained with free ND1 cells in comparison to wine from ND1 microencapsulated cells (Table 1). Some studies reported that the growth of apiculate yeast may inhibit S. cerevisiae growth, resulting in sluggish fermentation [38]. In our case, the inhibition could be related to cell-to-cell contact, in the case of free cells of H. osmophila, whereas the presence of encapsulation layer material might reduce this phenomenon in microencapsulated cells. Alternatively, this different behavior might be related to the presence of some compounds produced by yeasts during alcoholic fermentation that may become inhibitory to other yeast species or strains. Although in mixed fermentations ethanol is considered the main factor responsible of inhibitory interactions mediated by metabolites with toxic effects [39], other metabolites, such as short- to medium-chain fatty acids (e.g., acetic, hexanoic, octanoic and decanoic acids) can reach concentrations leading to cell death of different yeast species, including some S. cerevisiae strains [40,41]. In our study, the highest level of acetic acid (the main component of volatile acidity) was found in both the wines from mixed starter, as expected for apiculate yeasts, but the use of H. osmophila strain in different cell formulations influenced the volatile acidity level, with a significant higher content in wine from free cells (Table 1). This higher content of acetic acid might be responsible fora reduced number of S. cerevisiae cells in the fermentation inoculated with free ND1 cells.
The influence of high acetic acid content on EC1118 strain was confirmed by the trials performed by adding acetic acid (1.5 mg/L) to grape must at different times in the fermentation process (Figure 6). The influence of this compound was evident when it was added after 48 and 72 h, whereas no effect was observed when this compound was added at the start of the fermentation. This might be correlated with the ability of S. cerevisiae to remove acetic acid, a practical approach used to eliminate excessive amounts of this compound during alcoholic fermentation [42,43], and investigated by different scientific papers, either by mutants of S. cerevisiae [44] or by wild strains [45]. In our study, this hypothesis was corroborated by the lower level of acetic acid detected in the wine obtained by the addition at time 0 compared to the acetic acid level found in the wine obtained from musts with this compound added after 48 and 72 h of fermentation (Table 3).
Other than volatile acidity, the use of mixed starter also affected the ethanol content of the experimental wine, with a reduction of alcohol content by both the mixed starters, although in wine fermented with free H. osmophila cells this result was correlated with too high residual sugar (Table 1). The use of microencapsulated cells of the ND1 strain reduced the ethanol content by about 0.5 with respect to the single starter fermentation. This reduction level was lower than the ethanol reduction reported by other authors using cell immobilization of different non-Saccharomyces strains. Canonico et al. [18] found that the use of immobilized strains of Starmerella bombicola, Metschnikowia pulcherrima, H. osmophila and H. uvarum in sequential fermentation with S. cerevisiae determined a variable ethanol reduction in the functioning of the non-Saccharomyces strain, with the lowest ability for H. osmophila (reduction from 0.78 to 1.33% v/v).
With regards the aromatic characteristics of the final wines, the use of mixed starter affected the content of almost all the aromatic compounds detected in this study, while less influence was found in the function of cell formulation of the ND1 strain (Table 2).
The use of mixed starter including H. osmophila strain increased the content of ethyl acetate and 2-phenylethyl acetate. This result was expected as it is well known that all Hanseniaspora species increase the concentration of almost all the acetate esters [34,46,47]. The content of the main ester of wine, ethyl acetate, was increased using the mixed starter, independently from cell formulation. However, the values were below the acceptable level in all the wines, considering that wines are defective when this compound is present at levels of 150–200 mg/L [48].
The inclusion of H. osmophila strain also significantly increased the level of 2-phenylethyl acetate, which imparts honey, fruity, flowery, rosé-like aromas, and the amounts detected in wines from the mixed starters were higher than the level usually detected in the wine, ranging from 0 to 18.5 mg/L [32]. The increased level found in our study (from 30- to 40-fold greater than level found in the S. cerevisiae monoculture, Table 2) was higher than values previously reported for mixed starter cultures including H. osmophila strains [49] and for mutants derived from the commercial wine strain AWRI796 [50]. It was discovered that the amount of 2-phenylethyl acetate found in wines obtained by the mixed starter including H. osmophila was significantly different from that formed by the S. cerevisiae monoculture if the percentage of H. osmophila in the culture was at least 50% [46].
The H. osmophila strain did not affect the content of the other acetate ester found in this study, isoamyl acetate, which was present in higher concentration in the wine obtained by S. cerevisiae fermentation, suggesting that S. cerevisiae metabolism is mainly responsible for isoamyl acetate formation [46], whereas H. uvarum, whether in pure or mixed cultures, yielded higher levels of isoamyl acetate in comparison to those produced by S. cerevisiae monoculture [51].

5. Conclusions

The fermentative performance of the H. osmophila ND1 strain in mixed starter fermentation is widely affected by cell formulation. Microencapsulation resulted in a suitable system to increase the fermentative efficiency of this strain in comparison with the use of free cells during mixed starter fermentation. Furthermore, this formulation was also promising for a reduction of ethanol content in wine, a very attractive trend for winemaking. However, our results confirmed the key role of interaction mechanisms between strains in mixed starter fermentation [52], in our case most probably correlated to the strong selective pressure exerted by the high content of acetic acid. These mechanisms have to be accurately investigated before the use of mixed starter cultures at industrial level in order to allow the expression of the particular metabolic footprint of each strain included in the mixed starter and to take all the advantages correlated with the use of this innovative starter.

Author Contributions

Conceptualization, all the authors; methodology, all the authors; software, R.P., G.S. and G.A.; investigation, G.A., R.P., D.M. and R.R.; resources, P.R. and A.C.; writing—original draft preparation, all the authors; writing—review and editing, A.C., G.M., T.G.-C. and P.R.; funding acquisition, P.R. and A.C. All authors have read and agreed to the published version of the manuscript.

Funding

This work was supported by the project PSR Regione Basilicata 2014–2020, sottomisura 16.1 GO Vites&Vino PROduttività e Sostenibilità in vITivinicoltura (PROSIT), N. 54250365779 and sottomisura 16.2 IN.VINI.VE.RI.TA.S (Innovare la viti-VINIcolturalucana: VErso la RIgenerazionevarieTAle, la Selezione di vitigni locali e proprietà antiossidanti dei vini), N. 976. G.A.’s fellowship was supported by PON RI 2014/2020, Azione I.1– “Dottorati Innovativi con caratterizzazione industriale” (Grant No. DOT1338191).

Institutional Review Board Statement

Not applicable.

Informed Consent Statement

Not applicable.

Data Availability Statement

The data presented in this study are available in the article.

Acknowledgments

The JRU MIRRI-IT (http://www.mirri-it.it/, accessed on 13 July 2021) is greatly acknowledged for scientific support.

Conflicts of Interest

The authors declare no conflict of interest. The funders had no role in the design of the study; in the collection, analyses, or interpretation of the data; in the writing of the manuscript, or in the decision to publish the results.

References

  1. Padilla, B.; Gil, J.V.; Manzanares, P. Past and Future of Non-Saccharomyces Yeasts: From Spoilage Microorganisms to Biotechnological Tools for Improving Wine Aroma Complexity. Front. Microbiol. 2016, 7, 411. [Google Scholar] [CrossRef] [Green Version]
  2. Ciani, M.; Comitini, F.; Mannazzu, I.; Domizio, P. Controlled mixed culture fermentation: A new perspective on the use of non-Saccharomyces yeasts in winemaking. FEMS Yeast Res. 2010, 10, 123–133. [Google Scholar] [CrossRef] [PubMed] [Green Version]
  3. Borren, E.; Tian, B. The Important Contribution of Non-Saccharomyces Yeasts to the Aroma Complexity of Wine: A Review. Foods 2021, 10, 13. [Google Scholar] [CrossRef]
  4. Tufariello, M.; Fragasso, M.; Pico, J.; Panighel, A.; Castellarin, S.D.; Flamini, R.; Grieco, F. Influence of non-Saccharomyces on wine chemistry: A focus on aroma-related compounds. Molecules 2021, 26, 644. [Google Scholar] [CrossRef]
  5. Comitini, F.; Gobbi, M.; Domizio, P.; Romani, C.; Lencioni, L.; Mannazzu, I.; Ciani, M. Selected non-Saccharomyces wine yeasts in controlled multistarter fermentations with Saccharomyces cerevisiae. Food Microbiol. 2011, 28, 873–882. [Google Scholar] [CrossRef]
  6. Pietrafesa, A.; Capece, A.; Pietrafesa, R.; Bely, M.; Romano, P. Saccharomyces cerevisiae and Hanseniaspora uvarum mixed starter cultures: Influence of microbial/physical interactions on wine characteristics. Yeast 2020, 37, 609–621. [Google Scholar] [CrossRef]
  7. Jolly, N.P.; Varela, C.; Pretorius, I.S. Not your ordinary yeast: Non-Saccharomyces yeasts in wine production uncovered. FEMS Yeast Res. 2014, 14, 215–237. [Google Scholar] [CrossRef] [Green Version]
  8. Escribano, R.; Lucía González-Arenzana, L.; Garijo, P.; Berlanas, C.; López-Alfaro, I.; López, R.; Gutiérrez, A.R.; Santamaría, P. Screening of enzymatic activities within different enological non-Saccharomyces yeasts. J. Food Sci. Technol. 2017, 54, 1555–1564. [Google Scholar] [CrossRef] [Green Version]
  9. López, M.C.; Mateo, J.J.; Maicas, S. Screening of β-Glucosidase and β-Xylosidase Activities in Four Non-Saccharomyces Yeast Isolates. J. Food Sci. 2015, 80, C1696–C1704. [Google Scholar] [CrossRef] [PubMed]
  10. Canonico, L.; Solomon, M.; Comitini, F.; Ciani, M.; Varela, C. Volatile profile of reduced alcohol wines fermented with selected non-Saccharomyces yeasts under different aeration conditions. Food Microbiol. 2019, 84, 1032472. [Google Scholar] [CrossRef]
  11. García, M.; Esteve-Zarzoso, B.; Cabellos, J.M.; Arroyo, T. Sequential Non-Saccharomyces and Saccharomyces cerevisiae Fermentations to Reduce the Alcohol Content in Wine. Fermentation 2020, 6, 60. [Google Scholar] [CrossRef]
  12. Navrátilová, M.; Beranová, M.; Severová, L.; Šrédl, K.; Svoboda, R.; Abrhám, J. The Impact of Climate Change on the Sugar Content of Grapes and the Sustainability of their Production in the Czech Republic. Sustainability 2021, 13, 222. [Google Scholar] [CrossRef]
  13. Varela, C.; Dry, P.R.; Kutyna, D.R.; Francis, I.L.; Henschke, P.A.; Curtin, C.D.; Chambers, P.J. Strategies for reducing alcohol concentration in wine. Aust. J. Grape Wine Res. 2015, 21, 670–679. [Google Scholar] [CrossRef]
  14. Neethling, E.; Petitjean, T.; Quénol, H.; Barbeau, G. Assessing local climate vulnerability and winegrowers ‘adaptive processes in the context of climate change. Mitig. Adapt. Strateg. Glob. Chang. 2017, 22, 777–803. [Google Scholar] [CrossRef]
  15. Varela, J.; Varela, C. Microbiological strategies to produce beer and wine with reduced ethanol concentration. Curr. Opin. Biotech. 2019, 56, 88–96. [Google Scholar] [CrossRef] [PubMed]
  16. Englezos, V.; Rantsiou, K.; Cravero, F.; Torchio, F.; Ortiz-Julien, A.; Gerbi, V.; Rolle, L.; Cocolin, L. Starmerella bacillaris and Saccharomyces cerevisiae mixed fermentations to reduce ethanol content in wine. Appl. Microbiol. Biotechnol. 2016, 100, 5515–5526. [Google Scholar] [CrossRef]
  17. Ciani, M.; Morales, P.; Comitini, F.; Tronchoni, J.; Canonico, L.; Curiel, J.A.; Oro, L.; Rodrigues, A.J.; Gonzalez, R. Non-conventional Yeast Species for Lowering Ethanol Content of Wines. Front. Microbiol. 2016, 7, 642. [Google Scholar] [CrossRef] [Green Version]
  18. Canonico, L.; Comitini, F.; Oro, L.; Ciani, M. Sequential Fermentation with Selected Immobilized Non-Saccharomyces Yeast for Reduction of Ethanol Content in Wine. Front. Microbiol. 2016, 7, 278. [Google Scholar] [CrossRef] [Green Version]
  19. Canonico, L.; Comitini, F.; Ciani, M. Metschnikowia pulcherrima Selected Strain for Ethanol Reduction in Wine: Influence of Cell Immobilization and Aeration Condition. Foods 2019, 8, 378. [Google Scholar] [CrossRef] [Green Version]
  20. Kosseva, M.R. Immobilization of Microbial Cells in Food Fermentation Processes. Food Bioprocess Technol. 2011, 4, 1089–1118. [Google Scholar] [CrossRef]
  21. Genisheva, Z.; Teixeira, J.A.; Oliveira, J.M. Immobilized cells systems for batch and continuous winemaking. Trends Food Sci. Technol. 2014, 40, 33–47. [Google Scholar] [CrossRef] [Green Version]
  22. Rathore, S.; Desai, P.M.; Liew, C.V.; Chan, L.W.; Heng, P.W.S. Microencapsulation of microbial cells. J. Food Eng. 2013, 116, 369–381. [Google Scholar] [CrossRef]
  23. Bevilacqua, A.; Campaniello, D.; Speranza, B.; Racioppo, A.; Altieri, C.; Sinigaglia, M.; Corbo, M.R. Microencapsulation of Saccharomyces cerevisiae into Alginate Beads: A Focus on Functional Properties of Released Cells. Foods 2020, 9, 1051. [Google Scholar] [CrossRef]
  24. Esteve-Zarzoso, B.; Belloch, C.; Uruburu, F.; Querol, A. Identification of yeasts by RFLP analysis of the 5.8S rRNA gene and the two ribosomal internal transcribed spacers. Int. J. Syst. Evol. Microbiol. 1999, 49, 329–337. [Google Scholar] [CrossRef] [Green Version]
  25. Alberico, G.; Pietrafesa, A.; Capece, A.; Pietrafesa, R.; Siesto, G.; Romano, P. Erratum to: Exploitation of technological variability among wild non-Saccharomyces yeasts to select mixed starters for the production of low alcohol wines. BIO Web Conf. 2019, 15, 02041. [Google Scholar] [CrossRef]
  26. De Prisco, A.; Maresca, D.; Ongeng, D.; Mauriello, G. Microencapsulation by vibrating technology of the probiotic strain Lactobacillus reuteri DSM 17938 to enhance its survival in foods and in gastrointestinal environment. LWT Food Sci. Technol. 2015, 61, 452–462. [Google Scholar] [CrossRef]
  27. Maresca, D.; De Prisco, A.; La Storia, A.; Cirillo, T.; Esposito, F.; Mauriello, G. Microencapsulation of nisin in alginate beads by vibrating technology: Preliminary investigation. LWT Food Sci. Technol. 2016, 66, 436–443. [Google Scholar] [CrossRef]
  28. Capece, A.; Siesto, G.; Romaniello, R.; Lagreca, V.M.; Pietrafesa, R.; Calabretti, A.; Romano, P. Assessment of competition in wine fermentation among wild Saccharomyces cerevisiae strains isolated from Sangiovese grapes in Tuscany region. LWT Food Sci. Technol. 2013, 54, 485–492. [Google Scholar] [CrossRef]
  29. Rubio-Bretón, P.; Gonzalo-Diago, A.; Iribarren, M.; Garde-Cerdán, T.; Pérez-Álvarez, E.P. Bioprotection as a tool to free additives winemaking: Effect on sensorial, anthocyanic and aromatic profile of young red wines. LWT Food Sci. Technol. 2018, 98, 458–464. [Google Scholar] [CrossRef]
  30. Hammer, Ø.; Harper, D.A.T.; Ryan, P.D. PAST: Paleontological statistics software package for education and data analysis. Palaeontol. Electron. 2001, 4, 1–9. [Google Scholar]
  31. OIV-MA-C1e01: R2011. Maximum acceptable limits of various substances. In Compendium of International Methods of Wine and Must Analysis, 2014th ed.; Organisation International de la Vigne et du Vin: Paris, France, 2011; Volume 2. [Google Scholar]
  32. Swiegers, J.H.; Bartowsky, P.A.; Henschke, P.A.; Pretorius, I.S. Yeast and bacterial modulation of wine aroma and flavour. Aust. J. Grape Wine Res. 2005, 11, 139–173. [Google Scholar] [CrossRef]
  33. Moreira, N.; Pina, C.; Mendes, F.; Couto, J.A.; Hogg, T.; Vasconcelos, I. Volatile compounds contribution of Hanseniaspora guilliermondii and Hanseniaspora uvarum during red wine vinifications. Food Control 2011, 22, 662–667. [Google Scholar] [CrossRef]
  34. Martin, V.; Valera, M.J.; Medina, K.; Boido, E.; Carrau, F. Oenological impact of the Hanseniaspora/Kloeckera yeast genus on wines—A review. Fermentation 2018, 4, 76. [Google Scholar] [CrossRef] [Green Version]
  35. Valera, M.J.; Boido, E.; Dellacassa, E.; Carrau, F. Comparison of the Glycolytic and Alcoholic Fermentation Pathways of Hanseniaspora vineae with Saccharomyces cerevisiae Wine Yeasts. Fermentation 2020, 6, 78. [Google Scholar] [CrossRef]
  36. Benucci, I.; Cecchi, T.; Lombardelli, C.; Maresca, D.; Mauriello, G.; Esti, M. Novel microencapsulated yeast for the primary fermentation of green beer: Kinetic behavior, volatiles and sensory profile. Food Chem. 2021, 340, 127900. [Google Scholar] [CrossRef]
  37. Moreno-García, J.; García-Martínez, T.; Mauricio, J.C.; Moreno, J. Yeast Immobilization Systems for Alcoholic Wine Fermentations: Actual Trends and Future Perspectives. Front. Microbiol. 2018, 9, 241. [Google Scholar] [CrossRef] [PubMed] [Green Version]
  38. Medina, K.; Boido, E.; Fariña, L.; Gioia, O.; Gomez, M.E.; Barquet, M.; Gaggero, C.; Dellacassa, E.; Carrau, F. Increased flavour diversity of Chardonnay wines by spontaneous fermentation and co-fermentation with Hanseniaspora vineae. Food Chem. 2013, 141, 2513–2521. [Google Scholar] [CrossRef]
  39. Ciani, M.; Comitini, F. Yeast interactions in multi-starter wine fermentation. Curr. Opin. Food Sci. 2015, 1, 1–6. [Google Scholar] [CrossRef]
  40. Ludovico, P.; Sousa, M.J.; Silva, M.T.; Leao, C.; Corte-Real, M. Saccharomyces cerevisiae commits to a programmed cell death process in response to acetic acid. Microbiology 2001, 147, 2409–2415. [Google Scholar] [CrossRef] [PubMed] [Green Version]
  41. Fleet, G.H. Yeast interactions and wine flavour. Int. J. Food Microbiol. 2003, 86, 11–22. [Google Scholar] [CrossRef]
  42. Vasserot, Y.; Mornet, F.; Jeandet, P. Acetic acid removal by Saccharomyces cerevisiae during fermentation in oenological conditions. Metabolic consequences. Food Chem. 2010, 119, 1220–1223. [Google Scholar] [CrossRef]
  43. Shang, Y.; Zeng, Y.; Zhu, P.; Zhong, Q. Acetate metabolism of Saccharomyces cerevisiae at different temperatures during lychee wine fermentation. Biotechnol. Biotechnol. Equip. 2016, 30, 512–520. [Google Scholar] [CrossRef] [Green Version]
  44. Pampulha, M.E.; Loureiro-Dias, M.C. Energetics of the effect of acetic acid on growth of Saccharomyces cerevisiae. FEMS Microbiol. Lett. 2000, 184, 69–72. [Google Scholar] [CrossRef]
  45. Vilera-Moura, A.; Schuller, D.; Mendes-Faia, A.; Real, M. Reduction of volatile acidity of wines by selected yeasts strains. Appl. Microbiol. Biotechnol. 2008, 80, 881–890. [Google Scholar] [CrossRef] [Green Version]
  46. Viana, F.; Gil, J.V.; Vallés, S.; Manzanares, P. Increasing the levels of 2-phenylethyl acetate in wine through the use of a mixed culture of Hanseniaspora osmophila and Saccharomyces cerevisiae. Int. J. Food Microbiol. 2009, 135, 68–74. [Google Scholar] [CrossRef]
  47. Zhang, B.-Q.; Shen, J.-Y.; Duan, C.-Q.; Yan, G.-L. Use of Indigenous Hanseniaspora vineae and Metschnikowia pulcherrima Co-fermentation With Saccharomyces cerevisiae to Improve the Aroma Diversity of Vidal Blanc Icewine. Front. Microbiol. 2018, 9, 2303. [Google Scholar] [CrossRef]
  48. Jackson, R.S. Sensory perception and wine assessment. In Wine Science; Jackson, R.S., Jackson, R.S., Eds.; Academic Press: San Diego, CA, USA, 1994; p. 447. [Google Scholar]
  49. Viana, F.; Gil, J.V.; Genovés, S.; Vallés, S.; Manzanares, P. Rational selection of non-Saccharomyces wine yeast for mixed starters based on ester formation and enological traits. Food Microbiol. 2008, 25, 778–785. [Google Scholar] [CrossRef] [PubMed]
  50. Cordente, A.G.; Solomon, M.; Schulkin, A.; Francis, I.L.; Barker, A.; Borneman, A.R.; Curtin, C.D. Novel wine yeast with ARO4 and TYR1 mutations that overproduce ‘floral’ aroma compounds 2-phenylethanol and 2-phenylethyl acetate. Appl. Microbiol. Biotechnol. 2018, 102, 5977–5988. [Google Scholar] [CrossRef] [PubMed]
  51. Moreira, N.; Mendes, F.; Guedes de Pinho, P.; Hogg, T.; Vasconcelos, I. Heavy sulphur compounds, higher alcohols and esters production profile of Hansenispora uvarum and Hanseniaspora guilliermondii grown as pure and mixed cultures in grape must. Int. J. Food Microbiol. 2008, 124, 231–238. [Google Scholar] [CrossRef] [PubMed]
  52. Ciani, M.; Capece, A.; Comitini, F.; Canonico, L.; Siesto, G.; Romano, P. Yeast Interactions in Inoculated Wine Fermentation. Front. Microbiol. 2016, 7, 555. [Google Scholar] [CrossRef] [PubMed] [Green Version]
Figure 1. Optical microscopy images at 400× magnification of ND1 strain after microencapsulation treatment in alginate (a) and during the fermentation process (b).
Fermentation 07 00112 g001
Figure 2. Kinetics of sugar consumption (solid lines) and ethanol production (dashed lines) in the three fermentation conditions. C—control fermentation, inoculated with EC1118; C + NF—mixed starter EC1118 + ND1 as free cells; C + NM—mixed starter EC1118 + ND1 as microencapsulated cells; End—last fermentation day, variable for each starter. Data are the means of triplicate experiments ± standard deviation.
Fermentation 07 00112 g002
Figure 3. Yeast cell count detected at different times: (A) 2 days; (B) 3 days; (C) 4 days; (D) 7 days; (E) 9 days; (F) 11 days of fermentations inoculated with S. cerevisiae EC1118 in mixed culture with H. osmophila ND1 strain as free (NF) and microencapsulated (NM) cells. As control, pure fermentation with EC1118 was used (C). Data are the means of triplicate experiments ± standard deviation. Letters on plot bars indicate significant differences (p < 0.05) in cell count within EC1118 (a, b) and ND1 (A, B) in the two mixed starter fermentations.
Fermentation 07 00112 g003aFermentation 07 00112 g003b
Figure 4. Heatmap based on all the volatile compounds detected in the experimental wines obtained by the mixed starters with S. cerevisiae EC1118 (C) and H. osmophila ND1 in two different formulations (NF—free cells; NM—microencapsulated cells) in comparison to the single starter wine with EC1118 (C). Colors represent the range of Z-scores (calculated over the rows), with blue indicating lower than average production, light green indicating average production and red indicating higher than average production of each compound.
Fermentation 07 00112 g004
Figure 5. Principal component analysis (PCA) biplot of volatile compounds and main oenological parameters, determined in wines obtained by the mixed starters with S. cerevisiae EC1118 (C) and H. osmophila ND1 in two different formulations (NF—free cells; NM—microencapsulated cells) in comparison to single starter wine with EC1118 (C).
Fermentation 07 00112 g005
Figure 6. Kinetics of sugar consumption in single starter fermentation with EC1118 strain in grape must added with acetic acid at different times. C—control fermentation, without acetic acid addition; C-0 h—addition at the beginning of the fermentation process; C-48 h—addition 48 h after inoculum and C-72 h—addition 72 h after inoculum. The time of acetic acid addition is shown by the arrow in the graph. Data are expressed as mean value ± SD of three independent experiments.
Fermentation 07 00112 g006
Table 1. Main oenological parameters analyzed in wines obtained by the mixed starters with S. cerevisiae EC1118 (C) and H. osmophila (ND1) as free (NF) and microencapsulated (NM) cells in comparison to the single starter wine with EC1118 (C). The ethanol was expressed as v/v%, while the other parameters were expressed as g/L. For each compound, different superscript letters mean significant differences at p < 0.05 (*) and 0.001 (**) among the wines produced in the different conditions. n.s.: not significant. Data are expressed as mean value ± SD of three independent experiments.
Parameters.CC + NFC + NMSign.
Ethanol 13.45 ± 0.3512.32 ± 0.5512.98 ± 0.50n.s.
Residual sugar 0.95 ± 0.03 a15.16 ± 1.00 b2.51 ± 0.46 a**
Glucose 0.33 ± 0.15 a11.30 ± 1.97 b1.60 ± 0.10 a**
Fructose 0.51 ± 0.01 a2.77 ± 0.90 b1.43 ± 0.15 a*
Volatile acidity 0.40 ± 0.09 a1.56 ± 0.20 b1.05 ± 0.09 c**
Malic acid 1.60 ± 0.09 a1.29 ± 0.07 b1.30 ± 0.04 b*
Table 2. Main volatile compounds content (mg/L) detected in wines obtained by the mixed starters with S. cerevisiae EC1118 (C) and H. osmophila ND1 in two different formulations (NF—free cells; NM—microencapsulated cells) in comparison with the single starter wine with EC1118 (C). For each compound, different superscript letters mean significant differences (Tukey’s test, p ≤ 0.05) among wines produced in the different conditions. Data are expressed as mean value ± SD of three independent experiments. * compounds identified by GC/MS.
Volatile Compounds (mg/L)CC + NFC + NM
Acetaldehyde32.59 ± 2.82 a45.85 ± 3.88 b41.80 ± 2.56 b
Acetoin3.16 ± 0.52 a58.22 ± 8.67 b8.32 ± 1.28 a
n-Propanol11.91 ± 1.00 a19.44 ± 1.59 b19.06 ± 1.23 b
Isobutanol33.68 ± 1.4336.07 ± 2.4427.97 ± 2.28
n-Butanol8.75 ± 0.78 a56.43 ± 2.52 c13.93 ± 1.97 b
2-Methyl-1-butanol71.13 ± 9.68 a47.31 ± 3.01 b45.31 ± 3.74 b
3-Methyl-1-butanol235.26 ± 10.26 a171.76 ± 9.66 b150.32 ± 12.25 b
2-Phenylethanol62.54 ± 4.53 a46.05 ± 1.81 b39.32 ± 1.84 b
1-Hexanol *0.22 ± 0.02 a0.26 ± 0.01 ab0.28 ± 0.03 b
Methionol *0.17 ± 0.01 a0.04 ± 0.01 b0.05 ± 0.01 b
Ethyl acetate29.44 ± 2.84 a89.58 ± 7.88 b87.94 ± 7.79 b
Isoamyl acetate *1.45 ± 0.20 a0.63 ± 0.06 b0.51 ± 0.06 b
2-Phenylethyl acetate *1.20 ± 0.14 a40.90 ± 0.87 b30.57 ± 2.42 c
Ethyl hexanoate *0.16 ± 0.03 a0.05 ± 0.01 b0.06 ± 0.01 b
Ethyl lactate *0.18 ± 0.02 a0.08 ± 0.01 b0.17 ± 0.01 a
Ethyl octanoate *0.09 ± 0.01 a0.01 ± 0.01 b0.01 ± 0.01 b
Diethyl succinate *0.20 ± 0.03 a0.05 ± 0.01 b0.11 ± 0.01 c
Table 3. Residual sugar and acetic acid content (g/L) in wines obtained by single strain EC1118 in fermentations added with acetic acid. The acetic acid was added at different times, at the beginning (C-0 h), after 48 h (C-48 h) and after 72 h (C-72 h) in comparison with samples without acetic acid addition (C). For each compound, different superscript letters mean significant differences (Tukey’s test, p ≤ 0.05) among wines produced by single strain EC1118 in fermentations with and without acetic acid addition. Data are expressed as mean ± standard deviation of two replicates.
CC-0 hC-48 hC-72 h
Residual sugar1.45 ± 0.02 a1.81 ± 0.01 a3.1 ± 0.14 b3.7 ± 0.15 c
Acetic acid0.36 ± 0.04 a0.94 ± 0.08 b1.44 ± 0.03 c1.68 ± 0.09 c
Publisher’s Note: MDPI stays neutral with regard to jurisdictional claims in published maps and institutional affiliations.

