Article

Transcriptional and Metabolic Response of Wine-Related Lactiplantibacillus plantarum to Different Conditions of Aeration and Nitrogen Availability

1
Department of Biotechnology, University of Verona, Strada Le Grazie 15, Ca’ Vignal 2, 37134 Verona, Italy
2
South African Grape and Wine Research Institute, Department of Viticulture and Oenology, Stellenbosch University, Private Bag X1, 7602 Matieland, South Africa
3
Department of Biochemistry, Stellenbosch University, Private Bag X1, 7602 Matieland, South Africa
4
Department MCB, Vrije Universiteit Amsterdam, De Boelelaan 1085, 1081 HV Amsterdam, The Netherlands
*
Author to whom correspondence should be addressed.
Fermentation 2021, 7(2), 68; https://doi.org/10.3390/fermentation7020068
Submission received: 26 March 2021 / Revised: 19 April 2021 / Accepted: 19 April 2021 / Published: 29 April 2021
(This article belongs to the Special Issue New Insight and Current Trends in Oenological Microbiology)

Abstract

:
Lactic acid bacteria (LAB) perform the process of malolactic fermentation (MLF) in wine. Availability of oxygen and nitrogen nutrients could influence LAB growth, malolactic activity, and other metabolic pathways, impacting the subsequent wine quality. The impact of these two factors has received limited investigation within LAB, especially on a transcriptome level. The aim of this study was to evaluate metabolic changes in the strain Lactiplantibacillus plantarum IWBT B063, growing in synthetic grape juice medium (GJM) under different oxygen exposure conditions, and with low availability of nitrogen-based nutrients. Next-generation sequencing was used to analyze expression across the transcriptome (RNA-seq), in combination with conventional microbiological and chemical analysis. L. plantarum consumed the malic acid present in all the conditions evaluated, with a slight delay and impaired growth for nitrogen limitation and for anaerobiosis. Comparison of L. plantarum transcriptome during growth in GJM with and without O2 revealed differential expression of 148 functionally annotated genes, which were mostly involved in carbohydrate metabolism, genetic information processing, and signaling and cellular processes. In particular, genes with a protective role against oxidative stress and genes related to amino acid metabolism were differentially expressed. This study confirms the suitability of L. plantarum IWBT B063 to carry out MLF in different environmental conditions due to its potential adaption to the stress conditions tested and provides a better understanding of the genetic background of an industrially relevant strain.

1. Introduction

Transformation of grape must in wine is a multifaceted process from a microbiological point of view, with a succession of different groups of microorganisms, more or less adapted to specific conditions throughout the course of winemaking. Lactic acid bacteria (LAB) are among the most relevant groups, mainly responsible for carrying out malolactic fermentation (MLF). The decarboxylation of L-malic acid to L-lactic acid is relevant in most red wines and some white wines as well, where it contributes to deacidification, microbial stability, and aroma complexity [1,2,3].
The main LAB species involved in MLF belong to the genera Oenococcus, Lactobacillus sensu lato, Leuconostoc, and Pediococcus. More recently, particularly Lactiplantibacillus plantarum (formerly Lactobacillus plantarum [4]) has gained increased attention from researchers and winemakers, with proven suitability to drive this process [2,5]. The principal sensory effect of LAB is the conversion of tart malic acid into the softer and rounder lactic acid, but other secondary metabolic reactions and enzymatic activities have also great impacts on wine aroma and flavor development [2,3].
Even with the inoculation of selected LAB starter cultures, the onset of MLF can be difficult to manage in some conditions. Multiple factors are held accountable for challenging the activity of LAB in winemaking conditions, of which the four best-studied are pH, sulfur dioxide (SO2), ethanol, and temperature. From these, SO2 in particular is added to must/wine due to its antioxidant and antimicrobial activity and is a potent inhibitor of LAB growth, especially the molecular form, in synergy with low pH and high temperature/ethanol. Nevertheless, less investigated factors have also to be considered, including yeast–LAB interactions, carbohydrates and organic acid content, phenolic compounds, inhibitory molecules, oxygen, and nitrogen availability [5,6].
LAB, usually developing in wine, are aerotolerant, fermentative bacteria, and MLF is minimally exposed to air to prevent oxidation and the growth of spoilage organisms. Availability of oxygen could influence bacterial growth, malolactic activity, carbon and nitrogen utilization, and the activity of other enzymes, impacting on wine properties. Certain compounds in wine can only be metabolized by LAB in the presence of oxygen, such as certain intermediates in the citric acid metabolic pathway [7,8]. Furthermore, research has demonstrated that some LAB strains could show advantageous industrial and biotechnological traits when exposed to conditions which promote aerobic and/or respiratory growth [9].
In addition, LAB need nitrogen for various vital functions. The most frequent sources are free amino acids and small peptides, present at varying concentrations depending on the grape variety and winemaking practices. Moreover, these nitrogen sources could be exhausted by yeasts during alcoholic fermentation and inhibit MLF. LAB are very fastidious in their amino acid requirements [1,2], although the exact quantities required for adequate growth and metabolism are still unclear and need further investigation [10].
Recent astounding progress in the -omics sciences made available a great level of knowledge regarding the diversity of LAB in winemaking and the mechanisms involved in many metabolic processes [11,12,13]. In particular, transcriptomics could help to elucidate the molecular basis behind the impacts of medium nutritional composition on growth and fermentation performance [14]. Among these approaches, RNA-seq uses high-efficiency sequencing of complementary DNAs (cDNAs) reverse-transcribed from RNAs to detect and compare whole-genome gene expression. It has many advantages compared to microarray technology, such as rapidness, high precision, and reproducibility, as RNA-seq does not require probe sequences and also has a greater dynamic range for measuring very low or very high gene expression levels [15,16]. The power of RNA-seq has been demonstrated in transcriptomics studies with a diverse array of bacteria [17,18], including L. plantarum [19,20,21], although none of these are related to MLF.
Regarding wine-associated microorganisms, RNA-seq was used to study Saccharomyces cerevisiae under different fermentation conditions [22,23,24], as well as Torulaspora delbrueckii [25], Hanseniaspora vineae [26], and Brettanomyces bruxellensis [27]. Studies focused on wine LAB are still scarce; a few investigations have dealt with Oenococcus oeni [16,28], but, to the best of our knowledge, this is the first report of RNA-seq analysis with wine-associated L. plantarum during MLF.
Hence, the aim of this study was to investigate transcriptional and metabolic changes in a L. plantarum strain during exposure to oxygen in medium with different nitrogen nutrient concentrations under controlled conditions using a bioreactor system. Besides the transcriptomic analysis through RNA-seq technology, cellular growth and malic acid degradation were determined during MLF in a synthetic grape juice medium. Data obtained will help to elucidate how aeration and nitrogen availability impact the gene expression level and how this could relate to changes in wine composition. Ultimately, the goal is to provide new tools to enhance the management of MLF in wine.

2. Materials and Methods

2.1. Strain and Inoculum Preparation

The strain Lactiplantibacillus plantarum IWBT B063 (South African Grape and Wine Research Institute (SAGWRI) culture collection, Stellenbosch University, Stellenbosch, South Africa), conserved at −80 ℃ and routinely maintained on MRS agar (50 g/L MRS broth with 15 g/L bacteriological agar (Biolab Diagnostics, Wadeville, South Africa)) at 4 ℃, was cultured anaerobically at 30 ℃ without agitation in MRS broth (Biolab Diagnostics) for 48 h. Cells were harvested by centrifugation at 5000× g for 4 min, after reaching the stationary phase (approximately 1 × 10⁹ CFU/mL). Prior to inoculation, the cell pellet was washed twice with 0.9 % NaCl solution to remove any residual medium.

2.2. MLF Conditions

MLF was carried out in the grape juice medium (GJM) formulated by Henschke and Jiranek [29], with the following modifications: 115 g/L glucose, 115 g/L fructose, 0.46 g/L NH4Cl, 1 g/L cysteine. The composition of GJM is listed in Table 1. The pH was adjusted to 3.5 with KOH.
Preliminary lab-scale fermentations were performed in 80-mL flasks fully filled with medium, fitted with rubber stoppers equipped with a tube for gas injection and a CO2 outlet. IWBT B063 pre-culture was inoculated at 1 % v/v, to reach an initial viable population of 1 × 10⁷ CFU/mL. The trials consisted of a control (CTRL) under semi-aerobic conditions without gas addition, in a fully complemented medium, and two treatments: the first (N2) was injected with filtered N2 during the whole experiment to reach anaerobic conditions, in a fully complemented medium; the second (10%N) was semi-aerobic without gas addition, in a reduced medium containing 10% of the nitrogen nutrients cited in Table 1 (ammonium chloride and amino acid solution). All tests were conducted in duplicate, incubated at 25 ℃ under static conditions for 72 h. Uninoculated flasks were prepared to ensure the sterility of the trials and to monitor any changes in the medium.
A second set of MLF trials was carried out in 1.3-L fermenters (BioFlo 110; New Brunswick Scientific Company, Inc., Edison, NJ, USA), with a working volume of 1 L and with automated control of temperature, pH, and dissolved oxygen. They were filled with 2/3 volume and maintained at 25 °C under constant agitation at 200 rpm. Conditions regarding inoculation and medium preparation were the same as in the preliminary trials: CTRL, N2, and 10%N. Dissolved oxygen was maintained at 0% in the N2 condition, with sparging of filtered N2 during the whole experiment. All trials were done in duplicate, for a period of 72 h.

2.3. Analytical Methods

In the preliminary trials, cellular growth was followed throughout MLF by plating serial dilutions of samples on MRS agar medium (Biolab Diagnostics) and counting colonies after 4 days of anaerobic incubation at 30 ℃ using anaerobic jars with Anaerocult™ A (Merck, Darmstadt, Germany). L-malic acid concentrations were measured every 8 h with the automated enzymatic analyzer (Konelab Arena 20XT; Thermo Electron Corporation, Joensuu, Finland) using an L-malic acid enzymatic kit (EnzytecTM Liquid L-malate Id-No: E8280, Roche, R-Biopharm, Darmstadt, Germany). MLF was considered complete when L-malic acid concentrations decreased below 0.1 g/L.
In the fermenters, samples for viable cell counts and L-malic acid quantification were aseptically taken every 12 h, until the end of cultivation (72 h), and measured as described for the preliminary trials. L-lactic acid was quantified at 72 h, with the automated enzymatic analyzer (Konelab Arena 20XT) and specific kit (EnzytecTM Liquid L-lactate Id-No: E8260, Roche, R-Biopharm). Volatile aroma profile was analyzed through gas chromatography coupled to the flame ionization detection (GC–FID) method, after injection of samples prepared using liquid–liquid extraction, as described by Louw et al. [30]. Quantification was carried out using 4-methyl-2-pentanol (Fluka, Buchs, Switzerland) as internal standard.

2.4. RNA Sampling and Extraction

At the mid-exponential phase of cellular growth (24 h), samples for RNA extraction (20 mL) were collected from the fermenters. They were stabilized using RNAprotect® bacterial reagent (Qiagen, Hilden, Germany), following the manufacturer’s instructions, and cells were rapidly harvested by centrifugation (8000× g, 4 °C, 10 min), flash-frozen in liquid nitrogen, and stored at −80 °C until RNA isolation. Total RNA extraction followed the protocol of Miller et al. [31]. RNA samples were then diluted on DEPC-treated water to a concentration of 100 ng/μL, purified with the Turbo DNA-free kit (Thermo Fisher Scientific, Waltham, MA, USA), according to the manufacturer’s instructions, and maintained at −80 °C. Nucleic acid yield, purity, and integrity were preliminarily checked with the NanoDrop ND1000 UV–Vis Spectrophotometer (Thermo Fisher Scientific, Waltham, MA, USA) and by electrophoresis run in a 2100 Bioanalyzer (Agilent Technologies, Santa Clara, CA, USA). Integrity was standardized with the RNA Integrity Number (RIN), in a range from 10 (intact) to 1 (totally degraded) [32].

2.5. RNA Sequencing and Data Processing

Quality check, cDNA preparation, library preparation, and sequencing were performed by BaseClear Group (Leiden, The Netherlands). Single-end sequence reads were generated using the Illumina HiSeq2500 system and quality of the FASTQ sequences was enhanced by trimming off low-quality bases using the “Trim sequences” option of the CLC Genomics Workbench version 9.5.1 (Qiagen, Hilden, Germany). Quality-filtered sequence reads were used for further analysis. Alignment against the reference genome of L. plantarum IWBT B063 and calculation of expression values were performed using the “RNA-Seq” option in CLC Genomics Workbench. Selected expression measure was the RPKM. It is defined as the reads per kilobase of exon model per million mapped reads [33] and seeks to normalize the difference in the number of mapped reads between samples as well as the transcript length. It is given by dividing the total number of exon reads by the number of mapped reads (in millions) times the exon length (in kilobases).
Differentially expressed genes annotated as coding hypothetical proteins on the reference genome of L. plantarum IWBT B063 were further manually annotated through targeted RAST [34] and BLASTx analysis.

2.6. Statistical Analysis

Growth functions and consumption kinetics were fitted to the cellular growth and malic acid consumption data of all experiments, for both lab-scale and fermenter trials. For the analysis of cellular growth in CFU, it was assumed that growth follows the logistics Equation (1):
d X t d t = μ m a x × X t ( 1 X t / K )
with X t biomass in CFU, μ m a x maximal specific growth rate that would be obtained at saturating substrate concentrations, and K the carrying capacity of the medium. The biomass data were fitted to the solution of the ordinary differential Equation (1) given in Equation (2):
X t = K × X 0 X 0 + ( K X 0 ) E μ m a x × t
Consumption of malic acid was fitted to a kinetic rate equation. For this, two types of equations were used, a Michaelis–Menten type of equation with biomass as multiplier (3), or a mass action type of Equation (4), when not all parameters were identifiable:
d S t d t = X t × V M × S t S t + K M
d S t d t = X t × k × S t
with S t the malic acid concentration (g/L), V M the maximal specific malic acid consumption rate (g/L/108 CFU/h), K M the Michaelis–Menten constant (g/L), k the specific rate constant (1/h/108 CFU).
Data from chemical analysis were compared in the software PAST [35] by one-way ANOVA (analysis of variance) and post-hoc Tukey’s HSD (honestly significant difference) test, with a threshold for statistical significance set at p-value < 0.05.
Statistical analysis of RNA-seq data was performed by BaseClear Group and included the comparison of expression values, using Kal’s Z-test [36] in the “Expression analysis” option with the CLC Genomics Workbench version 9.5.1 (Qiagen). Kal’s Z-test is the choice in cases where a single sample is compared to another single sample (no biological replicates). The test relies on an approximation of the binomial distribution by the normal distribution. Considering proportions rather than raw counts, the test is also suitable in situations where the sum of counts is different between the samples. For all tests, the null hypothesis was that there would be no difference in expression between the two samples.

3. Results and Discussion

Among the many factors that knowingly affect the growth and activity of LAB in wine, in this study, the four most important were set at favorable conditions for growth: pH at 3.5, 25 °C, 0% ethanol, and without SO2. Several studies considered the effects of these stress conditions and applied different recombinant and non-recombinant techniques to improve LAB tolerance to these harsh wine environments [37]. In contrast, the present investigation aimed to challenge a L. plantarum strain with two less-studied conditions, complete anaerobiosis and starvation of nitrogen-based nutrients, assayed separately. Medium simulated a co-inoculation strategy, when LAB are inoculated at the beginning of or during the first 48 h of alcoholic fermentation in grape must. Even selected well-studied starters, such as IWBT B063, could face problems during MLF. It is thus encouraged to test them in varying conditions to better understand the metabolism and propose new innovative strategies for fermentation management [6].

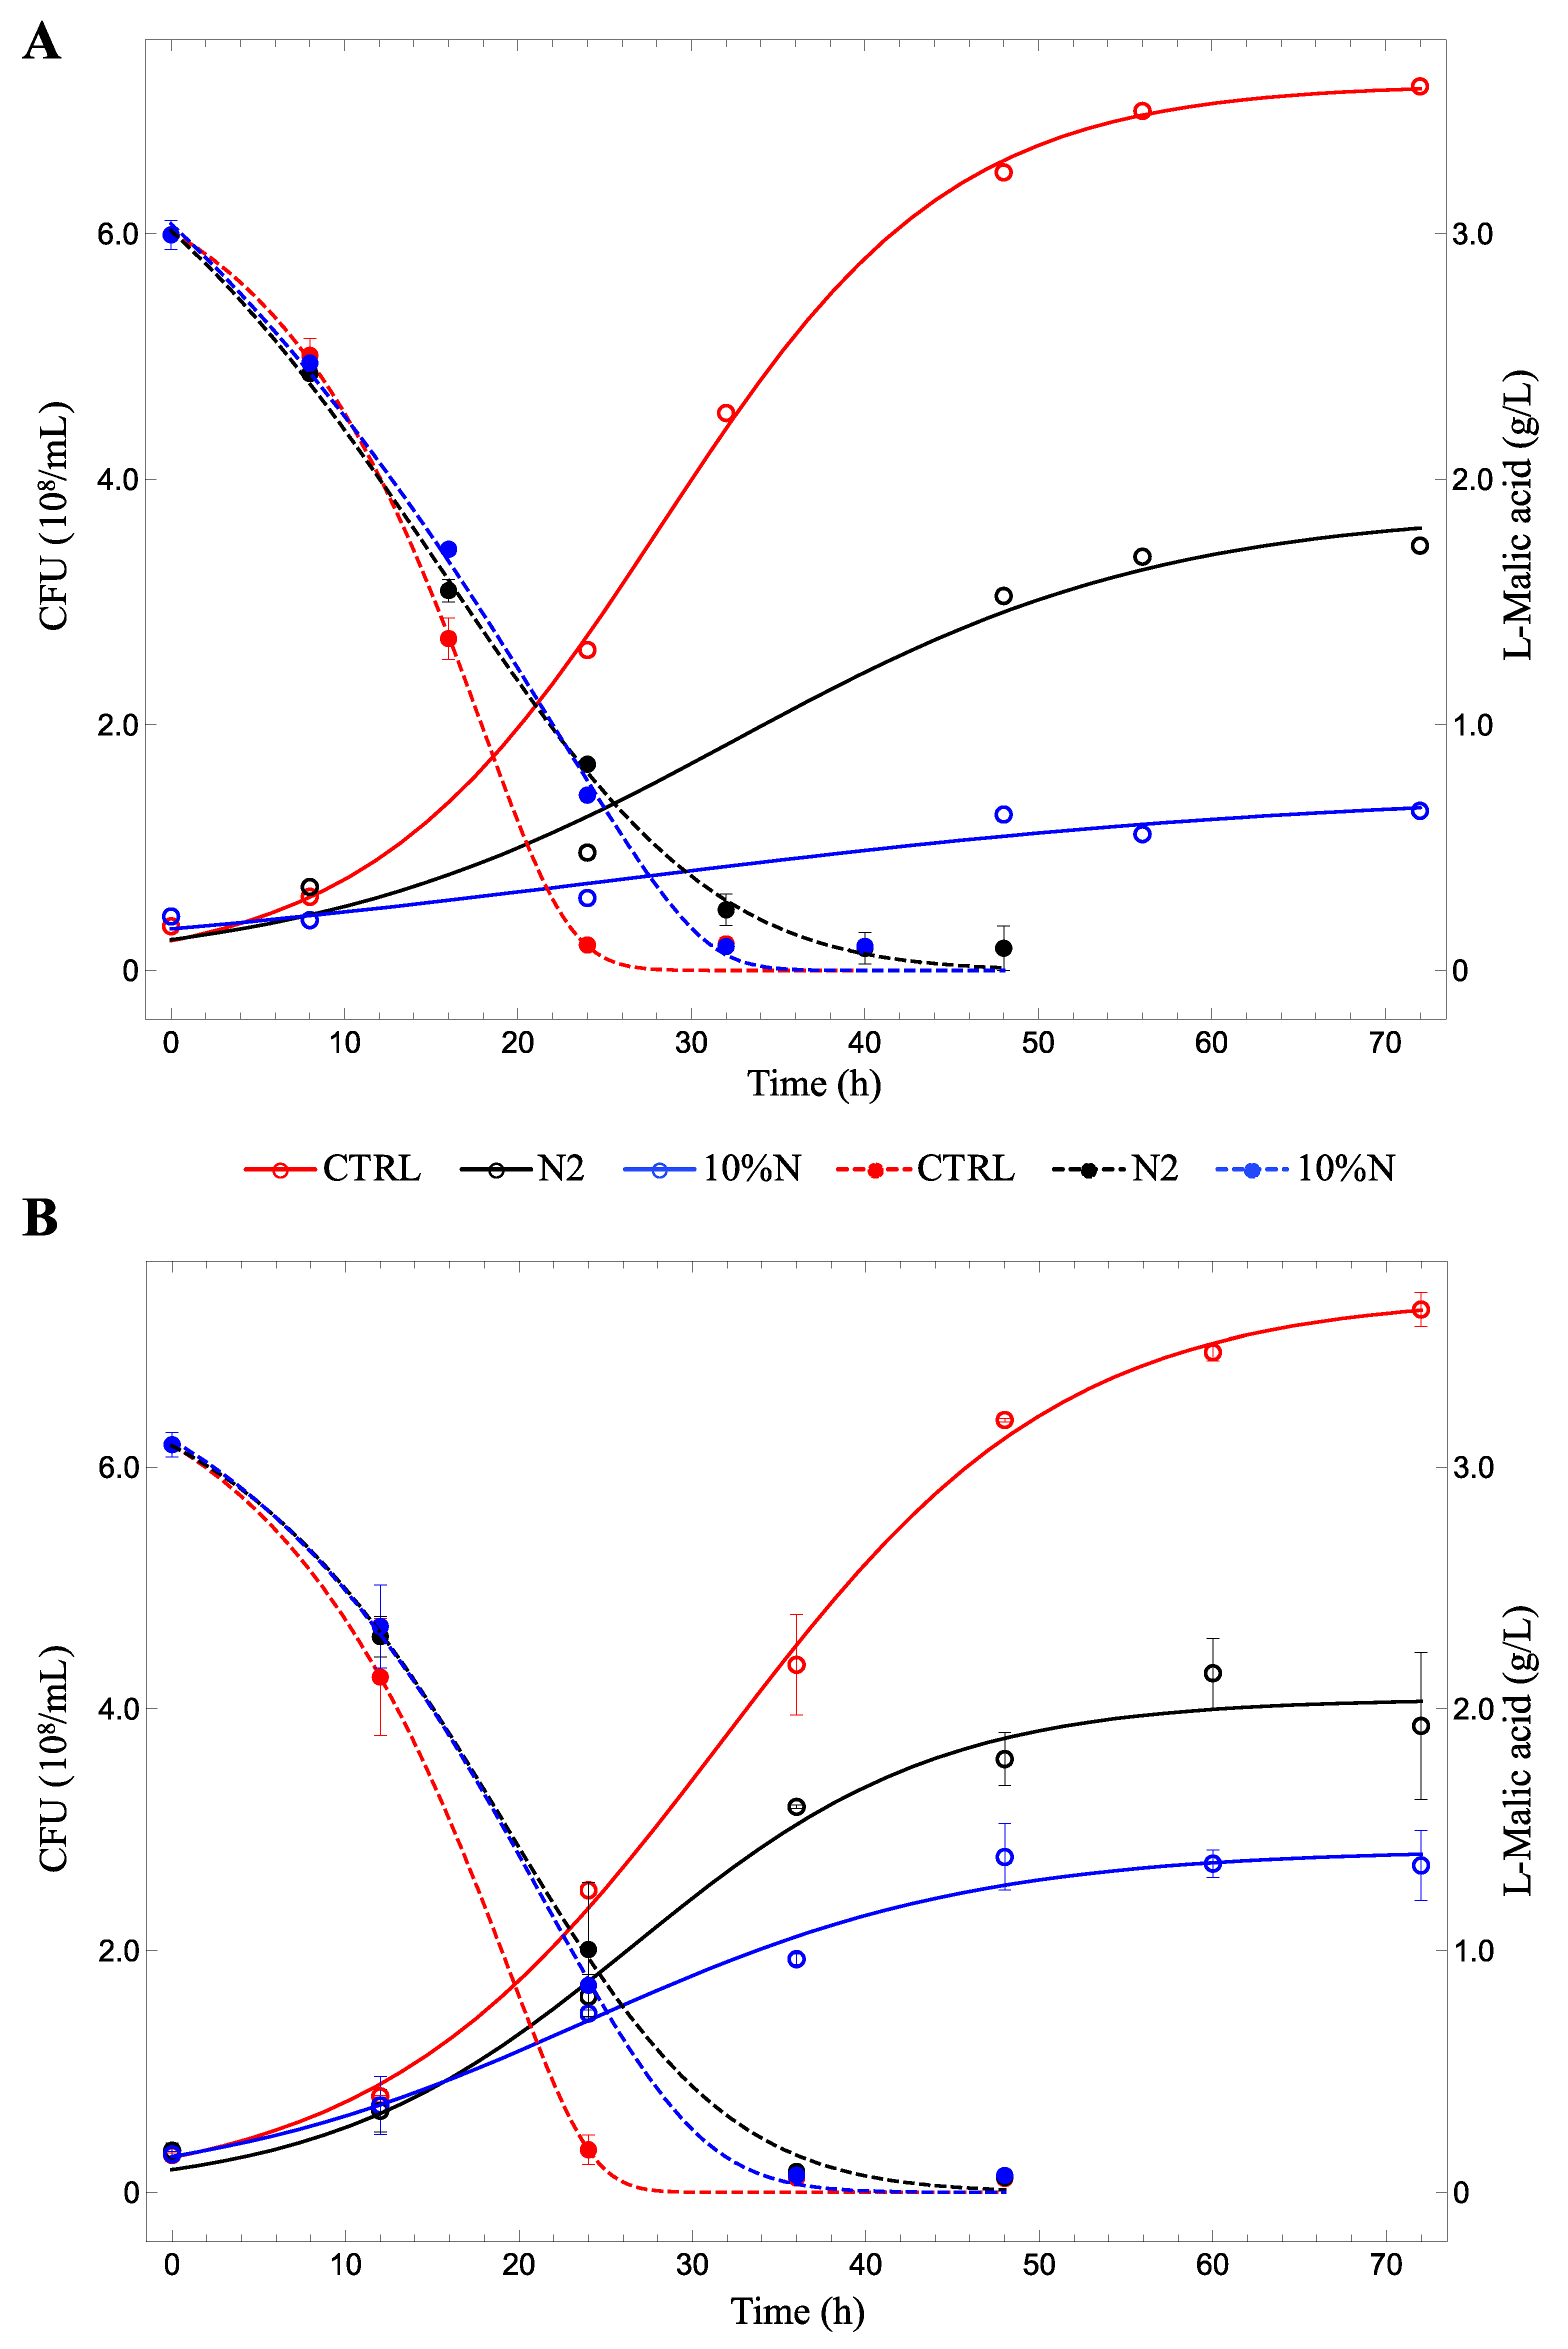
3.1. Lab-Scale Fermentations

The initial L. plantarum IWBT B063 population was around 4 × 10⁷ CFU/mL (Figure 1A, solid lines). After the first 8 hours of growth, different growth curves were observed in the three conditions tested. In the control (CTRL), with semi-aerobic conditions and non-limiting nutrient concentration, IWBT B063 showed the best growth, reaching the stationary phase after 50 h. Strict anaerobic conditions (N2) resulted in a negative response for cell development, as growth was restrained compared with CTRL. However, cells were most affected in the ten-fold reduction of nitrogen nutrients (10%N), where a lower biomass concentration was observed throughout the whole experiment. Whereas the overall biomass formed is different for the three conditions, this is mostly due to a lower carrying capacity, i.e., the reduced growth rate is caused by the limiting substrate concentration in the medium, not by the maximal specific growth rate (Table 2). The effects of nitrogen on LAB metabolism have been reviewed by several authors, and the results obtained here confirm its importance [10,38,39].
L-malic acid consumption was in accordance with cell growth results (Figure 1A, dashed lines). The concentration decreased more markedly in CTRL, and L-malic acid was completely consumed after 24 h. The other two conditions showed similar curves, albeit slower than the control.
Both experimental conditions tested, anaerobiosis and limitation of nitrogen nutrients, significantly affected the biomass production and this resulted in differences in the malic acid consumption of L. plantarum IWBT B063. The same conditions were replicated in 1.3-L fermenters to confirm the results at a larger scale with a higher overall biomass, which was necessary for RNA and transcriptome analysis.

3.2. Fermenters

Regarding cell populations (Figure 1B, solid lines), the two conditions displayed lower growth when compared with CTRL. The initial cell concentration in all fermenters was around 3.5 × 10⁷ CFU/mL. Cells in CTRL were in the early stationary phase after 72 h at a concentration above 7 × 10⁸ CFU/mL. The anaerobic condition (N2) was less difficult than the limitation of nitrogen nutrients (10%N), but the difference was less marked than in the preliminary trials. The IWBT B063 cell concentration in 10%N was slightly increased, reaching approximately 3 × 10⁸ CFU/mL. In another study [40], a different wine-associated L. plantarum strain from the SAGWRI culture collection was inoculated in the same synthetic medium, but at an initial concentration ten times smaller than in the present study, around 4 × 10⁶ CFU/mL. The authors also observed considerable growth, finding cell counts of approximately 4 × 10⁷ CFU/mL after two days and above 108 CFU/mL after five days.
The only modifications of MLF settings in fermenters with respect to the preliminary trials were upscaling, from 80 to around 800 mL, and medium agitation, at 200 rpm. As expected, very similar results were obtained for the lab-scale and the fermenter set-ups. The growth functions could describe the growth data well, with the fitted parameter values obtained for the different conditions listed in Table 2. For the different media and aeration strategies, very similar results were obtained in terms of maximal specific growth rates. The strongest effect was observed for the carrying capacity parameter, i.e., the final biomass concentration reached, which was the highest for the control, intermediate for N2, and the lowest in the 10%N condition.
L-malic acid consumption (Figure 1B, dashed lines) confirmed the patterns observed in the preliminary lab-scale fermentations. A faster decrease occurred in CTRL, where the initial 3.0 g/L was almost completely exhausted after 24 h, while in N2 and 10%N, around 1.0 g/L was still present. After 36 h, L-malic acid concentrations dropped below 0.1 g/L in all conditions. Good fits were also found for the equations describing the malolactic conversion, and there was no significant effect of the different fermentation vessels and conditions in the preliminary trials compared with fermenters. The specific malic acid consumption rate, calculated with Equations (3) and (4), was normalized for the biomass concentration. Over the first 10 h of the fermentation, a fairly constant specific uptake rate was observed, independent of the culture conditions, i.e., −0.15 ± 0.01; −0.18 ± 0.03, and −0.16 ± 0.03 (g malic acid/L/h/(108 CFU)), respectively, for the control, N2, and 10%N conditions. Thus, it appears that the specific malic acid consumption rate was constant for the different conditions tested and the differences in the malolactic fermentations, as observed in Figure 1, can be related to the different biomass concentrations present.
L-lactic acid concentration and volatile compound profile were analyzed at the end of fermentation. A total of 32 volatile organic compounds were analyzed in GC–FID, but only six of them could be quantified above the detection limit in the trials. Nevertheless, concentrations of ethyl acetate (ranging between 2.918 and 2.882 mg/L), hexanoic acid (ranging between 0.154 and 0.143 mg/L), octanoic acid (ranging between 0.292 and 0.285 mg/L), and decanoic acid (ranging between 0.507 and 0.521 mg/L) were not significantly different between the trials. Only acetic acid, the volatile compound present at the highest concentration in all conditions, was produced in statistically different quantities. Acetoin levels were the same in CTRL and 10%N but could not be detected in N2. Therefore, these two metabolites are reported in Table 3 alongside L-lactic acid levels.
Production of L-lactic acid was significantly higher in CTRL than in N2 and 10%N, even though, in all conditions, the same initial L-malic acid concentration was completely consumed. Besides malolactic conversion, lactic acid can be produced from glucose and fructose present in the GJM in an energy-producing pathway. It is reasonable to expect a higher sugar consumption and consequent higher lactic acid production in CTRL, reflecting the higher growth observed in that condition, although, normally, only a small amount of sugar is fermented during MLF [8].
L. plantarum is an homofermentative LAB and thus metabolizes hexoses via the Embden–Meyerhof pathway, with pyruvate as the central branching point of metabolism [41]. In this metabolism, the fate of pyruvate is determined by the availability of oxygen and substrates. Lactate remains the major metabolite of homofermentative LAB growing aerobically or anaerobically, but aeration allows alternative routes, generating, for example, acetate and acetoin as minor products [41]. For instance, the presence of oxygen favors the conversion of pyruvate into acetoin and inhibits the conversion of acetoin to 2,3-butanediol [9], and it is well-established that the conversion of lactate to acetate can only occur during aerobic growth [42]. Indeed, besides lactate, the highest acetic acid level was found in CTRL, followed by 10%N and then N2, while acetoin was not produced at detectable amounts in N2, suggesting the importance of oxygen in this metabolic pathway.
Acetic acid, acetoin, 2,3-butanediol, and diacetyl could also be produced in L. plantarum metabolism from the breakdown of citrate. Although citric acid is present in smaller concentrations in must (0.1–1 g/L; 0.2 g/L in the GJM of the present study) compared to other organic acids, the metabolism of citrate can significantly impact the aromatic properties by releasing those carbonyl compounds, associated with the buttery aroma of wines [3,8,12]. Oxygen is among the several factors that can influence the conversion of diacetyl to acetoin and 2,3-butanediol in wine, alongside citrate and sugar concentration, temperature, SO2 content, pH, inoculation strategy, and strain of malolactic bacteria used [12].
In summary, the results showed that, although a reduced final biomass and related delayed completion of malate degradation were observed, neither of the two conditions tested was detrimental to IWBT B063 performance in comparison with the control. The maximal specific growth rate and specific malic acid consumption rate were fairly constant, and there was no loss of cell viability. Active growth was present in all conditions, reaching higher final concentrations than initial, and cells had surpassed 108 CFU/mL already 24 h after inoculation.
Consumption of L-malic acid commenced immediately in all trials, as expected for inoculation with high numbers of bacteria (above 107 CFU/mL), since it is usually reported that a viable population of 106 CFU/mL is required for starting MLF. In agreement with this survey, Nielsen and Richelieu [7] reported continued bacterial growth after exhaustion of malic acid in semi-aerobic conditions, while cell count remained stable after MLF completion in anaerobiosis. Faster malate degradation, as in CTRL, is expected in rapidly growing cultures, but continued bacterial growth after the end of MLF could lead to acetic acid production if sugar is still available [8].

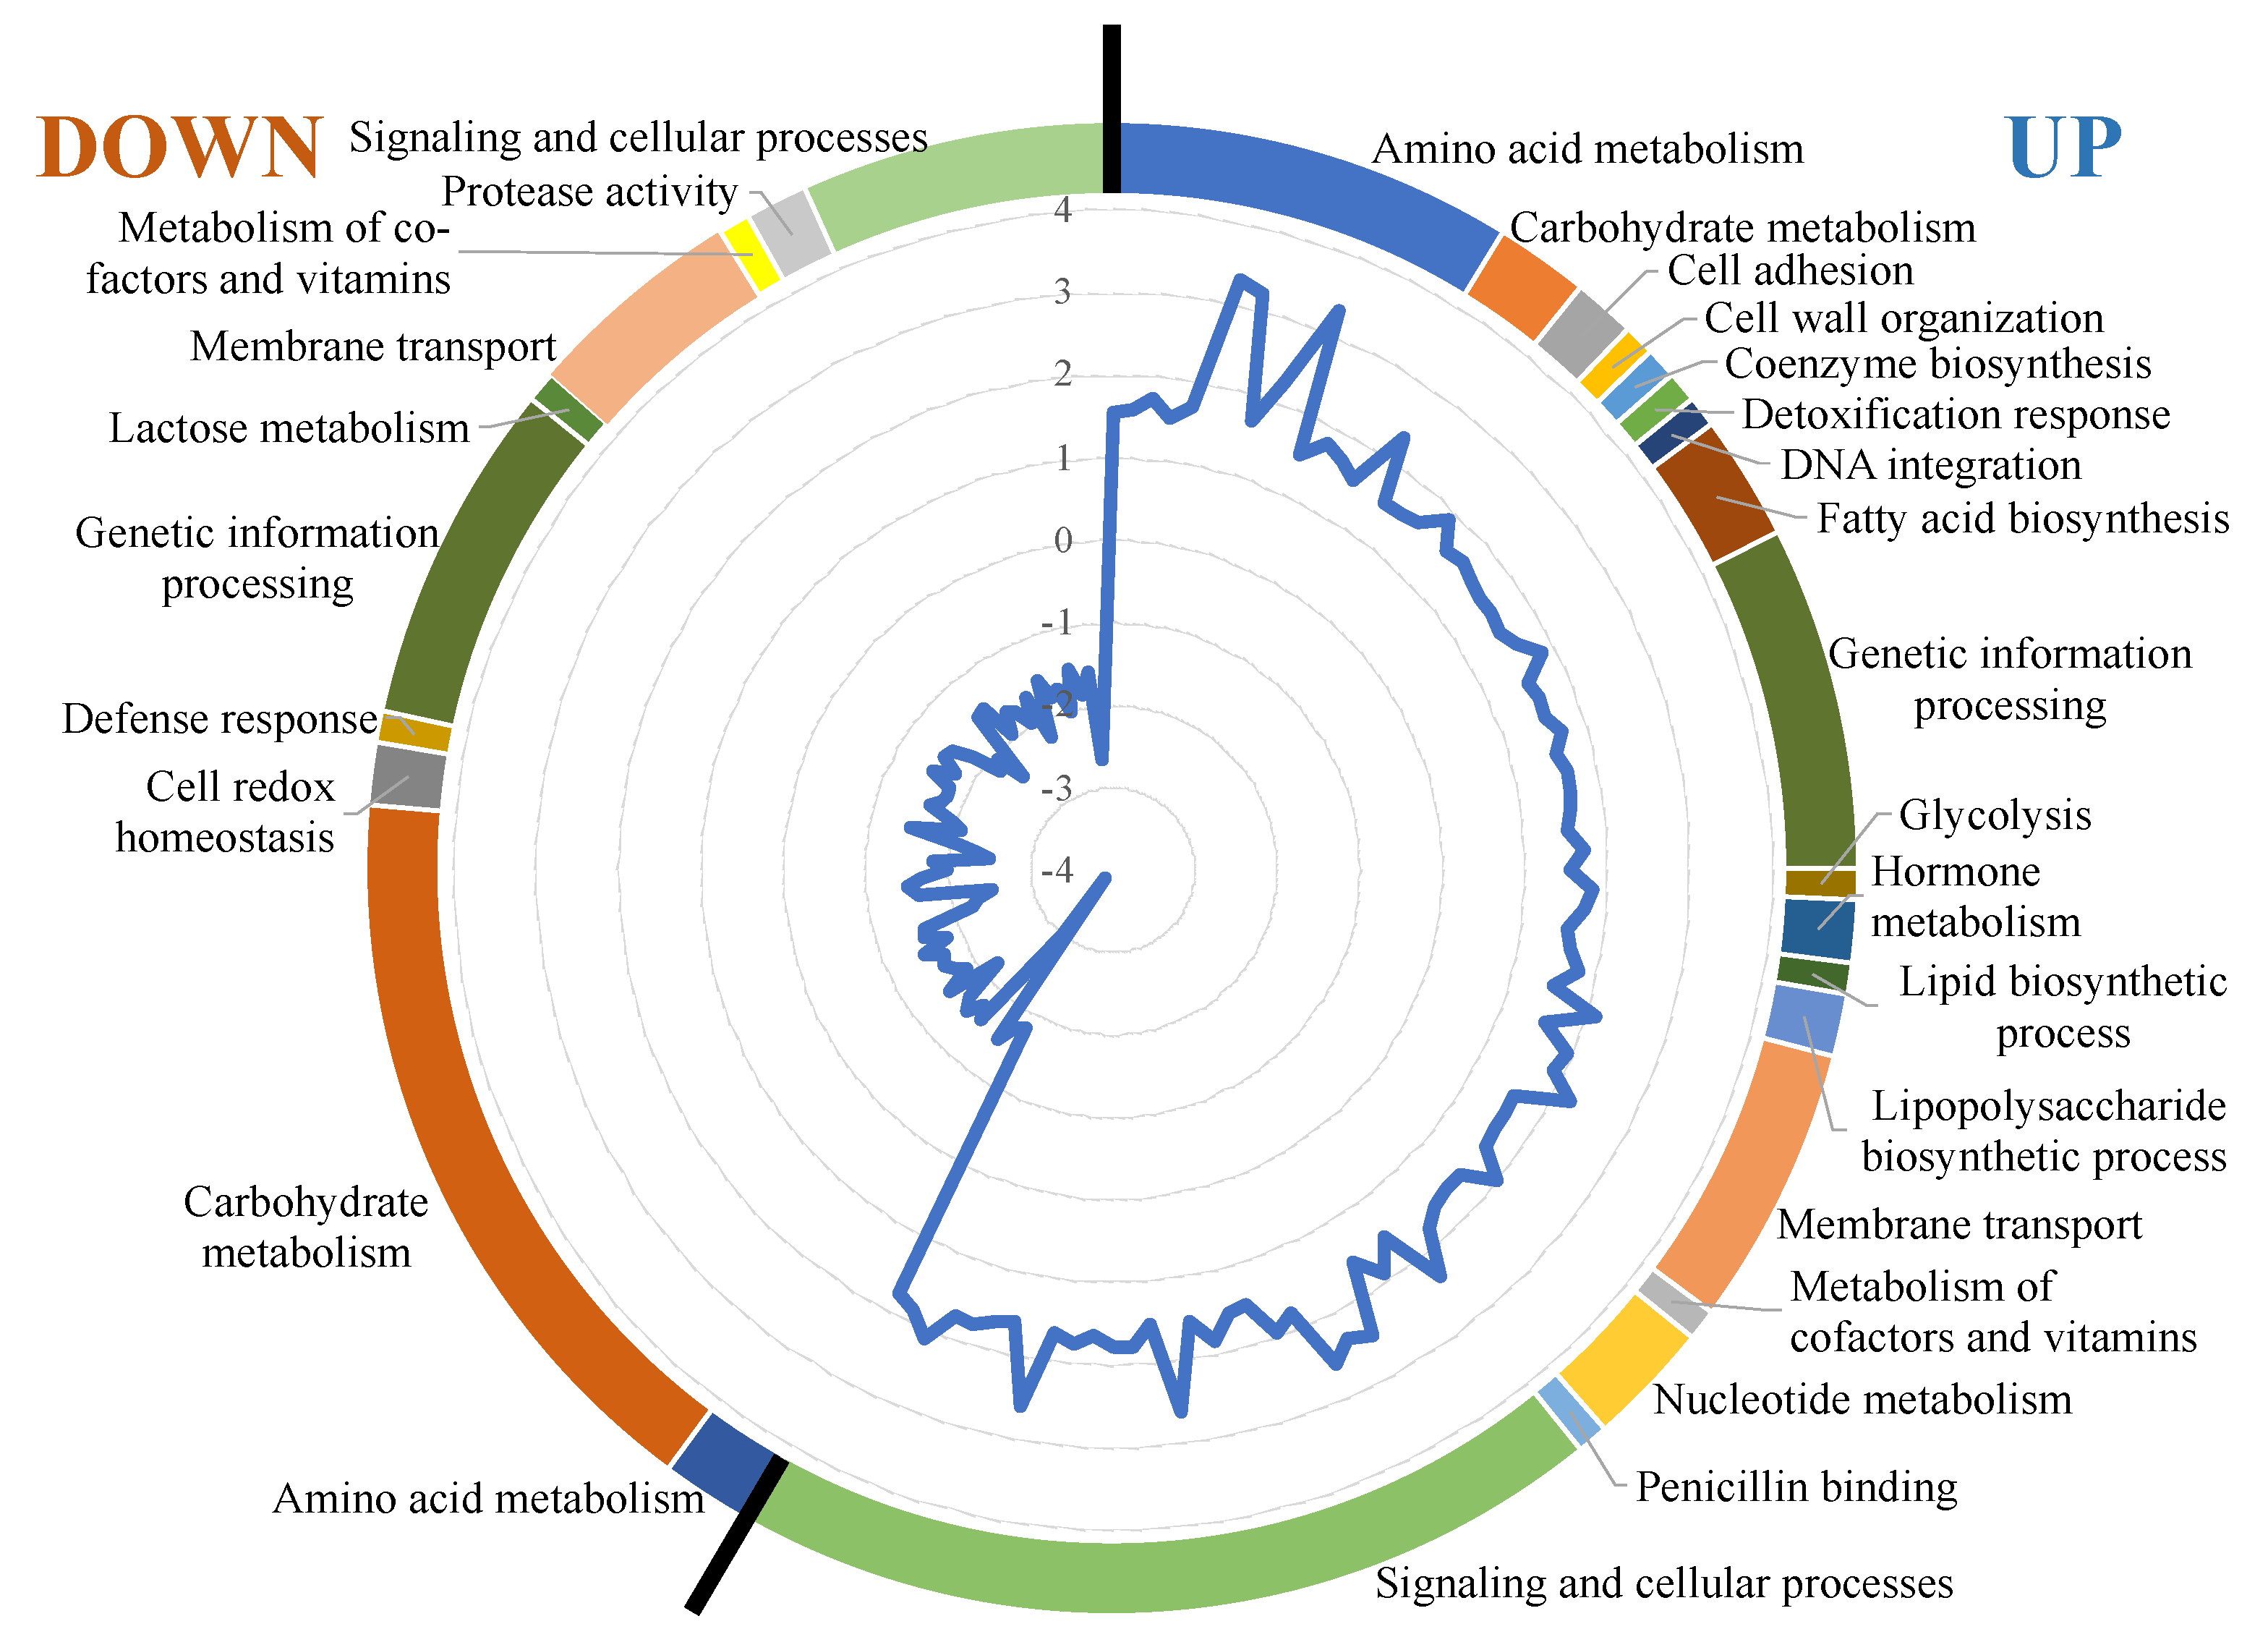
3.3. Transcriptional Response

RNA-seq technology was used to analyze the differential gene expression of L. plantarum IWBT B063 among MLF trials with different growing conditions. RNA samples, isolated at the mid-exponential phase of cellular growth, were firstly assessed for their quality before sequencing. The integrity of RNA has fundamental importance for the success of gene expression measurement techniques. To achieve a higher RNA concentration and integrity, it was necessary to prepare a pool with both replicates of each condition. RNA isolated from CTRL and N2 showed an RIN of 8.1 and 7.5, respectively. However, RIN for the condition 10%N was 3.3, which was insufficient for the collection of valid and meaningful results. Therefore, RNA-seq analysis was performed in the conditions of complete anaerobiosis (N2) and the control (CTRL).
The number of sequencing reads recovered was 32.6 million in CTRL and 34.8 million in N2, both with an average Phred quality score of 38.5, indicating approximately 99.99% base call accuracy for the sequencing. Reads were mapped into L. plantarum IWBT B063 genome, containing 3385 genes. Gene expression was quantified as RPKM, with a mean value of 468.94 in CTRL and 454.53 in N2. Considering a threshold of 1.5-fold for differential expression, 299 genes were selected (8.8% of total), 169 of them upregulated and 130 downregulated in N2 compared to CTRL. Annotation of differentially expressed genes (DEG) allowed us to classify 148 of them into functional categories, 86 up- and 62 downregulated (Figure 2). Among upregulated genes, the most represented categories were amino acid metabolism, genetic information processing, membrane transport, and signaling and cellular processes. Genes involved in these last three categories were also highly present in downregulated genes, but carbohydrate metabolism was predominant.
Narrowing the analysis to increased or decreased gene expression of at least twofold, 29 genes were upregulated (Table 4) and 28 downregulated (Table 5) in response to anaerobic conditions.
In aerobic conditions, it is expected to see an induction of genes that encode enzymes catalyzing the removal of toxic compounds formed by the presence of oxygen [43]. Previous studies with L. plantarum strains showed the presence of genes coding for NADH peroxidase (NPR; npr1, npr2) and for NADH oxidase (NOX; nox1, nox2, nox3, nox4, nox5, nox6). The NOX/NPR system is involved in oxygen tolerance mechanisms by preventing oxygen accumulation and contributes to the maintenance of the NADH/NAD+ balance by promoting cofactor regeneration [9]. It was shown that npr2 and nox5 are the principal genes from this system that are upregulated during aerobic growth [42,44]. In the present study, only npr2 and nox6 were downregulated in L. plantarum IWBT B063 in the anaerobic growth condition.
During anaerobic fermentation, cofactor recycling (NADH/NAD+) to maintain the redox balance could be provided through acetaldehyde/ethanol production from acetyl-CoA via aldehyde-alcohol dehydrogenases (ADH) [9]. In the presence of oxygen, this pathway is inhibited and adh is downregulated [42]. However, here, the opposite was observed, where adhE1 and adhE2 were both significantly less expressed in the anaerobic growth condition. This could be related to the timing of sample collection for RNA-seq analysis. At 24 h, MLF was almost finished in the aerobic conditions, while the cells in the anaerobic conditions were still using malic acid. Thus, glucose was not being metabolized in N2. Moreover, Echave et al. [45] proposed that, even if ADHE activity is much lower in aerobic conditions than anaerobiosis, the enzyme is also present in the latter and, in Escherichia coli, has a protective role against oxidative stress.
Besides adhE, also the genes manXYZ, related to the mannose phosphotransferase system (PTS) putatively involved in glucose transport, were downregulated in N2, reinforcing the idea that glucose-induced overexpression did not occur during the mid-exponential phase of growth in the anaerobic fermentation [46]. Similarly to adhE, it has also been previously indicated that the mannose PTS can enhance oxidative stress tolerance, observed in L. plantarum [47]. A further group of genes that can improve oxidative stress tolerance includes copA and copB, which modulate copper homeostasis in L. plantarum cells and play a role in H2O2-detoxifying mechanisms [48]. They were both downregulated in N2 compared to CTRL. Anaerobic conditions were also characterized by a downregulation of a putative L-lactate dehydrogenase, which could be related, upon validation, to the diacetyl production within this environment: in fact, previous studies revealed that upregulated L-lactate dehydrogenase in O. oeni could enable L-lactic acid to be utilized as a precursor for the production of diacetyl during malolactic fermentation in Cabernet Sauvignon wine [28].
Among the upregulated genes in the anaerobic conditions, it is interesting to note four genes related to amino acid metabolism (cysE, cysM, lysN, metB). Overexpression of genes implicated in amino acid biosynthesis—in this case, the serine family and aspartate family—might have a positive influence on the pathways leading to the production of volatile flavor compounds by increasing the generation of aromatic precursors [43]. Moreover, genes associated with the oligopeptide ABC transport system (oppA and dtpT) were also overexpressed, strongly suggesting active peptide uptake [49]. Thus, the oxygen levels during MLF could not only influence LAB growth and malolactic activity but also impact the flavor formation in wine, which could be further investigated through sensory analysis.
As observed in the curves of biomass growth and malic acid consumption, the differences in MLF activity are related to the different biomass concentrations, rather than the specific malic acid consumption rate. Indeed, the gene mle coding for the malolactic enzyme was not differentially expressed between the aerobic and anaerobic conditions. In another study, Miller et al. [31] described that mle expression was modulated by the pH and ethanol content of the fermentation media, increasing at lower pH and decreasing in the presence of ethanol.
Interestingly, upregulated genes include also putative prophage proteins and traits encoding putative defense proteins (i.e., resistance protein to glycopeptides). In this framework, it has been observed that L. plantarum strains can adapt to MRS medium via the power of genes coding for phage- and prophage-related proteins, which can help the bacterial response to various stressors as active loci [50,51]. Further, the overexpression of putative hydrolases in anaerobic conditions compared to aerobic growth confirmed the ability of L. plantarum to utilize several carbohydrate sources in different environments, thus remarkably reflecting the adaptation capacity of this species [52].

4. Conclusions

Aeration control and grape must composition are of major importance for successful completion of MLF, due to their relevant impact on LAB development. L. plantarum IWBT B063 was able to carry out MLF under challenging conditions, but anaerobic conditions and limitation of nitrogen nutrients reduced its growth in grape juice medium, delaying the completion of MLF.
Using RNA-seq for the first time to monitor a L. plantarum strain during MLF, it was possible to identify 86 upregulated and 62 downregulated genes comparing the absence vs. presence of oxygen in grape juice medium. In particular, genes with a protective role against oxidative stress and genes related to amino acid metabolism were differentially expressed.
This study highlights the usefulness of RNA-seq technology to detect the transcriptional response of LAB and the genetic impact under specific stressful or suboptimal environmental conditions, which otherwise would not be underlined by the standard wine parameters. The results could give insights for further studies aiming to understand the fine-tuning of important parameters affecting the success of LAB starter cultures and malolactic activity in wine.

Author Contributions

Conceptualization, M.D.T., R.L.B., S.T.; methodology, R.L.B.; formal analysis, R.L.B.; investigation, R.L.B., E.S.; mathematical analysis, J.L.S.; resources, M.D.T.; writing—original draft preparation, R.L.B.; writing—review and editing, R.L.B., M.D.T., J.L.S., E.S., S.T.; supervision, S.T.; funding acquisition, S.T. All authors have read and agreed to the published version of the manuscript.

Funding

PhD scholarship of R.L.B. was funded by Conselho Nacional de Desenvolvimento Científico e Tecnológico (CNPq, Brazil), grant number GDE 202265/2015-3. The short-stay at Stellenbosch University was funded by a CooperInt grant (Action 4/2016) from the University of Verona. J.L.S. acknowledges funding from the DST/NRF, particularly for funding the SARCHI initiative (NRF-SARCHI-82813).

Data Availability Statement

Data supporting the reported results are available upon request to the authors.

Acknowledgments

Authors would like to thank Arrie Arends and the fermentation facility at Stellenbosch University for assistance with setting up the fermenter trials and making the fermentation equipment available, Hugh Jumat and Lynn Engelbrecht for quantification of volatile compounds, Alessia Mori for RNA integrity analysis, and Wilson J. F. Lemos Junior for annotation of RNA sequencing.

Conflicts of Interest

The authors declare no conflict of interest.

References

  1. Lerm, E.; Engelbrecht, L.; du Toit, M. Malolactic Fermentation: The ABC’s of MLF. S. Afr. J. Enol. Vitic. 2016, 31, 186–212. [Google Scholar] [CrossRef] [Green Version]
  2. Du Toit, M.; Engelbrecht, L.; Lerm, E.; Krieger-Weber, S. Lactobacillus: The Next Generation of Malolactic Fermentation Starter Cultures—An Overview. Food Bioprocess. Technol. 2010, 4, 876–906. [Google Scholar] [CrossRef]
  3. Belda, I.; Ruiz, J.; Esteban-Fernández, A.; Navascués, E.; Marquina, D.; Santos, A.; Moreno-Arribas, M.V. Microbial Contribution to Wine Aroma and Its Intended Use for Wine Quality Improvement. Molecules 2017, 22, 189. [Google Scholar] [CrossRef] [Green Version]
  4. Zheng, J.; Wittouck, S.; Salvetti, E.; Franz, C.M.A.P.; Harris, H.M.B.; Mattarelli, P.; O’Toole, P.W.; Pot, B.; Vandamme, P.; Walter, J.; et al. A taxonomic note on the genus Lactobacillus: Description of 23 novel genera, emended description of the genus Lactobacillus Beijerinck 1901, and union of Lactobacillaceae and Leuconostocaceae. Int. J. Syst. Evol. Microbiol. 2020, 70, 2782–2858. [Google Scholar] [CrossRef]
  5. Krieger-Weber, S.; Heras, J.M.; Suarez, C. Lactobacillus plantarum, a New Biological Tool to Control Malolactic Fermentation: A Review and an Outlook. Beverages 2020, 6, 23. [Google Scholar] [CrossRef] [Green Version]
  6. Lombardi, S.J.; Pannella, G.; Iorizzo, M.; Testa, B.; Succi, M.; Tremonte, P.; Sorrentino, E.; di Renzo, M.; Strollo, D.; Coppola, R. Inoculum Strategies and Performances of Malolactic Starter Lactobacillus plantarum M10: Impact on Chemical and Sensorial Characteristics of Fiano Wine. Microorganisms 2020, 8, 516. [Google Scholar] [CrossRef] [Green Version]
  7. Nielsen, J.C.; Richelieu, M. Control of Flavor Development in Wine during and after Malolactic Fermentation by Oenococcus oeni. Appl. Environ. Microbiol. 1999, 65, 740–745. [Google Scholar] [CrossRef] [PubMed] [Green Version]
  8. Bartowsky, E.J.; Henschke, P.A. The ‘buttery’ attribute of wine—diacetyl—desirability, spoilage and beyond. Int. J. Food Microbiol. 2004, 96, 235–252. [Google Scholar] [CrossRef] [PubMed]
  9. Zotta, T.; Parente, E.; Ricciardi, A. Aerobic metabolism in the genus Lactobacillus: Impact on stress response and potential applications in the food industry. J. Appl. Microbiol. 2017, 122, 857–869. [Google Scholar] [CrossRef] [PubMed] [Green Version]
  10. Remize, F.; Gaudin, A.; Kong, Y.; Guzzo, J.; Alexandre, H.; Krieger, S.; Guilloux-Benatier, M. Oenococcus oeni preference for peptides: Qualitative and quantitative analysis of nitrogen assimilation. Arch. Microbiol. 2006, 185, 459–469. [Google Scholar] [CrossRef]
  11. Melkonian, C.; Gottstein, W.; Blasche, S.; Kim, Y.; Abel-Kistrup, M.; Swiegers, H.; Saerens, S.; Edwards, N.; Patil, K.R.; Teusink, B.; et al. Finding Functional Differences Between Species in a Microbial Community: Case Studies in Wine Fermentation and Kefir Culture. Front. Microbiol. 2019, 10, 1347. [Google Scholar] [CrossRef] [Green Version]
  12. Pretorius, N.; Engelbrecht, L.; Du Toit, M. Influence of sugars and pH on the citrate metabolism of different lactic acid bacteria strains in a synthetic wine matrix. J. Appl. Microbiol. 2019, 127, 1490–1500. [Google Scholar] [CrossRef]
  13. Reverón, I.; Plaza-Vinuesa, L.; Santamaría, L.; Oliveros, J.C.; Rivas, B.D.L.; Muñoz, R.; de Felipe, F.L. Transcriptomic Evidence of Molecular Mechanisms Underlying the Response of Lactobacillus plantarum WCFS1 to Hydroxytyrosol. Antioxidants 2020, 9, 442. [Google Scholar] [CrossRef]
  14. Barbosa, C.; Mendes-Faia, A.; Lage, P.; Mira, N.P.; Mendes-Ferreira, A. Genomic expression program of Saccharomyces cerevisiae along a mixed-culture wine fermentation with Hanseniaspora guilliermondii. Microb. Cell Factories 2015, 14, 1–17. [Google Scholar] [CrossRef] [Green Version]
  15. Wang, Z.; Gerstein, M.; Snyder, M. RNA-Seq: A revolutionary tool for transcriptomics. Nat. Rev. Genet. 2009, 10, 57–63. [Google Scholar] [CrossRef]
  16. Liu, L.; Zhao, H.; Peng, S.; Wang, T.; Su, J.; Liang, Y.; Li, H.; Wang, H. Transcriptomic Analysis of Oenococcus oeni SD-2a Response to Acid Shock by RNA-Seq. Front. Microbiol. 2017, 8, 1586. [Google Scholar] [CrossRef] [PubMed]
  17. Güell, M.; van Noort, V.; Yus, E.; Chen, W.-H.; Leigh-Bell, J.; Michalodimitrakis, K.; Yamada, T.; Arumugam, M.; Doerks, T.; Kühner, S.; et al. Transcriptome Complexity in a Genome-Reduced Bacterium. Science 2009, 326, 1268–1271. [Google Scholar] [CrossRef] [PubMed]
  18. Sharma, C.M.; Hoffmann, S.; Darfeuille, F.; Reignier, J.; Findeiss, S.; Sittka, A.; Chabas, S.; Reiche, K.; Hackermüller, J.; Reinhardt, R.; et al. The primary transcriptome of the major human pathogen Helicobacter pylori. Nat. Cell Biol. 2010, 464, 250–255. [Google Scholar] [CrossRef] [PubMed]
  19. Leimena, M.M.; Wels, M.; Bongers, R.S.; Smid, E.J.; Zoetendal, E.G.; Kleerebezem, M. Comparative Analysis of Lactobacillus plantarum WCFS1 Transcriptomes by Using DNA Microarray and Next-Generation Sequencing Technologies. Appl. Environ. Microbiol. 2012, 78, 4141–4148. [Google Scholar] [CrossRef] [PubMed] [Green Version]
  20. Chen, C.; Wang, L.; Lu, Y.; Yu, H.; Tian, H. Comparative Transcriptional Analysis of Lactobacillus plantarum and Its ccpA-Knockout Mutant Under Galactooligosaccharides and Glucose Conditions. Front. Microbiol. 2019, 10, 1584. [Google Scholar] [CrossRef] [PubMed]
  21. Sun, D.; Li, H.; Song, D.; Zhang, L.; Zhao, X.; Xu, X. Genome, transcriptome and fermentation analyses of Lactobacillus plantarum LY-78 provide new insights into the mechanism of phenyllactate biosynthesis in lactic acid bacteria. Biochem. Biophys. Res. Commun. 2019, 519, 351–357. [Google Scholar] [CrossRef] [PubMed]
  22. Rossouw, D.; du Toit, M.; Bauer, F.F. The impact of co-inoculation with Oenococcus oeni on the trancriptome of Saccharomyces cerevisiae and on the flavour-active metabolite profiles during fermentation in synthetic must. Food Microbiol. 2012, 29, 121–131. [Google Scholar] [CrossRef]
  23. Shekhawat, K.; Patterton, H.; Bauer, F.F.; Setati, M.E. RNA-seq based transcriptional analysis of Saccharomyces cerevisiae and Lachancea thermotolerans in mixed-culture fermentations under anaerobic conditions. BMC Genom. 2019, 20, 1–15. [Google Scholar] [CrossRef] [Green Version]
  24. Li, J.; Zhu, K.; Zhao, H. Transcriptome analysis reveals the protection mechanism of proanthocyanidins for Saccharomyces cerevisiae during wine fermentation. Sci. Rep. 2020, 10, 1–12. [Google Scholar] [CrossRef] [Green Version]
  25. Tronchoni, J.; Curiel, J.A.; Morales, P.; Torres-Pérez, R.; Gonzalez, R. Early transcriptional response to biotic stress in mixed starter fermentations involving Saccharomyces cerevisiae and Torulaspora delbrueckii. Int. J. Food Microbiol. 2017, 241, 60–68. [Google Scholar] [CrossRef]
  26. Giorello, F.; Valera, M.J.; Martin, V.; Parada, A.; Salzman, V.; Camesasca, L.; Fariña, L.; Boido, E.; Medina, K.; Dellacassa, E.; et al. Genomic and Transcriptomic Basis of Hanseniaspora vineae’s Impact on Flavor Diversity and Wine Quality. Appl. Environ. Microbiol. 2018, 85, 01959-18. [Google Scholar] [CrossRef] [PubMed] [Green Version]
  27. Valdetara, F.; Škalič, M.; Fracassetti, D.; Louw, M.; Compagno, C.; du Toit, M.; Foschino, R.; Petrovič, U.; Divol, B.; Vigentini, I. Transcriptomics unravels the adaptive molecular mechanisms of Brettanomyces bruxellensis under SO2 stress in wine condition. Food Microbiol. 2020, 90, 103483. [Google Scholar] [CrossRef]
  28. Sternes, P.R.; Costello, P.J.; Chambers, P.J.; Bartowsky, E.J.; Borneman, A.R. Whole transcriptome RNAseq analysis of Oenococcus oeni reveals distinct intra-specific expression patterns during malolactic fermentation, including genes involved in diacetyl metabolism. Int. J. Food Microbiol. 2017, 257, 216–224. [Google Scholar] [CrossRef] [PubMed]
  29. Henschke, P.A.; Jiranek, V. Yeasts-metabolism of nitrogen compounds. In Wine Microbiology and Biotechnology; Fleet, G.H., Ed.; Harwood Academic: Chur, Switzerland, 1993; pp. 77–164. [Google Scholar]
  30. Louw, L.; Tredoux, A.; van Rensburg, P.; Kidd, M.; Naes, T.; Nieuwoudt, H. Fermentation-derived Aroma Compounds in Varietal Young Wines from South Africa. S. Afr. J. Enol. Vitic. 2016, 31, 213–225. [Google Scholar] [CrossRef] [Green Version]
  31. Miller, B.J.; Franz, C.M.A.P.; Cho, G.-S.; du Toit, M. Expression of the Malolactic Enzyme Gene (mle) from Lactobacillus plantarum Under Winemaking Conditions. Curr. Microbiol. 2011, 62, 1682–1688. [Google Scholar] [CrossRef]
  32. Schroeder, A.; Mueller, O.; Stocker, S.; Salowsky, R.; Leiber, M.; Gassmann, M.; Lightfoot, S.; Menzel, W.; Granzow, M.; Ragg, T. The RIN: An RNA integrity number for assigning integrity values to RNA measurements. BMC Mol. Biol. 2006, 7, 3. [Google Scholar] [CrossRef] [Green Version]
  33. Mortazavi, A.; Williams, B.A.; McCue, K.; Schaeffer, L.; Wold, B. Mapping and quantifying mammalian transcriptomes by RNA-Seq. Nat. Methods 2008, 5, 621–628. [Google Scholar] [CrossRef]
  34. Aziz, R.K.; Bartels, D.; Best, A.A.; deJongh, M.; Disz, T.; Edwards, R.A.; Formsma, K.; Gerdes, S.; Glass, E.M.; Kubal, M.; et al. The RAST Server: Rapid Annotations using Subsystems Technology. BMC Genom. 2008, 9, 75. [Google Scholar] [CrossRef] [Green Version]
  35. Hammer, Ø.; Harper, D.A.T.; Ryan, P.D. PAST: Paleontological statistics software package for education and data analysis. Palaeontol. Electron. 2001, 4, 1–9. [Google Scholar]
  36. Kal, A.J.; van Zonneveld, A.J.; Benes, V.; Berg, M.V.D.; Koerkamp, M.G.; Albermann, K.; Strack, N.; Ruijter, J.M.; Richter, A.; Dujon, B.; et al. Dynamics of Gene Expression Revealed by Comparison of Serial Analysis of Gene Expression Transcript Profiles from Yeast Grown on Two Different Carbon Sources. Mol. Biol. Cell 1999, 10, 1859–1872. [Google Scholar] [CrossRef] [PubMed]
  37. Betteridge, A.; Grbin, P.; Jiranek, V. Improving Oenococcus oeni to overcome challenges of wine malolactic fermentation. Trends Biotechnol. 2015, 33, 547–553. [Google Scholar] [CrossRef] [PubMed]
  38. Bell, S.-J.; Henschke, P.A. Implications of nitrogen nutrition for grapes, fermentation and wine. Aust. J. Grape Wine Res. 2005, 11, 242–295. [Google Scholar] [CrossRef]
  39. Lytra, G.; Miot-Sertier, C.; Moine, V.; Coulon, J.; Barbe, J.-C. Influence of must yeast-assimilable nitrogen content on fruity aroma variation during malolactic fermentation in red wine. Food Res. Int. 2020, 135, 109294. [Google Scholar] [CrossRef] [PubMed]
  40. Du Toit, S.C.; Rossouw, D.; du Toit, M.; Bauer, F.F. Enforced Mutualism Leads to Improved Cooperative Behavior between Saccharomyces cerevisiae and Lactobacillus plantarum. Microorganisms 2020, 8, 1109. [Google Scholar] [CrossRef]
  41. Gänzle, M.G. Lactic metabolism revisited: Metabolism of lactic acid bacteria in food fermentations and food spoilage. Curr. Opin. Food Sci. 2015, 2, 106–117. [Google Scholar] [CrossRef]
  42. Bron, P.A.; Wels, M.; Bongers, R.S.; Veen, H.V.B.-V.D.; Wiersma, A.; Overmars, L.; Marco, M.L.; Kleerebezem, M. Transcriptomes Reveal Genetic Signatures Underlying Physiological Variations Imposed by Different Fermentation Conditions in Lactobacillus plantarum. PLoS ONE 2012, 7, e38720. [Google Scholar] [CrossRef] [PubMed] [Green Version]
  43. Larsen, N.; Moslehi-Jenabian, S.; Werner, B.B.; Jensen, M.L.; Garrigues, C.; Vogensen, F.K.; Jespersen, L. Transcriptome analysis of Lactococcus lactis subsp. lactis during milk acidification as affected by dissolved oxygen and the redox potential. Int. J. Food Microbiol. 2016, 226, 5–12. [Google Scholar] [CrossRef] [PubMed]
  44. Mazzeo, M.F.; Cacace, G.; Peluso, A.; Zotta, T.; Muscariello, L.; Vastano, V.; Parente, E.; Siciliano, R.A. Effect of inactivation of ccpA and aerobic growth in Lactobacillus plantarum: A proteomic perspective. J. Proteom. 2012, 75, 4050–4061. [Google Scholar] [CrossRef] [PubMed]
  45. Echave, P.; Tamarit, J.; Cabiscol, E.; Ros, J. Novel Antioxidant Role of Alcohol Dehydrogenase E from Escherichia coli. J. Biol. Chem. 2003, 278, 30193–30198. [Google Scholar] [CrossRef] [PubMed] [Green Version]
  46. Andreevskaya, M.; Johansson, P.; Jääskeläinen, E.; Rämö, T.; Ritari, J.; Paulin, L.; Björkroth, J.; Auvinen, P. Lactobacillus oligofermentans glucose, ribose and xylose transcriptomes show higher similarity between glucose and xylose catabolism-induced responses in the early exponential growth phase. BMC Genom. 2016, 17, 1–18. [Google Scholar] [CrossRef] [PubMed] [Green Version]
  47. Stevens, M.J.A.; Molenaar, D.; de Jong, A.; de Vos, W.M.; Kleerebezem, M. Involvement of the Mannose Phosphotransferase System of Lactobacillus plantarum WCFS1 in Peroxide Stress Tolerance. Appl. Environ. Microbiol. 2010, 76, 3748–3752. [Google Scholar] [CrossRef] [PubMed] [Green Version]
  48. Yang, Y.; Yin, J.; Liu, J.; Xu, Q.; Lan, T.; Ren, F.; Hao, Y. The Copper Homeostasis Transcription Factor CopR Is Involved in H2O2 Stress in Lactobacillus plantarum CAUH2. Front. Microbiol. 2017, 8, 2015. [Google Scholar] [CrossRef] [Green Version]
  49. Huang, T.; Xiong, T.; Peng, Z.; Xiao, Y.-S.; Liu, Z.-G.; Hu, M.; Xie, M.-Y. Genomic analysis revealed adaptive mechanism to plant-related fermentation of Lactobacillus plantarum NCU116 and Lactobacillus spp. Genomics 2020, 112, 703–711. [Google Scholar] [CrossRef] [PubMed]
  50. Filannino, P.; de Angelis, M.; di Cagno, R.; Gozzi, G.; Riciputi, Y.; Gobbetti, M. How Lactobacillus plantarum shapes its transcriptome in response to contrasting habitats. Environ. Microbiol. 2018, 20, 3700–3716. [Google Scholar] [CrossRef]
  51. Wang, X.; Kim, Y.; Ma, Q.; Hong, S.H.; Pokusaeva, K.; Sturino, J.M.; Wood, T.K. Cryptic prophages help bacteria cope with adverse environments. Nat. Commun. 2010, 1, 147. [Google Scholar] [CrossRef] [Green Version]
  52. Delgado, S.; Flórez, A.B.; Guadamuro, L.; Mayo, B. Genetic and biochemical characterization of an oligo-α-1,6-glucosidase from Lactobacillus plantarum. Int. J. Food Microbiol. 2017, 246, 32–39. [Google Scholar] [CrossRef] [PubMed] [Green Version]
Figure 1. Fitted curves of the growth dynamics of L. plantarum IWBT B063 (solid lines) and malic acid evolution (dashed lines) during lab-scale (A) and fermenter (B) different MLF trials: CTRL, control; N2, anaerobiosis; 10%N, ten-fold reduction of nitrogen nutrients. Error bars are standard deviations of two independent replicates.
Fermentation 07 00068 g001
Figure 2. Functional annotation and fold-change of differentially expressed genes (DEG; |fold-change| > 1.5) in L. plantarum IWBT B063 at mid-exponential growth in MLF fermenter trials, under anaerobic conditions (N2), compared to the control (CTRL).
Fermentation 07 00068 g002
Table 1. Chemical composition of grape juice medium (GJM), simulating standard grape juice, slightly modified from previous descriptions [29].
GroupComponentAmount per Litre
Carbon SourcesGlucose115 g
Fructose115 g
AcidsPotassium L-Tartrate Monobasic2.5 g
L-Malic acid3 g
Citric acid0.2 g
SaltsPotassium phosphate dibasic (K2HPO4)1.14 g
Magnesium sulphate heptahydrate (MgSO4.7H2O)1.23 g
Calcium chloride dihydrate (CaCl2.2H2O)0.44 g
Nitrogen SourcesAmmonium chloride (NH4Cl) 0.46 g
Amino acids (prepared as 100X stock solution in 20 g/L NaHCO3 buffer solution)
-Tyrosine0.014 g
-Tryptophane0.137 g
-Isoleucine0.025 g
-Aspartic acid0.034 g
-Glutamic acid0.092 g
-Arginine0.286 g
-Leucine0.037 g
-Threonine0.058 g
-Glycine0.014 g
-Glutamine0.386 g
-Alanine0.111 g
-Valine0.034 g
-Methionine0.024 g
-Phenylalanine0.029 g
-Serine0.060 g
-Histidine0.025 g
-Lysine0.013 g
-Cysteine1 g
-Proline0.468 g
Trace Elements (prepared as 100X stock solution)Manganese(II) chloride tetrahydrate (MnCl2.4H2O)200 µg
Zinc(II) chloride (ZnCl2)135 µg
Iron(II) chloride (FeCl2)30 µg
Copper(II) chloride (CuCl2)15 µg
Boric acid (H3BO3)5 µg
Cobalt(II) nitrate hexahydrate (Co(NO3)2.6H2O)30 µg
Sodium molybdate dihydrate (NaMoO4.2H2O)25 µg
Potassium iodate (KIO3)10 µg
Vitamins (prepared as 100X stock solution)Myo-inositol100 mg
Pyridoxine hydrochloride2 mg
Nicotinic acid2 mg
Calcium pantothenate1 mg
Thiamin hydrochloride0.5 mg
PABA.K0.2 mg
Riboflavin0.2 mg
Biotin0.125 mg
Folic acid0.2 mg
Anaerobic Factors (prepared as 10X stock solution in hot 96% EtOH)Ergosterol10 mg
Tween 800.5 mL
Table 2. Maximal specific growth rate (µmax) and carrying capacity of the medium (K) for the fitted growth equations during lab-scale and fermenter different MLF trials with L. plantarum IWBT B063, under different conditions: CTRL, control; N2, anaerobiosis; 10%N, ten-fold reduction of nitrogen nutrients. Data reported as the average ± standard deviation of two independent replicates.
ParameterLab-ScaleFermenter
CTRLN210%NCTRLN210%N
µmax (h−1)0.12 ± 0.010.08 ± 0.020.05 ± 0.020.10 ± 0.010.11 ± 0.020.09 ± 0.02
K (108 CFU)7.22 ± 0.103.75 ± 0.391.47 ± 0.377.41 ± 0.144.08 ± 0.182.84 ± 0.14
Table 3. Metabolite levels at the end of MLF trials in fermenters with L. plantarum IWBT B063, under different conditions: CTRL, control; N2, anaerobiosis; 10%N, ten-fold reduction of nitrogen nutrients. Data reported as the average ± standard deviation of two independent replicates. Different letters indicate statistically significant variation among growth conditions (p < 0.05).
CompoundConditionSignificance
CTRLN210%N
L-lactic acid (g/L)2.273 ± 0.001a1.951 ± 0.077b1.892 ± 0.055bp = 4.21 × 10⁻⁶
Acetic acid (g/L)0.137 ± 0.006a0.073 ± 0.007c0.087 ± 0.001bp = 0.01124
Acetoin (mg/L)15.492 ± 0.985n.d.15.499 ± 0.114
n.d. = not detected.
Table 4. Upregulated genes (fold-change > 2.0) in L. plantarum IWBT B063 at mid-exponential growth in MLF fermenter trials, under anaerobic conditions (N2), compared to the control (CTRL).
GeneFunctionCategoryFold-Change
adeCAdenine deaminaseNucleotide metabolism2.00
argOarginine transmembrane transporter activitySignaling and cellular processes2.31
csbC_3Major facilitator superfamily proteinMembrane transport2.11
cycA_2Cyclin-A2-4Signaling and cellular processes2.46
cysESerine acetyltransferaseAmino acid metabolism3.33
cysMCysteine synthase BAmino acid metabolism3.23
dtpT_1Amino acid/peptide transporter (Peptide:H+ symporter)Signaling and cellular processes2.35
dtpT_2Di-/tripeptide transporterSignaling and cellular processes2.56
licB_1Protein LicBCarbohydrate metabolism2.31
lysNLysNAmino acid metabolism2.28
metBmetBAmino acid metabolism3.31
oppA_4Oligopeptide-binding proteinSignaling and cellular processes2.61
sdcSSodium-dependent dicarboxylate transporter SdcSSignaling and cellular processes2.57
yjeM-Membrane transport2.20
ywqD_2Cytokinin riboside 5’-monophosphate phosphoribohydrolaseSignaling and cellular processes2.11
S_00258Putative protein of unknown functionNrdR-regulated deoxyribonucleotide transporter, PnuC-like2.33
S_00271Putative protein of unknown function 3.81
S_00272Extracellular protein 3.83
S_00273Putative protein of unknown function 2.80
S_00282Putative protein of unknown function 2.11
S_01162Sulfotransferase/hypothetical protein 2.33
S_01534Putative protein of unknown function 2.09
S_01773Putative protein of unknown function 2.44
S_01864Putative protein of unknown function 2.50
S_02063Prophage proteinMobilome: prophages and transposons2.11
S_02789Hydrolases of the alpha/beta superfamily 2.24
S_02790HTH_MerR-SF transcriptional regulator Transcription2.33
S_02820Glycopeptide antibiotic-resistance protein 2.06
S_03325Putative protein of unknown function 3.06
Table 5. Downregulated genes (fold-change < −2.0) in L. plantarum IWBT B063 at mid-exponential growth in MLF fermenter trials, under anaerobic conditions (N2), compared to the control (CTRL).
GeneFunctionCategoryFold-Change
adhE_1Aldehyde-alcohol dehydrogenaseCarbohydrate metabolism−3.87
adhE_2Aldehyde-alcohol dehydrogenaseCarbohydrate metabolism−3.01
asnS_1Asparagine–tRNA ligaseGenetic information processing−2.10
bceA_2Bacitracin export ATP-binding protein BceASignaling and cellular processes−2.23
copA_1Metal transporting atpase Mta72Membrane transport−2.19
copBCopBMembrane transport−2.06
davT5-aminovalerate aminotransferase DavTCarbohydrate metabolism−2.22
dppE_2Dipeptide-binding protein DppEMembrane transport−2.41
lrgBAntiholin-like protein LrgBSignaling and cellular processes−2.03
manX_1EIIAB-ManCarbohydrate metabolism−2.23
manY-Carbohydrate metabolism−2.32
manZManZ proteinCarbohydrate metabolism−2.51
nox_6-Cell redox homeostasis−2.50
npr_2Regulatory protein NPR2Defense response−2.11
yhdG_3Putative amino acid permease YhdGSignaling and cellular processes−2.64
yodC_3-Cell redox homeostasis−2.34
S_00347L-lactate dehydrogenaseCarbohydrate metabolism−2.24
S_02279MSF transporter −2.27
S_02428Putative protein of unknown function −2.04
S_02979MSF sugar transporters −2.20
S_03213Putative protein of unknown function −2.03
S_03235LtrC-like protein, unknown function −2.01
S_03252Putative protein of unknown function −2.04
S_03253ATP-binding protein −2.13
S_03254Putative protein of unknown function −2.11
S_03255Putative protein of unknown function −2.14
S_03256Putative protein of unknown function −2.43
S_03399DNA topoisomerase III Replication, recombination, and repair−2.12
Publisher’s Note: MDPI stays neutral with regard to jurisdictional claims in published maps and institutional affiliations.

