Abstract
A two-phase closed thermosyphon (TPCT), a gravity-assisted heat pipe, is a highly efficient heat transmitter involving liquid–vapor phase change. It is used in many applications, including heat spreading, thermal management and control, and energy saving. The main objective of this study is to investigate the effects of the operating conditions for a thermosyphon used in solar water heaters. The study particularly focuses on the influence of the inclination angle. Thus, a comprehensive simulation model is developed using the volume of fluid (VOF) approach. Complex and related phenomena, including two-phase flow, phase change, and heat exchange, are taken into account. To implement the model, an open-source CFD toolbox based on finite volume formulation, OpenFOAM, is used. The model is then validated by comparing numerical results to the experimental data from the literature. The obtained results show that the simulation model is reliable for investigating the effects of various operating conditions on the transient and steady-state behavior of the thermosyphon. In fact, bubble creation, growth, and advection can be tracked correctly in the liquid pool at the evaporator. The effects of the designed operating conditions on the heat transfer parameters are also discussed. In particular, the optimal tilt angle is shown to be 60° for the intermediate saturation temperature (<50 °C) and 90° for the larger saturation temperature (>60 °C).
1. Introduction
To take advantage of solar power in heating applications, evacuated tube solar water heaters are prominently used [1]. There is indeed a substantial need for substituting fossil resources with renewable and sustainable energy means. Many countries throughout the world have set goals for their energy infrastructure development in order to limit greenhouse gas emissions [2].
Improving the global efficiency and optimizing the operation of solar devices, such as water heaters, are then actual challenges. Incorporation of heat pipes (particularly, the two-phase closed thermosyphons; TPCTs) in the collector has been shown to significantly enhance the solar water performance [3].
A TPCT is a highly efficient heat transmitter involving liquid–vapor phase change: at the evaporator section, the liquid is evaporated due to the absorbed heat. The vapor flows then through an adiabatic region to the condenser, where it condenses, releasing heat to relatively cold media [4]. Taking advantage of the gravity, the liquid falls back to the evaporator in a Nusselt-like liquid film. Fundamentally, the evaporator, involving a liquid pool, is placed in the TPCT bottom.
Many experimental and numerical studies on thermosyphons have been conducted to estimate the heat transfer characteristics and to describe the two-phase flow patterns under various operating conditions. The TPCT is commonly installed vertically, but most of the previous investigations indicate that the inclination angle is an important parameter to take into account. It is indeed expected to have a significant effect on the TPCT’s heat transfer capability.
Jafari et al. [5] discussed the factors influencing the heat transfer performance of thermosyphons. They reported that the working fluid, the tilt angle, and the filling ratio are important parameters affecting the performance and the internal flow patterns of the TPCT. Arat et al. [6] experimentally investigated the effects of the fluid volume and the inclination angle on the heat transfer coefficients in the condenser and the evaporator sections. For various vacuum pressure values, they also concluded that the lowest thermal resistance was obtained for a near-vertical position (a tilt angle of 90°). Lataoui et al. [7] conducted an experimental study on the effect of the operating conditions (the working fluid, the filling ratio, the temperature, and the heat input) on the thermal performance of a TPCT. They showed that the heat transfer coefficient in the evaporator could be well predicted in comparison with the analytical correlations, especially for an overfilled evaporator configuration and for low heat fluxes. Critical and optimal tilt angles of a TPCT were experimentally investigated by Gou et al. [8]. The obtained results showed that the critical tilt angle was 45° for all the operating conditions. The optimal angle was 60° for a saturation temperature ranging between 80 and 150 °C and 90° for higher temperatures (150–185 °C). Kim et al. [9] also conducted an experimental study to examine the effects of the filling ratio and the tilt angle on the boiling and condensation heat transfer within a water/copper TPCT. The best thermal performance was obtained at a tilt angle of 30° and a filling ratio of 50%. A core tube monitoring TPCT has been developed and tested by Wang et al. [10]. The experimental results showed that the thermal resistance is more affected by the tilt angle in the evaporator than in the condenser. The best heat transfer performance was obtained for a 10° tilt angle. More recently, Li et al. [11] conducted an experimental and numerical study to characterize the transient thermal and flow behavior of a TPCT for various filling ratios. Based on the calculation of the net vapor production, the temperature and pressure distribution and the startup time were accurately predicted, the overall error being within 10%.
Shabgard et al. [12] developed a mathematical model to investigate the effect of the filling ratio on the transient thermal behavior of a vertical TPCT. They found that the optimally filled thermosyphon provided, at the same time, the smallest thermal resistance and the shortest thermal response time. A slight increase in the input power would trigger, however, the dry-out at the evaporator section, though.
A computational model of the TPCT was undertaken by Ahmed et al. [13] to examine the effects of a wide range of operating conditions, namely, the filling ratio, the inclination tilt, and the power input. They concluded that the developed methodology assists effectively in revealing the essential mechanisms of the thermal performance and two-phase flow of the proposed TPCT used in concentrated solar collector applications. It was shown that the optimal performance of the TPCT (a high heat transfer coefficient and a low thermal resistance) was obtained at 250 W (power input), 90° (tilt angle), and 50% (filling ratio).
Naruka et al. [14] conducted a comprehensive investigation on cylindrical heat pipes at different tilt angles. They used three different working fluids (water, methanol, and acetone) and showed that the optimal tilt angle was 45°. Mahdavi et al. [15] found that, for a copper/water TPCT, larger heating power reduces significantly the thermal resistance. They also demonstrated that the tilt angle has little effect on the thermal performance for inverted installation (the evaporator was above the condenser). Using zirconia–acetone nanofluids, Sarafraz et al. [16] showed that the TPCT heat transfer performance could be enhanced. They also discussed the effect of the tilt angle and found that the optimal value was about 60°.
More recently, Khaougam et al. [17] conducted a comprehensive investigation to examine the flow patterns in a rectangular-section TPCT and their influences on its heat transfer performance. They examined particularly the influence of main design and operational parameters such as geometry ratios, the working fluid type, and the tilt angle. Bubble, slug, churn, and annular flow patterns have been exhibited for nanofluid mixtures. They identified an optimal tilt angle (80°), achieving a maximum heat transport capacity of about 8 kW/m2.
Uneven aggregation and poor dispersion are the main actual challenges of using nanoparticles [18]. Nevertheless, the use of a combination of surfactants and silver nanoparticles has shown the ability to enhance the heat transfer efficiency of a TPCT, as demonstrated by Dhairiyasamy et al. [19]. Internal flow patterns in the evaporator and the condenser can be quite different within a TPCT [20]. They can be affected by many conditions, including the aspect ratio, the working fluid, and the tilt angle [21]. The review of the available literature unanimously is claiming that the design and development of high-efficiency heat recovery or management solutions for specific applications require a deep investigation on the optimal operating conditions [22].
Kodancha et al. [23] showed that the treatment of the internal wall improved the thermal performance of the thermosyphon. The thermal resistance significantly decreased for a 45° tilt angle using water. They inferred this behavior was the effects of the wettability gradients, which are more significant at low tilt angles. The performance enhancement was also reported when water–ethanol and ethanol–methanol–hexanol–water mixtures were used as working fluids. For air-cooled applications, Rukruang [24] conducted an experimental investigation to optimize the performance of a multiport thermosyphon heat exchanger. The effects of the heat load, cooling air velocity, filling ratio, and tilt angle were then investigated. The optimal set was obtained for a 30% filling ratio and vertical position. They also have shown that both underfilling and overfilling degraded the evaporator performance considerably. The operational thresholds have also shown the effects of the flooding limit on that performance.
The effects of horizontal vibrations and heat load on the boiling behavior of a water-glass TPCT were investigated by Kang et al. [25]. Three boiling patterns were revealed according to the heat input and the vibration intensity: geyser, suppressed, and continuous boiling. Strong vibrations enhanced the heat loss by liquid film evaporation and suppressed boiling for low heat loads. The increase in total heat input allowed the persistence of continuous boiling for all vibration levels.
All the studies described above show the need for more numerical investigations on the effect of the tilt angle. It is indeed an important parameter, and optimizing it remains challenging. In addition, there is no definitive conclusion on the optimal tilt angle. Therefore, the main objective of the present study consists in developing a reliable simulation model and using it to investigate the effects of the main operating conditions on the heat transfer coefficients and the overall thermal resistance. It is validated by comparing numerical results with the experimental data available in the literature. The effect of the tilt angle, among other parameters, on the heat transfer performance of the TPCT is also discussed.
2. The Thermosyphon Simulation Model
In this section, we describe the thermosyphon to be simulated, the governing equations, the initial and boundary conditions, and the numerical procedure.
2.1. The Simulation Model
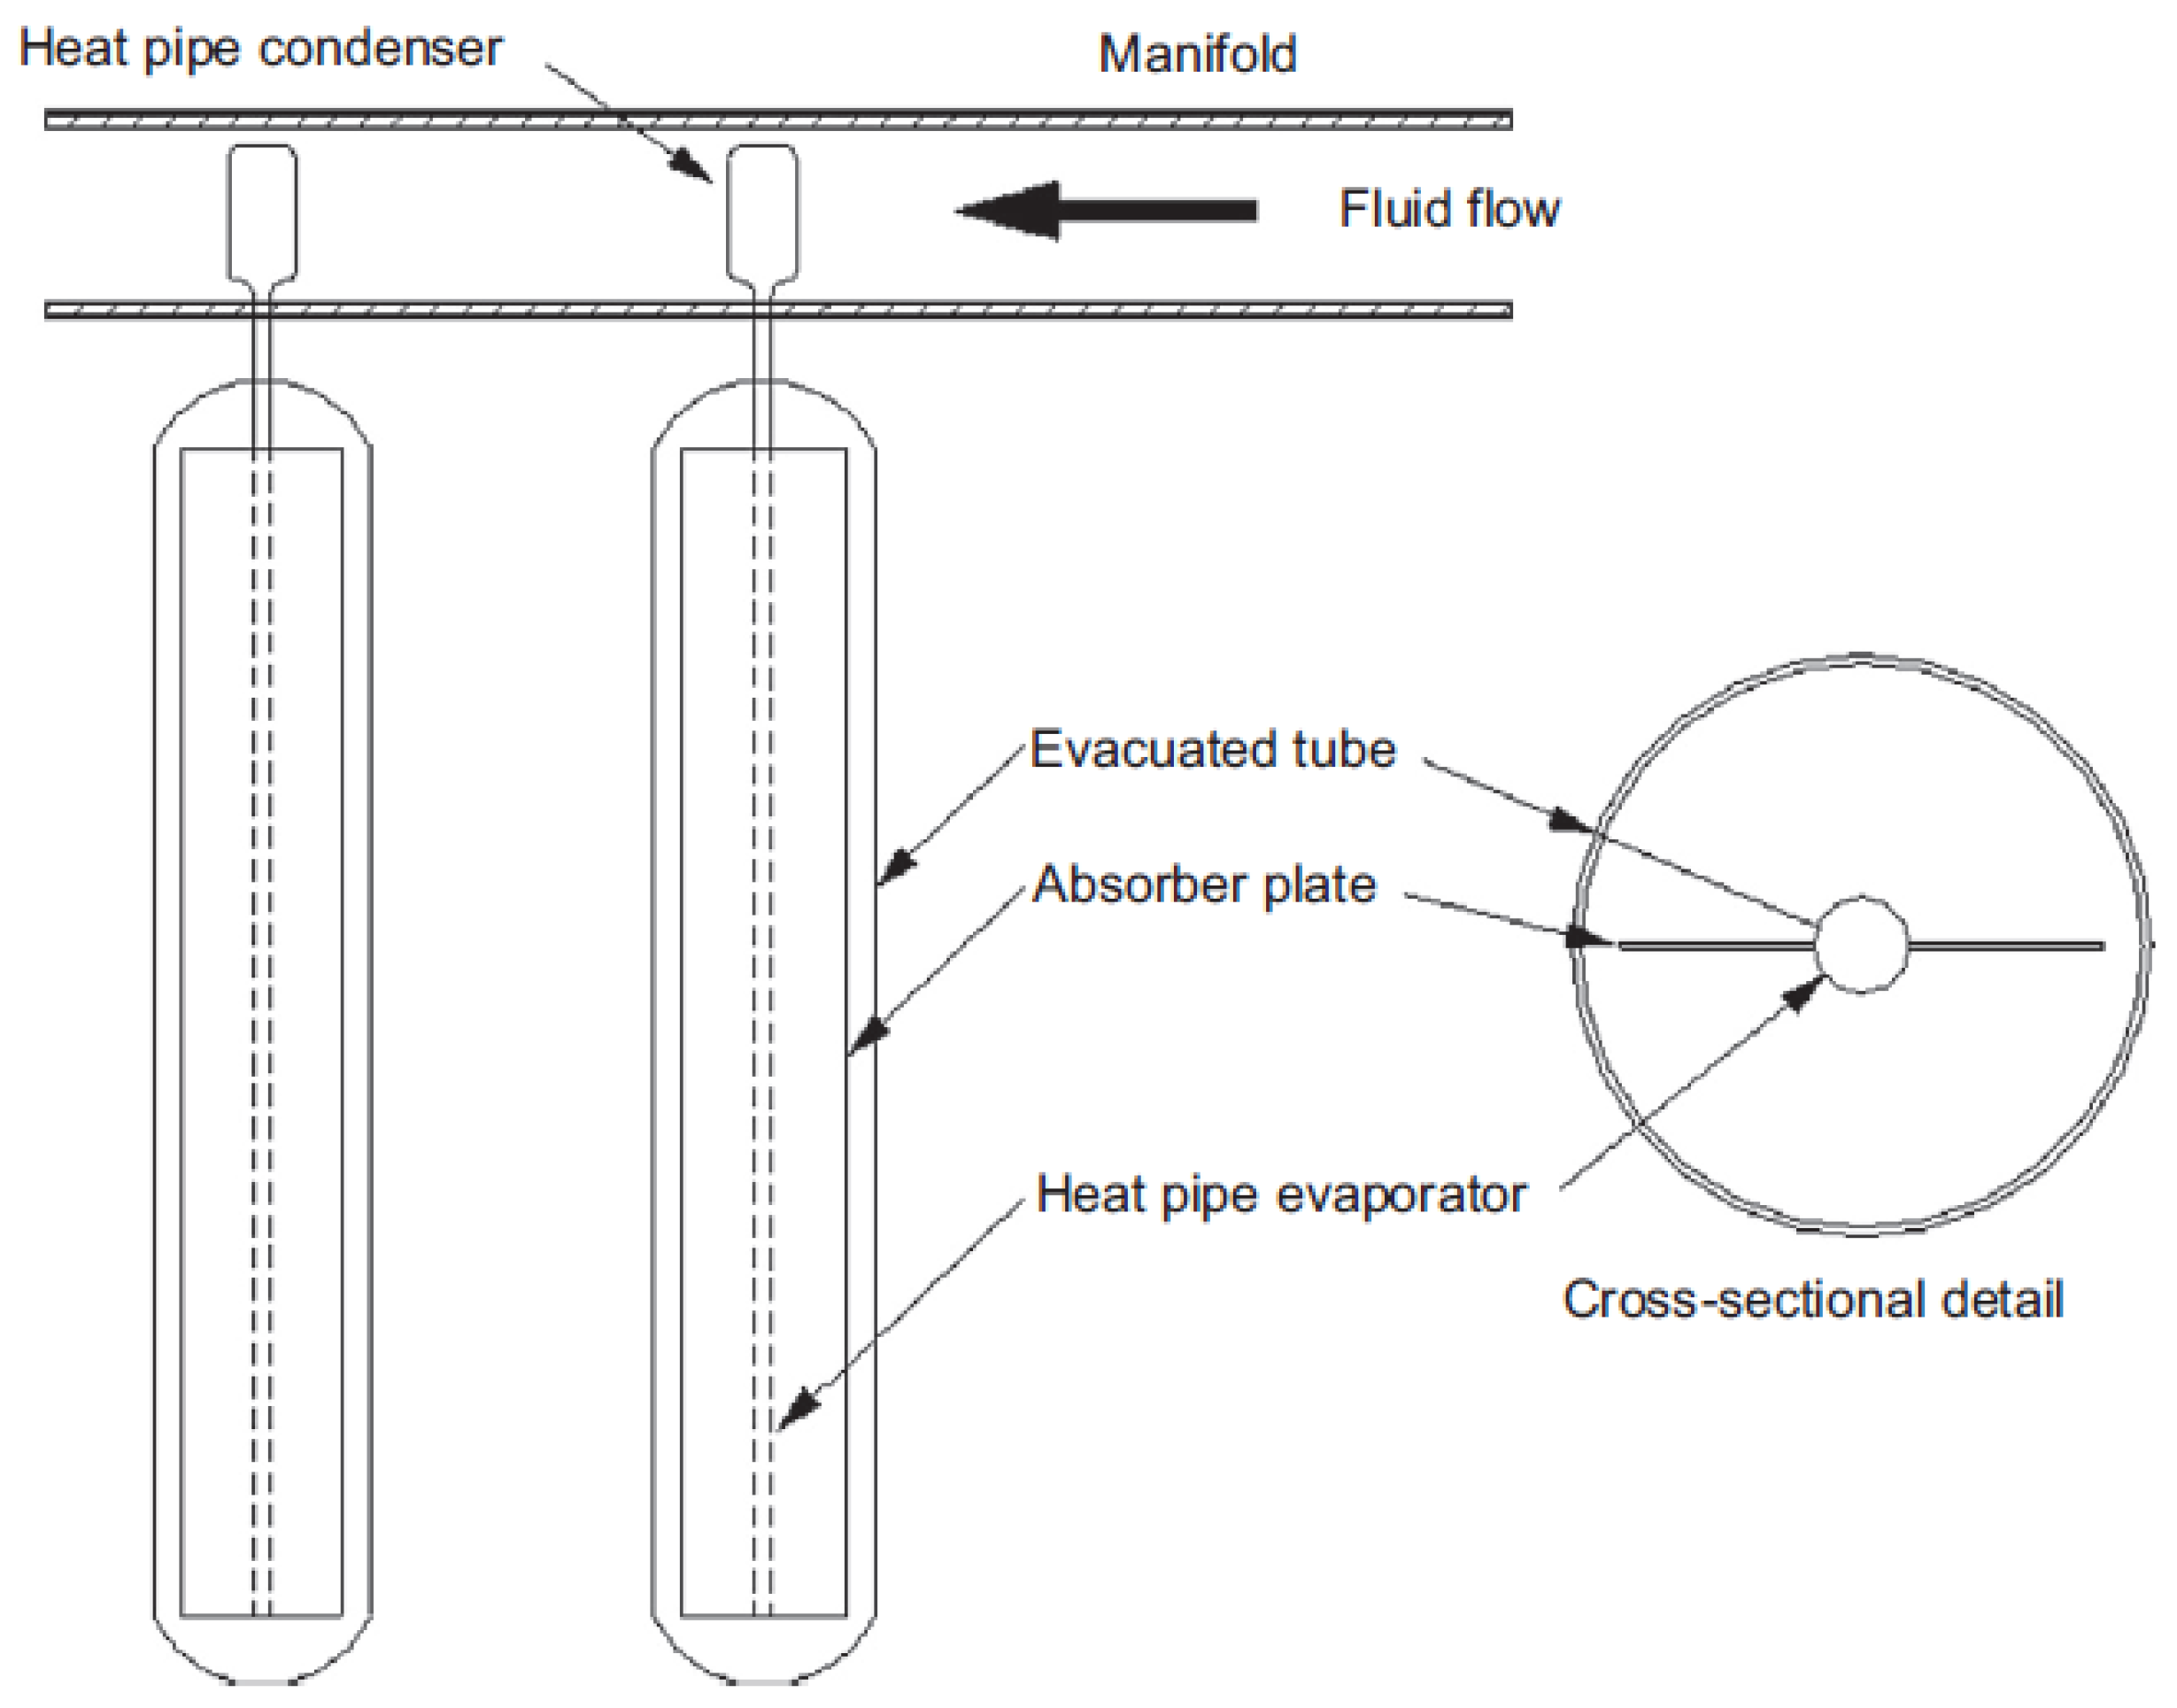
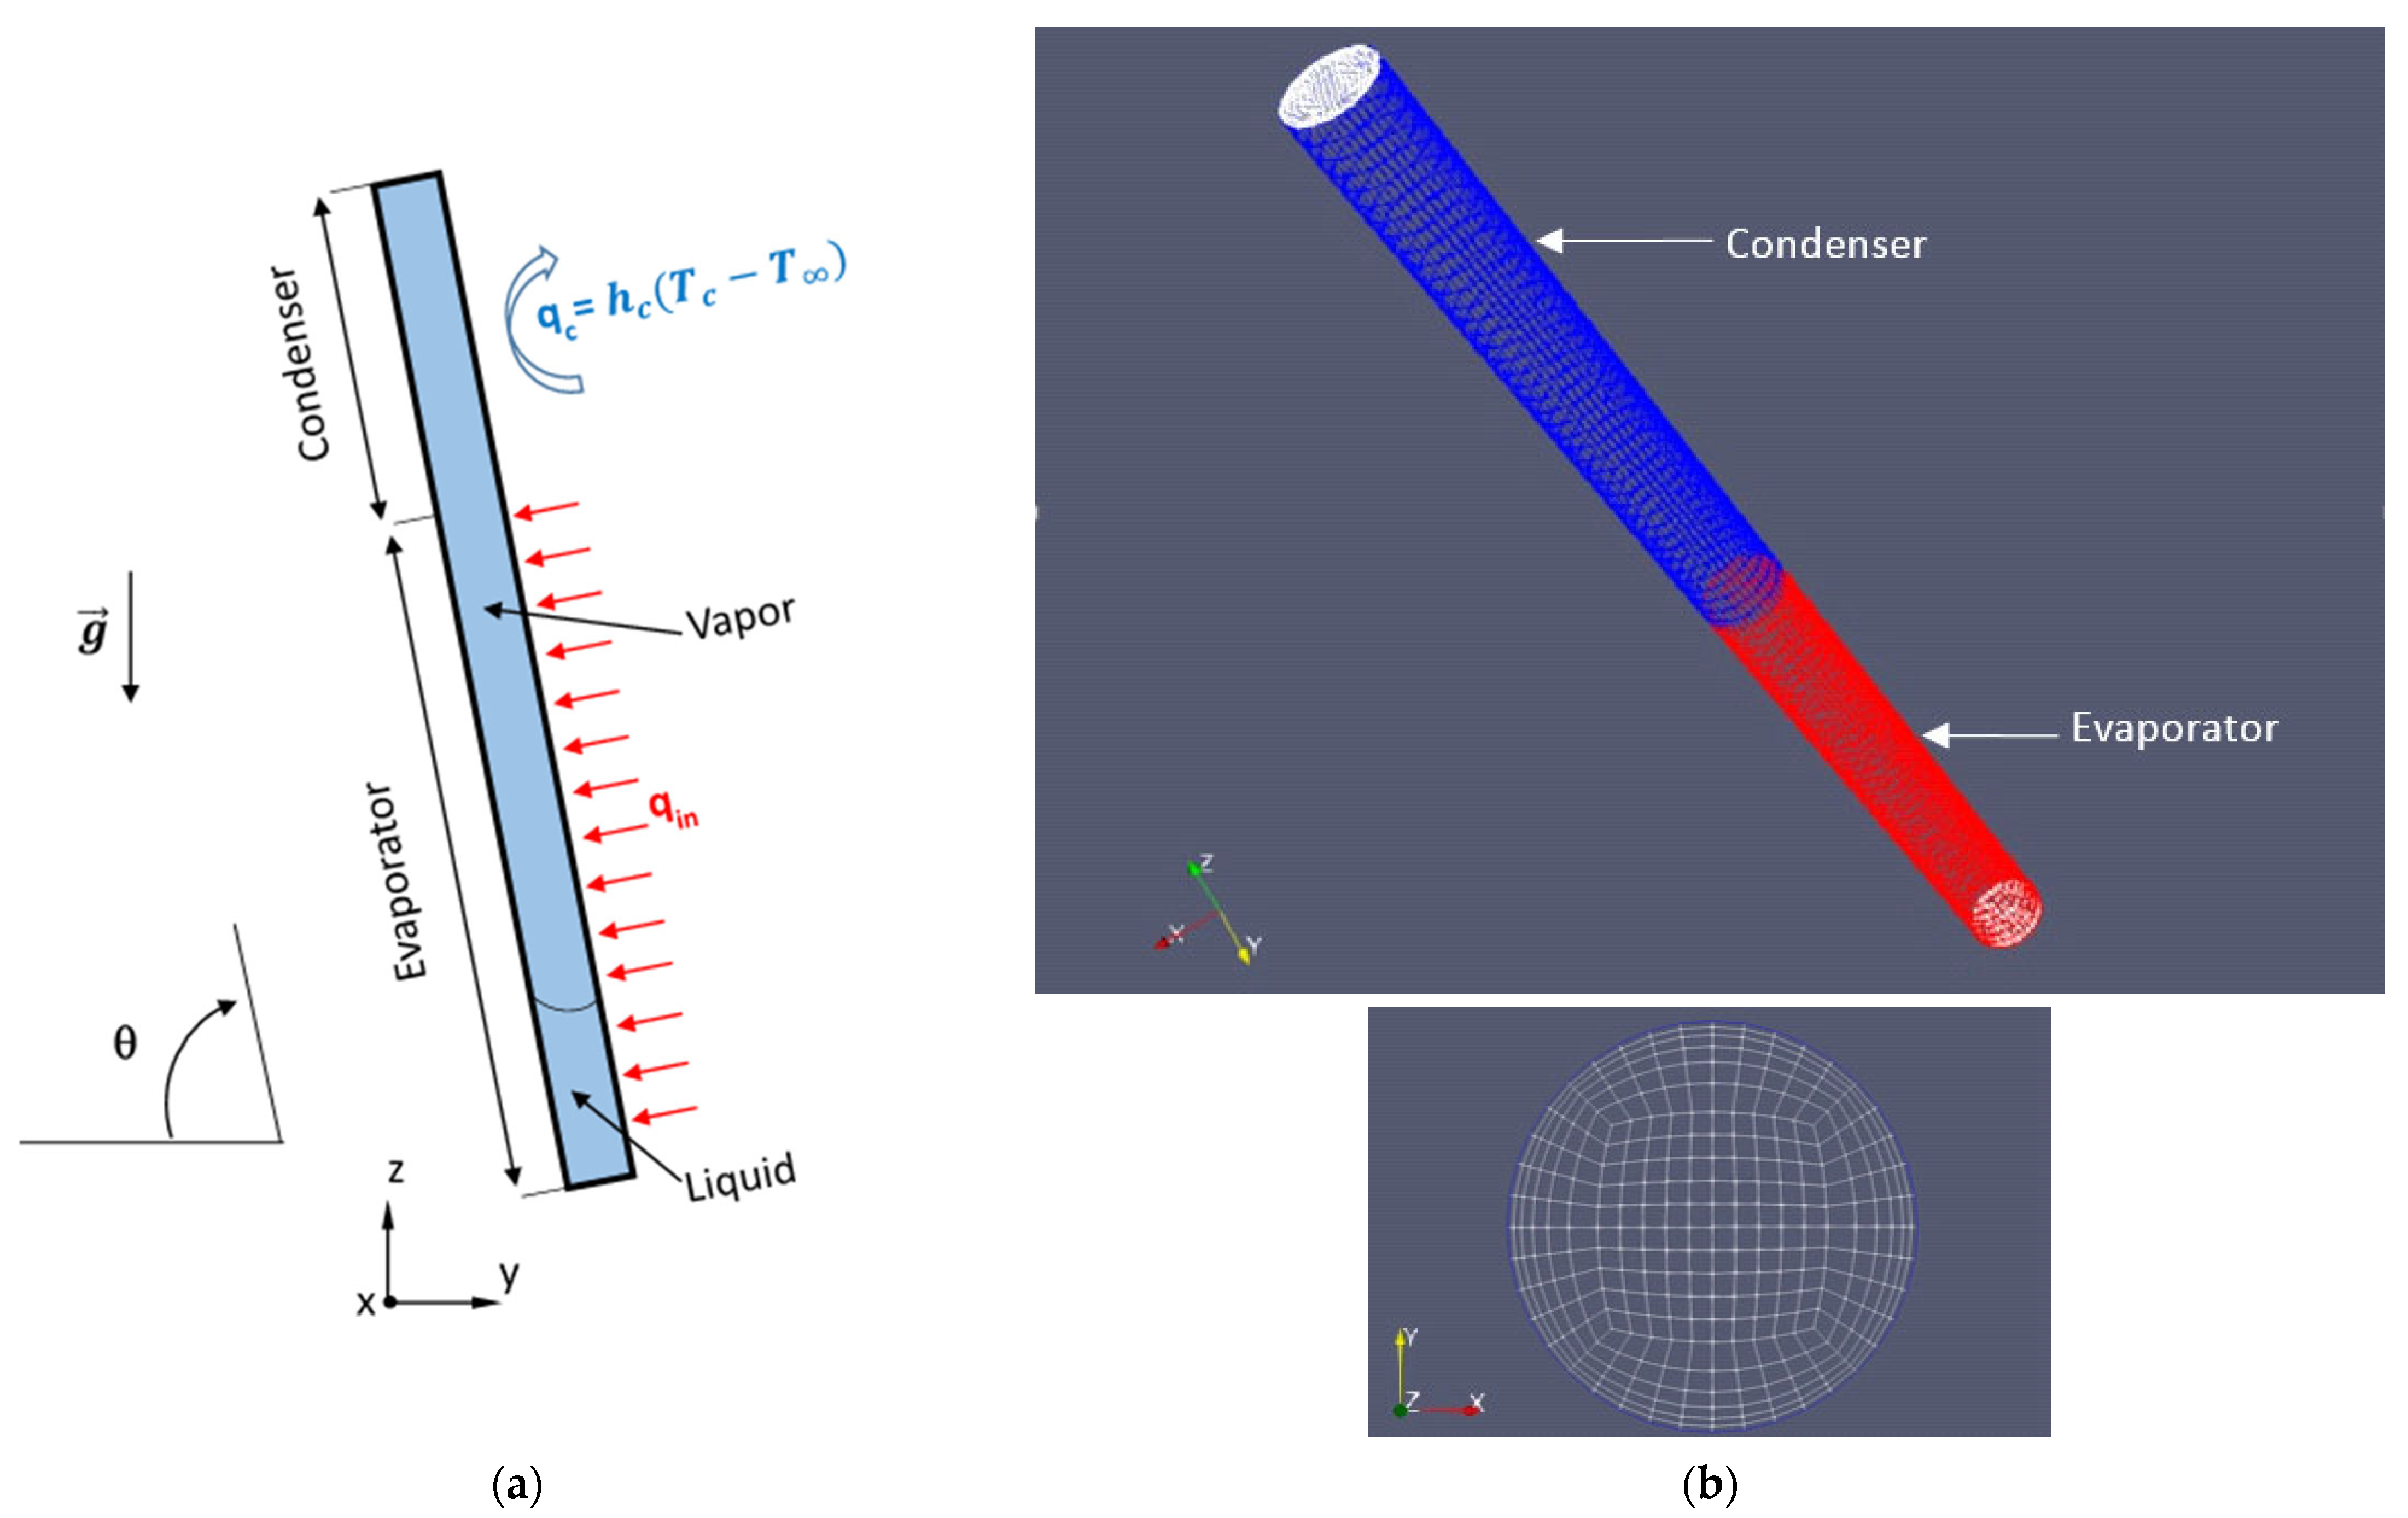
Figure 1 shows the schematic details of an evacuated tube collector involving heat pipes. To improve the efficiency of the water heater, it is interesting to investigate first the heat transfer characteristics of the TPCT, the main component of the evacuated tube collector. It consists of a carbon steel/water TPCT. The considered model is described in Figure 2a. It also shows the different sections of the TPCT and the tilt angle θ. A heat flux Qin is set at the evaporator, whereas a convective heat transfer condition is considered at the condenser (the boundary conditions are entirely described below). Taking into account the sensitivity of the model to the tilt angle θ, a three-dimensional geometry is considered. Using the blockMesh utility in OpenFoam [26], a structured hexa-hedralateral grid with different element numbers is therefore generated. Figure 2b illustrates the main characteristics of the meshed domain corresponding to the TPCT. The liquid phase is considered as the primary phase.
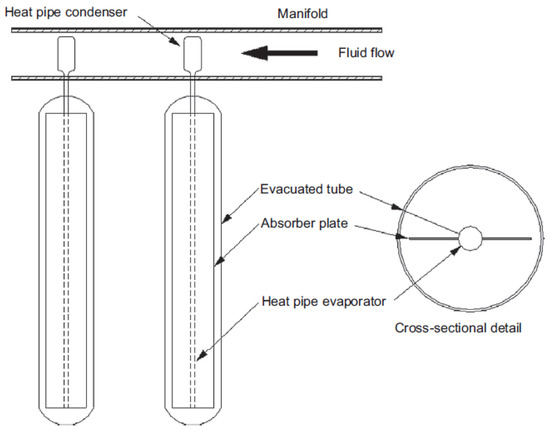
Figure 1.
Schematic diagram of an evacuated tube collector with heat pipes [3].
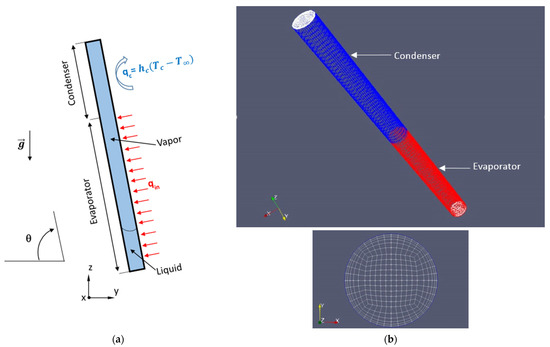
Figure 2.
The thermosyphon model: (a) Description of the main sections and heat transfer parameters; (b) Sketch of the mesh details (axial and cross-sectional meshing).
The developed model is built to simulate the heat and mass transfer in a cylindrical TPCT commonly used in evacuated tube water heaters. It mainly contains two sections: the evaporator, where the solar radiation heat is absorbed, and the condenser, where the heat is released to a fluid (water usually) through a specifically designed manifold, modeled in the present analysis by an external heat exchange coefficient () and a “far” temperature ().
To validate the numerical results and to test the developed model, we chose a reference experimental case carried out by Gou et al. [8]. The main characteristics of the TPCT experiments are summarized in Table 1.

Table 1.
Setup parameters of the tested TPCT [8].
2.2. The Governing Equations
For multiphase flows, phase transition methods are commonly used to define the transport at the interface. It can be classified into two categories: tracking methods and capturing methods. The volume of fluid method (VOF) is a capturing method commonly used to simulate complex multiphase flows. It has, indeed, many advantages, including mass conservativeness, boundedness, controlled spurious oscillations, and an improved interface resolution [27]. It should be, however, associated with an appropriate interface reconstruction algorithm, which should be selected carefully, like MULES [28], isoadvector [29,30], or ROUNDS [31,32]. Tracking properly the liquid–vapor interface is still, therefore, a challenge. The relative simplicity of the VOF approach and its inherent ability to handle multiple interfaces and topology changes make it more suitable for modeling two-phase flows than other methods.
According to this approach, a fluid cell can involve liquid, vapor, or both phases. The volume fraction (αl and αv, for liquid and vapor, respectively) is used to define the fluid composition for each cell:
Tracking the liquid–vapor interface is then possible by solving the continuity equation of the liquid phase. An advection equation can be obtained from the mass balance. It is then resolved to retrieve the interface location. The source terms are adapted in the conservation equations so that the phase change process can be implemented accordingly. The numerical handling of the remaining equations (based on Navier–Stokes equations) is carried out for both phases in the limits of thermal and dynamic relaxation [33,34]. The flow variables (u and P) and thermal characteristics (T) are common for the liquid and vapor phases. The thermophysical properties of the mixture, including the density (), the dynamic viscosity (), the heat capacity per unit volume (), and the thermal conductivity (k), are estimated from a volume average formula. Furthermore, the main assumptions are the following:
- -
- The vapor phase is considered as an ideal gas;
- -
- The liquid flow is incompressible;
- -
- The liquid–vapor phase change consists of nucleate boiling;
- -
- The liquid–vapor interface is considered locally in thermal and thermodynamic equilibrium even during the phase change process.
When no phase change occurs, to capture the moving interface, the global continuity equations are considered for each phase as:
and are, respectively, the liquid and vapor densities. is the local velocity.
According to the VOF approach, the advection equation for the liquid in an incompressible two-phase flow is:
When phase change is taken into account, the governing equations are described hereby for the liquid phase:
- -
- The continuity equation:
- -
- The momentum conservation equation:
- -
- The energy conservation equation:
The liquid and vapor volume fractions are linked by:
The density () and the dynamic viscosity (μ) of the liquid–vapor mixture are expressed by:
is the gravity vector given, in projection, to the basis directions by (see the coordinate system in Figure 2a):
is the continuum force, considering capillarity written as [15]:
where and are the liquid–vapor surface tension and the interface curvature, respectively, given as:
The enthalpy (H) of the liquid–vapor mixture can be defined as:
The thermal conductivity of the liquid–vapor mixture (k) is expressed as:
and are, respectively, the thermal conductivity of liquid and vapor phases.
The continuity equation source term Sm can be obtained by [35]:
- -
- For evaporation:
- -
- For condensation:
and are defined as the mass transfer time parameters or relaxation coefficients for evaporation and condensation, respectively. In the literature, these two parameters were mostly set at constants during a given simulation. They reflect the characteristic time for the phase change process (evaporation or condensation) to occur once a departure from saturation conditions happens [33]. Their values can vary between 0.1 and 10−7 s−1 [15]. In this study, the proportionality to phase densities is practically verified:
The saturation pressure can be derived from the temperature field according to the Clausius–Clapeyron formula:
is the latent heat of vaporization. and are reference pressure and temperature, respectively.
The energy source term is obtained by:
2.3. The Initial and Boundary Conditions
For the evaporator, the constant heat flux density (qin) is applied as a boundary condition:
is the input heating power at the evaporator, is the TPCT external diameter, and is the length of the evaporator section.
For the condenser, a convective boundary condition was considered:
and are the heat flux density and heat flux at the condenser section, respectively. is the length of the condenser section. is the heat transfer coefficient at the condenser section. is the free stream temperature of the outer cooling fluid.
At the top and bottom faces of the thermosyphon, perfect thermal insulation is assumed:
At the TPCT external frontiers, a no-slip condition is applied to the fluid:
Also, a zero-pressure flux boundary condition is considered:
The following initial conditions are taken into account:
- -
- The evaporator is liquid-filled according to the experimental filling ratio (48%): = 1 for all the cells involving only the liquid phase (the liquid pool at the TPCT bottom). To ensure the stability of the numerical solution at the first simulation time steps, a 0.5 mm thin film along the TPCT internal wall is set along the TPCT internal wall. = 0 for all the remaining domain (filled with saturated vapor).
- -
- The temperature T is set, according to the experimental data [8], at the expected operating temperature value (≈Tsat).
- -
- The pressure is equal to the saturation pressure (Psat), which can be locally obtained from Equation (18).
2.4. The Numerical Solution and Procedure
The discretization of the governing equations is performed using the finite volume method, and the numerical solution is estimated at each simulation time step using OpenFoam v6 (2018) [26]. The latter is an open-source CFD software with many useful features. It enables simulating many processes, from complex fluid flows involving chemical reactions, turbulence, and heat transfer to acoustics, solid mechanics, and electromagnetics. The ability to modify and improve solvers to fit with the very considered problem is also an interesting feature.
The developed solver is based on the adiabatic two-phase flow with phase change code interPhaseChangeFoam, where the MULES interface reconstruction technique is used [36]. Thus, it provides access to extensive OpenFOAM functionality (MPI parallelization, turbulence models, discretization schemes, and linear solvers). A phase change model based on Hertz–Knudsen’s approach is incorporated and successfully tested [33,36]. This software enables, therefore, the simulation of diverse phase change processes in a single environment. The iterative algorithm PIMPLE, a combination of the PISO and SIMPLE methods, is used to obtain the numerical solution of the equations through time progress [37]. The standard k-ϵ model is the default turbulence model used within the interPhaseChangeFoam solver in OpenFOAM. This model is commonly used for two-phase flow simulations where phase change is involved [36]. In fact, turbulence models commonly employed for single-phase flows involving the k-ϵ models are applied in multiphase flows, where each phase is treated as in local equilibrium [38]. One of the most widely applied interface-capturing methods incorporated with RANS (Reynolds averaged Navier–Stokes) turbulence models is the volume of fluid (VOF) method incorporated in the described solver. It defines the fluid properties near the interface as varying with the volumetric fraction. The density gradient over interface cells is solved continuously. It generates a nearly laminar/transitional regime, triggered by a redistribution of energy over the horizontal directions near the interface [39]. Moreover, velocities and shear stress at the interface inside a TPCT are still of limited values, so that mean flow behavior is obtained with (RANS) models.
In addition, a self-adjusted time step is set to estimate the transient solution. A maximum global Courant number of 0.2 is then considered to ensure the simulation stability. The pseudo-steady-state regime is reached when the mean temperatures, pressures, and velocities in the evaporator and condenser sections are virtually constant. The solution convergence criteria is fulfilled when the time step fluctuations for the simulation parameters are below 1%. Figure 3 shows, for example, the time variations of the temperature at random positions in the evaporator and the condenser sections. It clearly confirms that the steady state is almost reached after 30 s of simulation time. For most of the simulation cases, it corresponds to 30–60 s. It takes more than 15 days, with a grid mesh of about 150,000 cells and using a 16-core workstation computer, to simulate up to that time.
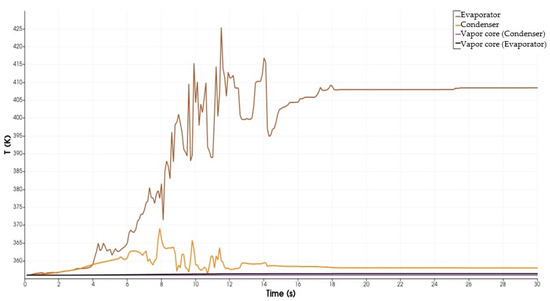
Figure 3.
Time variations of the temperature at the condenser and the evaporator sections (random positions along the TPCT).
The same approach has been used to simulate the heat and mass transfer within a different TPCT in a previous work [33], where further details about the numerical procedure can be found.
3. Results and Discussion
3.1. Model Validation
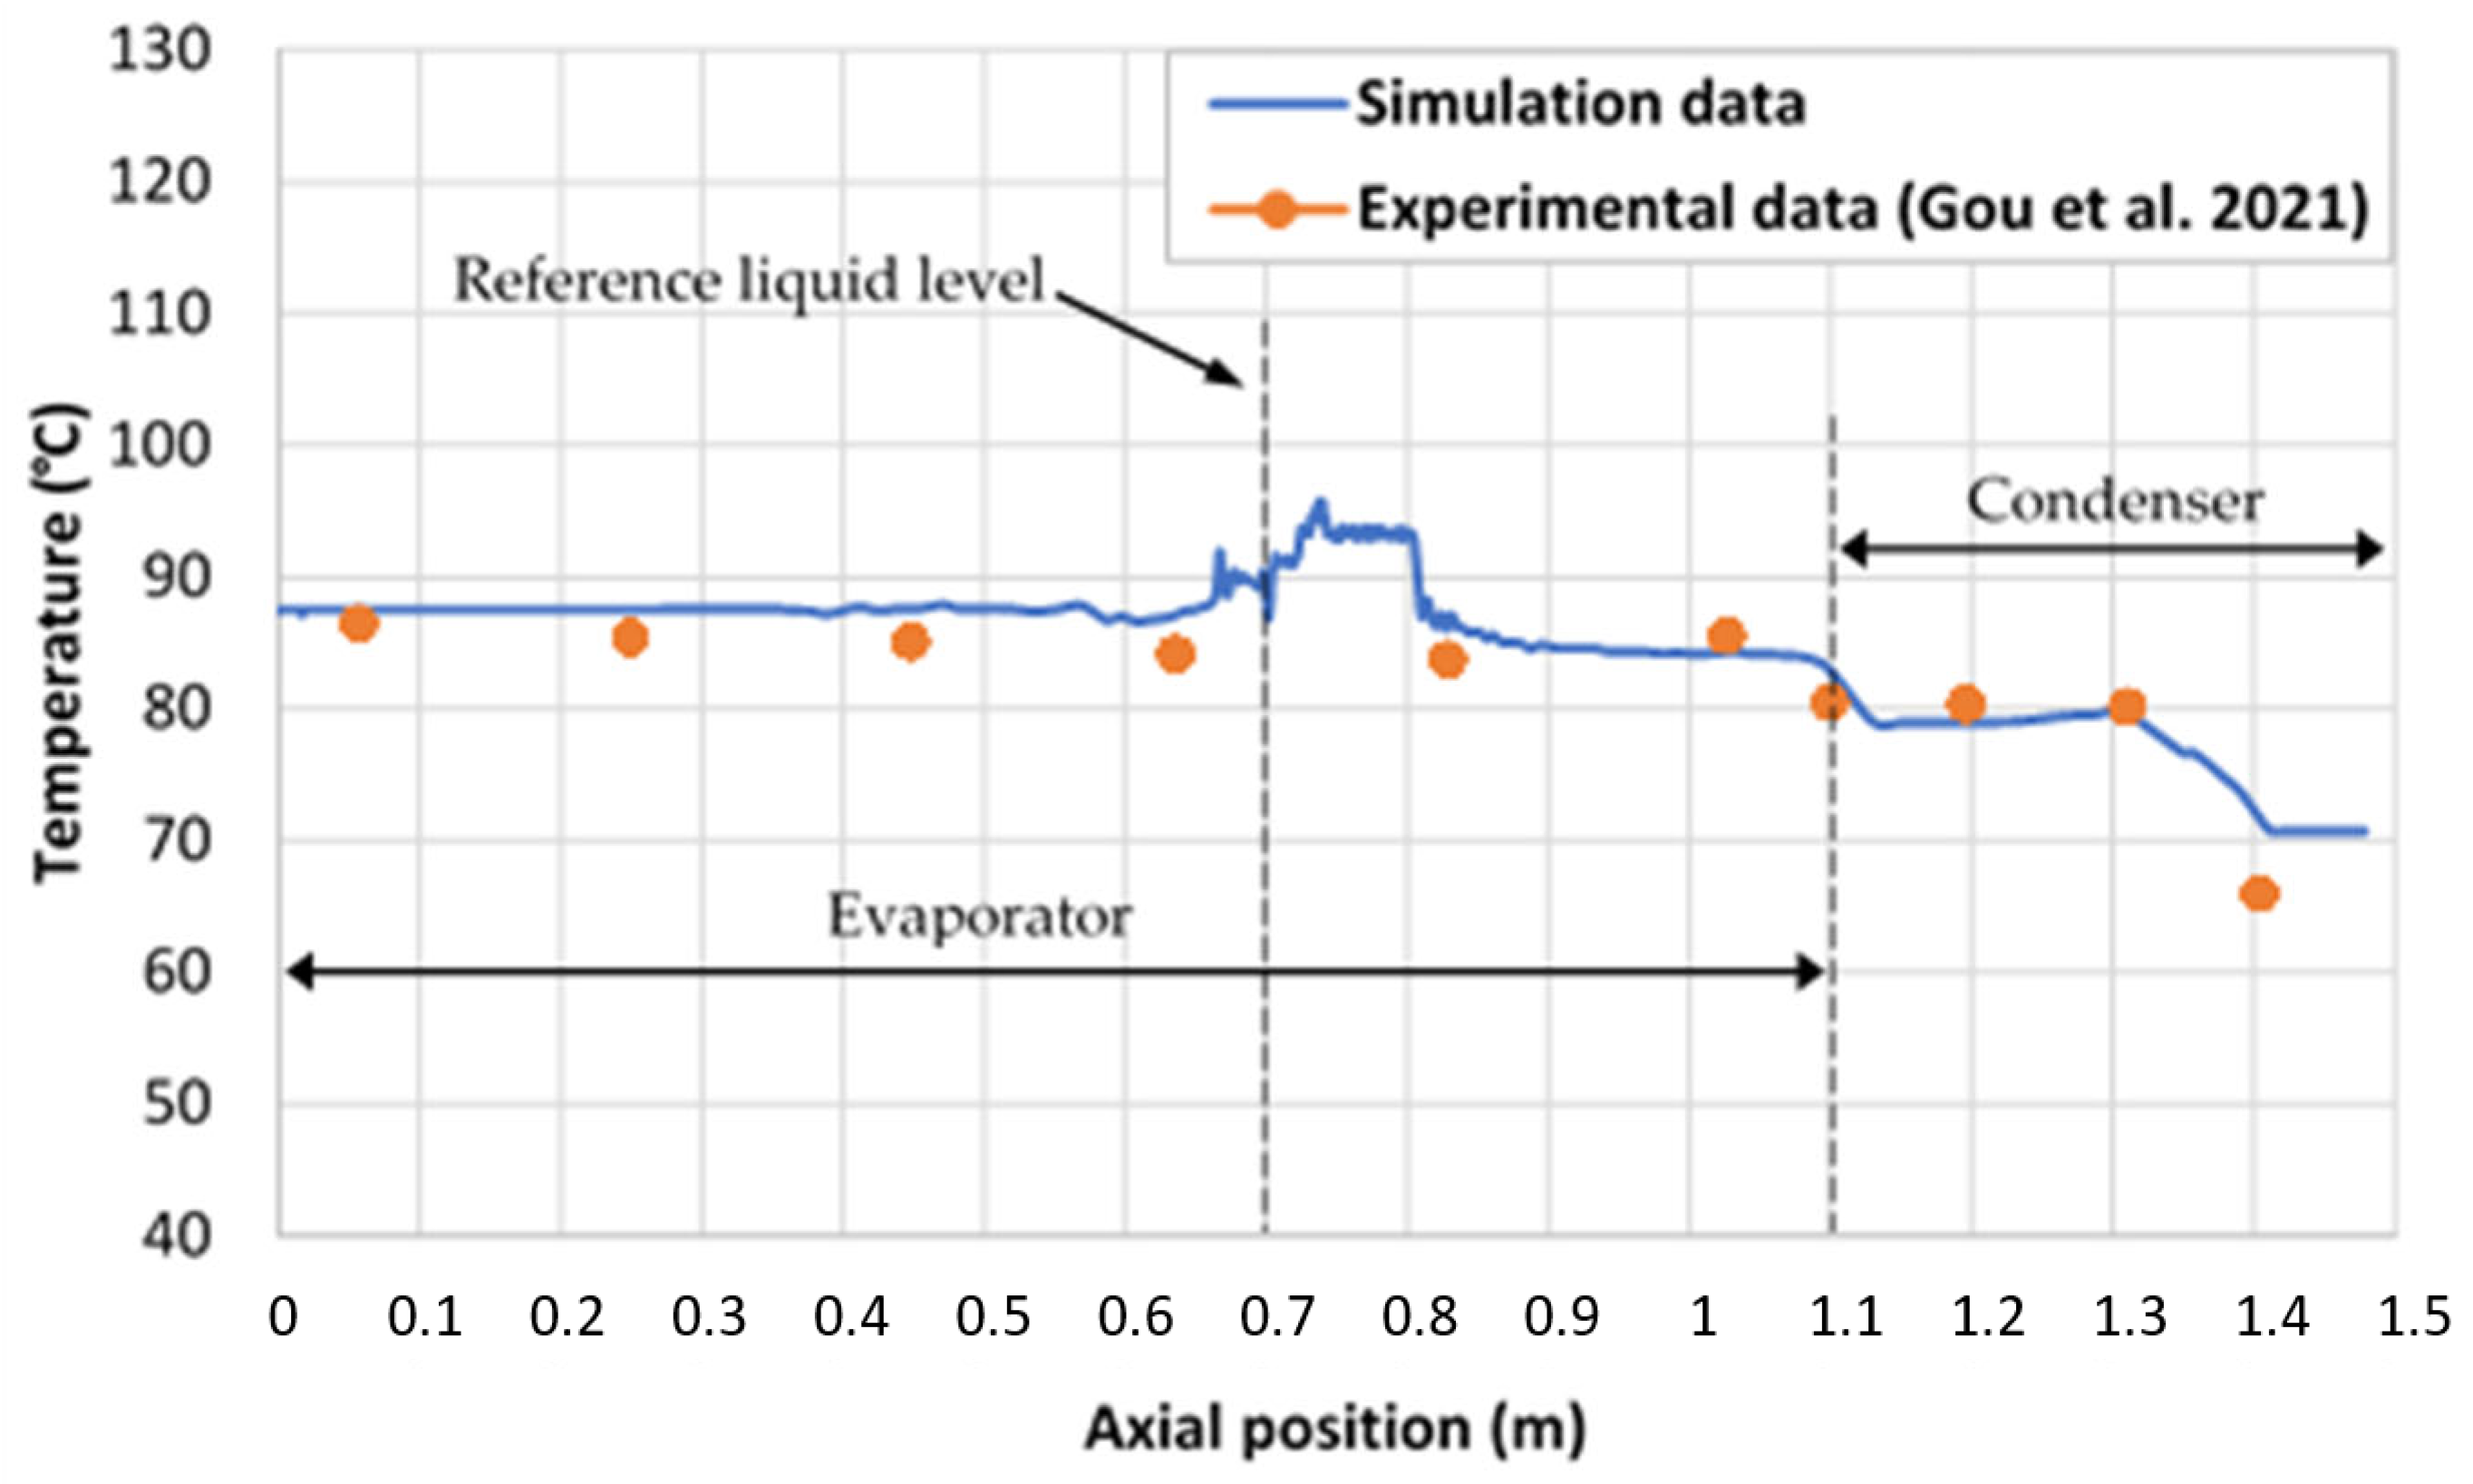
The developed numerical model was tested under a set of operating conditions (Qin = 100 W, tilt angle = 90°: vertical position). A mesh independence test was first performed for this reference case. Table 2 shows the mean temperature in the evaporator and the condenser sections for various mesh grid sizes. In particular, we have found that, over 150k cells, the mesh refinement has slight effects on the mean simulation temperatures. We have selected, then, the second mesh grid size (150k cells). The obtained results were then expressly compared with experimental data of Gou et al. [8]. Figure 4 shows indeed a good accordance between the simulated and measured temperatures along the TPCT.
Table 2.
Mean temperatures in the TPCT for various mesh grid sizes (Qin = 100 W, = 90°).
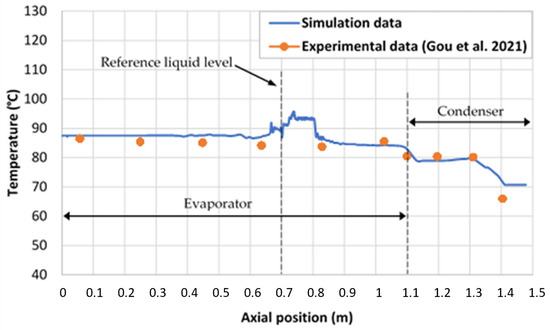
Figure 4.
Comparison between simulation results and experimental data [8] (Qin = 100 W; vertical position).
It is worth mentioning that the temperature at the evaporator bottom, where the liquid pool is located, is well estimated, whereas numerical fluctuations are noticeable at the evaporator top. It is still, however, limited (less than 1 °C for consecutive axial positions). It is associated with bubble formation and vapor generation at the section above the liquid–vapor interface. The plotted temperatures are, indeed, deduced from the simulation results at the fluid–solid frontier. A reference liquid level is defined for the vertical position ( = 0), obtained from the initial filling ratio (48%). At the condenser, the wall temperature is overestimated, in comparison with the experimental measurements, particularly in the condenser top. It can be explained by the fixed convective heat transfer coefficient and the constant cooling temperature condition considered in the TPCT model.
In addition, the TPCT model was efficiently able to capture bubbles formation and growth, like it is shown in Figure 5. It was also able to simulate condensation and liquid film falling along the inner wall. Bubbles were continuously generated at the top region of the liquid pool. It went then to the vapor region through the liquid–vapor interface (Figure 5).
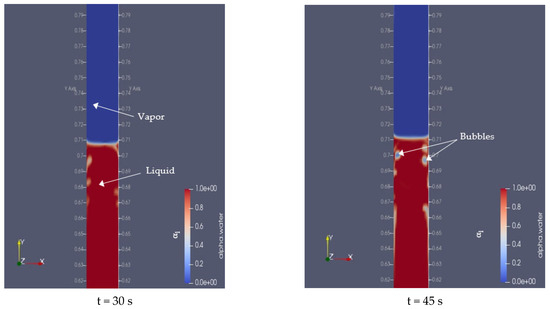
Figure 5.
Bubble creation and growth at the evaporator top (cross-sectional slice).
Furthermore, the developed numerical tool is used to investigate the effects of the operating conditions on the TPCT thermal performance. The study is particularly focused on the input heating power (Qin) and the tilt angle (). For this aim, the equivalent heat transfer coefficient (he, at the evaporator) and the overall thermal resistance (RTh) are, respectively, calculated as:
where D and Le are, respectively, the TPCT diameter and the evaporator length. and are the mean temperatures at the evaporator and the condenser, respectively. is the saturation temperature (estimated from the mean wall temperature at the evaporator/condenser limit).
According to most of the previous studies, the TPCT operation and performance can be affected by many parameters, including the geometry and dimensions of the container, the working fluid, the heat exchange conditions at the condenser, the heating power at the evaporator, and the tilt angle [40]. The last has been shown to have a deep impact on the thermal behavior of the TPCT [5,6]. We do then focus in the following on the effects of input heating power Qin and tilt angle .
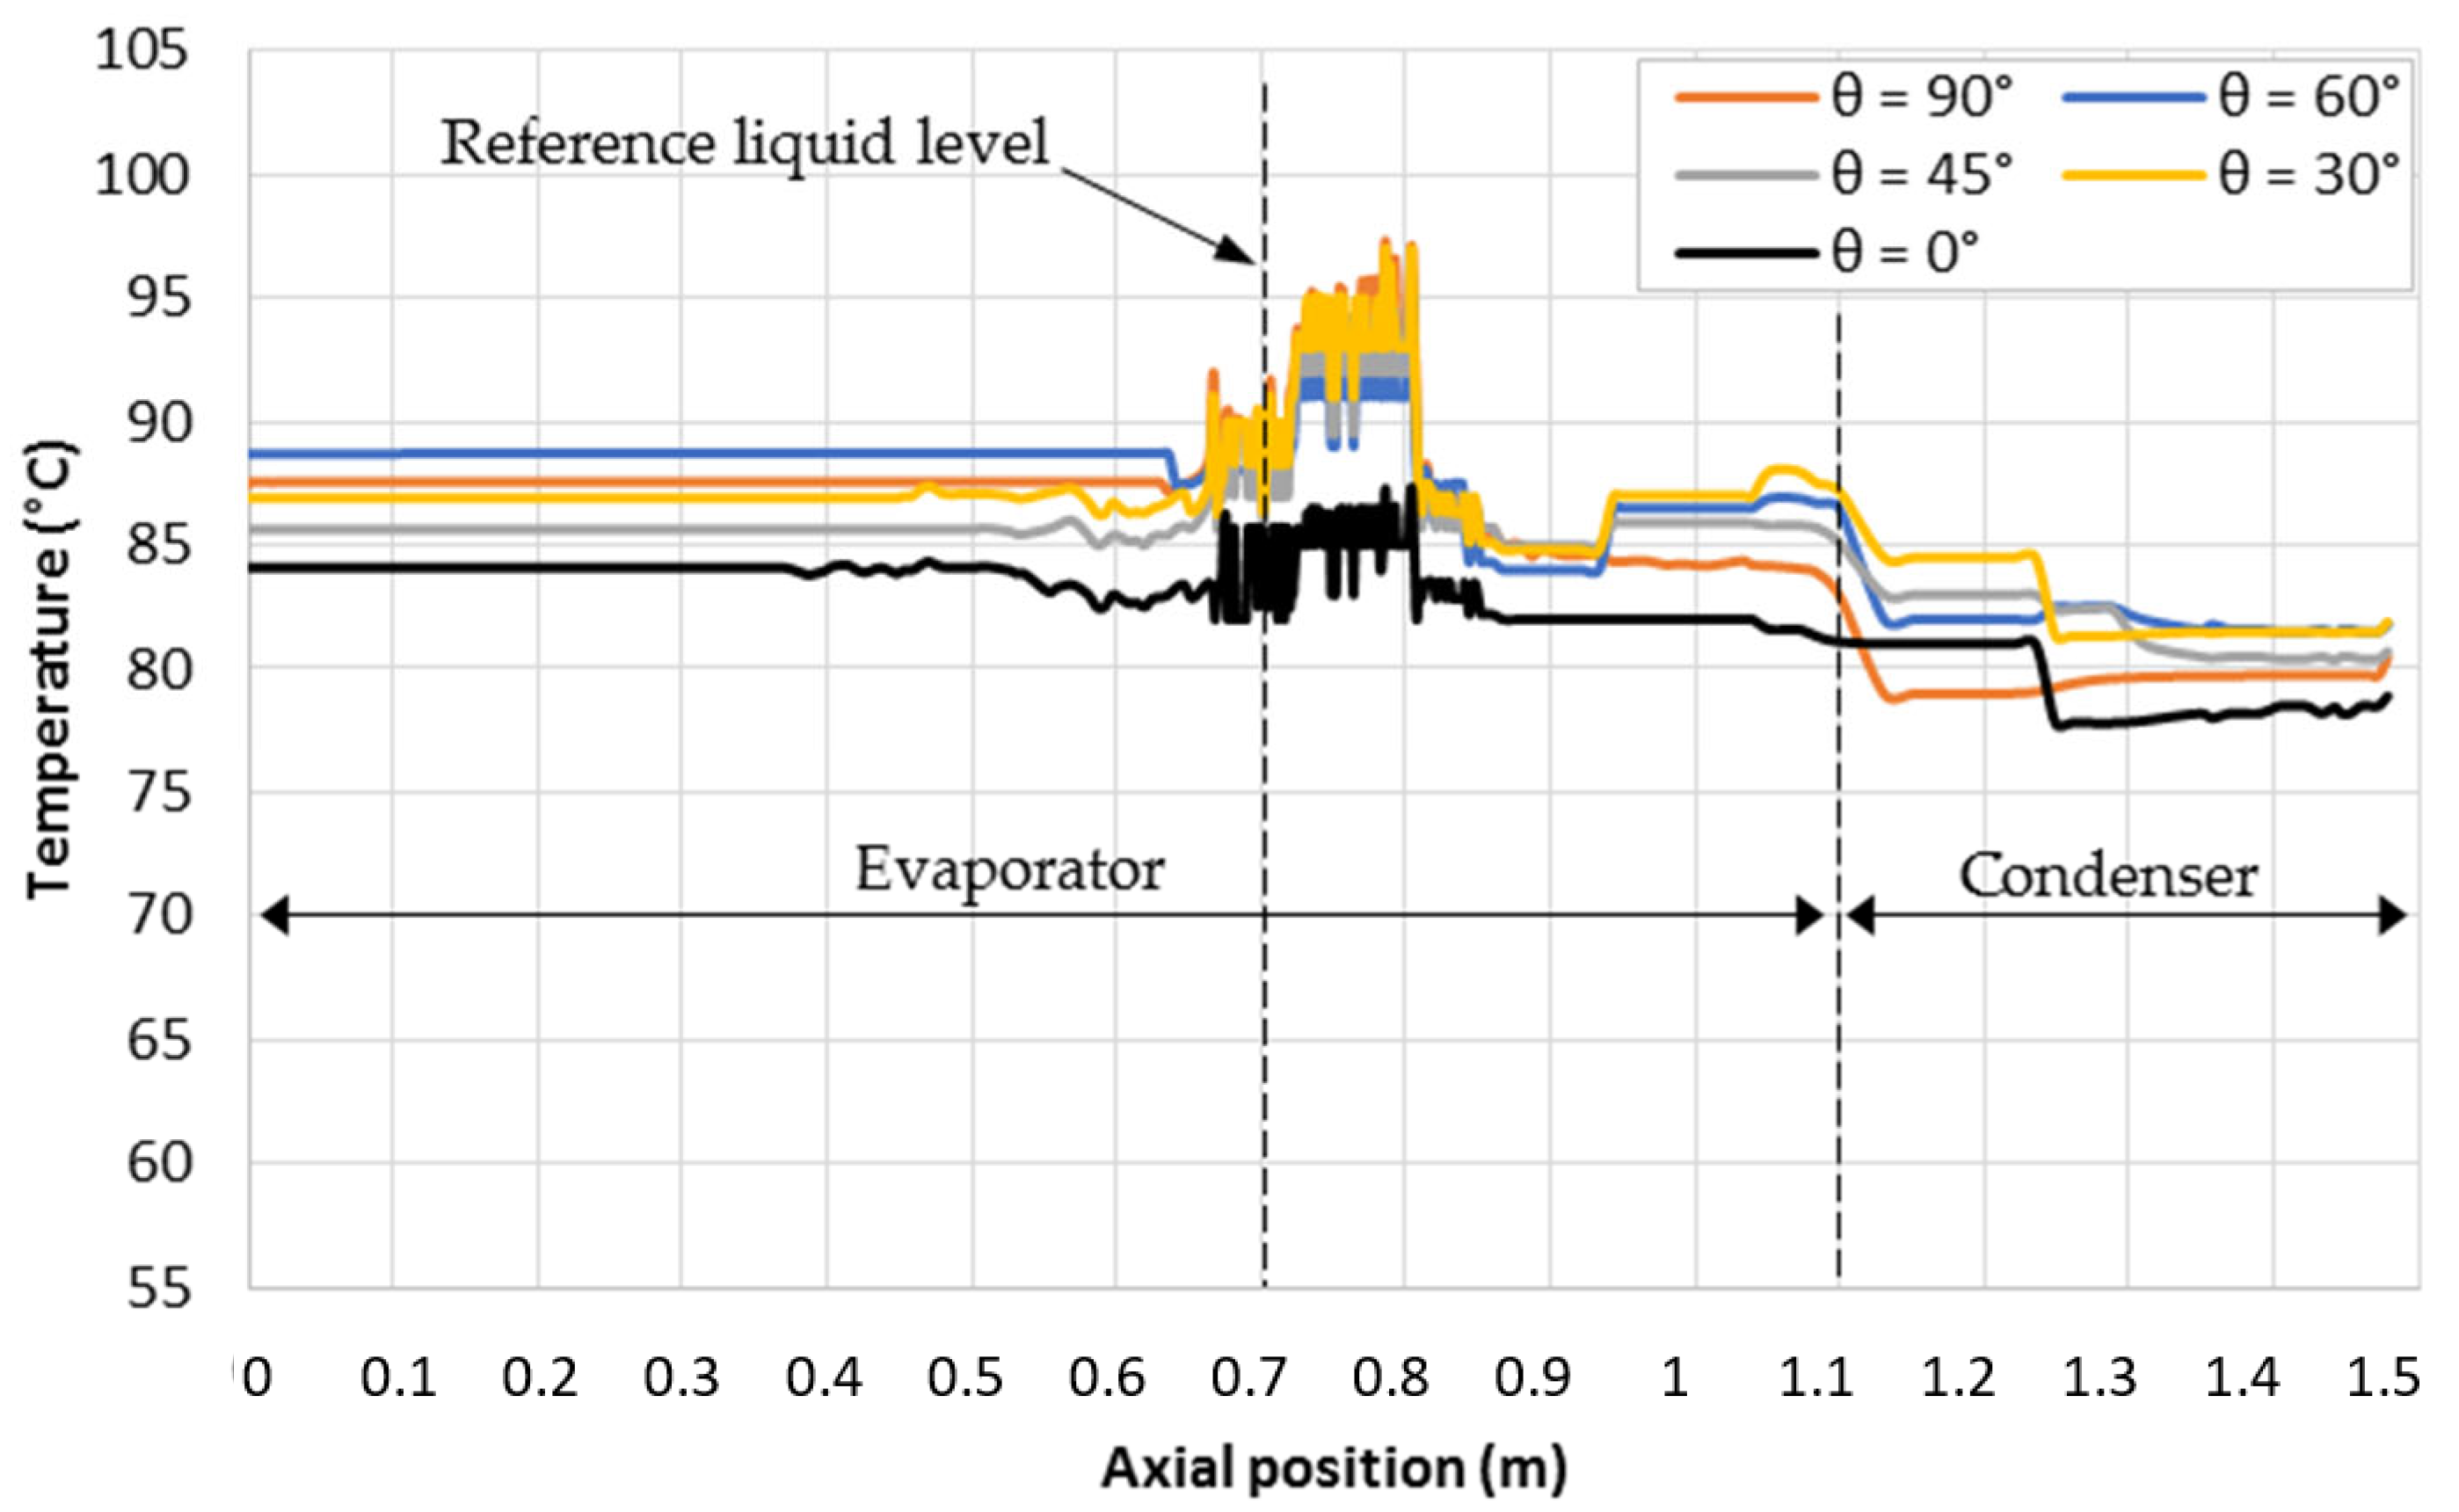
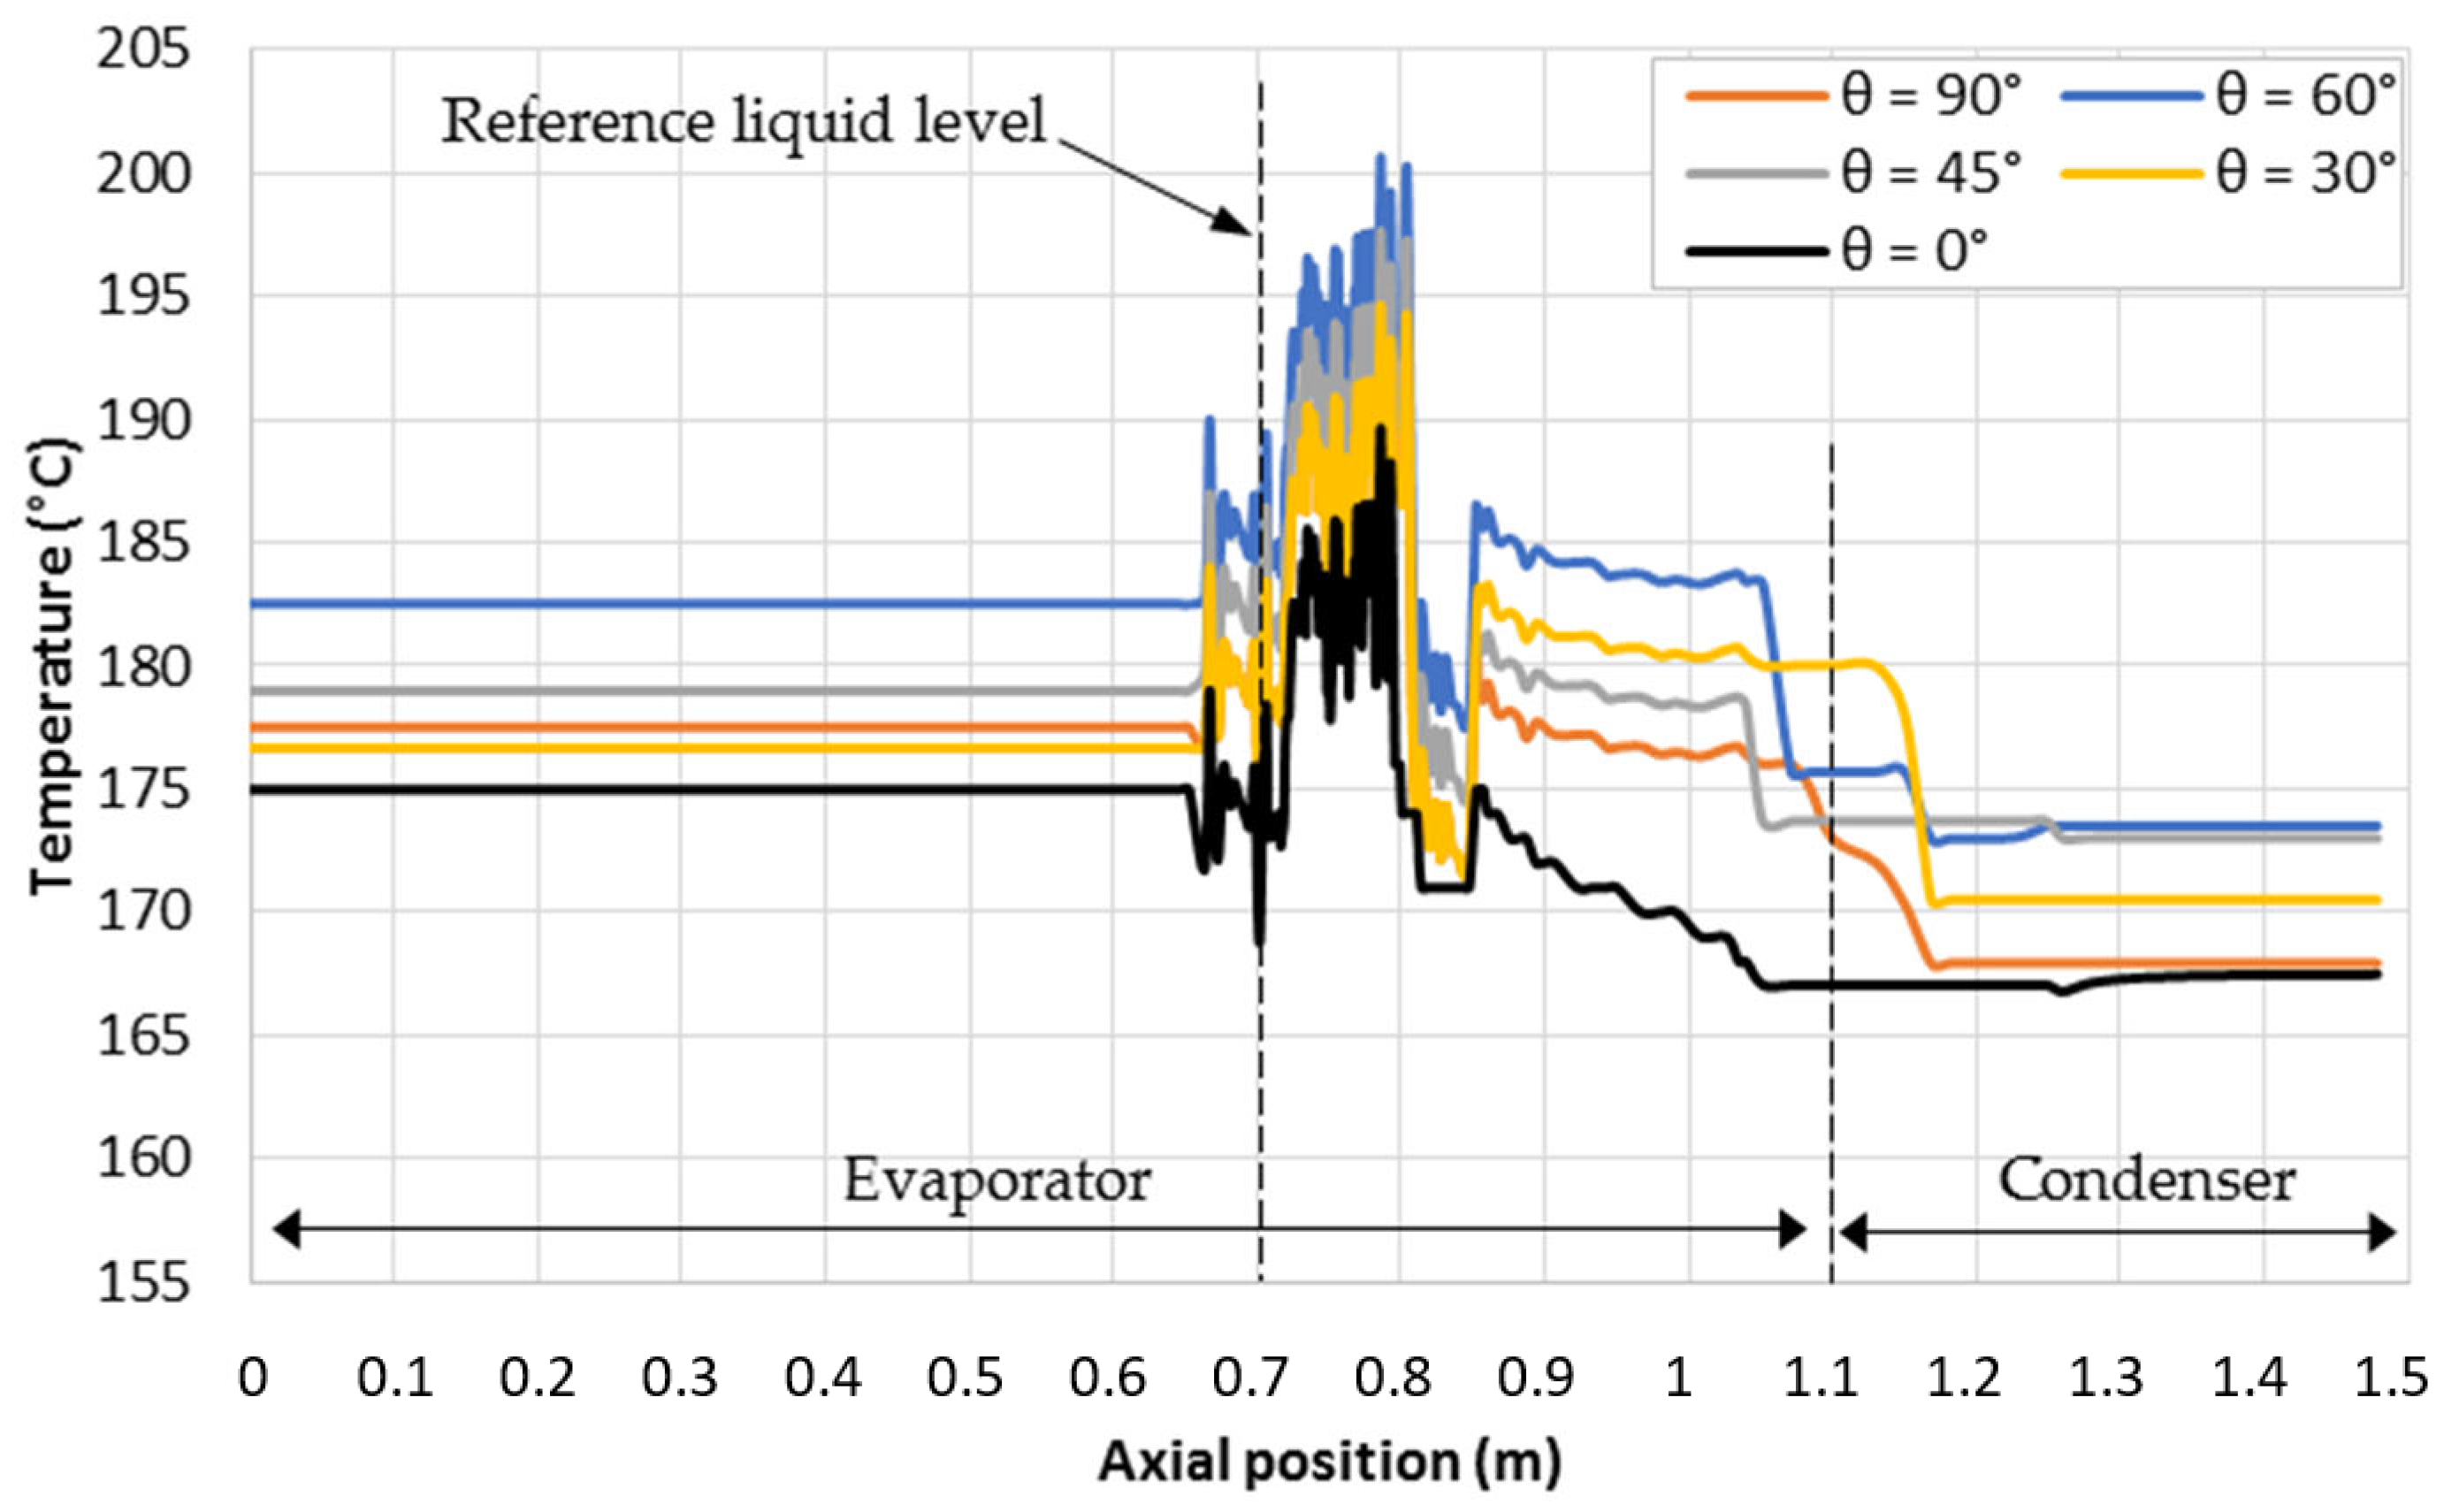
Figure 6 and Figure 7 show the steady-state temperature distribution along the thermosiphon for two different heat input powers (Qin = 100 W and 300 W, respectively) and for various tilt angles (from vertical position = 90° to almost horizontal position = 0°).
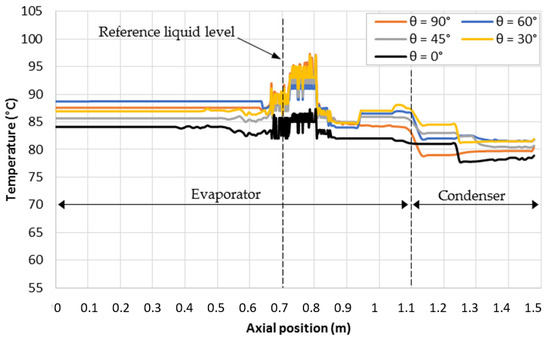
Figure 6.
Temperature distribution along the TPCT for various tilt angles (low heat input Qin = 100 W).

Figure 7.
Temperature distribution along the TPCT for various tilt angles (high heat input Qin = 300 W).
As the heating power increases, the temperature curves become less oscillatory. The temperature difference between the TPCT ends (the evaporator at the bottom and the condenser at the top) increases, consequently. At 100 W, the wall temperature along the thermosyphon is affected only slightly by the tilt angle (Figure 6).
The effects of tilting on the temperature become more distinguishable when the heat input is increased (Figure 7). In this case, the temperature distribution can be subdivided into three parts: The first corresponds to the evaporator bottom (a liquid pool is located there), and the temperature is uniform. There are significant temperature fluctuations at the evaporator top (a liquid film is expected to flow on the inner wall) at the second part of the curves. Thet are due to the falling film evaporation that can be amplified with the heat input increase. The last part concerns the condenser section, where the wall temperature is the lowest and almost uniform, again.
It is expected that the simulation model can be enhanced by using higher-order techniques, such as ROUND schemes, which can account for the convective flux [31]. Additionally, alternative reconstruction methods, like the iso-advectors approach [29], having been available in recent versions of OpenFOAM, can also be used.
3.2. Effects of the Heating Power
For the considered TPCT, the input heating power can vary between 20 and 300 W when the heat loss is neglected for common applications, including vacuum tube water heaters [41]. From the estimated temperature values along the thermosyphon, we have calculated the equivalent heat transfer coefficient he (Equation (25)) and the overall thermal resistance (Equation (26)) for all the considered cases. For the vertical position ( = 90°), Figure 8 shows the variation of the heat transfer parameters (he) and (RTh) according to the input power (Qin). The equivalent heat transfer at the evaporator is almost constant for relatively low heat input (Qin < 100 W). Over 100 W, it increases notably to reach 500 W/m2K. This can be explained, on the one hand, by the increased evaporation rate consequent to the heat input increase and, on the other hand, by the fact that when the saturation temperature increases, the pressure is allowed to vary more rapidly along the TPCT and thus helps an increased vapor flow rate to occur (see Equation (18)). The overall thermal resistance of the TPCT is almost constant and high for (Qin < 100 W), whereas it decreases significantly to 0.04 and 0.03 K/W, respectively, for input power of 200 and 300 W. It confirms that the heat transfer is improved for high heat input levels (200–300 W).
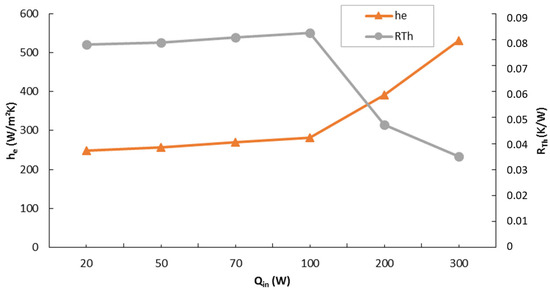
Figure 8.
Effects of the input power on the heat transfer parameters.
3.3. Effects of the TPCT Inclination
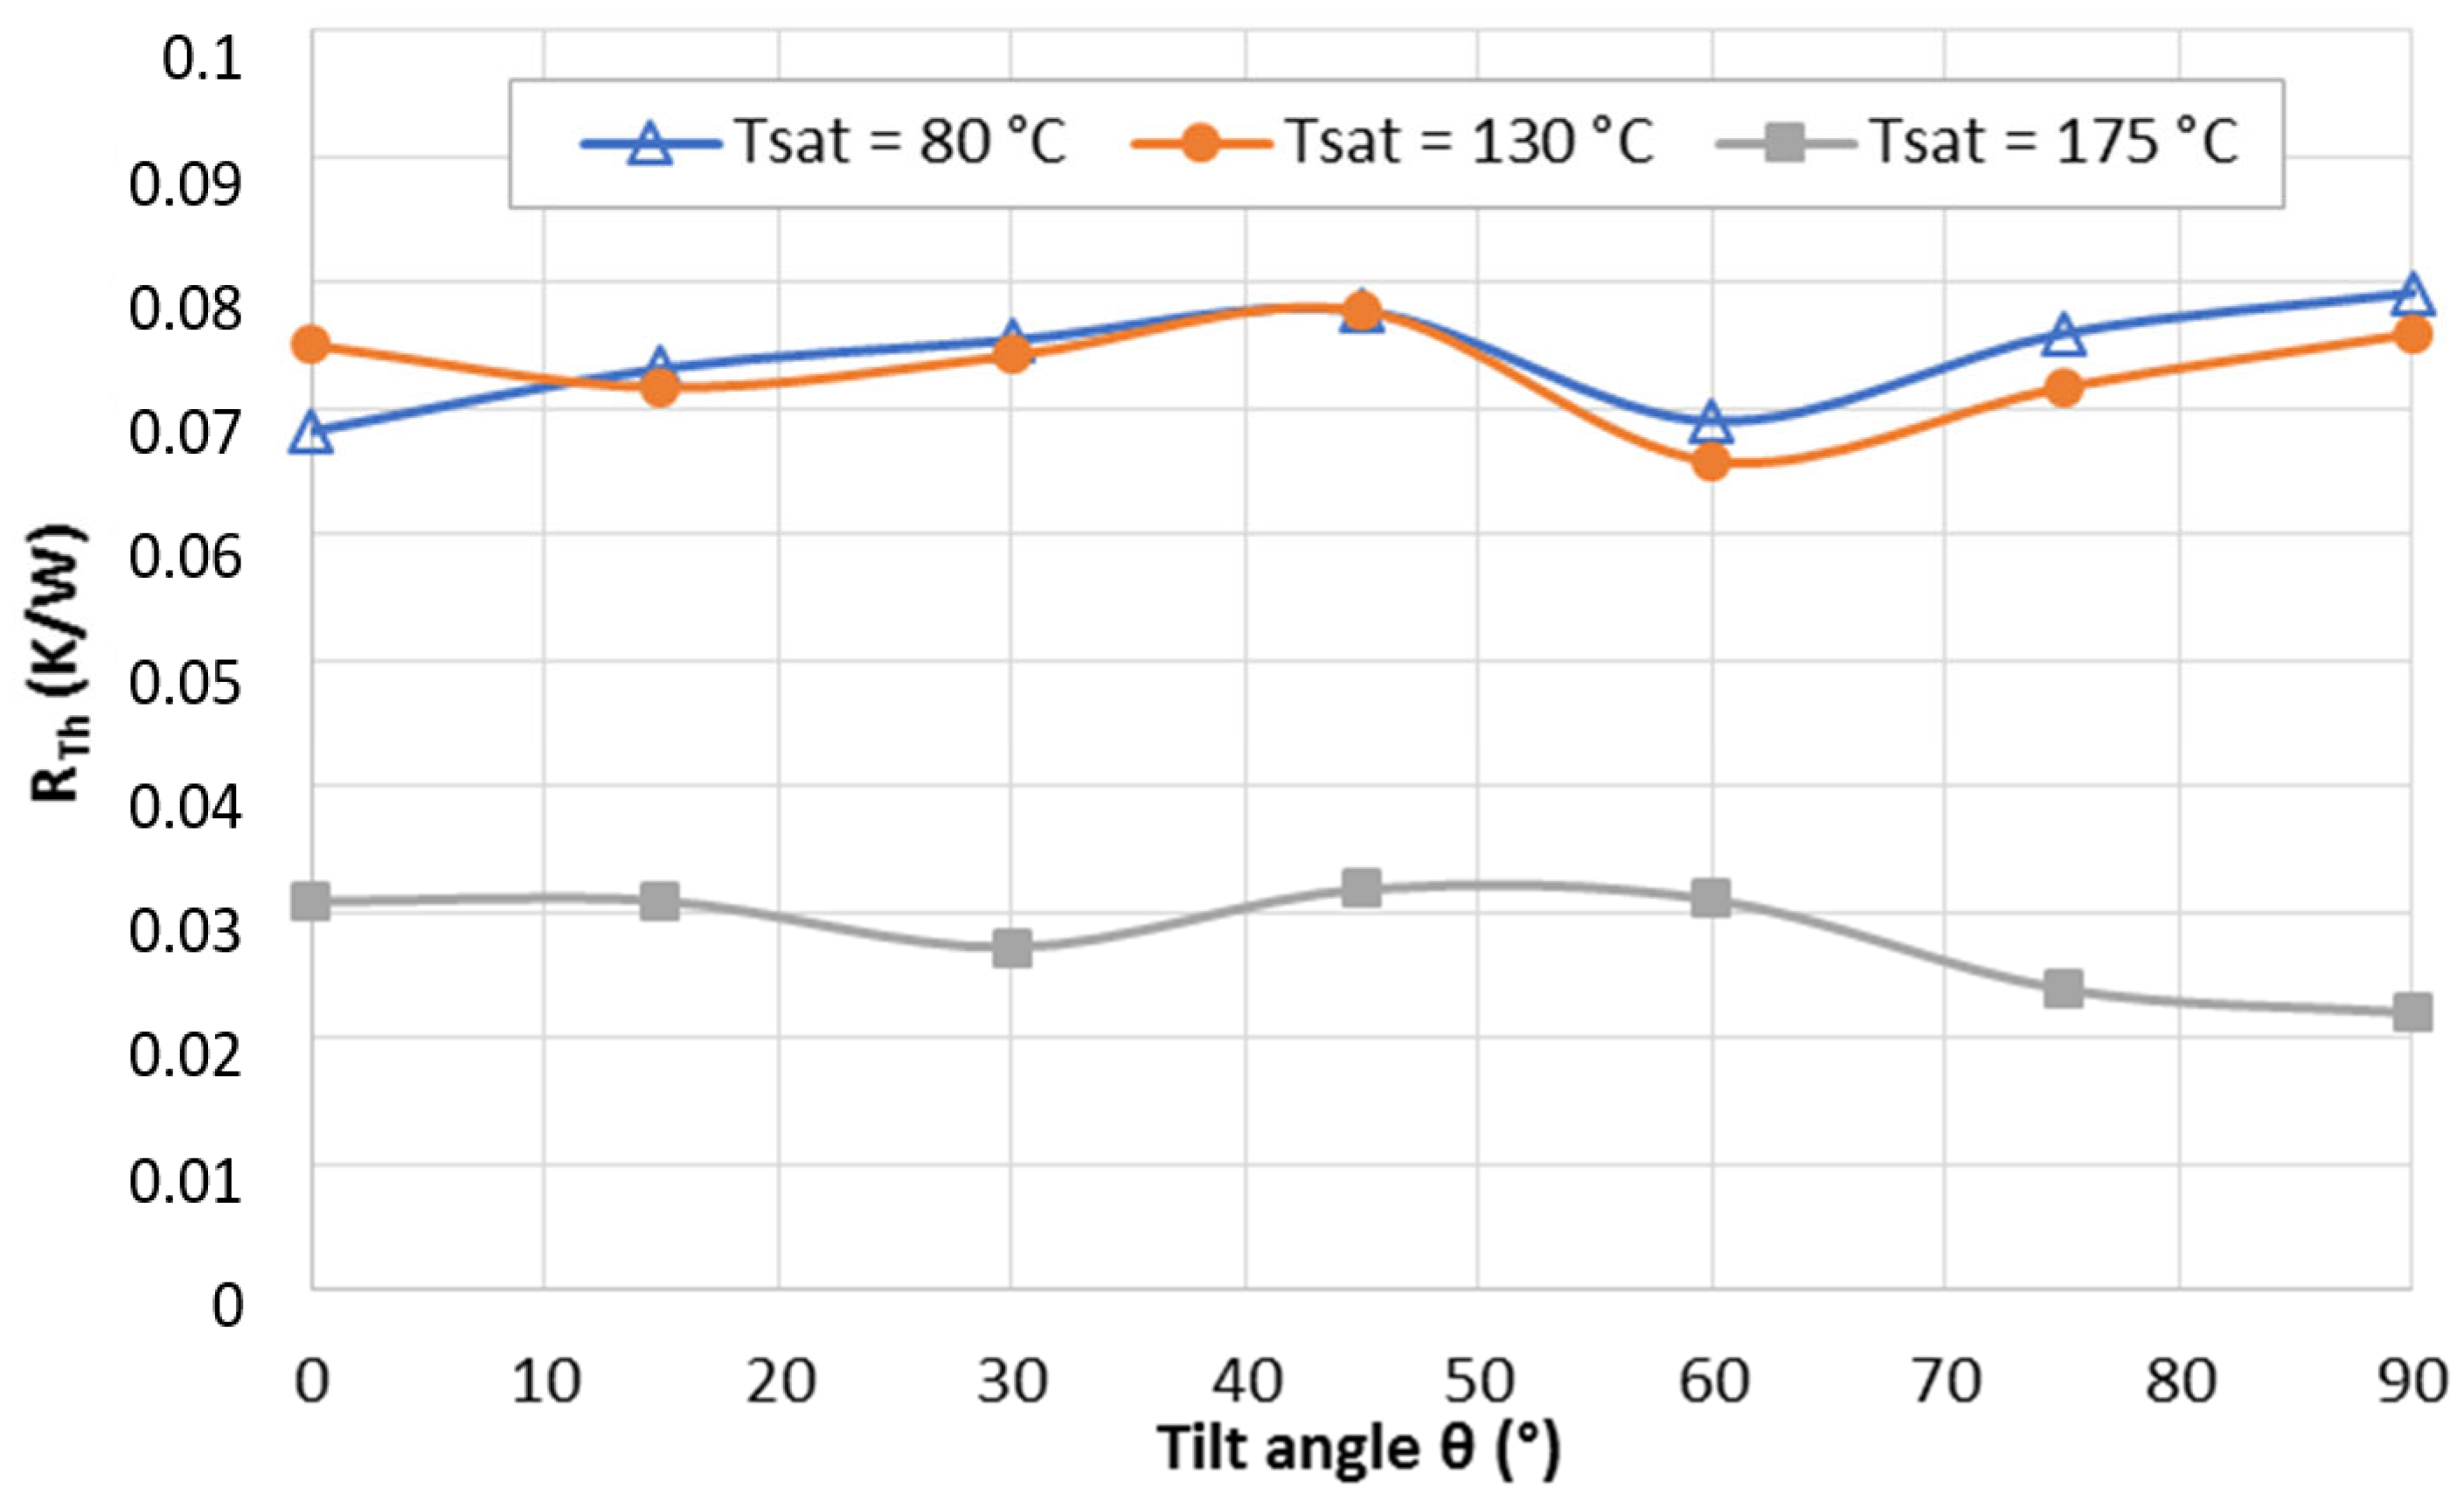
The developed numerical tool is also utilized to examine the impact of the TPCT’s tilt angle on heat transfer characteristics. Figure 9 illustrates the variation of the overall thermal resistance (RTh) with respect to the tilt angle () at different operating temperature values (Tsat = 80, 130, or 175 °C).
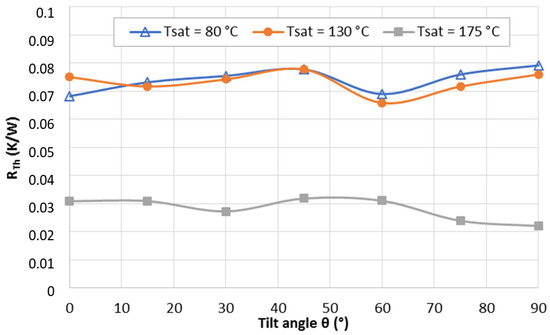
Figure 9.
Effect of the tilt angle on the thermal resistance.
In particular, it shows that a tilt angle of 60° is the optimal value for temperatures under 150 °C, allowing the best (and minimal) values of the overall thermal resistance. In fact, the driving force component on the inner surface of a TPCT is minimal when the inclination angle is small (see Equation (10)). This results in the lack of the working fluid’s ability to go back to the evaporator section, which affects the gas–liquid conversion rate. The heat transfer performance is consequently weaker. When the tilt angle increases, the gas–liquid two-phase flow in the tube is in the upper and lower layers, which (because of stratification) barely interact with each other: the shear force becomes then smaller. The internal steam’s high-speed scouring of the liquid film in the condensation section also makes the relative resistance gradually reduce. It should be noted that since the top of the TPCT evaporation section is directly in contact with the condensation section (no adiabatic region), the effect of gravity does not significantly change the distribution of the liquid film. It has little influence on the thermal resistance, and the heat transfer performance at high tilt angles (near the vertical position) is poorer at low heat input power. For higher values of Qin and an operating temperature (Tsat) above 150 °C, the lowest thermal resistance is achieved for a vertical position ( = 90°), suggesting the necessity to consider a larger driving force in order to compensate for the pressure loss due to shear and training.
4. Conclusions
This study made a focus on the thermal performance optimization of a TPCT used in vacuum tube solar collectors. For this aim, a numerical model was developed using the openFOAM toolbox. The obtained results were validated through a comparison with the experimental results of previous studies. A good accordance has indeed been revealed. The effects of the input heat power and the tilt angle were particularly investigated, specifically. According to the obtained results, the effects of the tilt angle on the temperature were more significant when the heat input increases. The temperature distribution along the TPCT has shown stratification as the tilt angle or the heating power increases. The heat transfer mechanisms involved in the TPCT operation can indeed be modified according to the input heat level. In fact, conduction is expected to be predominant at low heat input, whereas phase change and convective exchanges are expected to have an even more important effect at higher heating input power. Also, the increase in the input heat power leads to a decrease in the thermal resistance associated with the improvement of the heat transfer coefficient, in conformity with previous analyses. It was also shown that for an operating temperature under 130 °C, the optimal tilt angle was around 60°, whereas it was nearly 90° (vertical position) for higher temperatures (over 150 °C). For intermediate temperature (50–130 °C), a tilt angle of 60° is recommended to achieve relatively low thermal resistance and good heat transfer along the TPCT. Further attention should be paid to investigating the correlated effects of all the operating conditions in order to describe the optimal parameters of a TPCT. Finally, to limit the effects of numerical oscillations and spurious currents, implementation of high-precision reconstruction methods and convective flux schemes can improve the simulation model in future work.
Author Contributions
Z.L.: Conceptualization, methodology, software, validation, investigation, data curation, writing—original draft preparation, review and editing, visualization; A.M.B.: Conceptualization, methodology, software; A.J.: Conceptualization, project administration. All authors have read and agreed to the published version of the manuscript.
Funding
This research received no external funding.
Data Availability Statement
The raw data supporting the conclusions of this article will be made available by the authors on request.
Acknowledgments
This work was carried out as part of the PHC-Utique program supported by both the French and Tunisian governments under contract CMCU no. 23G1104.
Conflicts of Interest
The authors declare no conflicts of interest.
Abbreviations
The following abbreviations are used in this manuscript:
| TPCT | Two-Phase Closed Thermosyphon | |
| VOF | Volume of Fluid | |
| CFD | Computational Fluid Dynamics | |
| Nomenclature | ||
| Specific heat capacity of the liquid phase | J.kg−1.K−1 | |
| Specific heat capacity of the vapor phase | J.kg−1.K−1 | |
| D | Tube diameter | m |
| Continuum capillarity force | N.m−3 | |
| Standard acceleration of gravity | m.s−2 | |
| Equivalent heat transfer coefficient at the evaporator | W.m−2.K−1 | |
| Convective heat transfer coefficient at the condenser | W.m−2.K−1 | |
| Latent heat of vaporization | J.kg−1 | |
| H | Specific enthalpy | J.kg−1 |
| k | Thermal conductivity | W.m−1.K−1 |
| Evaporator length | M | |
| Condenser length | m | |
| M | Molar mass | g.mol−1 |
| Pressure | Pa | |
| Saturation pressure | Pa | |
| Heat flux density at the condenser | W.m−2 | |
| Input heat flux density at the evaporator | W.m−2 | |
| Heat flux at the condenser section | W | |
| Input heating power at the evaporator | W | |
| Specific gas constant | J.mol−1.K−1 | |
| Thermal resistance | K.W−1 | |
| Mass source term | Kg.m−3.s−1 | |
| Energy source term | W.m−3 | |
| Temperature | K | |
| Saturation temperature | K | |
| Mean temperature at the evaporator | K | |
| Mean temperature at the condenser | K | |
| Cooling fluid temperature | K | |
| Velocity | m.s−2 | |
| Liquid volume fraction | ||
| Vapor volume fraction | ||
| Time relaxation coefficient for evaporation | s−1 | |
| Time relaxation coefficient for condensation | s−1 | |
| Liquid–vapor interface curvature | m−1 | |
| Surface tension | N.m−1 | |
| Tilt angle of the TPCT | ° | |
| Fluid dynamic viscosity | Pa.s | |
| Fluid density | Kg.m−3 | |
References
- Fudholi, A.; Sopian, K. A review of solar air flat plate collector for drying application. Renew. Sustain. Energy Rev. 2019, 102, 333–345. [Google Scholar] [CrossRef]
- European Commission. Proposal for a Regulation of the European Parliament and of the Council Establishing the Framework for Achieving Climate Neutrality and Amending Regulation (EU) 2018/1999 (European Climate Law). 2020. Available online: https://eur-lex.europa.eu/legal-content/EN/TXT/?uri=celex%3A52020PC0080 (accessed on 10 June 2025).
- Aggarwal, S.; Kumar, R.; Lee, D.; Kumar, S.; Singh, T. A comprehensive review of techniques for increasing the efficiency of evacuated tube solar collectors. Heliyon 2023, 9, e15185. [Google Scholar] [CrossRef]
- Mantelli, M.B.H. Thermosyphons and Heat Pipes: Theory and Applications, 1st ed.; Springer Nature: Cham, Switzerland, 2021. [Google Scholar]
- Jafari, D.; Franco, A.; Filippeschi, S.; DiMarco, P. Two-Phase closed thermosyphons: A review of studies and solar applications. Renew. Sustain. Energy Rev. 2016, 53, 575–593. [Google Scholar] [CrossRef]
- Arat, H.; Arslan, O.; Ercetin, U.; Akbulut, A. Experimental study on heat transfer charcateristics of closed thermosyphon at different volumes and inclination angles for variabe vacuum pressures. Case Stud. Therm. Eng. 2021, 26, 101–117. [Google Scholar] [CrossRef]
- Lataoui, Z.; Jemni, A. Experimental investigation of a stainless steel two-phase closed thermosyphon. Appl. Therm. Eng. 2017, 121, 721–727. [Google Scholar] [CrossRef]
- Gou, X.; Li, G.; Zhang, R.; Jian, C.; Zhang, Q.; Li, B.; Dong, Q. Critical and optimal inclination angles of two-phase closed thermosyphon under different operating conditions. Int. J. Heat Mass Transf. 2021, 177, 121540. [Google Scholar] [CrossRef]
- Kim, Y.; Shin, D.H.; Kim, J.S.; You, S.M.; Lee, J. Boiling and condensation heat transfer of inclined two-phase closed thermosyphon with various filling ratios. Appl. Therm. Eng. 2018, 145, 328–342. [Google Scholar] [CrossRef]
- Wang, Y.; Wang, X.; Wang, J.; Liu, Y.; Chen, J. Heat transfer performance of a two-phase closed thermosyphon with different inclination angles based on the core-tube monitoring. Case Stud. Therm. Eng. 2023, 42, 102738. [Google Scholar] [CrossRef]
- Li, G.; Zhang, Y.; Zhang, G.; Huang, H.; Ding, H. Transient experimental and numerical study under different heating fluxes and filling ratios. Appl. Therm. Eng. 2024, 243, 122514. [Google Scholar] [CrossRef]
- Shabgard, H.; Xiao, B.; Faghri, A.; Gupta, R.; Weissman, W. Thermal characteristics of a closed thermosyphon under various filling conditions. Int. J. Heat Mass Transf. 2014, 70, 91–102. [Google Scholar] [CrossRef]
- Ahmed, I.S.; Al Jubori, A.M. Assessment of heat transfer and flow characteristics of a two-phase closed thermosiphon. Heat Transf. 2021, 50, 1351–1370. [Google Scholar] [CrossRef]
- Naruka, D.S.; Dwivedi, R.; Singh, P.K. Experimental inquisition of heat pipe: Performance evaluation for different fluids. Exp. Heat Transf. 2020, 33, 668–682. [Google Scholar] [CrossRef]
- Mahdavi, M.; Tiari, S.; Schampheleire, S.D.; Qiu, S. Experimental study of the thermal characteristics of a heat pipe. Exp. Therm. Fluid Sci. 2018, 93, 292–304. [Google Scholar] [CrossRef]
- Sarafraz, M.; Pourmehran, O.; Yang, B.; Arjomandi, M. Assessment of the thermal performance of a thermosyphon heat pipe using zirconia-acetone nanofluids. Renew. Energy 2019, 136, 884–895. [Google Scholar] [CrossRef]
- Khaongam, K.; Chompookham, T.; Parametthanuwat, T. Internal flow pattern of the condenser section that affects the heat transfer characteristics of rectangular two-phase closed thermosyphon. Case Stud. Therm. Eng. 2025, 72, 106246. [Google Scholar] [CrossRef]
- Nobrega, G.; Cardoso, B.; Souza, R.; Pereira, J.; Pontes, P.; Catarino, S.O.; Pinho, D.; Lima, R.; Moita, A. A review of novel heat transfer materials and fluids for aerospace applications. Aerospace 2024, 11, 275. [Google Scholar] [CrossRef]
- Dhairiyasamy, R.; Gabiriel, D.; Varudharajan, G.; Manivannan, J.M.; Arputharaj, B.S.; Arputharaj, B.S.; Awadh, M.A.; Al-Mdallal, Q.M. Impact of coated silver nanoplates on the thermal efficiency of heat pipes under varying operating conditions. Case Stud. Therm. Eng. 2025, 67, 105662. [Google Scholar] [CrossRef]
- Mathry, A.H.; Al-Mousawi, F.N.; Dhaidan, N.S.; Al-Shohani, W.A.M.; Alammar, A.A. Impact of design and operating parameters on the thermal performance of heat pipes: A review. J. Eng. Res. 2024, 13, 985–1000. [Google Scholar] [CrossRef]
- Seo, J.; Lee, J.; Lee, J. Impact force and occurrence condition of geyser boiling in two-phase closed thermosyphon. Int. Commun. Heat Mass Tran. 2024, 159, 108262. [Google Scholar] [CrossRef]
- Bahar, A.; Ghafouri, J.; Zamzamian, K. A numerical investigation into the application of thermosyphons for preventing the freezing of water meters, utilizing pure water and different nanofluids. Int. J. Thermofl. 2025, 26, 101088. [Google Scholar] [CrossRef]
- Kodancha, P.; Tripathi, S.; Hemadri, V. Experimental investigation of thermal performance of cylindrical thermosyphon with novel wettability gradient and self-rewetting fluids. Appl. Therm. Eng. 2025, 278, 127191. [Google Scholar] [CrossRef]
- Rukruang, A.; Kaew-On, J.; Wongwises, S.; Wang, C.-C. Experimental optimization and performance limits of a multiport minichannel thermosyphon for air-cooled applications. Appl. Therm. Eng. 2025, 279, 127540. [Google Scholar] [CrossRef]
- Kang, S.; Kim, D. Boiling and liquid film evaporation in a thermosyphon under horizontal vibrations. Int. Commun. Heat Mass Tran. 2025, 166, 109119. [Google Scholar] [CrossRef]
- The OpenFOAM Foundation. OpenFOAM v6. 2018. Available online: https://openfoam.org/download/6-linux/ (accessed on 15 May 2025).
- Tryggvason, G.; Scardovelli, R.; Zaleski, S. Direct Numerical Simulations of Gas-Liquid Multiphase Flows, 1st ed.; Cambridge University Press: Cambridge, UK, 2011. [Google Scholar]
- Deshpande, S.S.; Anumolu, L.; Trujillo, M.F. Evaluating the performance of the two-phase flow solver interFoam. Comput. Sci. Discov. 2012, 5, 014016. [Google Scholar] [CrossRef]
- Gamet, L.; Scala, M.; Roenby, J.; Scheufler, H.; Pierson, J.L. Validation of volume-of-fluid OpenFOAM® isoAdvector solvers using single bubble benchmarks. Comput. Fluids 2020, 213, 104722. [Google Scholar] [CrossRef]
- Roenby, J.; Bredmose, H.; Jasak, H. A computational method for sharp interface advection. R. Soc. Open Sci. 2016, 3, 160405. [Google Scholar] [CrossRef]
- Deng, X. A new open-source library based on novel high-resolution structure-preserving convection schemes. J. Comput. Sci. 2023, 74, 74–102150. [Google Scholar] [CrossRef]
- Deng, X. A Unified Framework for Non-linear Reconstruction Schemes in a Compact Stencil. Part 1: Beyond Second Order. J. Comput. Phys. 2023, 481, 112052. [Google Scholar] [CrossRef]
- Lataoui, Z.; BenSelama, A.M. Modelling of heat and mass transfer in a two-phase closed thermosyphon. Energy 2024, 313, 133851. [Google Scholar] [CrossRef]
- Brahim, T.; Jemni, A. A two dimensional steady state roll heat pipe analyses for heat exchanger applications. Int. J. Heat Technol. 2012, 30, 115–120. [Google Scholar] [CrossRef]
- Wang, X.; Zhu, Y.; Wang, Y. Development of pressure-based phase change model for CFD modelling of heat pipes. Int. J. Heat Mass Transf. 2019, 145, 118763. [Google Scholar] [CrossRef]
- OpenFOAM v6 User Guide. 2018. Available online: https://doc.cfd.direct/openfoam/user-guide-v6/contents (accessed on 28 July 2025).
- Kharangate, C.R.; Modawar, I. Review of computational studies on boiling and condensation. Int. J. Heat Mass Transf. 2017, 108, 1164–1196. [Google Scholar] [CrossRef]
- Zou, P.; Kim, T.; Bricker, J.D.; Uijttewaal, W.S.J. Assessment of interfacial turbulence treatment models for free surface flows. J. Hydraul. Res. 2023, 61, 651–667. [Google Scholar] [CrossRef]
- Frederix, E.M.A.; Mathur, A.; Dovizio, D.; Geurts, B.J.; Komen, E.M.J. Reynolds-averaged modeling of turbulence damping near a large-scale interface in two-phase flow. Nucl. Eng. Des. 2018, 333, 122–130. [Google Scholar] [CrossRef]
- Jouhara, H.; Reay, D.; McGlen, R.; Kew, P.; McDonough, J. Heat Pipe Types and Developments. In Heat Pipes: Theory, Design and Applications, 7th ed.; Elsevier: Oxford, UK, 2024. [Google Scholar]
- Kumar, P.M.; Mylsamy, K. A comprehensive study on thermal storage characteristics of nano-CeO2 embedded phase change material and its influence on the performance of evacuated tube solar water heater. Renew. Energy 2020, 162, 662–676. [Google Scholar] [CrossRef]


Disclaimer/Publisher’s Note: The statements, opinions and data contained in all publications are solely those of the individual author(s) and contributor(s) and not of MDPI and/or the editor(s). MDPI and/or the editor(s) disclaim responsibility for any injury to people or property resulting from any ideas, methods, instructions or products referred to in the content. |
© 2025 by the authors. Licensee MDPI, Basel, Switzerland. This article is an open access article distributed under the terms and conditions of the Creative Commons Attribution (CC BY) license (https://creativecommons.org/licenses/by/4.0/).