


Lamotrigine-Loaded Poloxamer-Based Thermo-Responsive Sol–Gel: Formulation, In Vitro Assessment, Ex Vivo Permeation, and Toxicology Study

 ,
,  ,
,  and
and 
Abstract
: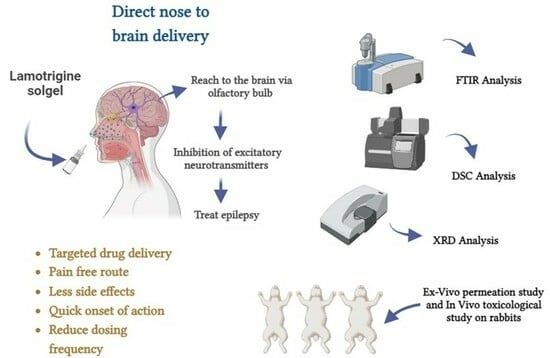
1. Introduction
2. Results
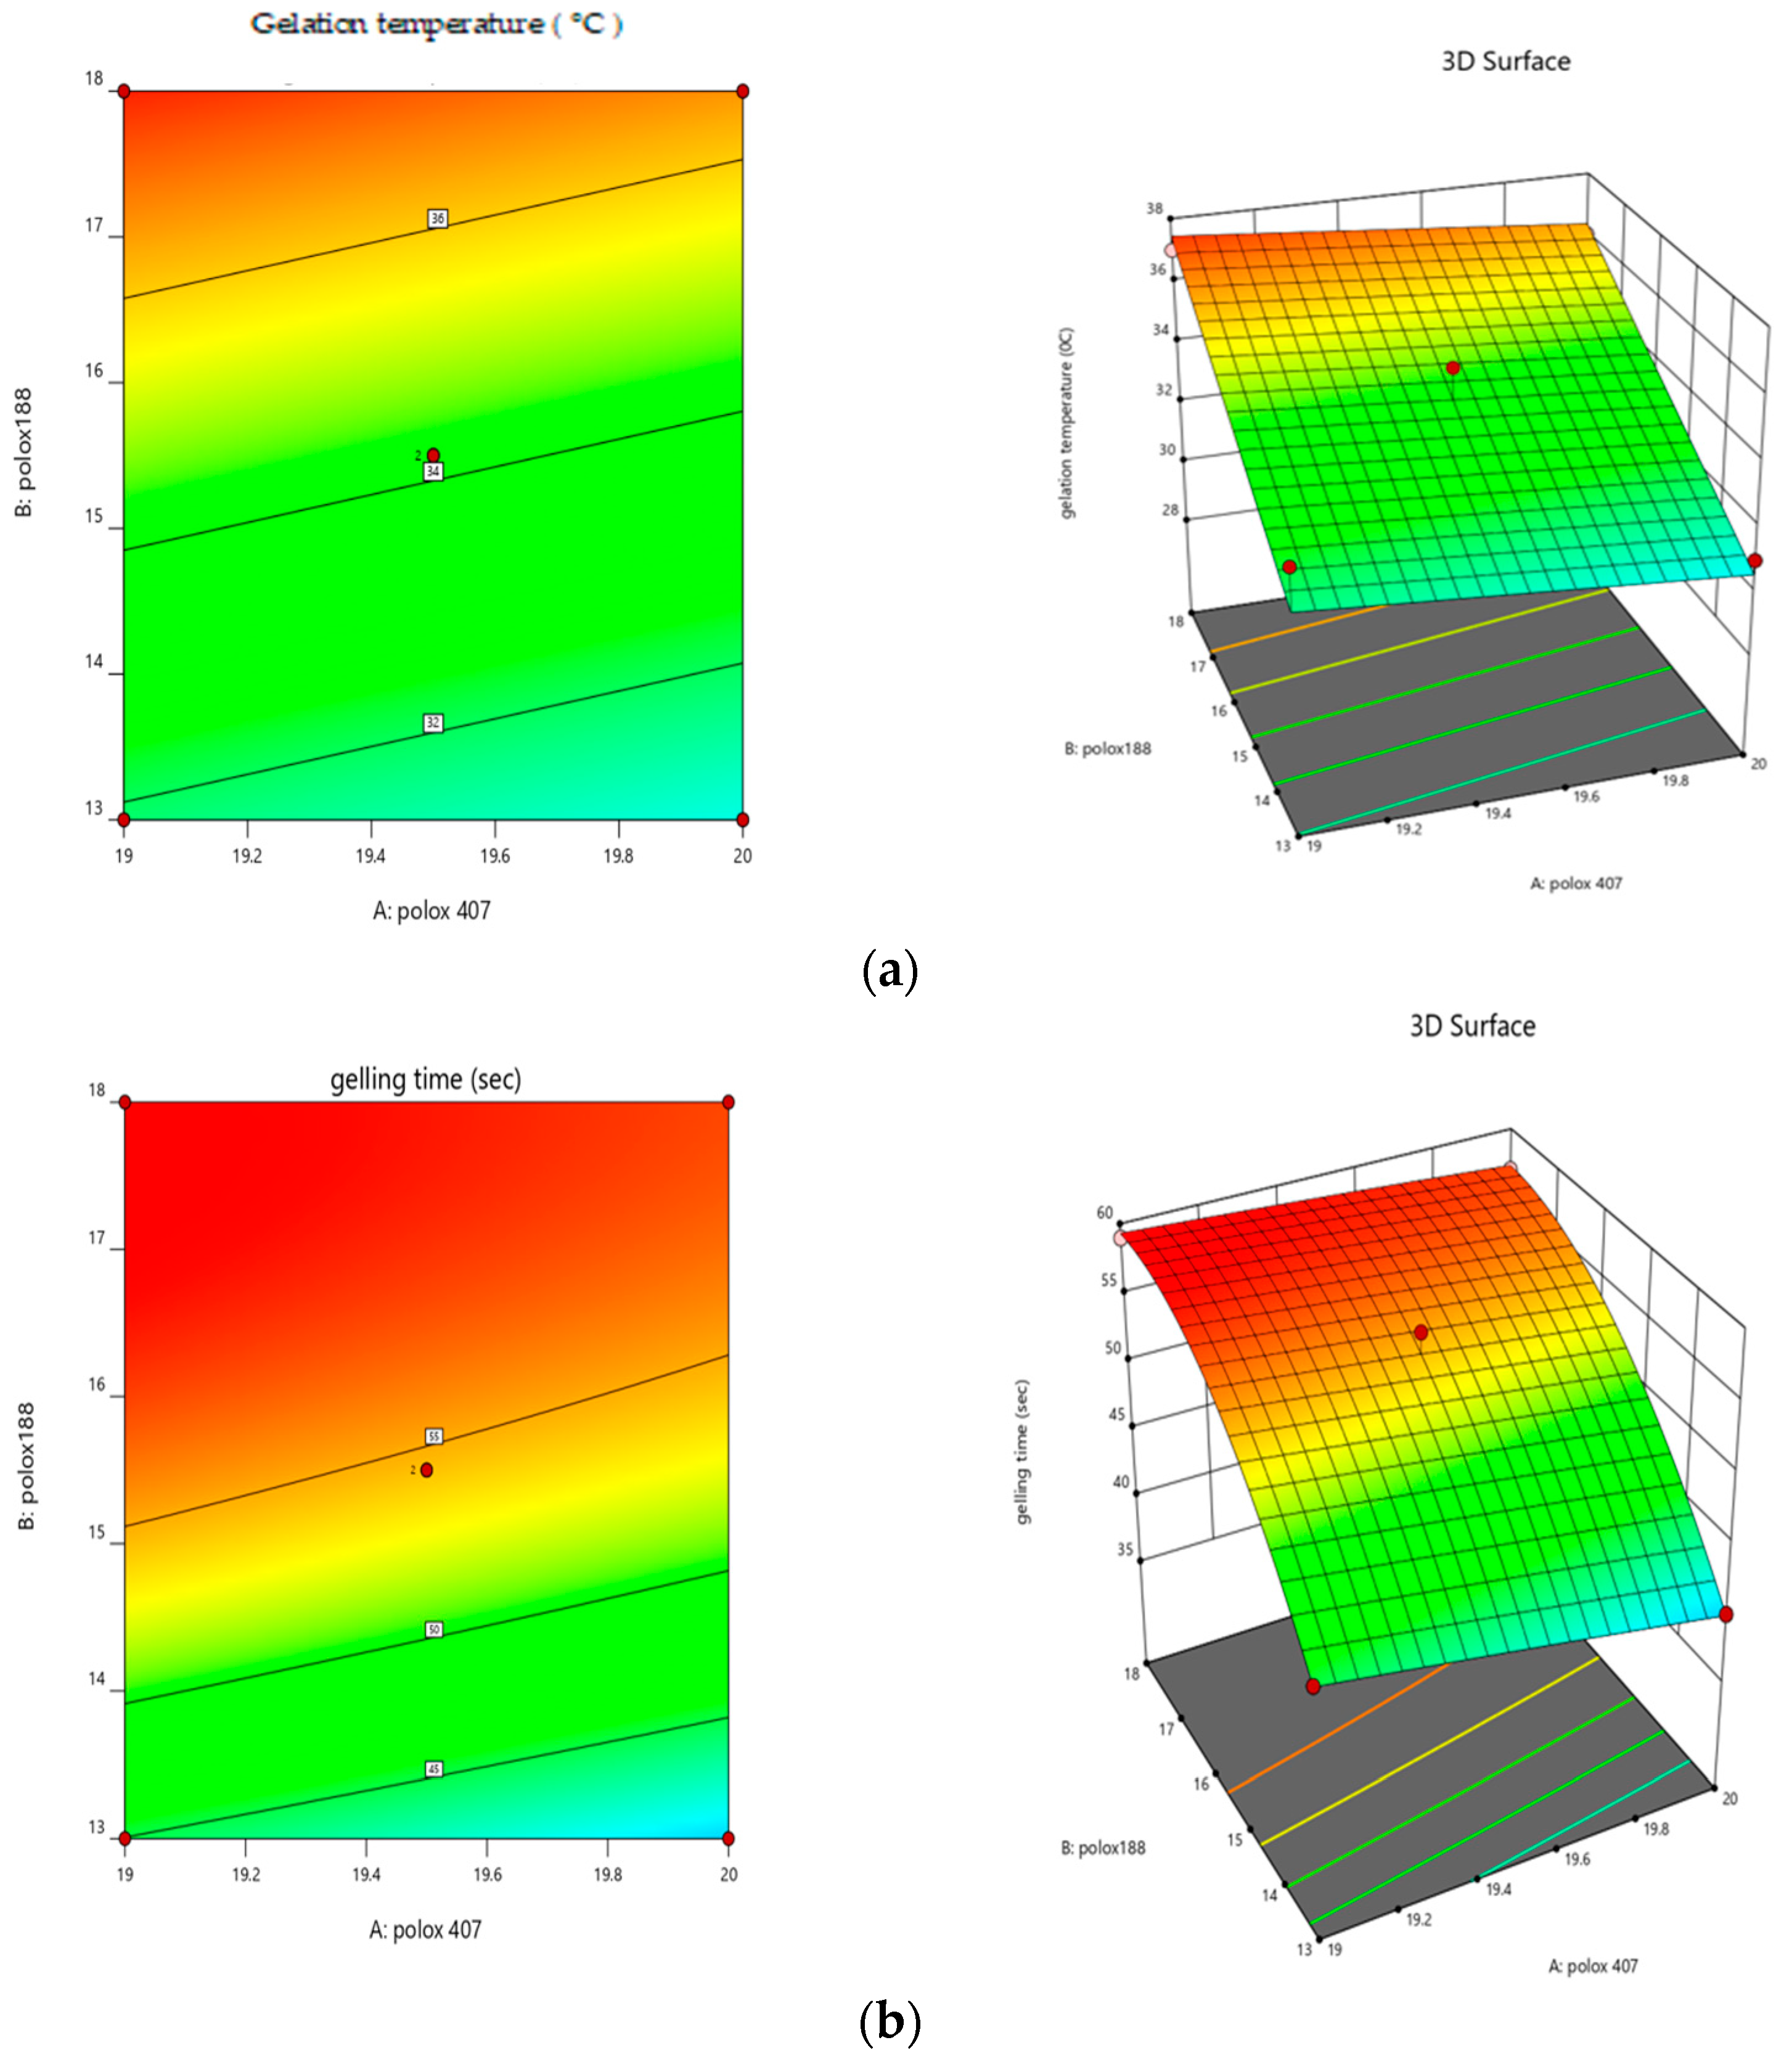
2.1. Formulation Optimization Data Analysis
2.2. Clarity
2.3. pH
2.4. Viscosity
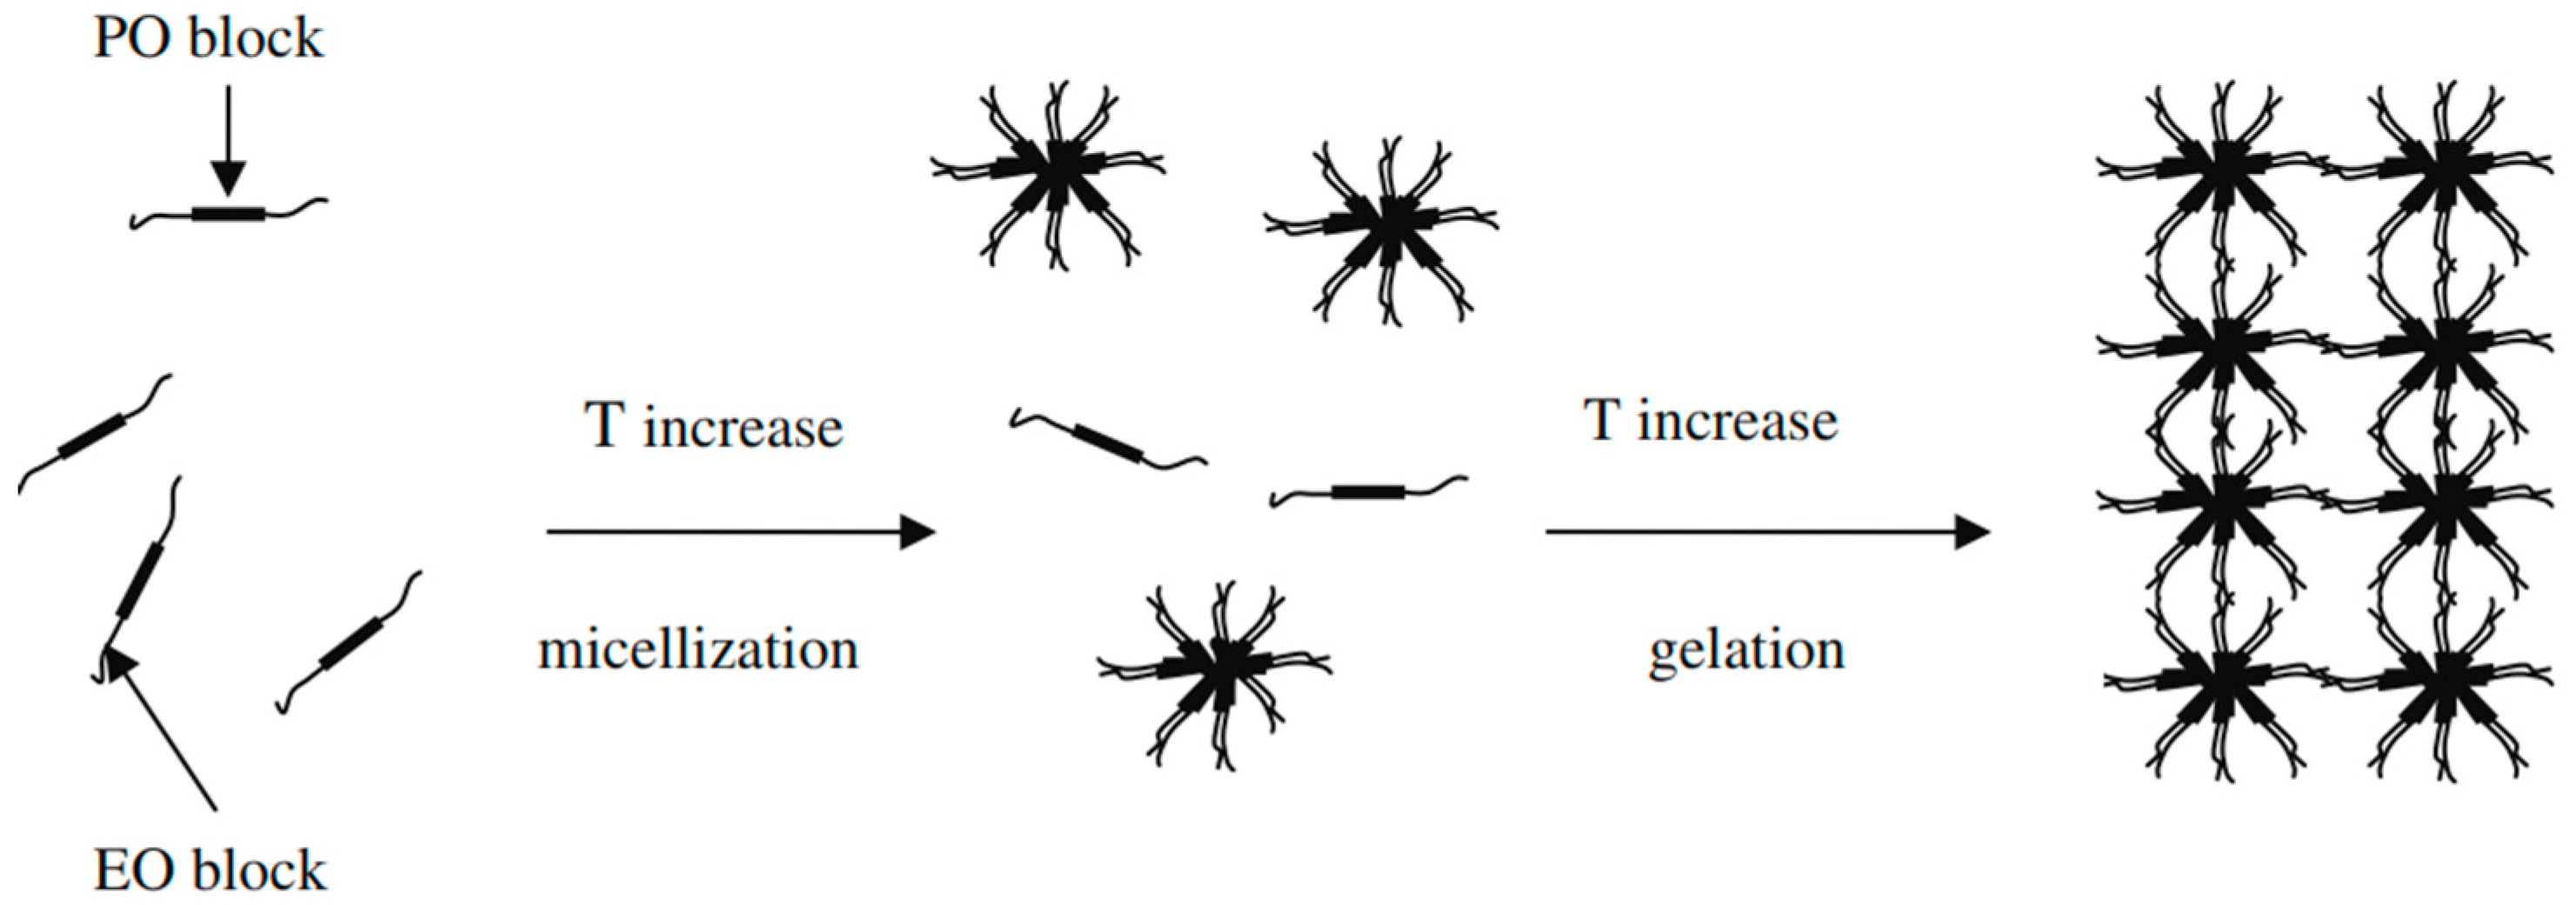
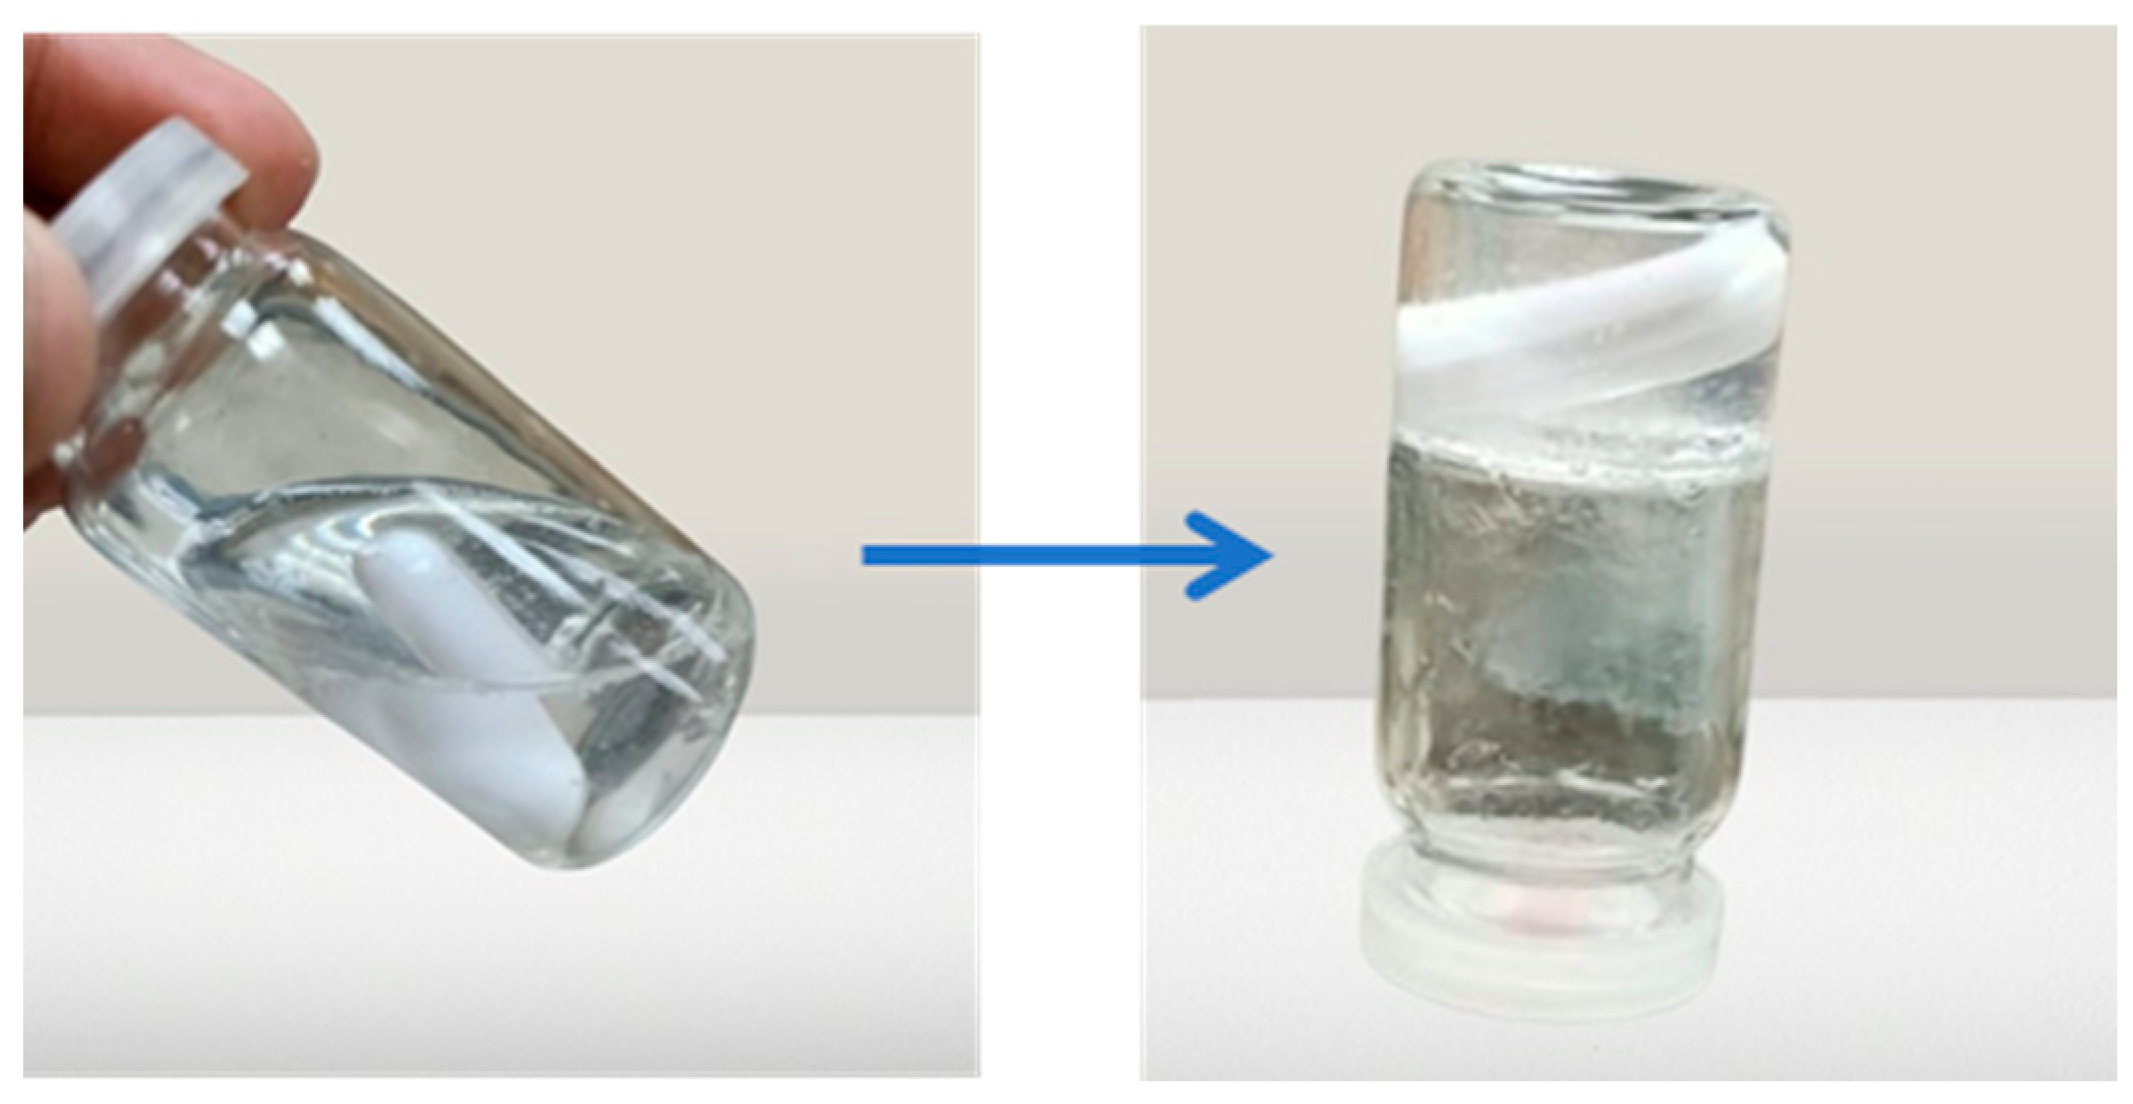
2.5. Sol–Gel Gelling Temperature and Time Measurement
2.6. Gel Strength
2.7. Drug Content
2.8. Spreadability
2.9. Stability Studies
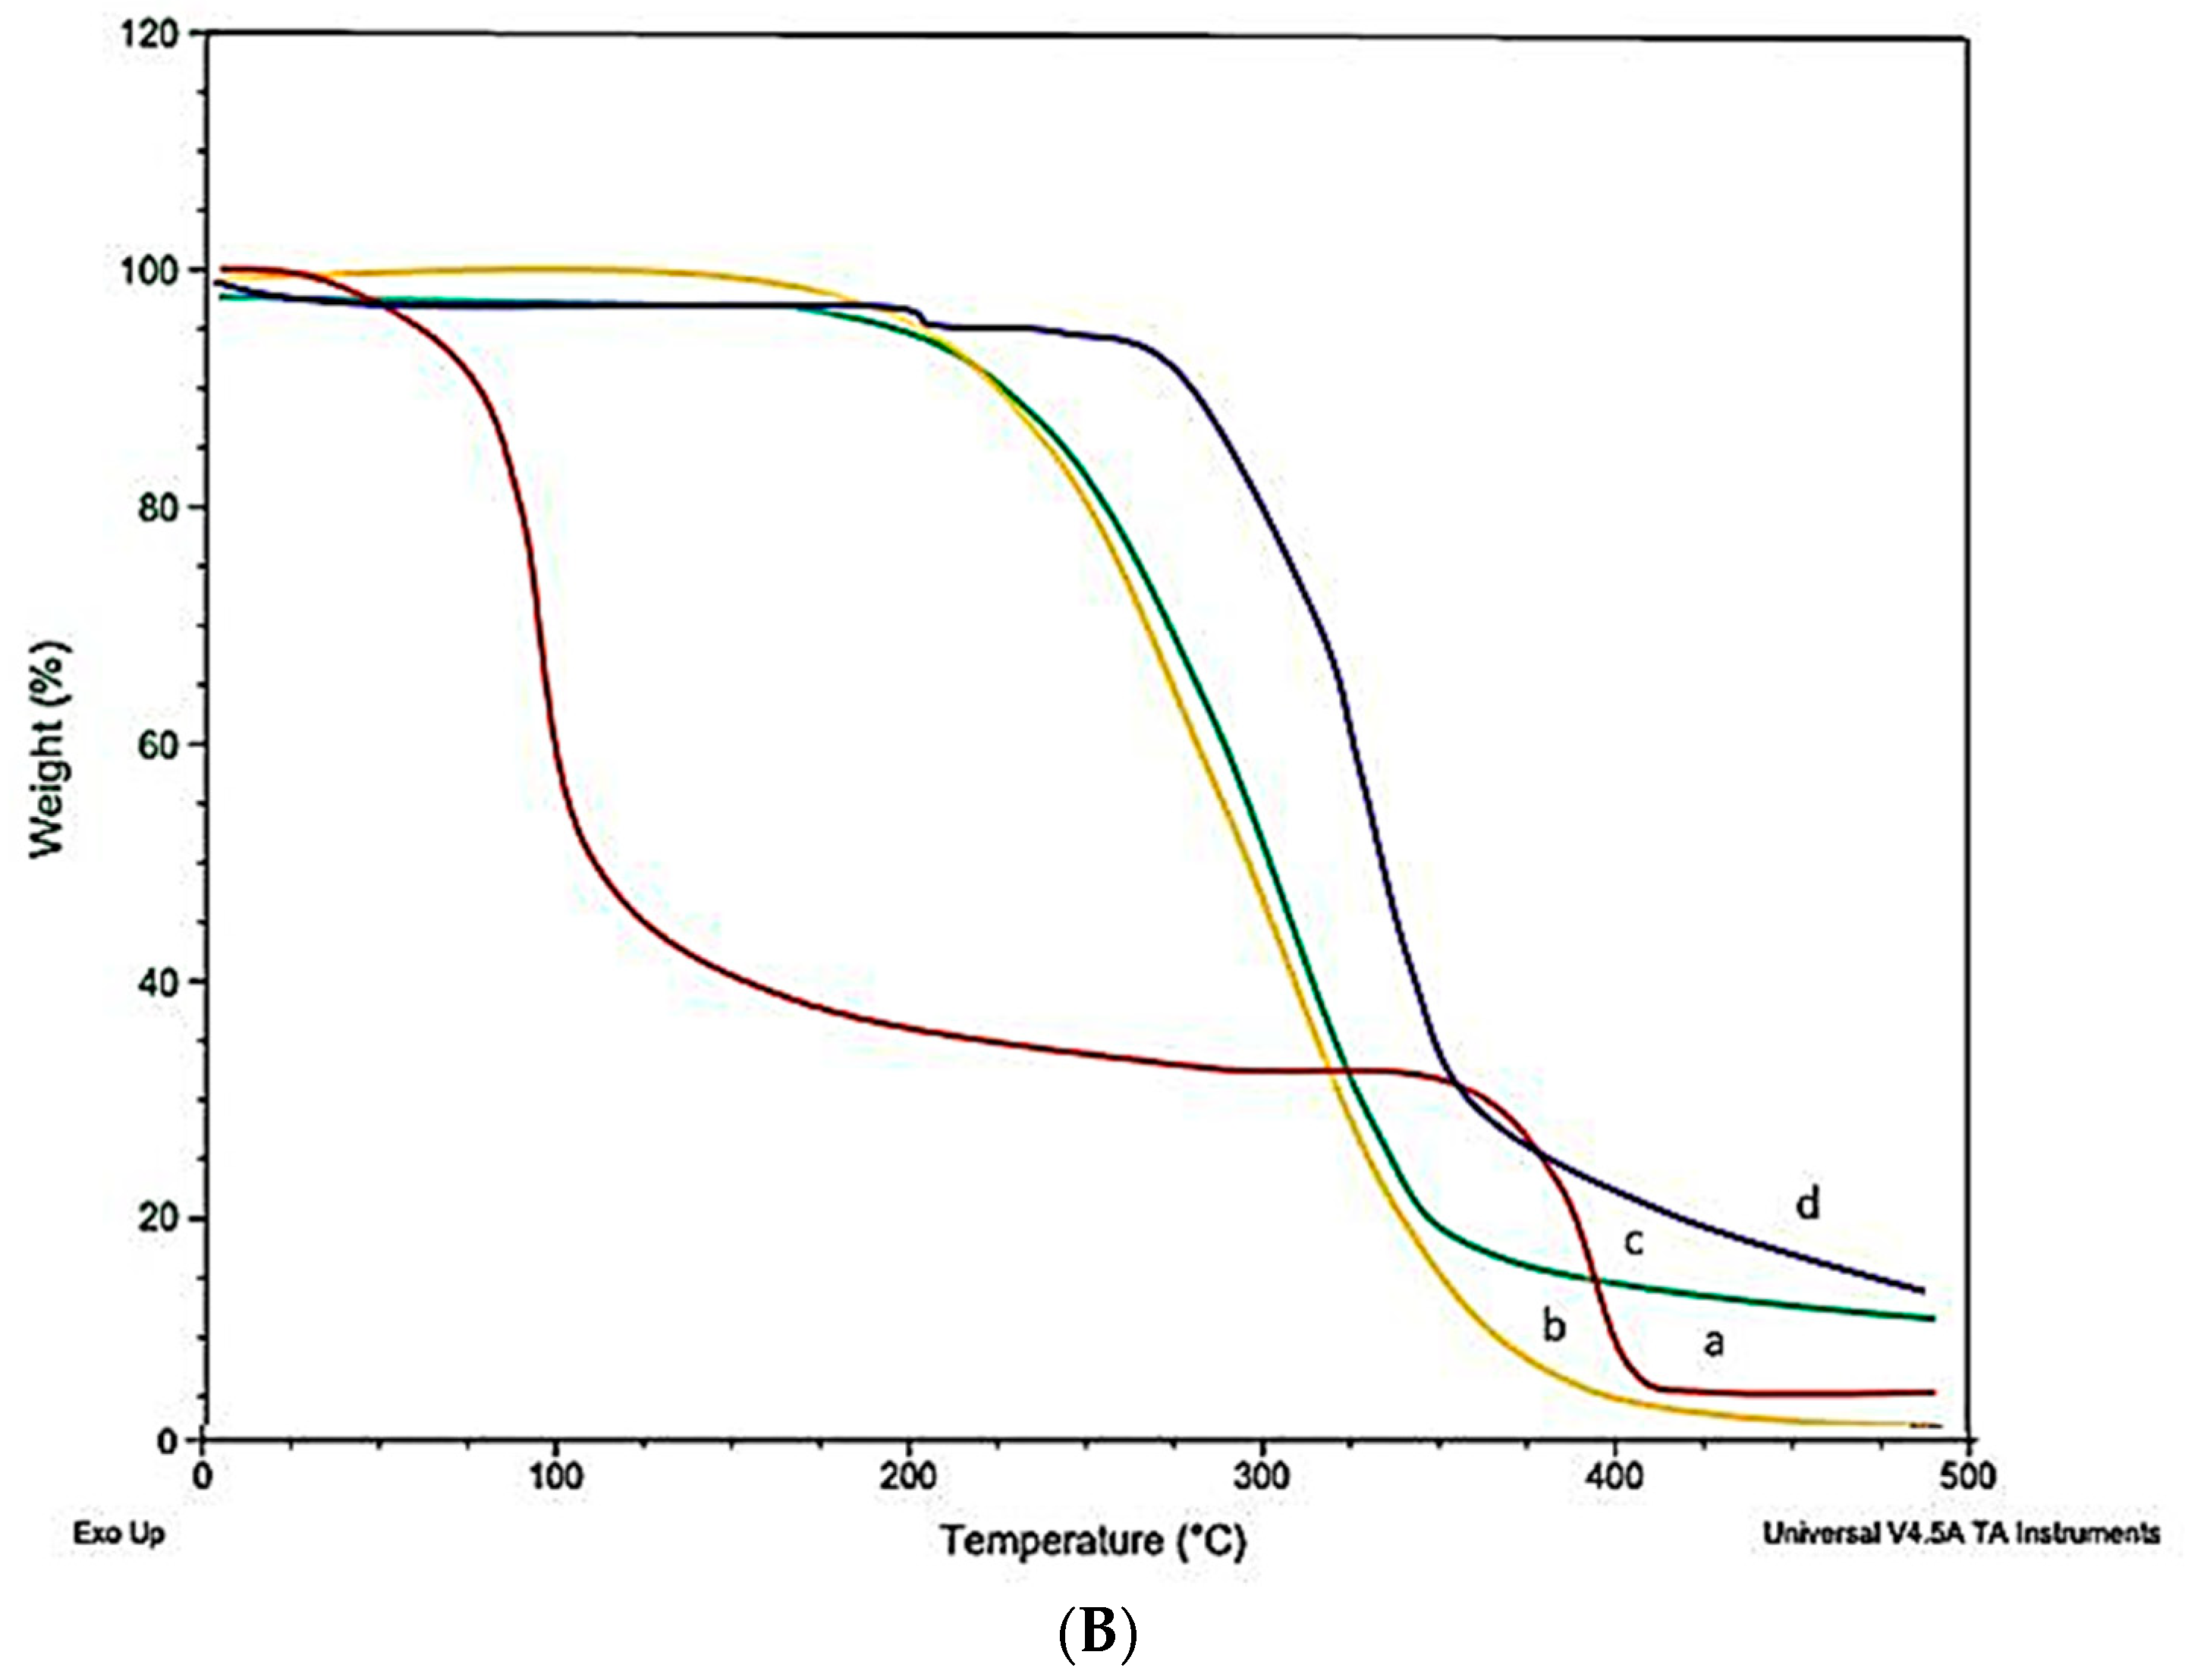
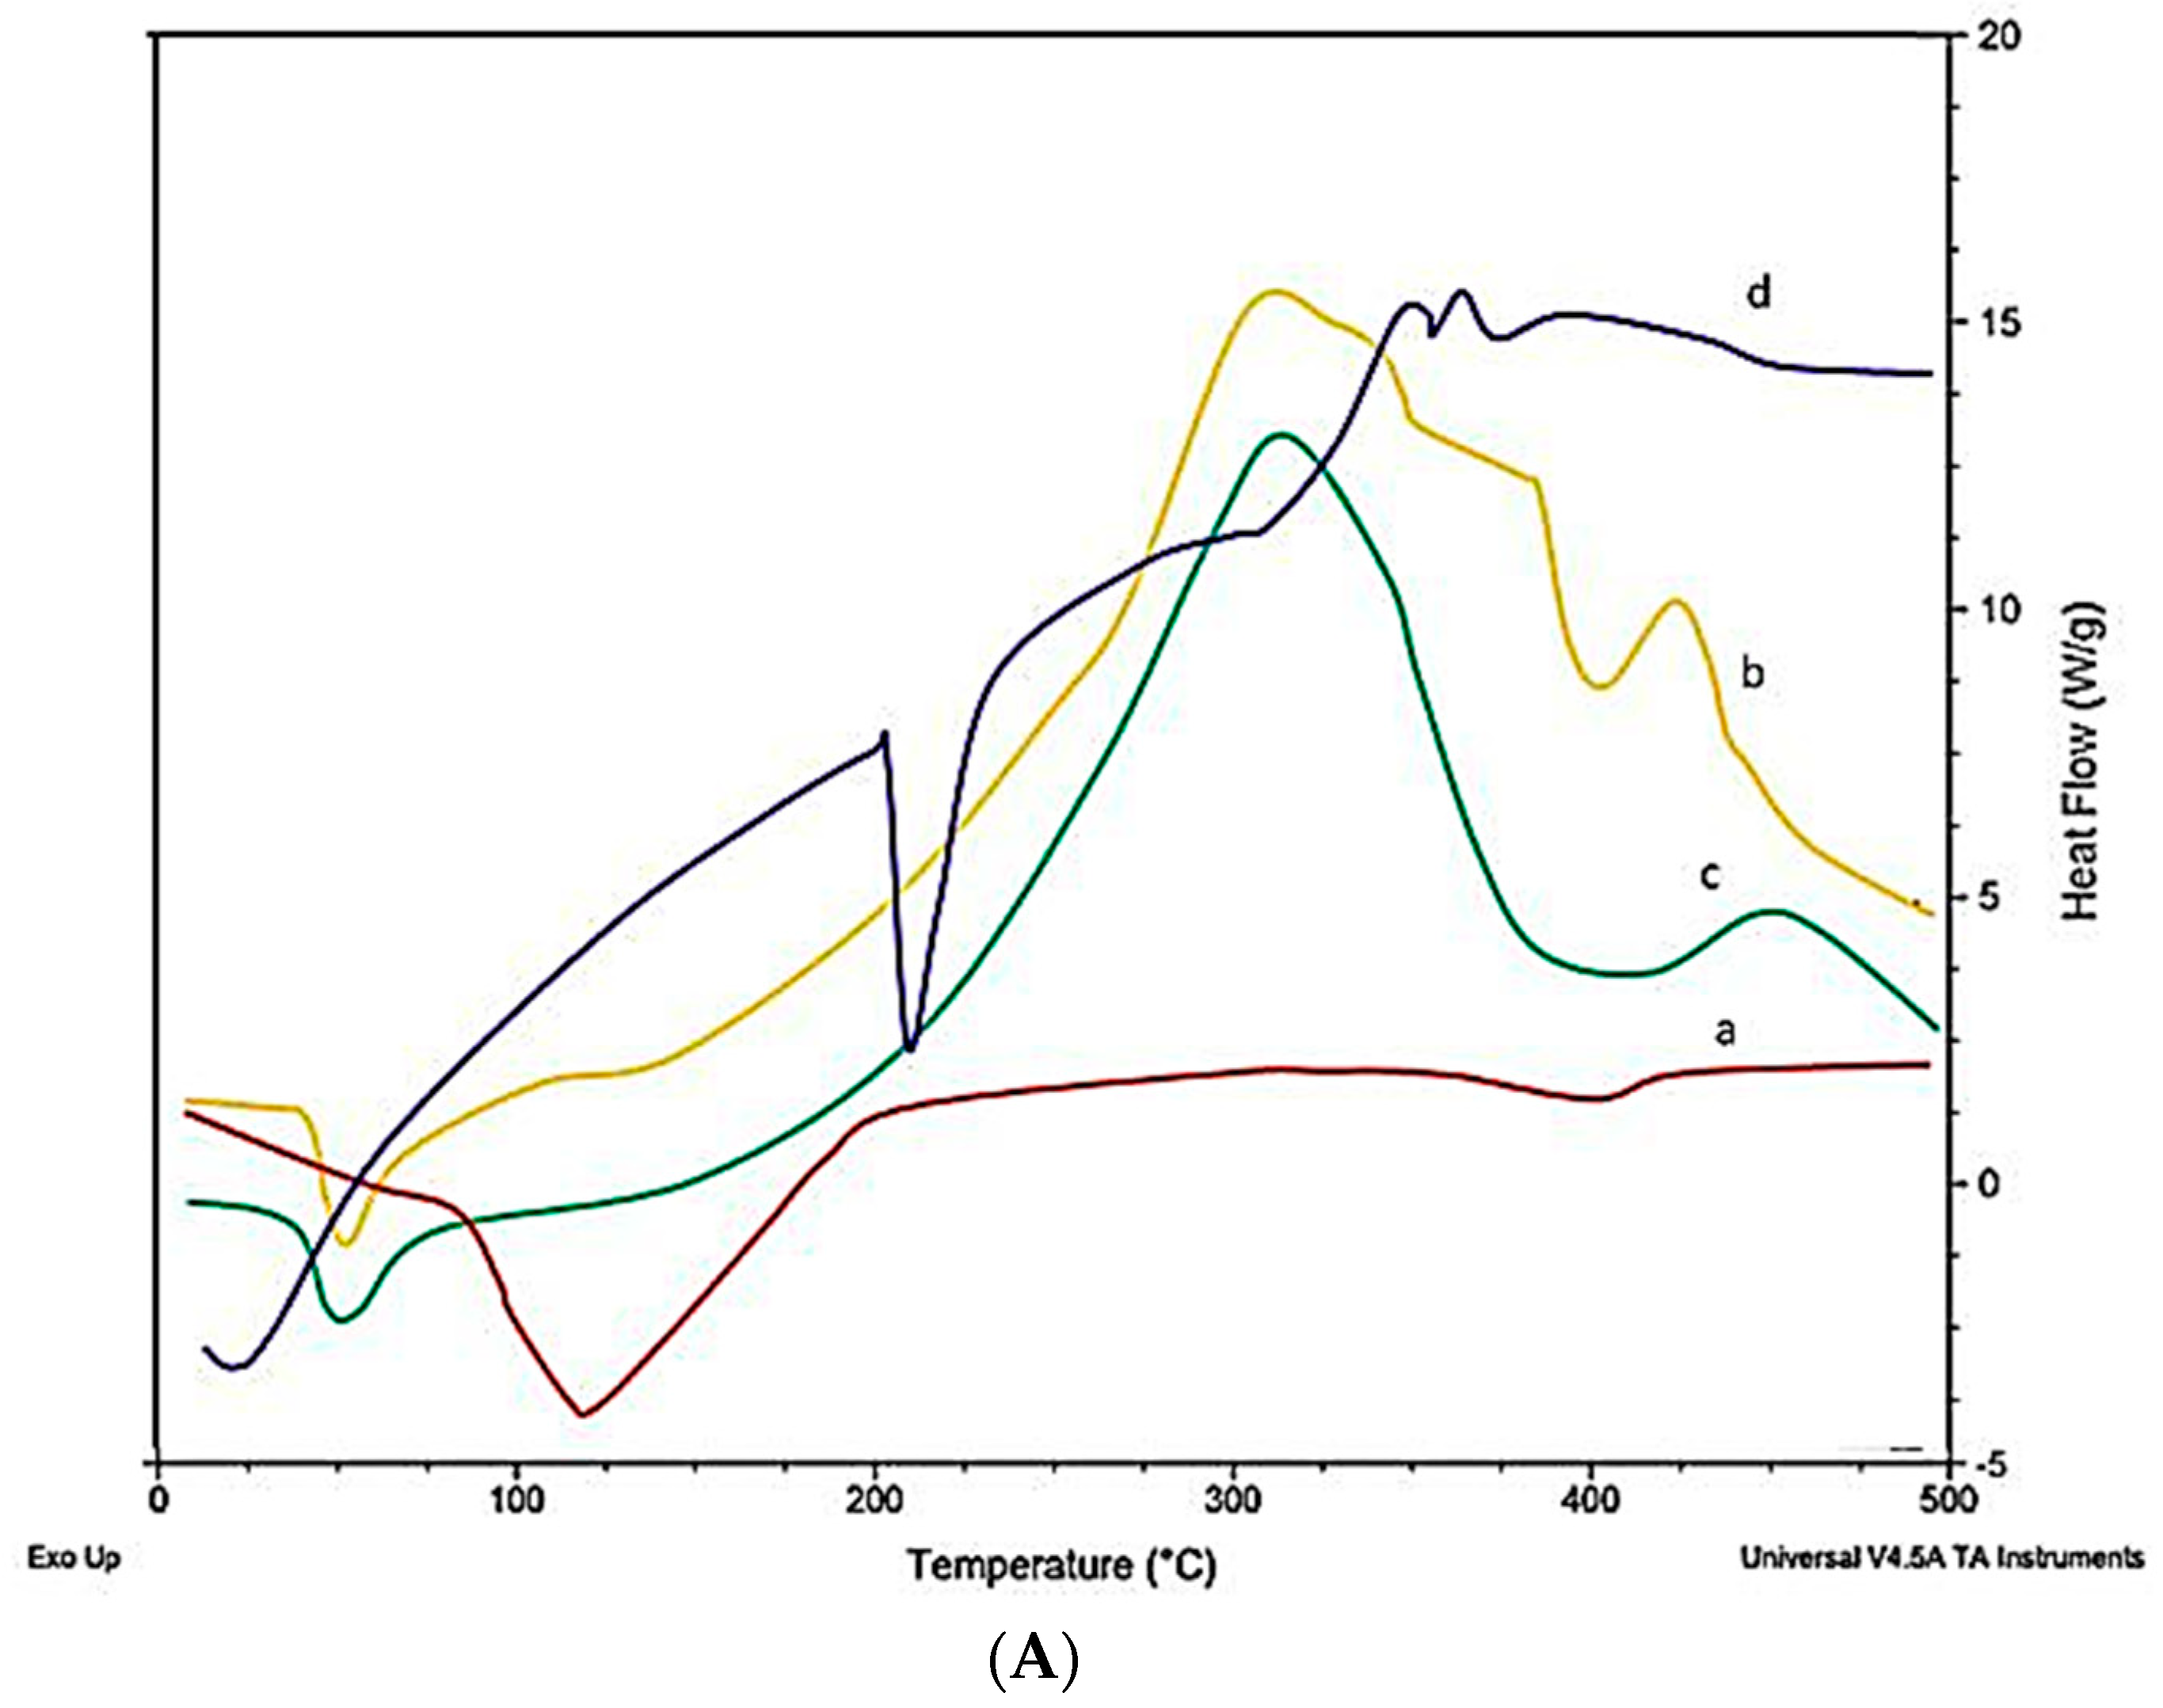
2.10. Differential Scanning Calorimeter (DSC)
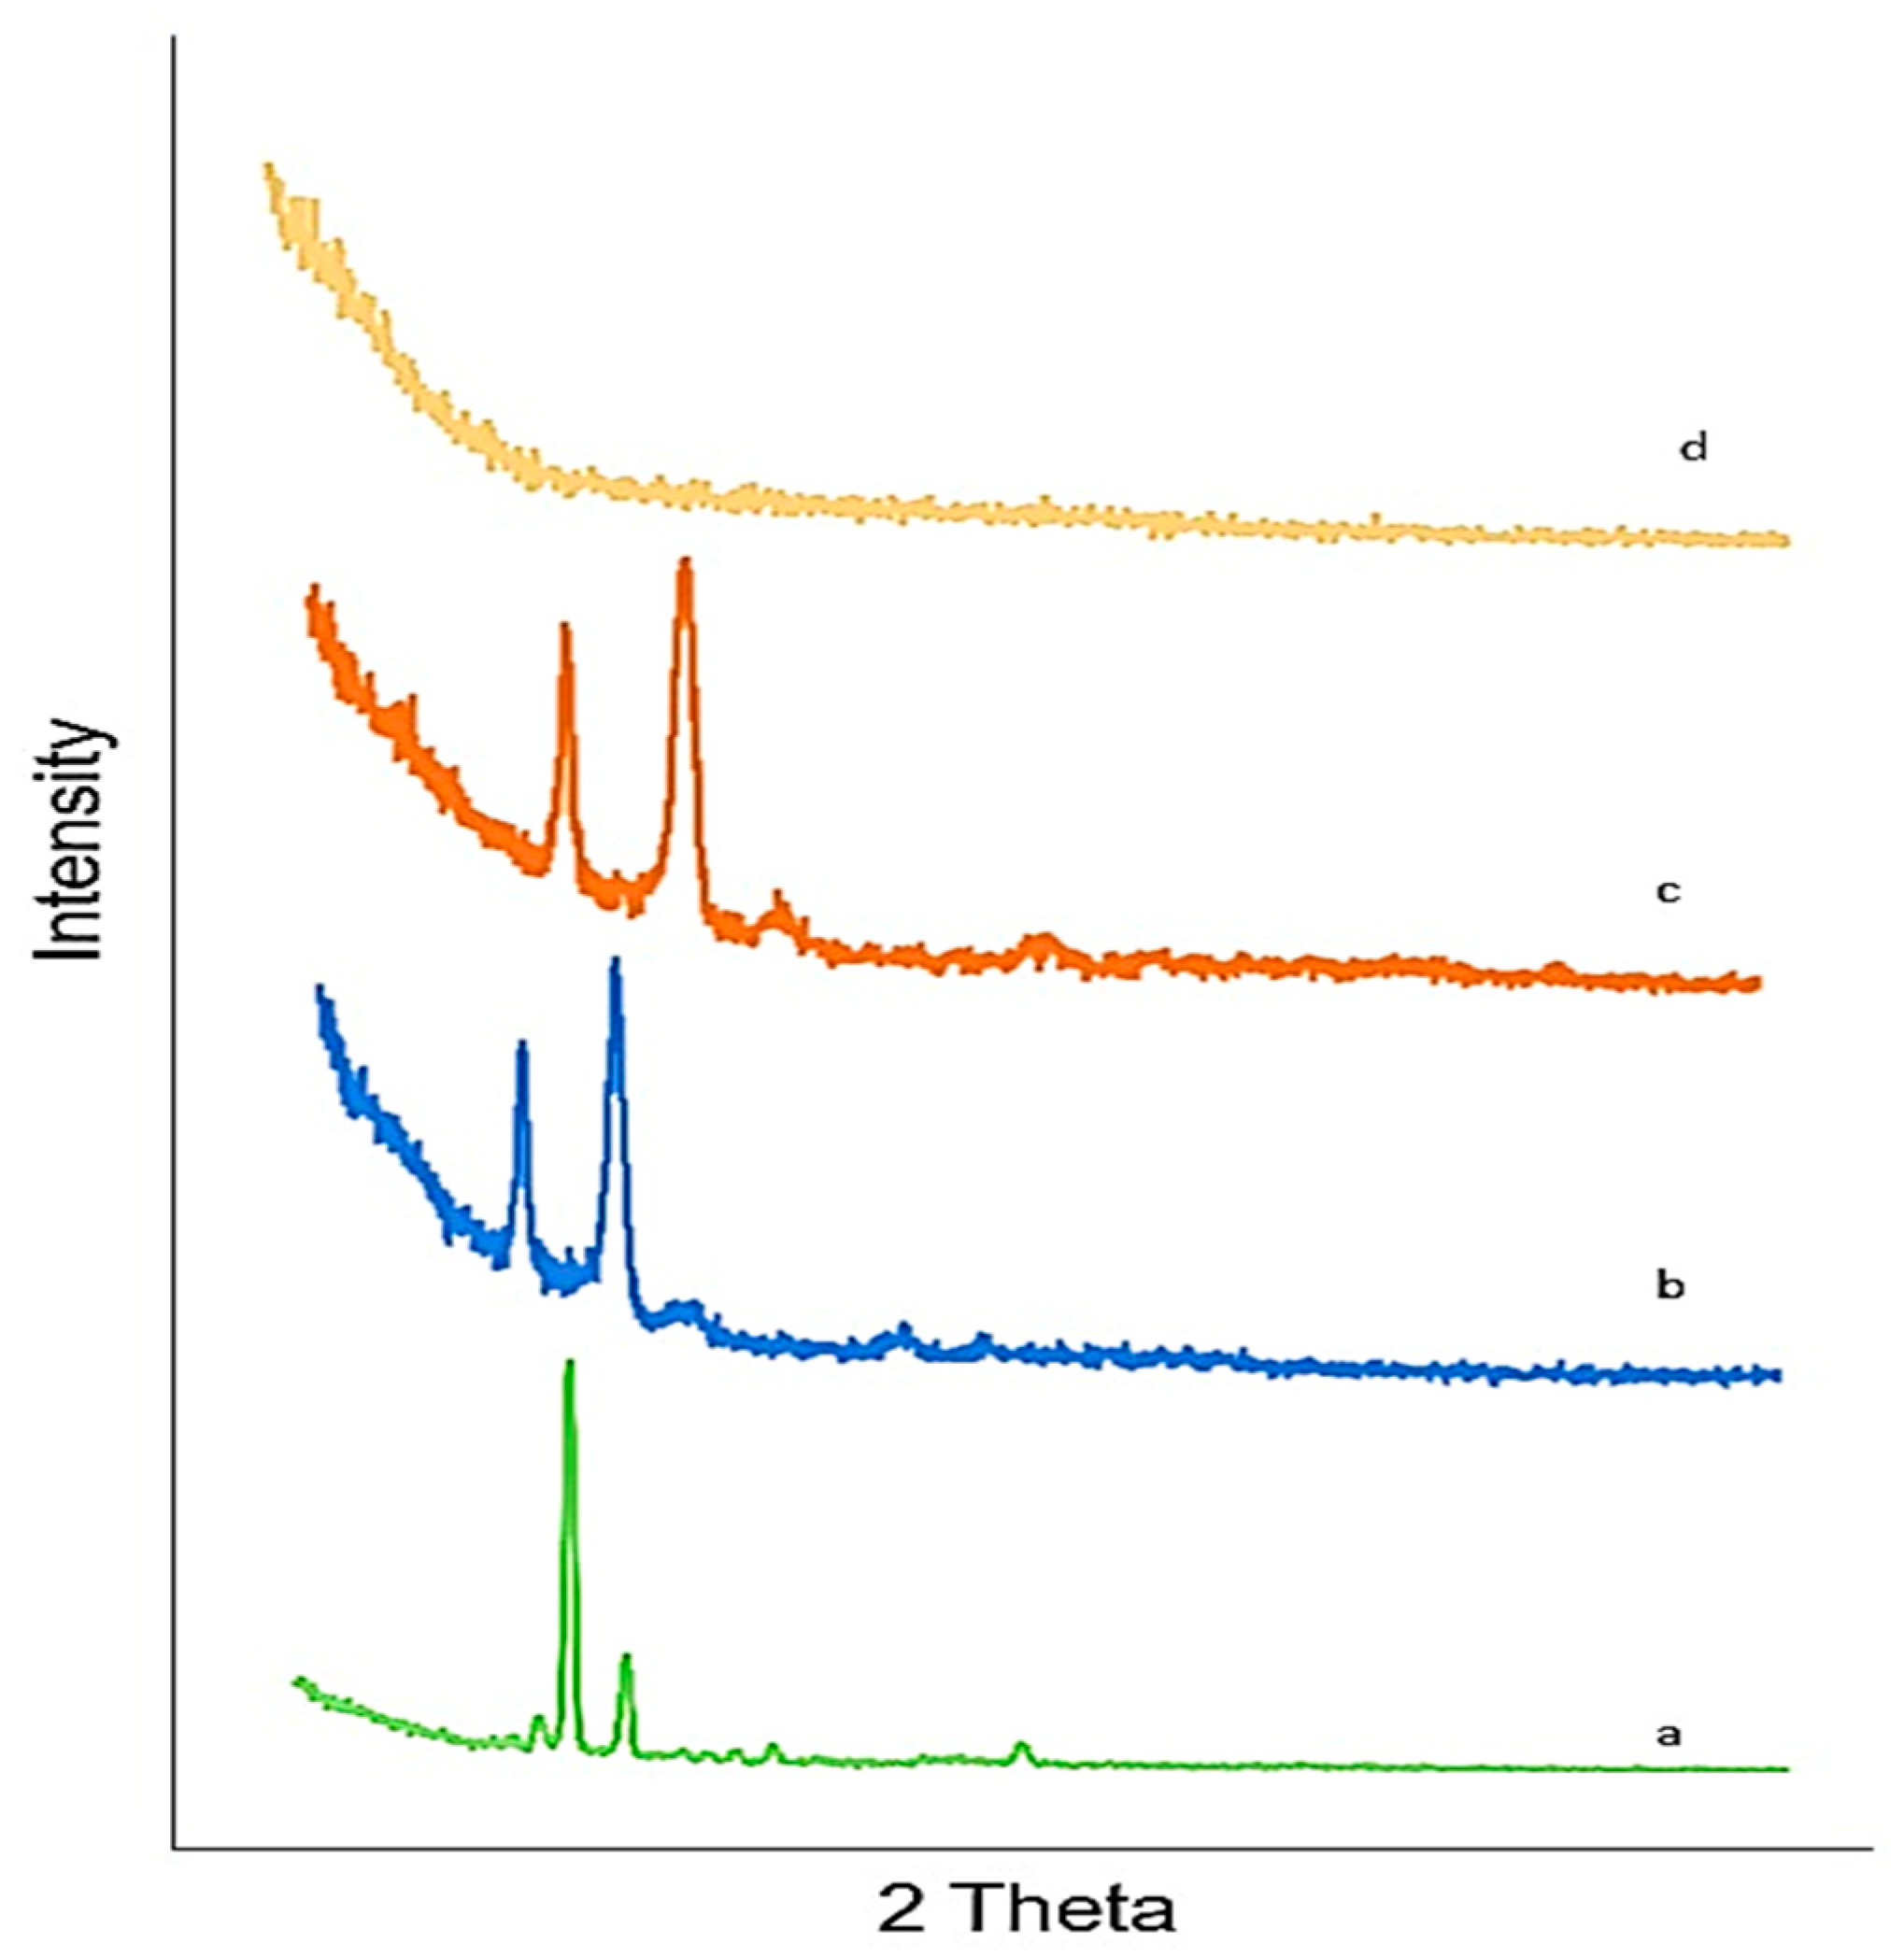
2.11. X-ray Diffraction (XRD)
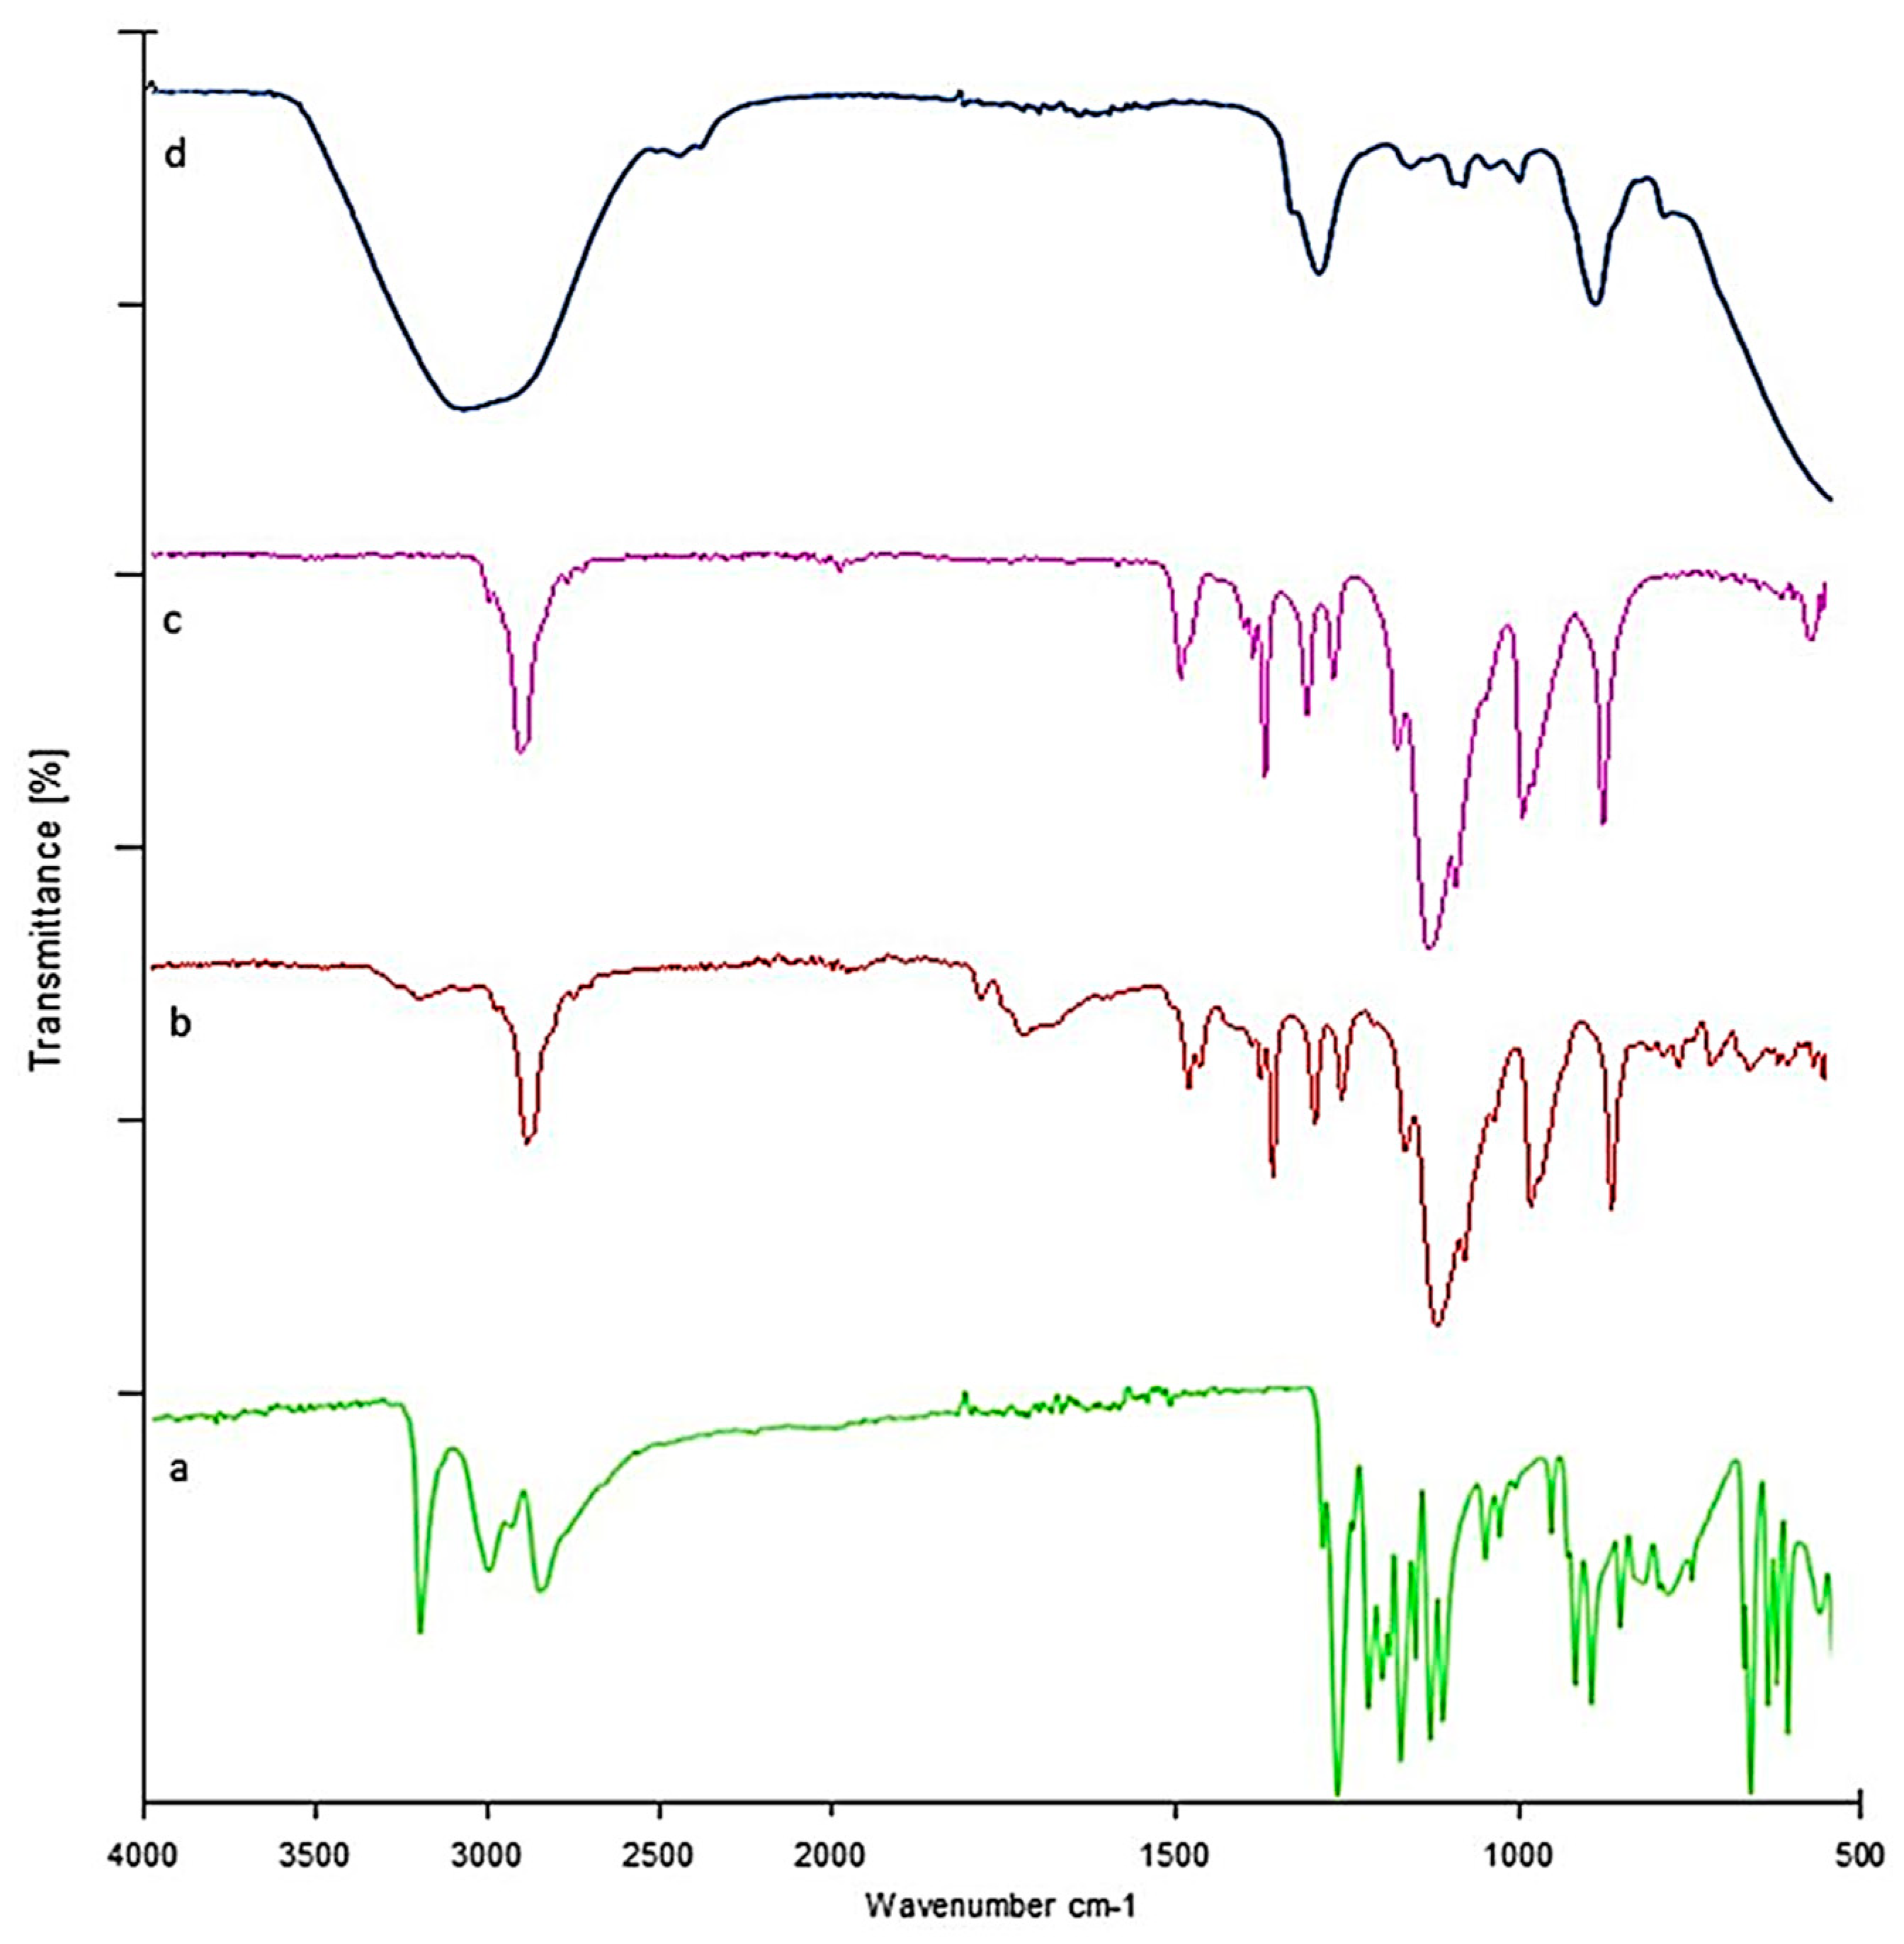
2.12. Fourier Transform Infrared Spectrophotometer (FTIR)
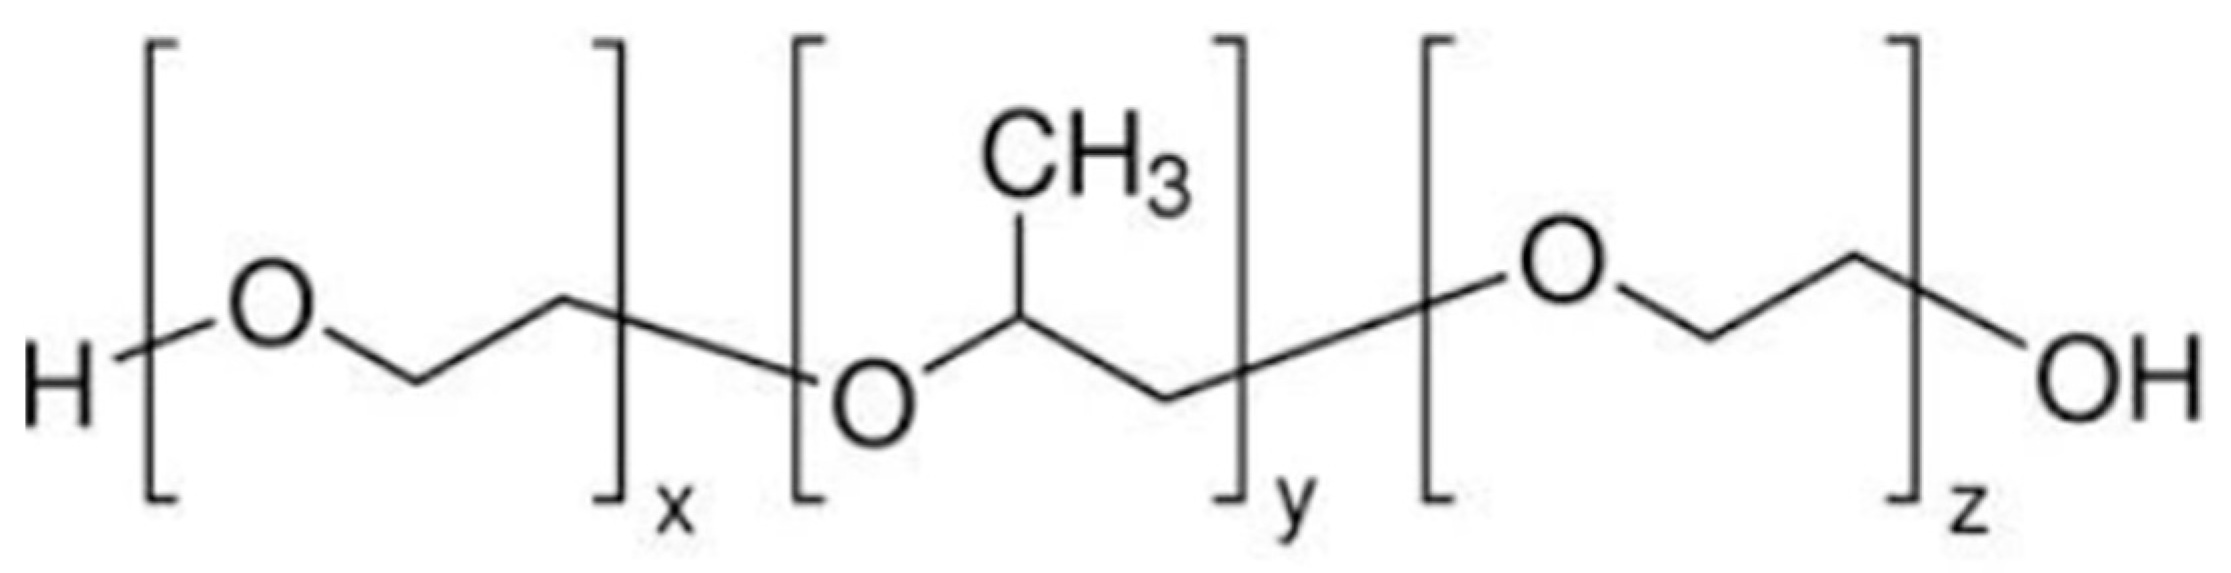
Lamotrigine Sol–Gel and Polymers
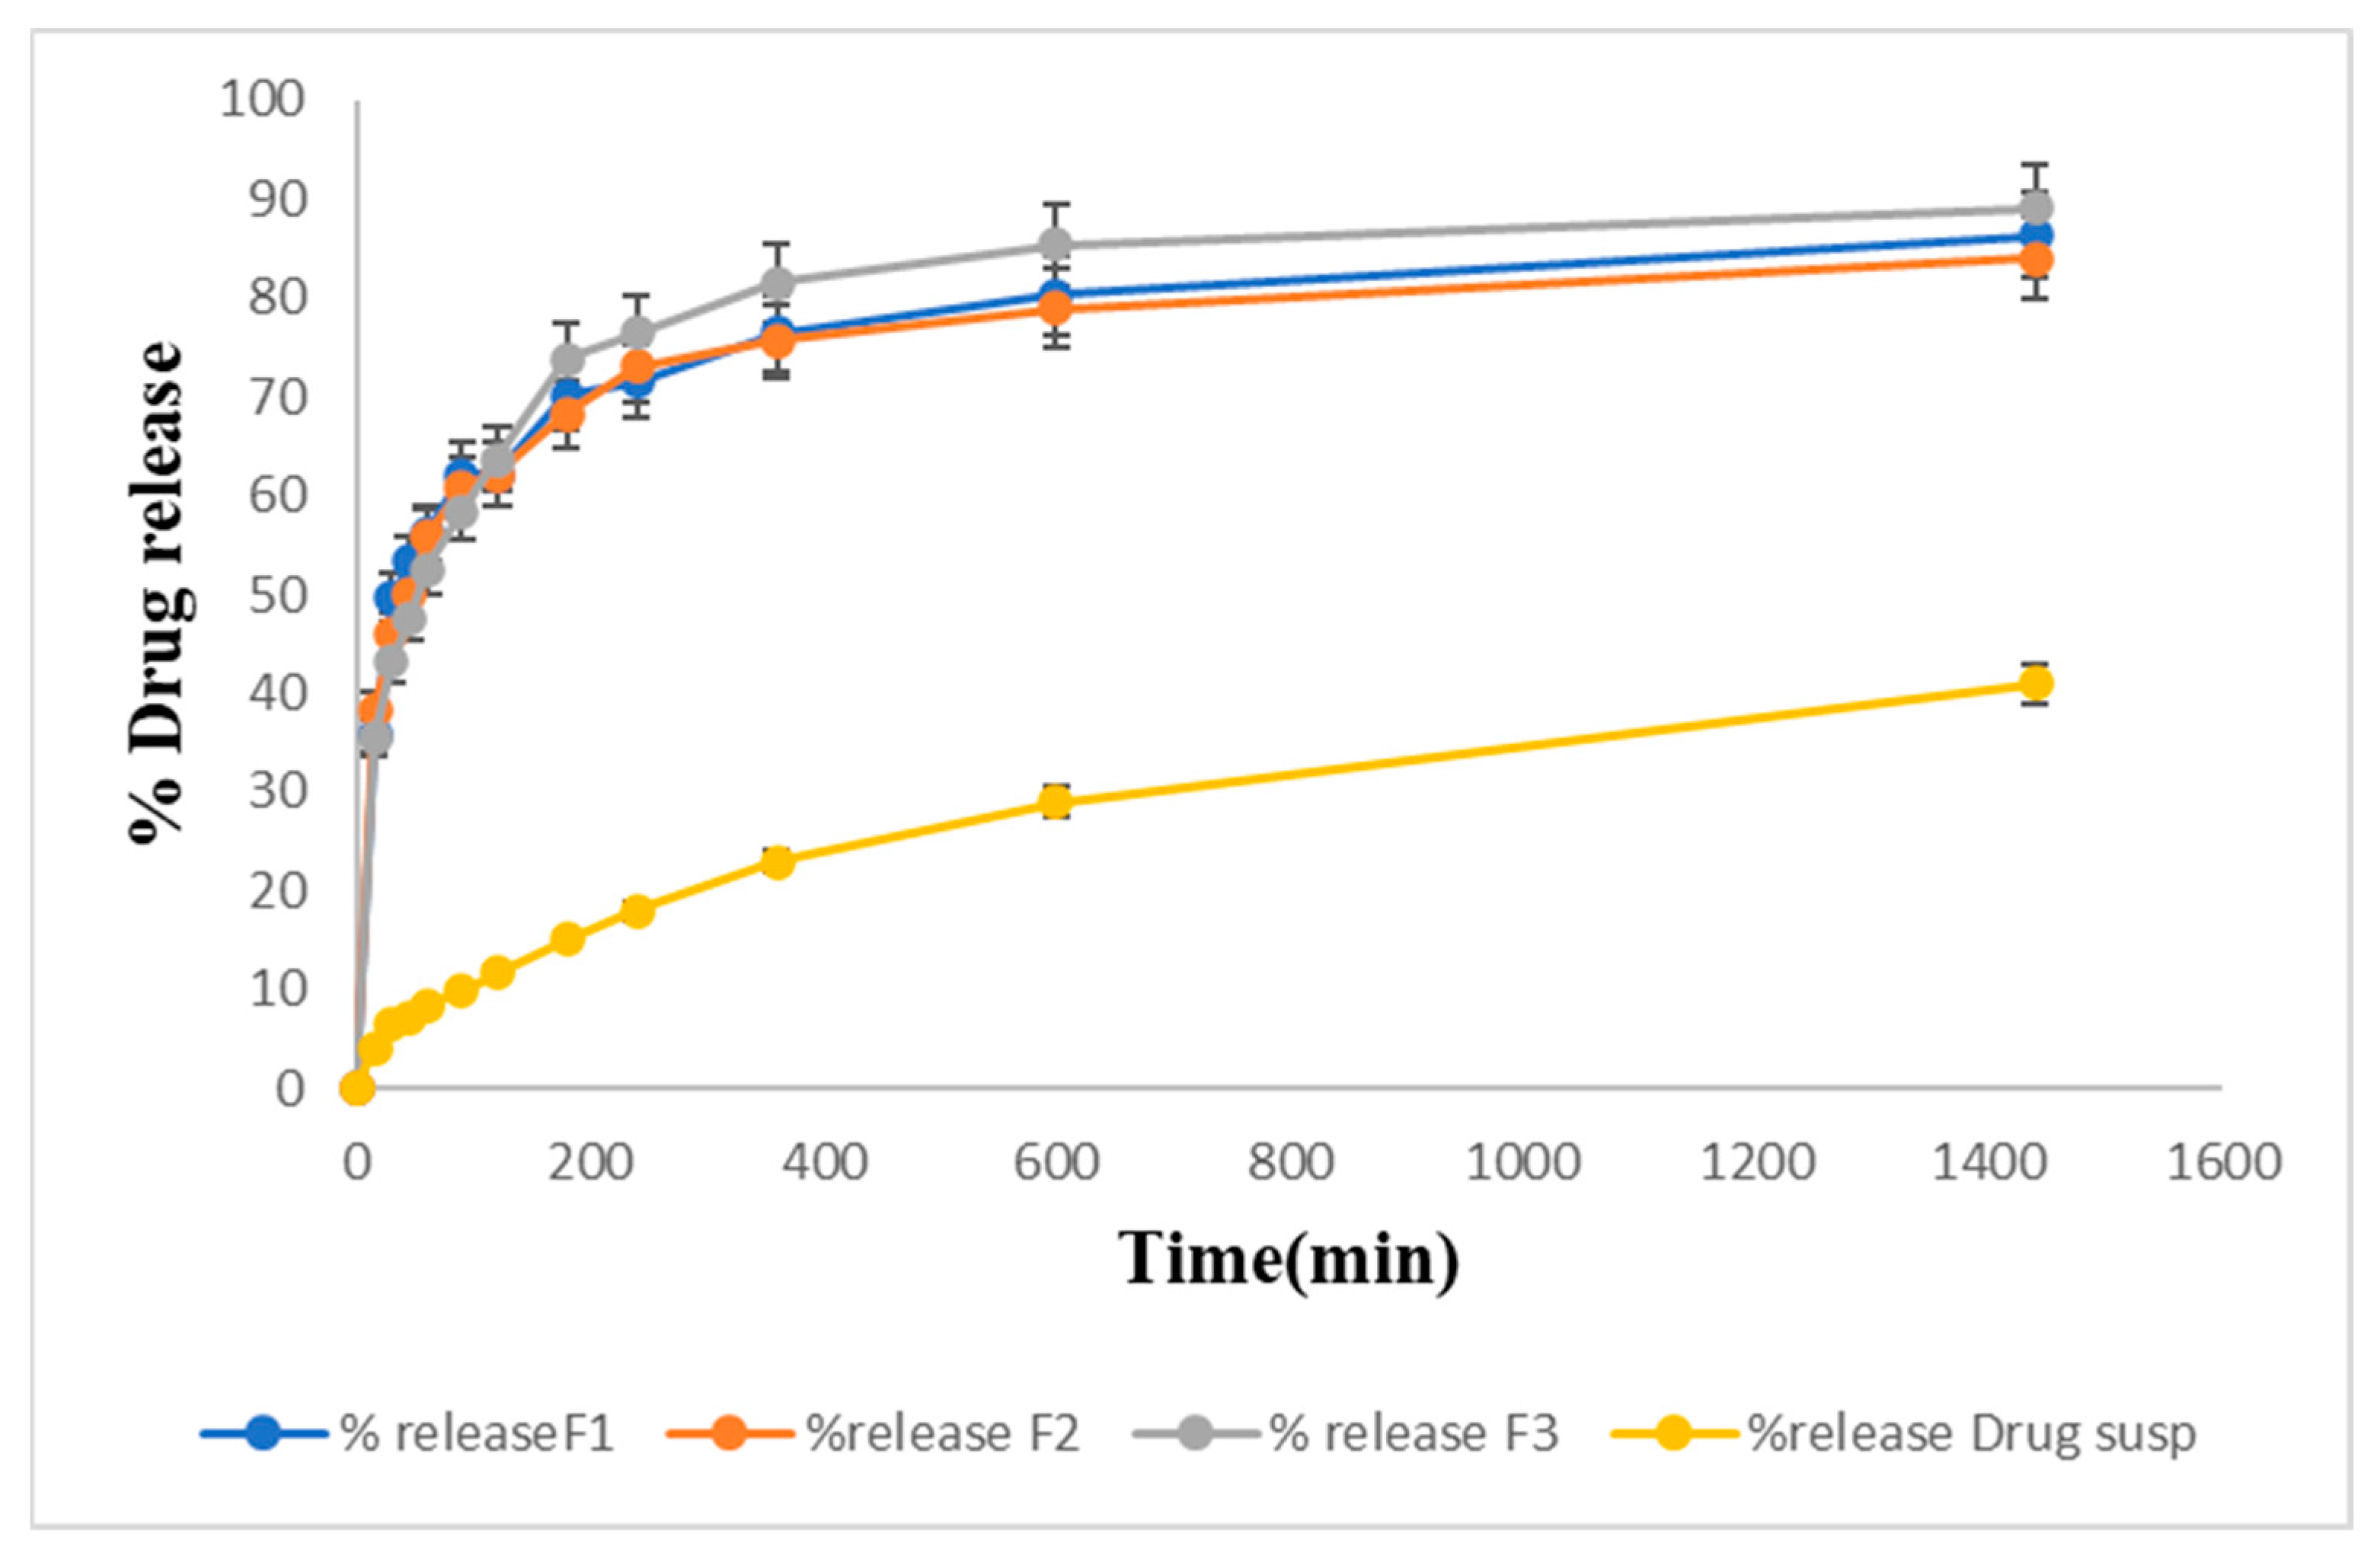
2.13. Drug Release Studies In Vitro
Drug Release Kinetic Study
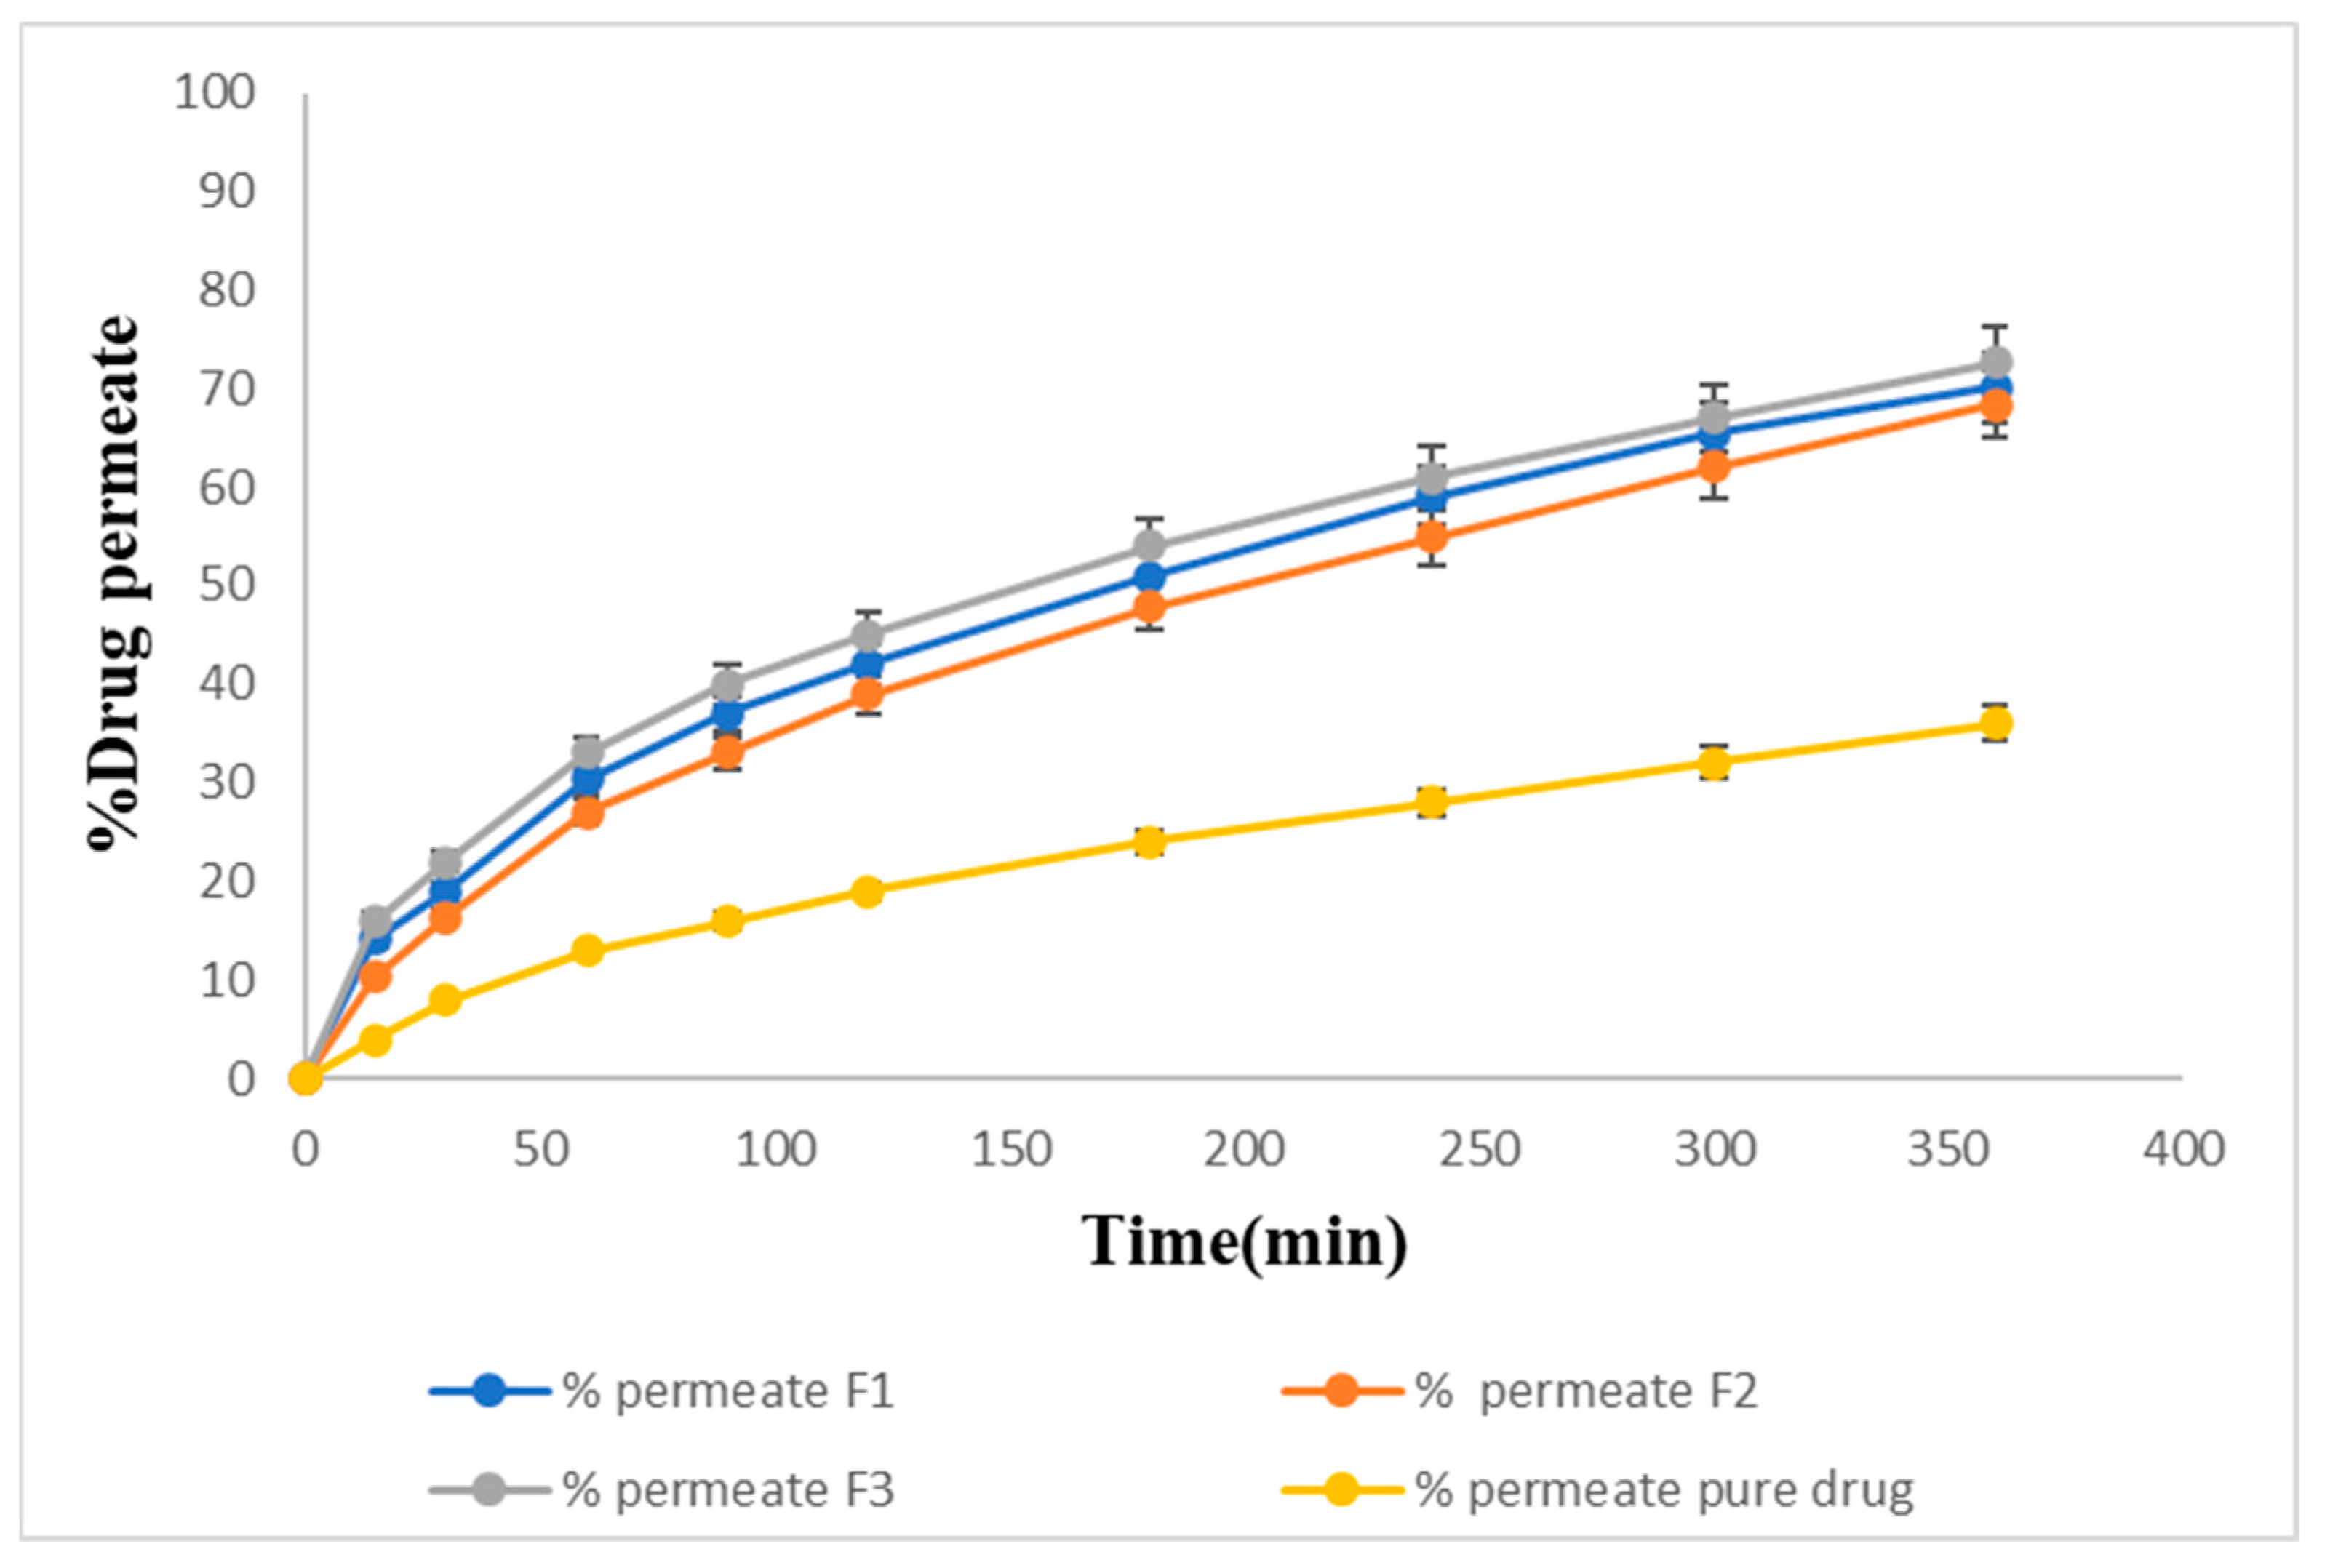
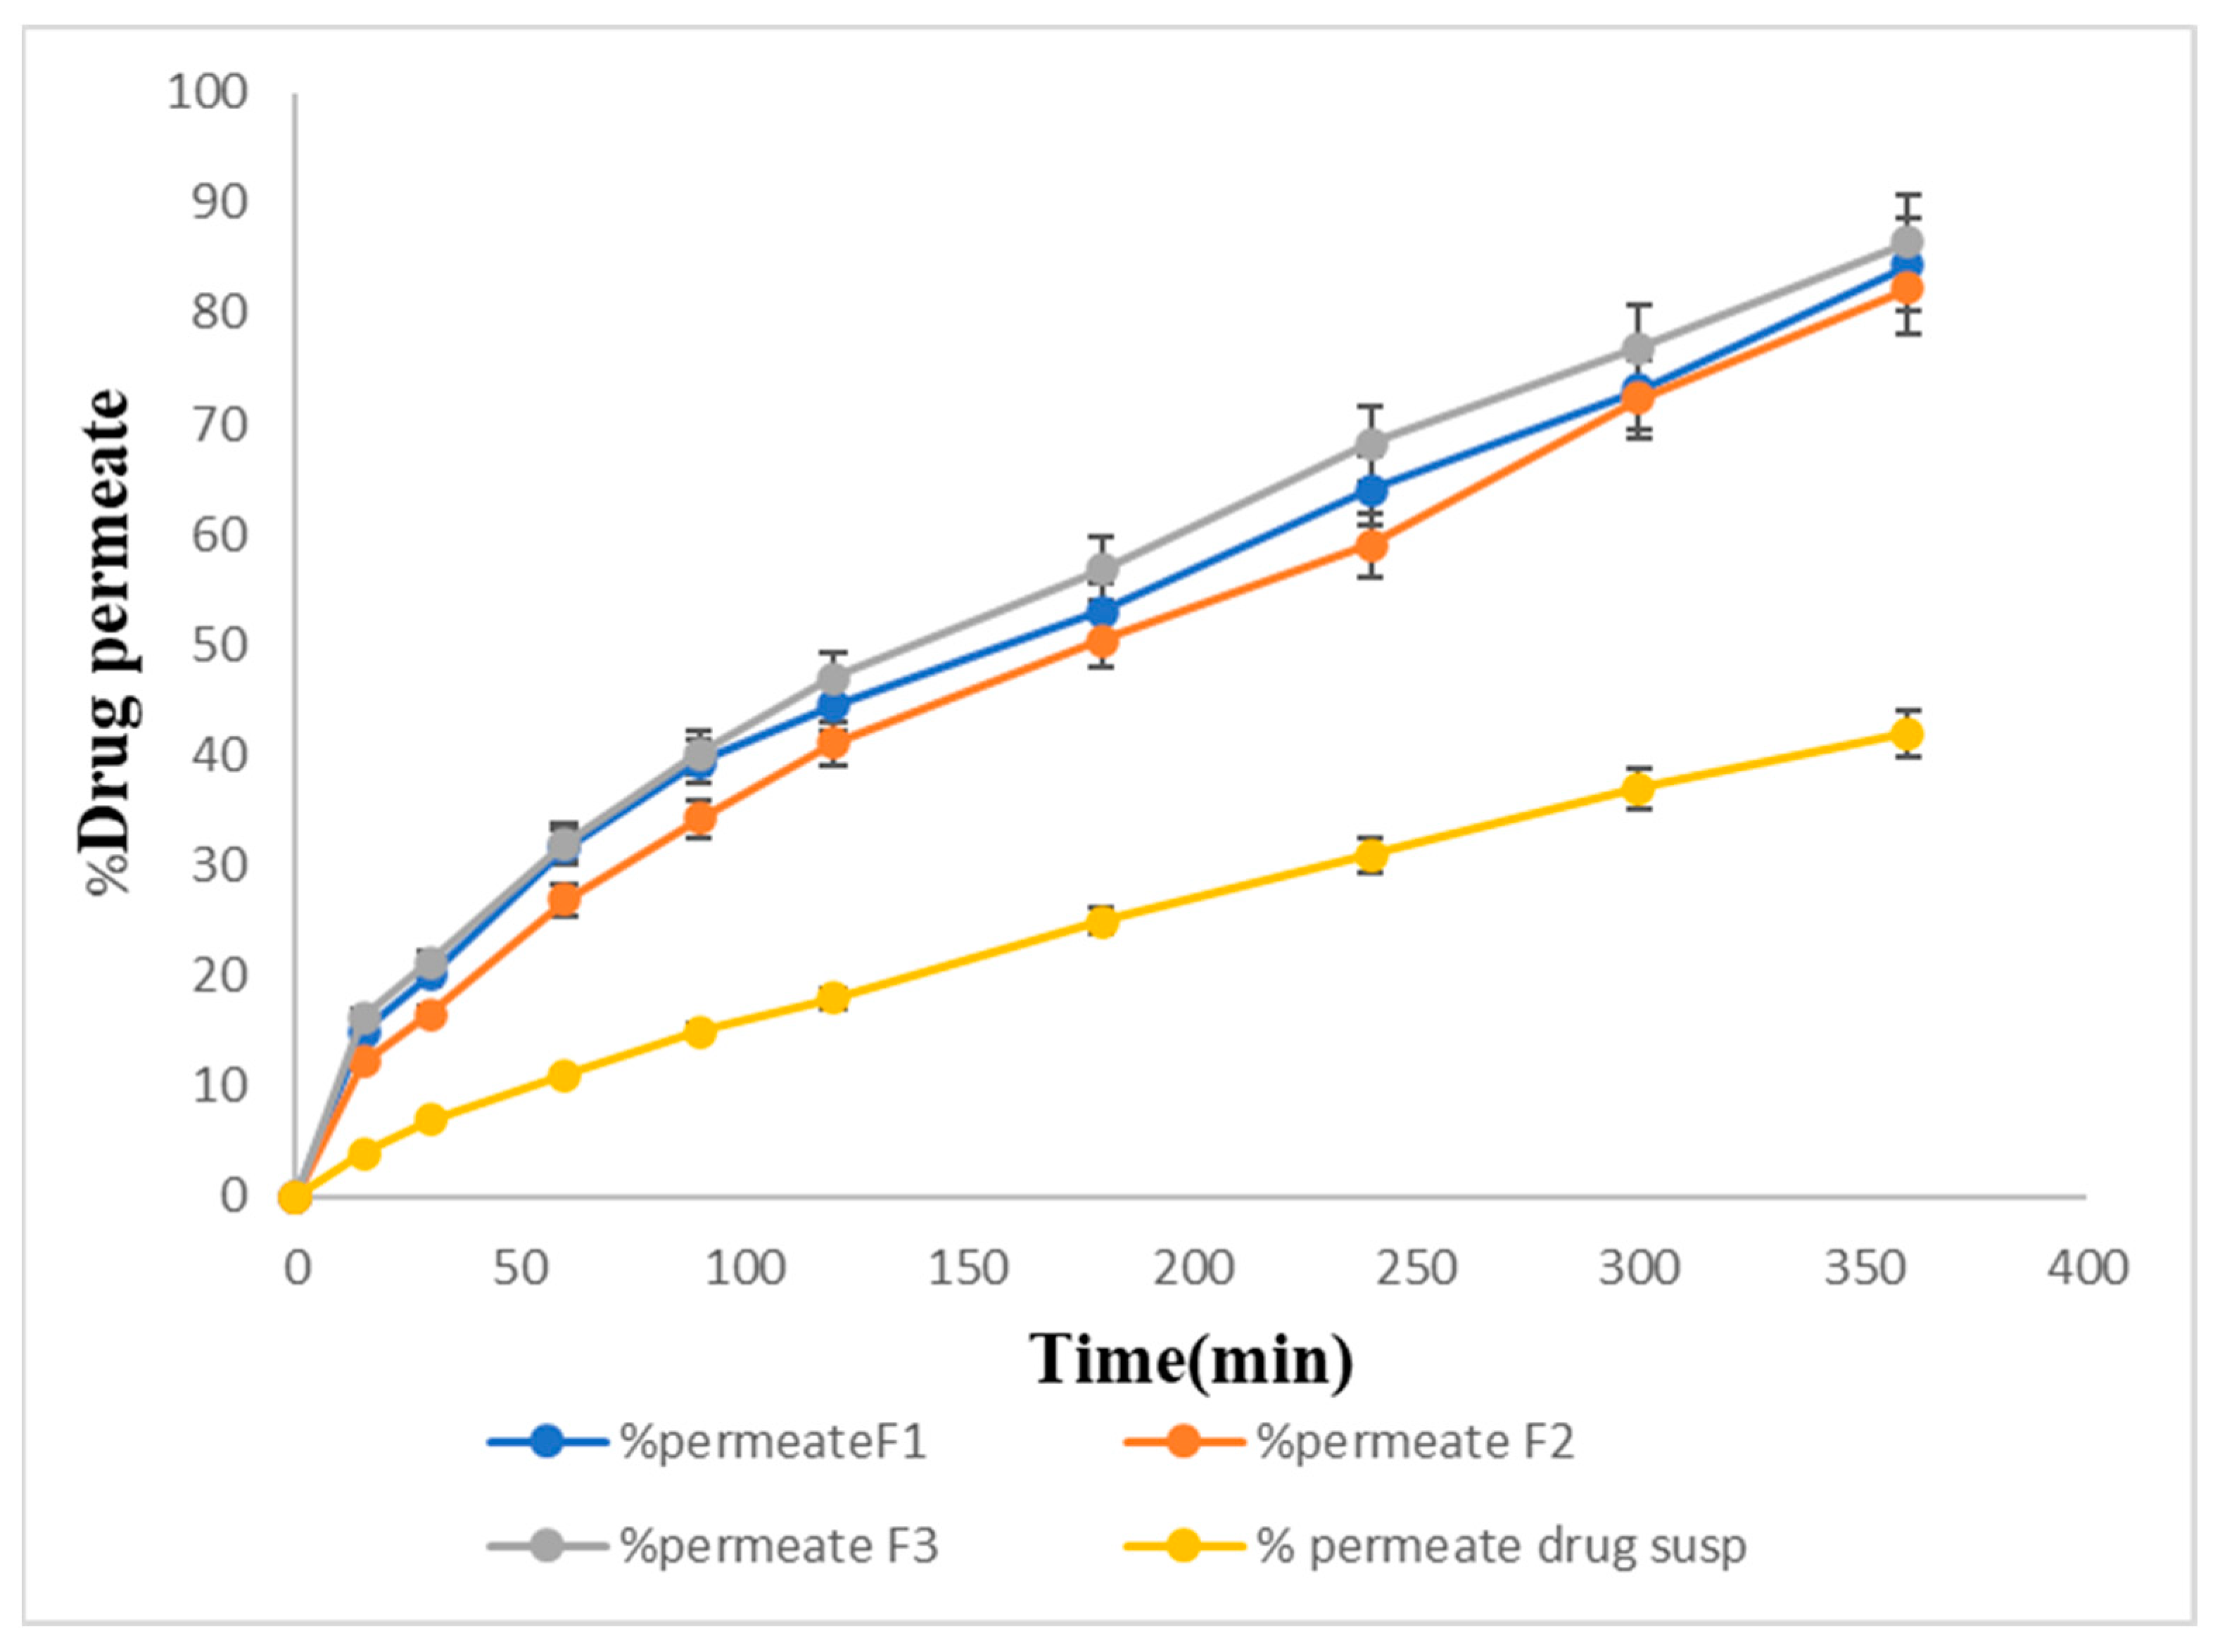
2.14. In Vitro Permeation Studies
2.15. Ex Vivo Permeation of Sol–Gel
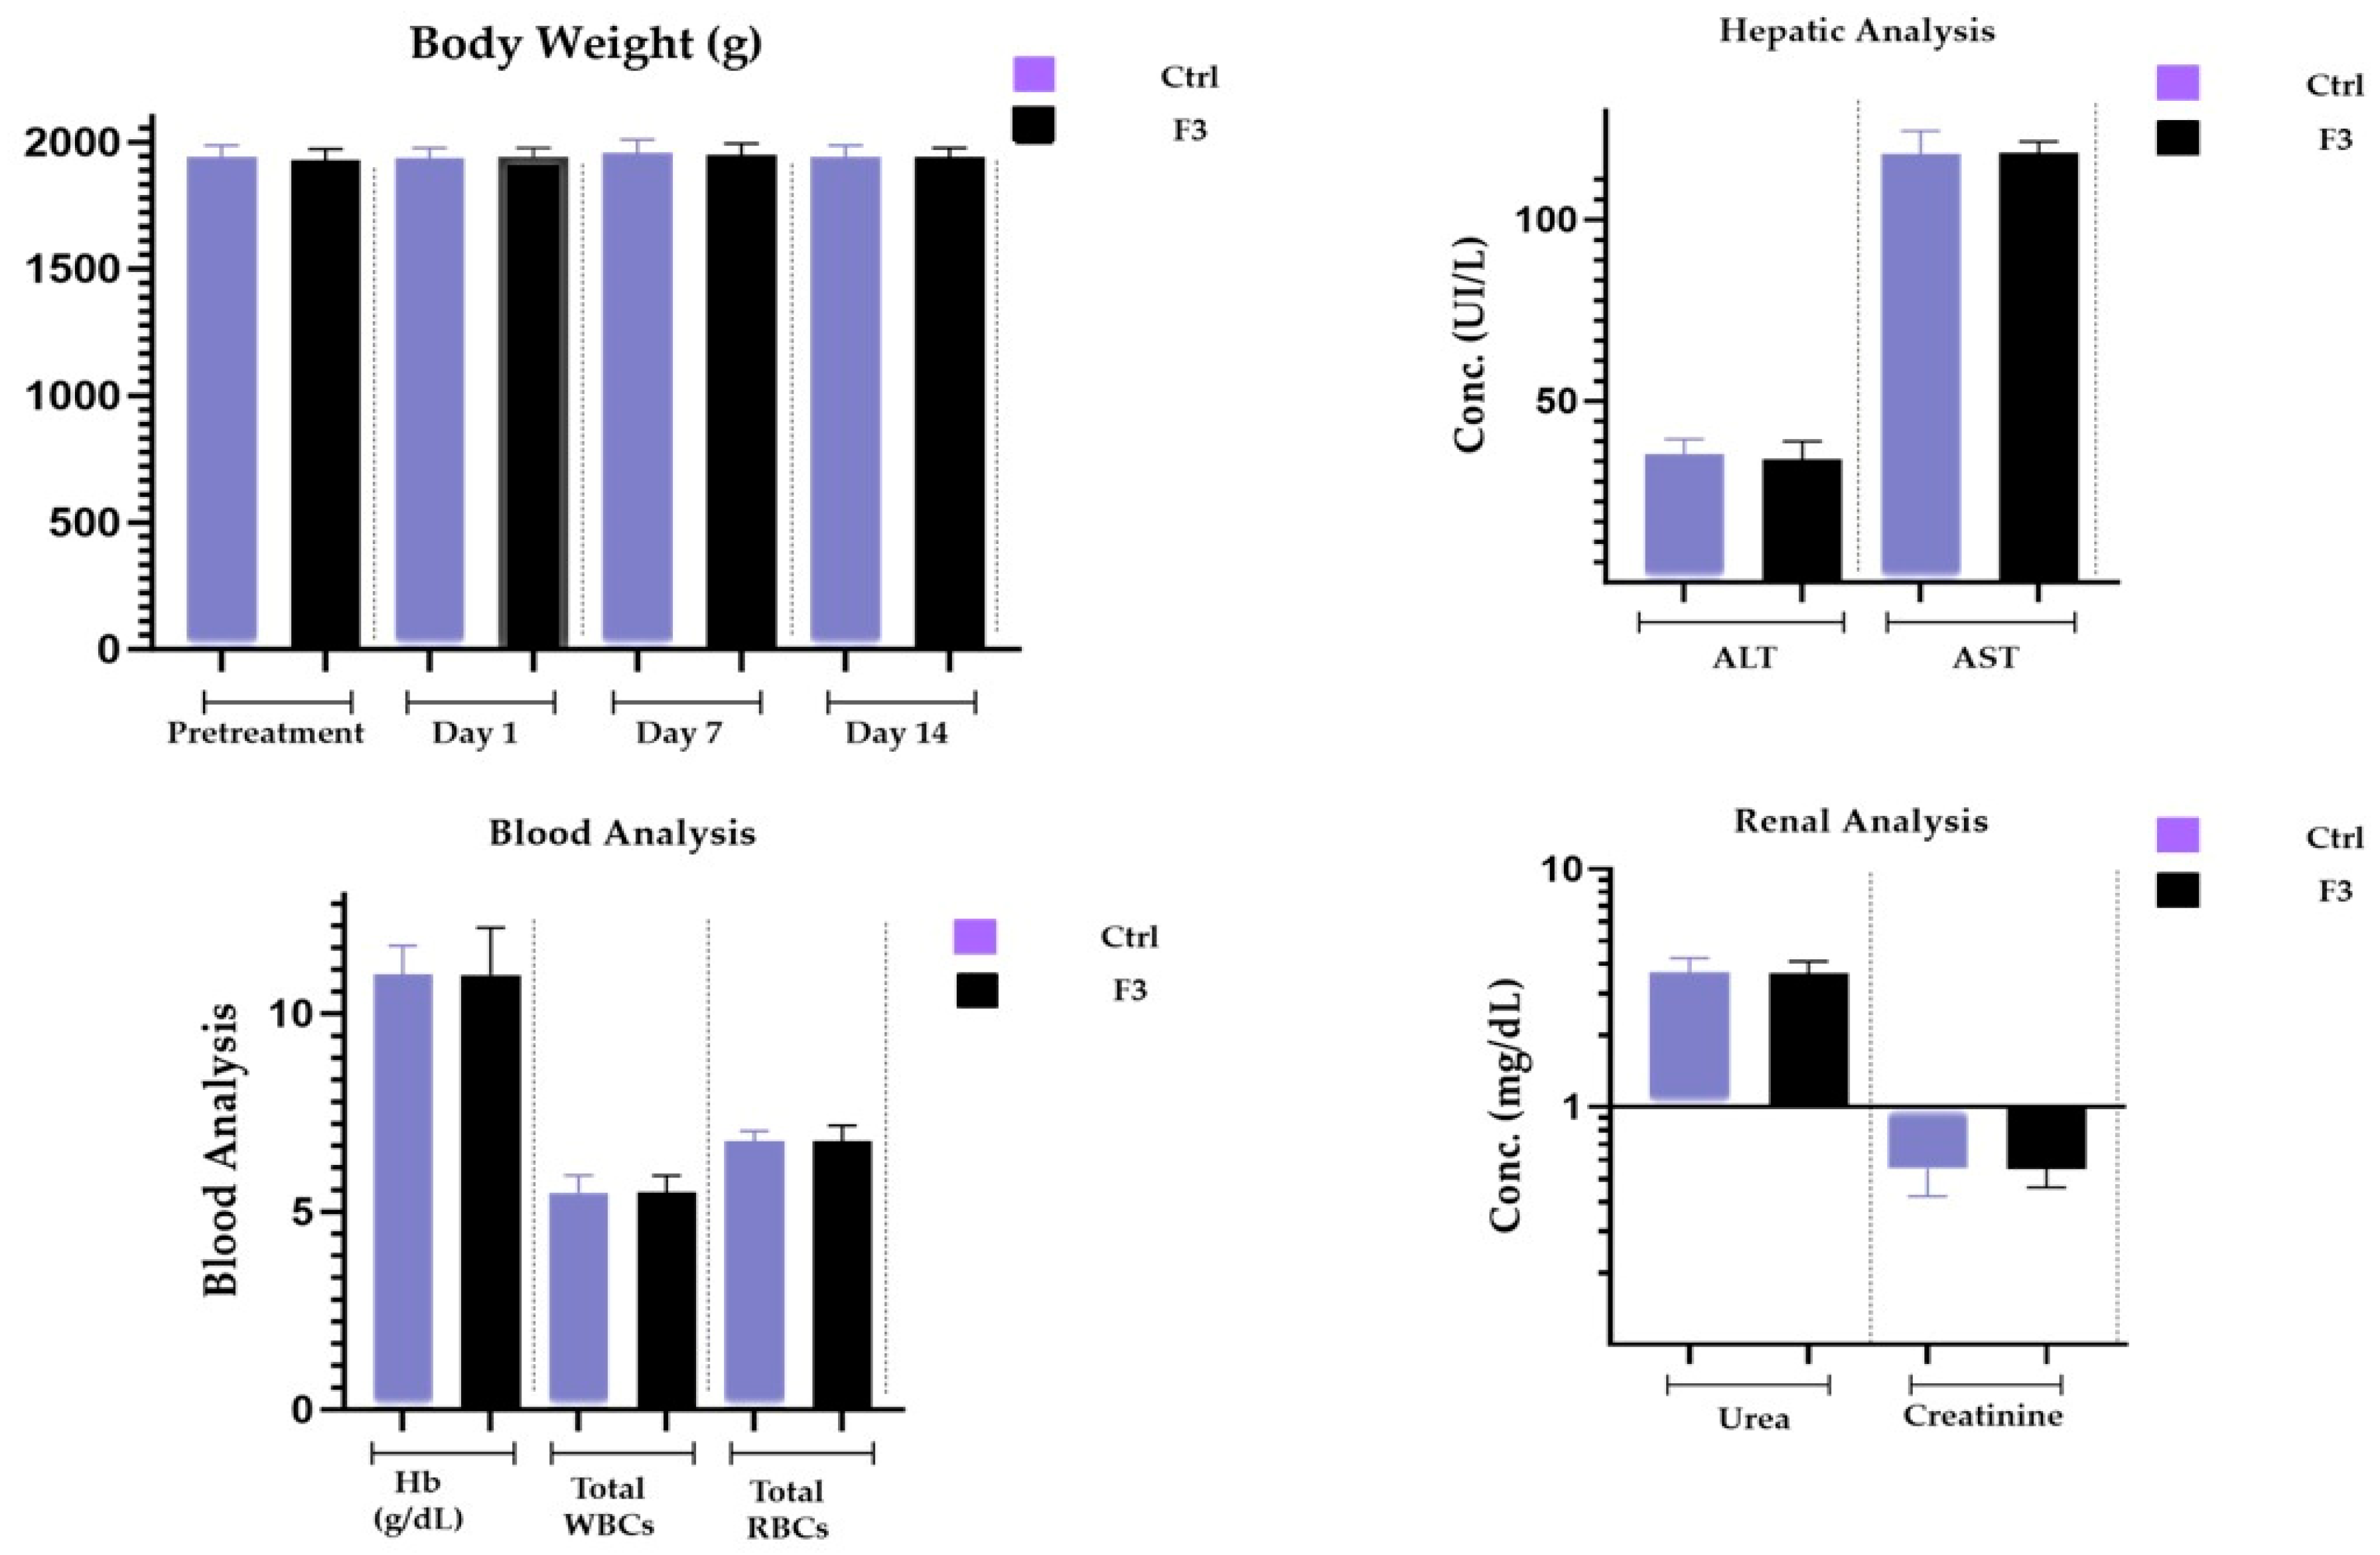
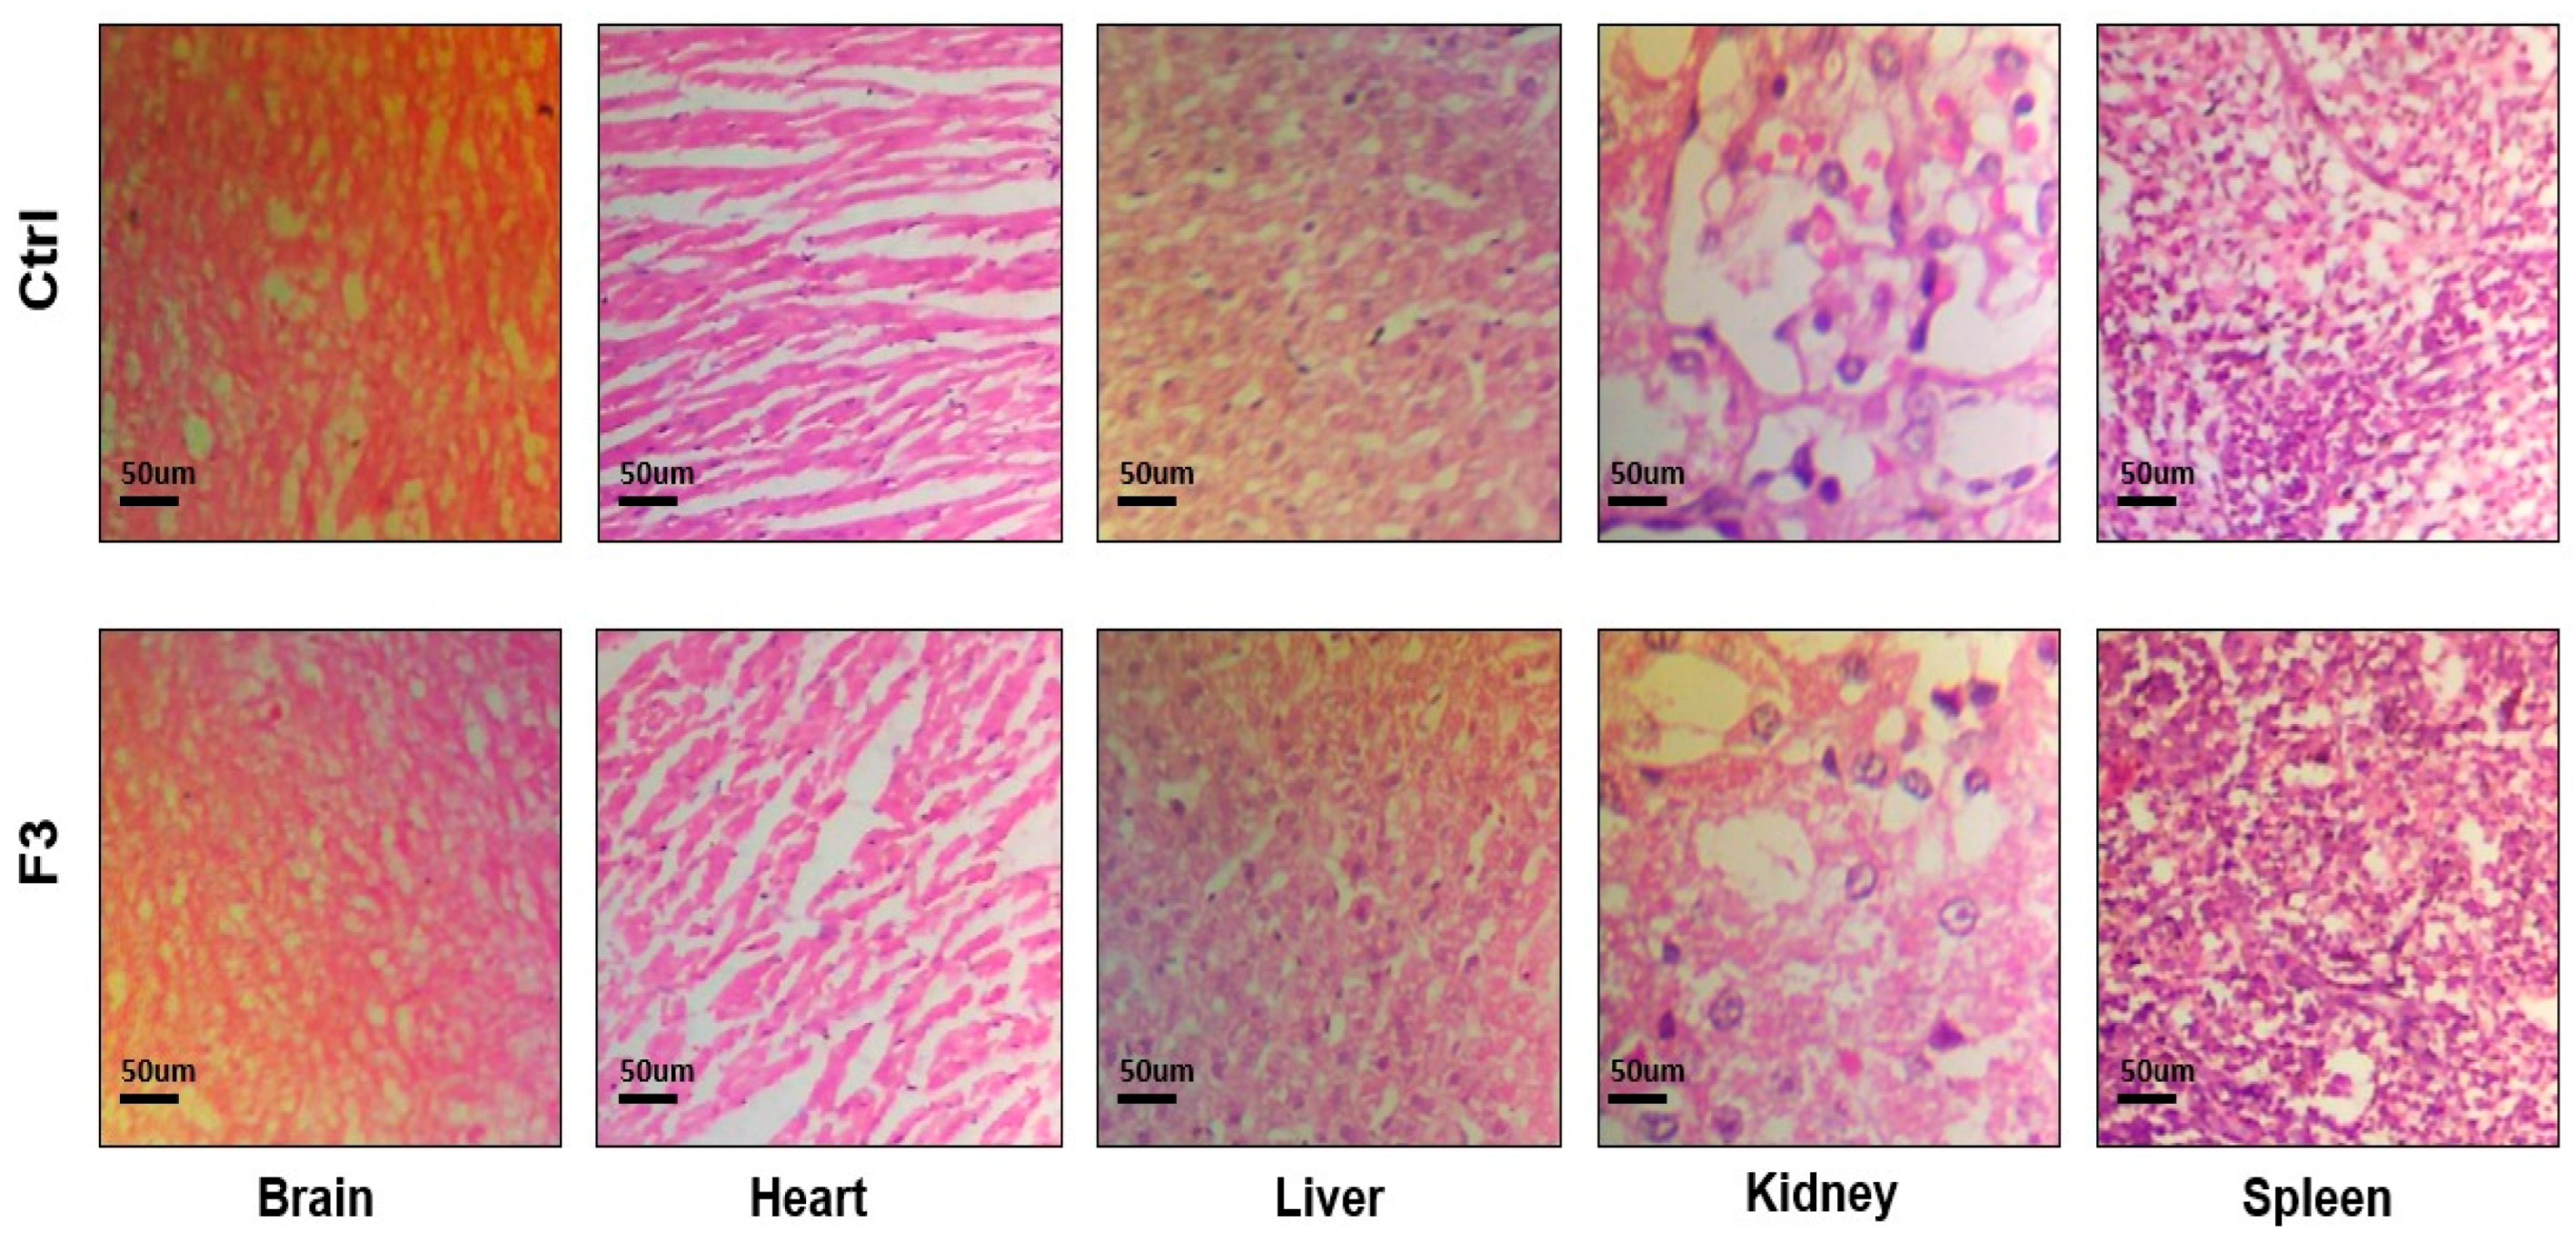
2.16. Acute Toxicological Study
3. Discussion
4. Conclusions
5. Materials and Methods
5.1. Materials
5.2. Method to Prepare Thermo-Responsive Sol–Gel of Lamotrigine
5.3. Characterization and Evaluation
5.3.1. Formulation Optimization
5.3.2. Clarity
5.3.3. pH
5.3.4. Viscosity Measurement
5.3.5. Sol–Gel Gelling Temperature and Time Measurement
5.3.6. Gel Strength
5.3.7. Drug Content
5.3.8. Spreadability
5.3.9. Stability Studies
5.3.10. Differential Scanning Calorimeter
5.3.11. X-ray Diffraction (XRD) Analysis
5.3.12. Zeta Potential
5.3.13. FTIR (Fourier Transform Infrared Spectrophotometer)
5.3.14. Lamotrigine Calibration Curve
Preparation of a Standard Stock Solution
Formation of a Calibration Curve
5.3.15. In Vitro Drug Release of Lamotrigine Sol–Gel
5.3.16. Drug Release Kinetic Study
5.3.17. In Vitro Permeation of Sol–Gel
5.3.18. Ex Vivo Permeation of Sol–Gel
5.3.19. Acute Toxicology Study
Author Contributions
Funding
Institutional Review Board Statement
Informed Consent Statement
Data Availability Statement
Acknowledgments
Conflicts of Interest
References
- Makwana, S.B.; Patel, V.A.; Parmar, S.J. Development and characterization of in-situ gel for ophthalmic formulation containing ciprofloxacin hydrochloride. Results in Pharma Sci. 2015, 8, 1–6. [Google Scholar] [CrossRef] [PubMed]
- Chien, Y.W.; Su, K.S.; Chang, S.F. Nasal systemic drug delivery. Drugs Pharm. Sci. 1989, 39, 297–310. [Google Scholar]
- Qiu, Y.; Park, K. Environment-sensitive hydrogels for drug delivery. Adv. Drug Deliv. Rev. 2001, 53, 321–339. [Google Scholar] [CrossRef] [PubMed]
- Nirmal, H.B.; Bakliwal, S.; Pawar, S. In-situ gel: New trends in controlled and sustained drug delivery system. Int. J. PharmTech Res. 2010, 2, 1398–1408. [Google Scholar]
- Mottu, F.; Gailloud, P.; Massuelle, D.; Rüfenacht, D.A.; Doelker, E. In vitro assessment of new embolic liquids prepared from preformed polymers and water-miscible solvents for aneurysm treatment. Biomaterials 2000, 21, 803–811. [Google Scholar] [CrossRef] [PubMed]
- Lin, H.R.; Sung, K.C. Carbopol/pluronic phase change solutions for ophthalmic drug delivery. J. Control. Release 2000, 69, 379–388. [Google Scholar] [CrossRef] [PubMed]
- Huffman, A.S.; Afrassiabi, A.; Dong, L.C. Thermally reversible hydrogels: II. Delivery and selective removal of substances from aqueous solutions. J. Control. Release 1986, 4, 213–222. [Google Scholar] [CrossRef]
- Mohanty, D.; Bakshi, V.; Simharaju, N.; Haque, M.A.; Sahoo, C.K. A review on in situ gel: A novel drug delivery system. Int. J. Pharm. Sci. Rev. Res. 2018, 50, 175–181. [Google Scholar]
- Vibha, B. In-situ gel nasal drug delivery system-a review. Int. J. Pharma Sci. 2014, 4, 577–580. [Google Scholar]
- O’Lenick, T.G.; Jiang, X.; Zhao, B. Thermosensitive aqueous gels with tunable sol-gel transition temperatures from thermo-and pH-responsive hydrophilic ABA triblock copolymer. Langmuir 2010, 26, 8787–8796. [Google Scholar] [CrossRef]
- Fakhari, A.; Corcoran, M.; Schwarz, A. Thermogelling properties of purified poloxamer 407. Heliyon 2017, 3, e00390. [Google Scholar] [CrossRef] [PubMed]
- Bohorquez, M.; Koch, C.; Trygstad, T.; Pandit, N. A Study of the Temperature-Dependent Micellization of Pluronic F127. J. Colloid Interface Sci. 1999, 216, 34–40. [Google Scholar] [CrossRef] [PubMed]
- Alshweiat, A.; Ambrus, R.; Csóka, I. Intranasal nanoparticulate systems as an alternative route of drug delivery. Curr. Med. Chem. 2019, 26, 6459–6492. [Google Scholar] [CrossRef] [PubMed]
- Behl, C.; Pimplaskar, H.; Sileno, A.; Demeireles, J.; Romeo, V. Effects of physicochemical properties and other factors on systemic nasal drug delivery. Adv. Drug Deliv. Rev. 1998, 29, 89–116. [Google Scholar] [CrossRef] [PubMed]
- Dumortier, G.; Grossiord, J.L.; Agnely, F.; Chaumeil, J.C. A review of poloxamer 407 pharmaceutical and pharmacological characteristics. Pharm. Res. 2006, 23, 2709–2728. [Google Scholar] [CrossRef] [PubMed]
- Abbott, N.J.; Patabendige, A.A.K.; Dolman, D.E.M.; Yusof, S.R.; Begley, D.J. Structure and function of the blood-brain barrier. Neurobiol. Dis. 2010, 37, 13–25. [Google Scholar] [CrossRef] [PubMed]
- Verma, P.; Thakur, A.S.; Deshmukh, K.; Jha, A.K.; Verma, S. Routes of drug administration. Int. J. Pharm. Stud. Res. 2010, 1, 54–59. [Google Scholar]
- Aderibigbe, B.A. In situ-based gels for nose-to-brain delivery for the treatment of neurological diseases. Pharmaceutics 2018, 10, 40. [Google Scholar] [CrossRef]
- Agrawal, M.; Saraf, S.; Saraf, S.; Dubey, S.K.; Puri, A.; Gupta, U.; Kesharwani, P.; Ravichandiran, V.; Kumar, P.; Naidu, V.; et al. Stimuli-responsive In situ gelling system for nose-to-brain drug delivery. J. Control. Release 2020, 327, 235–265. [Google Scholar] [CrossRef]
- Van Woensel, M.; Wauthoz, N.; Rosière, R.; Amighi, K.; Mathieu, V.; Lefranc, F.; Van Gool, S.W.; De Vleeschouwer, S. Formulations for intranasal delivery of pharmacological agents to combat brain disease: A new opportunity to tackle GBM? Cancers 2013, 5, 1020–1048. [Google Scholar] [CrossRef]
- Giunchedi, P.; Gavini, E.; Bonferoni, M.C. Nose-to-brain delivery. Pharmaceutics 2020, 12, 138. [Google Scholar] [CrossRef] [PubMed]
- Shinde, V.R.; Shelake, M.R.; Shetty, S.S.; Chavan-Patil, A.B.; Pore, Y.V.; Late, S.G. Enhanced solubility and dissolution rate of lamotrigine by inclusion complexation and solid dispersion technique. J. Pharm. Pharmacol. 2008, 60, 1121–1129. [Google Scholar] [CrossRef] [PubMed]
- Shahid, N.; Erum, A.; Zaman, M.; Tulain, U.R.; Shoaib, Q.-U.; Malik, N.S.; Kausar, R.; Rashid, A.; Rehman, U. Synthesis and evaluation of chitosan based controlled release nanoparticles for the delivery of ticagrelor. Des. Monomers Polym. 2022, 25, 55–63. [Google Scholar] [CrossRef] [PubMed]
- Vijay, M.; Parjanya, K. Formulation and evaluation of in-situ gel of bromhexine hydrochloride for nasal delivery. Pharm. Sin. 2012, 3, 699–707. [Google Scholar]
- Dash, S.; Murthy, P.N.; Nath, L.; Chowdhury, P. Kinetic modeling on drug release from controlled drug delivery systems. Acta Pol. Pharm. 2010, 67, 217–223. [Google Scholar] [PubMed]
- Shah, P.; Dubey, P.; Vyas, B.; Kaul, A.; Mishra, A.K.; Chopra, D.; Patel, P. Lamotrigine loaded PLGA nanoparticles intended for the direct nose to brain delivery in epilepsy: Pharmacokinetic, pharmacodynamic and scintigraphy study. Artif. Cells Nanomed. Biotechnol. 2021, 49, 511–522. [Google Scholar] [CrossRef] [PubMed]
- Qian, Y.; Wang, F.; Li, R.; Zhang, Q.; Xu, Q. Preparation and evaluation of in situ gelling ophthalmic drug delivery system for methazolamide. Drug Dev. Ind. Pharm. 2010, 36, 1340–1347. [Google Scholar] [CrossRef]
- Qian, S.; Wong, Y.C.; Zuo, Z. Development, characterization and application of in situ gel systems for intranasal delivery of tacrine. Int. J. Pharm. 2014, 468, 272–282. [Google Scholar] [CrossRef]
- Gadad, A.P.; Wadklar, P.D.; Dandghi, P.; Patil, A. Thermosensitive in situ gel for ocular delivery of lomefloxacin. Indian, J. Pharm. Educ. Res. 2016, 50, S96–S105. [Google Scholar]
- Lou, J.; Hu, W.; Tian, R.; Zhang, H.; Jia, Y.; Zhang, J.; Zhang, L. Optimization and evaluation of a thermoresponsive ophthalmic in situ gel containing curcumin-loaded albumin nanoparticles. Int. J. Nanomed. 2014, 9, 2517–2525. [Google Scholar]
- Siddique, W.; Zaman, M.; Sarfraz, R.M.; Butt, M.H.; Rehman, A.U.; Fassih, N.; Albadrani, G.M.; Bayram, R.; Alfaifi, M.Y.; Abdel-Daim, M.M. The Development of Eletriptan Hydrobromide Immediate Release Buccal Films Using Central Composite Rotatable Design: An In Vivo and In Vitro Approach. Polymers 2022, 14, 3981. [Google Scholar] [CrossRef] [PubMed]
- Schmolka, I.R. Artificial skin I. Preparation and properties of pluronic F-127 gels for treatment of burns. J. Biomed. Mater. Res. 1972, 6, 571–582. [Google Scholar] [CrossRef] [PubMed]
- Charlton, S.; Jones, N.; Davis, S.; Illum, L. Distribution and clearance of bioadhesive formulations from the olfactory region in man: Effect of polymer type and nasal delivery device. Eur. J. Pharm. Sci. 2007, 30, 295–302. [Google Scholar] [CrossRef] [PubMed]
- Chand, P.; Gnanarajan, G.; Kothiyal, P. In situ gel: A Review. Indian, J. Pharm. Biol. Res. 2016, 4, 11. [Google Scholar] [CrossRef]
- Miller, S.C.; Donovan, M.D. Effect of poloxamer 407 gel on the miotic activity of pilocarpine nitrate in rabbits. Int. J. Pharm. 1982, 12, 147–152. [Google Scholar] [CrossRef]
- VarshosazVarshosaz, J.; Tabbakhian, M.; Salmani, Z. Designing of a thermosensitive chitosan/poloxamer in situ gel for ocular delivery of ciprofloxacin. Open Drug Deliv. J. 2008, 2, 61–70. [Google Scholar] [CrossRef]
- Kempwade, A.; Taranalli, A. Formulation and evaluation of thermoreversible, mucoadhesive in situ intranasal gel of rizatriptan benzoate. J. Sol-Gel Sci. Technol. 2014, 72, 43–48. [Google Scholar] [CrossRef]
- Ramu, B.K.; Bab, M.S. Spectrophotometric Determination of Almotriptan Malate in Tablets Using Ammonium Molybdate and Phosphomolybdic Acid as Reagents. Sumerianz J. Sci. Res. 2019, 2, 12–17. [Google Scholar]
- Kim, C.-K.; Lee, S.-W.; Choi, H.-G.; Lee, M.-K.; Gao, Z.-G.; Kim, I.-S.; Park, K.-M. Trials of in situ-gelling and mucoadhesive acetaminophen liquid suppository in human subjects. Int. J. Pharm. 1998, 174, 201–207. [Google Scholar] [CrossRef]
- Mohan, E.C.; Kandukuri, J.M.; Allenki, V. Preparation and evaluation of in-situ-gels for ocular drug delivery. J. Pharm. Res. 2009, 2, 1089–1094. [Google Scholar]
- Rawlinson, C.J. Differential Scanning Calorimetry. Cook. Chem. 2006, 21, 167–193. [Google Scholar]
- Charsley, E.; Warrington, S. Thermal Analysis: Techniques and Applications; Royal Society of Chemistry: London, UK, 1992. [Google Scholar]
- Gieszinger, P.; Csóka, I.; Pallagi, E.; Katona, G.; Jójárt-Laczkovich, O.; Szabó-Révész, P.; Ambrus, R. Preliminary study of nanosized lamotrigine containing products for nasal powder formulation. Drug Des. Dev. Ther. 2017, 11, 2453–2466. [Google Scholar] [CrossRef] [PubMed]
- Raja, P.B.; Munusamy, K.R.; Perumal, V.; Ibrahim, M.N.M. Characterization of nanomaterial used in nanobioremediation. In Nano-Bioremediation: Fundamentals and Applications; Elsevier: Amsterdam, The Netherlands, 2022; pp. 57–83. [Google Scholar]
- Vorontsov, A.V.; Tsybulya, S.V. Research, Influence of nanoparticles size on XRD patterns for small monodisperse nanoparticles of Cu0 and TiO2 anatase. Ind. Eng. Chem. Res. 2018, 57, 2526–2536. [Google Scholar] [CrossRef]
- Xu, R. Progress in nanoparticles characterization: Sizing and zeta potential measurement. Particuology 2008, 6, 112–115. [Google Scholar] [CrossRef]
- Wilson, W.W.; Wade, M.M.; Holman, S.C.; Champlin, F.R. Status of methods for assessing bacterial cell surface charge properties based on zeta potential measurements. J. Microbiol. Methods 2001, 43, 153–164. [Google Scholar] [CrossRef] [PubMed]
- Song, Y.; Cong, Y.; Wang, B.; Zhang, N. Applications of Fourier transform infrared spectroscopy to pharmaceutical preparations. J. Microbiol. Methods 2020, 17, 551–571. [Google Scholar] [CrossRef] [PubMed]
- Petit, S.; Madejova, J. Chapter 2.7—Fourier Transform Infrared Spectroscopy. In Developments in Clay Science; Bergaya, F., Lagaly, G., Eds.; Elsevier: Amsterdam, The Netherlands, 2013; pp. 213–231. [Google Scholar]
- Sinko, P.J. Martin’s Physical Pharmacy and Pharmaceutical Sciences; Lippincott Williams & Wilkins: Philadelphia, PA, USA, 2023. [Google Scholar]
- Storey, R.A.; Ymén, I. Solid State Characterization of Pharmaceuticals; John Wiley & Sons: Hoboken, NJ, USA, 2011. [Google Scholar]
- Paul, A.; Fathima, K.; Nair, S.C. Intra Nasal In situ Gelling System of Lamotrigine Using Ion Activated Mucoadhesive Polymer. Open Med. Chem. J. 2017, 11, 222–244. [Google Scholar] [CrossRef] [PubMed]
- Higuchi, T. Rate of release of medicaments from ointment bases containing drugs in suspension. J. Pharm. Sci. 1961, 50, 874–875. [Google Scholar] [CrossRef]
- Korsmeyer, R.; Gurny, R.; Doelker, E.; Buri, P.; Peppas, N. Mechanisms of potassium chloride release from compressed, hydrophilic, polymeric matrices: Effect of entrapped air. J. Pharm. Sci. 1983, 72, 1189–1191. [Google Scholar] [CrossRef]


| Run | (X1) Polox 407 (%) | (X2) Polox 188 (%) | (R1) Gelation Temp (°C) | (R1) Gelation Time (s) |
|---|---|---|---|---|
| 1 | 20 | 13 | 31 | 40 |
| 2 | 19.5 | 15.5 | 35 | 56 |
| 3 | 18 | 15.5 | 35 | 56 |
| 4 | 19.5 | 12 | 28 | 35 |
| 5 | 20 | 15.5 | 34 | 52 |
| 6 | 19 | 13 | 33 | 45 |
| 7 | 19 | 18 | 37 | 59 |
| 8 | 20 | 16 | 34 | 52 |
| 9 | 19.5 | 15.5 | 35 | 56 |
| 10 | 20 | 18 | 36 | 57 |
| Variables | Gelation Temperature °C | Gelling Time (s) |
|---|---|---|
| B0 | 34 | 54 |
| A (poloxamer 407(A1)) | −0.05 | −1.76 |
| B (poloxamer 188 (B2)) | 2.89 | 7.94 |
| AB | 0.68 | 0.75 |
| A2 | −0.05 | 0.0625 |
| B2 | −3.4 | −4.06 |
| Model p-value | 0.004 | 0.003 |
| R2 | 0.89 | 0.99 |
| Adjusted R2 | 0.86 | 0.98 |
| F Value | 29.54 | 101 |
| Formulations | pH | Viscosity (cp) | Gel Temp (°C) | Gel Time (s) | Gel Strength (s) | Drug Content (%) | Spreadability (cm) |
|---|---|---|---|---|---|---|---|
| F1 | 6.2 | 15,000 | 36 | 57 | 55 | 93 | 7 |
| F2 | 6.5 | 14,780 | 34 | 52 | 45 | 90 | 9 |
| F3 | 6.4 | 14,000 | 31 | 40 | 35 | 94 | 12 |
| Evaluation Parameter | at 4–8 °C | ||
|---|---|---|---|
| 1st Month | 2nd Month | 3rd Month | |
| In vitro drug release (%) | 92.05 | 91.34 | 90.45 |
| Viscosity (cp) | 14,000 | 14,100 | 14,212 |
| Appearance | No change | No change | No change |
| Evaluation Parameter | at 25 °C | ||
| 1st Month | 2nd Month | 3rd Month | |
| In vitro drug release (%) | 92.05 | 89.34 | 88.45 |
| Viscosity (cp) | 14,000 | 14,560 | 15,000 |
| Appearance | No change | No change | No change |
| In Vitro Drug Release | ||||
|---|---|---|---|---|
| Kinetic Models | F1 | F2 | F3 | |
| Zero-order | K0 | 0.093 | 0.092 | 0.097 |
| R2 | 3.00 | 0.035 | 2.30 | |
| First-order | K1 | 0.011 | 0.011 | 0.010 |
| R2 | 0.491 | 0.47 | 0.738 | |
| Higuchi model | kH | 3.527 | 3.471 | 3.632 |
| R2 | 0.29 | 0.303 | 0.032 | |
| Korsmeyer–Peppas model | kKP | 29 | 28.7 | 30 |
| R2 | 0.97 | 0.975 | 0.99 | |
| Best-Fit Model | Korsmeyer–Peppas | Korsmeyer–Peppas | Korsmeyer–Peppas | |
| Name | Units | Low | High | −Alpha | +Alpha |
|---|---|---|---|---|---|
| Polox 407 | % | 19 | 20 | 18.7929 | 20.2071 |
| Polox 188 | % | 13 | 18 | 11.9645 | 19.0355 |
| Trial | Polox 407 (%) | Polox 188 (%) |
|---|---|---|
| F1 | 20 | 13 |
| F2 | 19.5 | 15.5 |
| F3 | 18 | 15.5 |
| F4 | 19.5 | 12 |
| F5 | 20 | 15.5 |
| F6 | 19 | 13 |
| F7 | 19 | 18 |
| F8 | 20 | 16 |
| F9 | 19.5 | 15.5 |
| F10 | 20 | 18 |
Disclaimer/Publisher’s Note: The statements, opinions and data contained in all publications are solely those of the individual author(s) and contributor(s) and not of MDPI and/or the editor(s). MDPI and/or the editor(s) disclaim responsibility for any injury to people or property resulting from any ideas, methods, instructions or products referred to in the content. |
© 2023 by the authors. Licensee MDPI, Basel, Switzerland. This article is an open access article distributed under the terms and conditions of the Creative Commons Attribution (CC BY) license (https://creativecommons.org/licenses/by/4.0/).
Share and Cite
Riaz, M.; Zaman, M.; Hameed, H.; Sarwar, H.S.; Khan, M.A.; Irfan, A.; Shazly, G.A.; Paiva-Santos, A.C.; Jardan, Y.A.B. Lamotrigine-Loaded Poloxamer-Based Thermo-Responsive Sol–Gel: Formulation, In Vitro Assessment, Ex Vivo Permeation, and Toxicology Study. Gels 2023, 9, 817. https://doi.org/10.3390/gels9100817
Riaz M, Zaman M, Hameed H, Sarwar HS, Khan MA, Irfan A, Shazly GA, Paiva-Santos AC, Jardan YAB. Lamotrigine-Loaded Poloxamer-Based Thermo-Responsive Sol–Gel: Formulation, In Vitro Assessment, Ex Vivo Permeation, and Toxicology Study. Gels. 2023; 9(10):817. https://doi.org/10.3390/gels9100817
Chicago/Turabian StyleRiaz, Maria, Muhammad Zaman, Huma Hameed, Hafiz Shoaib Sarwar, Mahtab Ahmad Khan, Ali Irfan, Gamal A. Shazly, Ana Cláudia Paiva-Santos, and Yousef A. Bin Jardan. 2023. "Lamotrigine-Loaded Poloxamer-Based Thermo-Responsive Sol–Gel: Formulation, In Vitro Assessment, Ex Vivo Permeation, and Toxicology Study" Gels 9, no. 10: 817. https://doi.org/10.3390/gels9100817
APA StyleRiaz, M., Zaman, M., Hameed, H., Sarwar, H. S., Khan, M. A., Irfan, A., Shazly, G. A., Paiva-Santos, A. C., & Jardan, Y. A. B. (2023). Lamotrigine-Loaded Poloxamer-Based Thermo-Responsive Sol–Gel: Formulation, In Vitro Assessment, Ex Vivo Permeation, and Toxicology Study. Gels, 9(10), 817. https://doi.org/10.3390/gels9100817