
Highly Diverse Phytophthora infestans Populations Infecting Potato Crops in Pskov Region, North-West Russia

 , ,
, , 
Abstract
:1. Introduction
2. Materials and Methods
2.1. Collection and Isolation of P. infestans Strains
2.2. Phenotypic Assays
2.3. DNA Extraction and Microsatellite (SSR) Marker Analysis
2.4. Data Analysis
3. Results
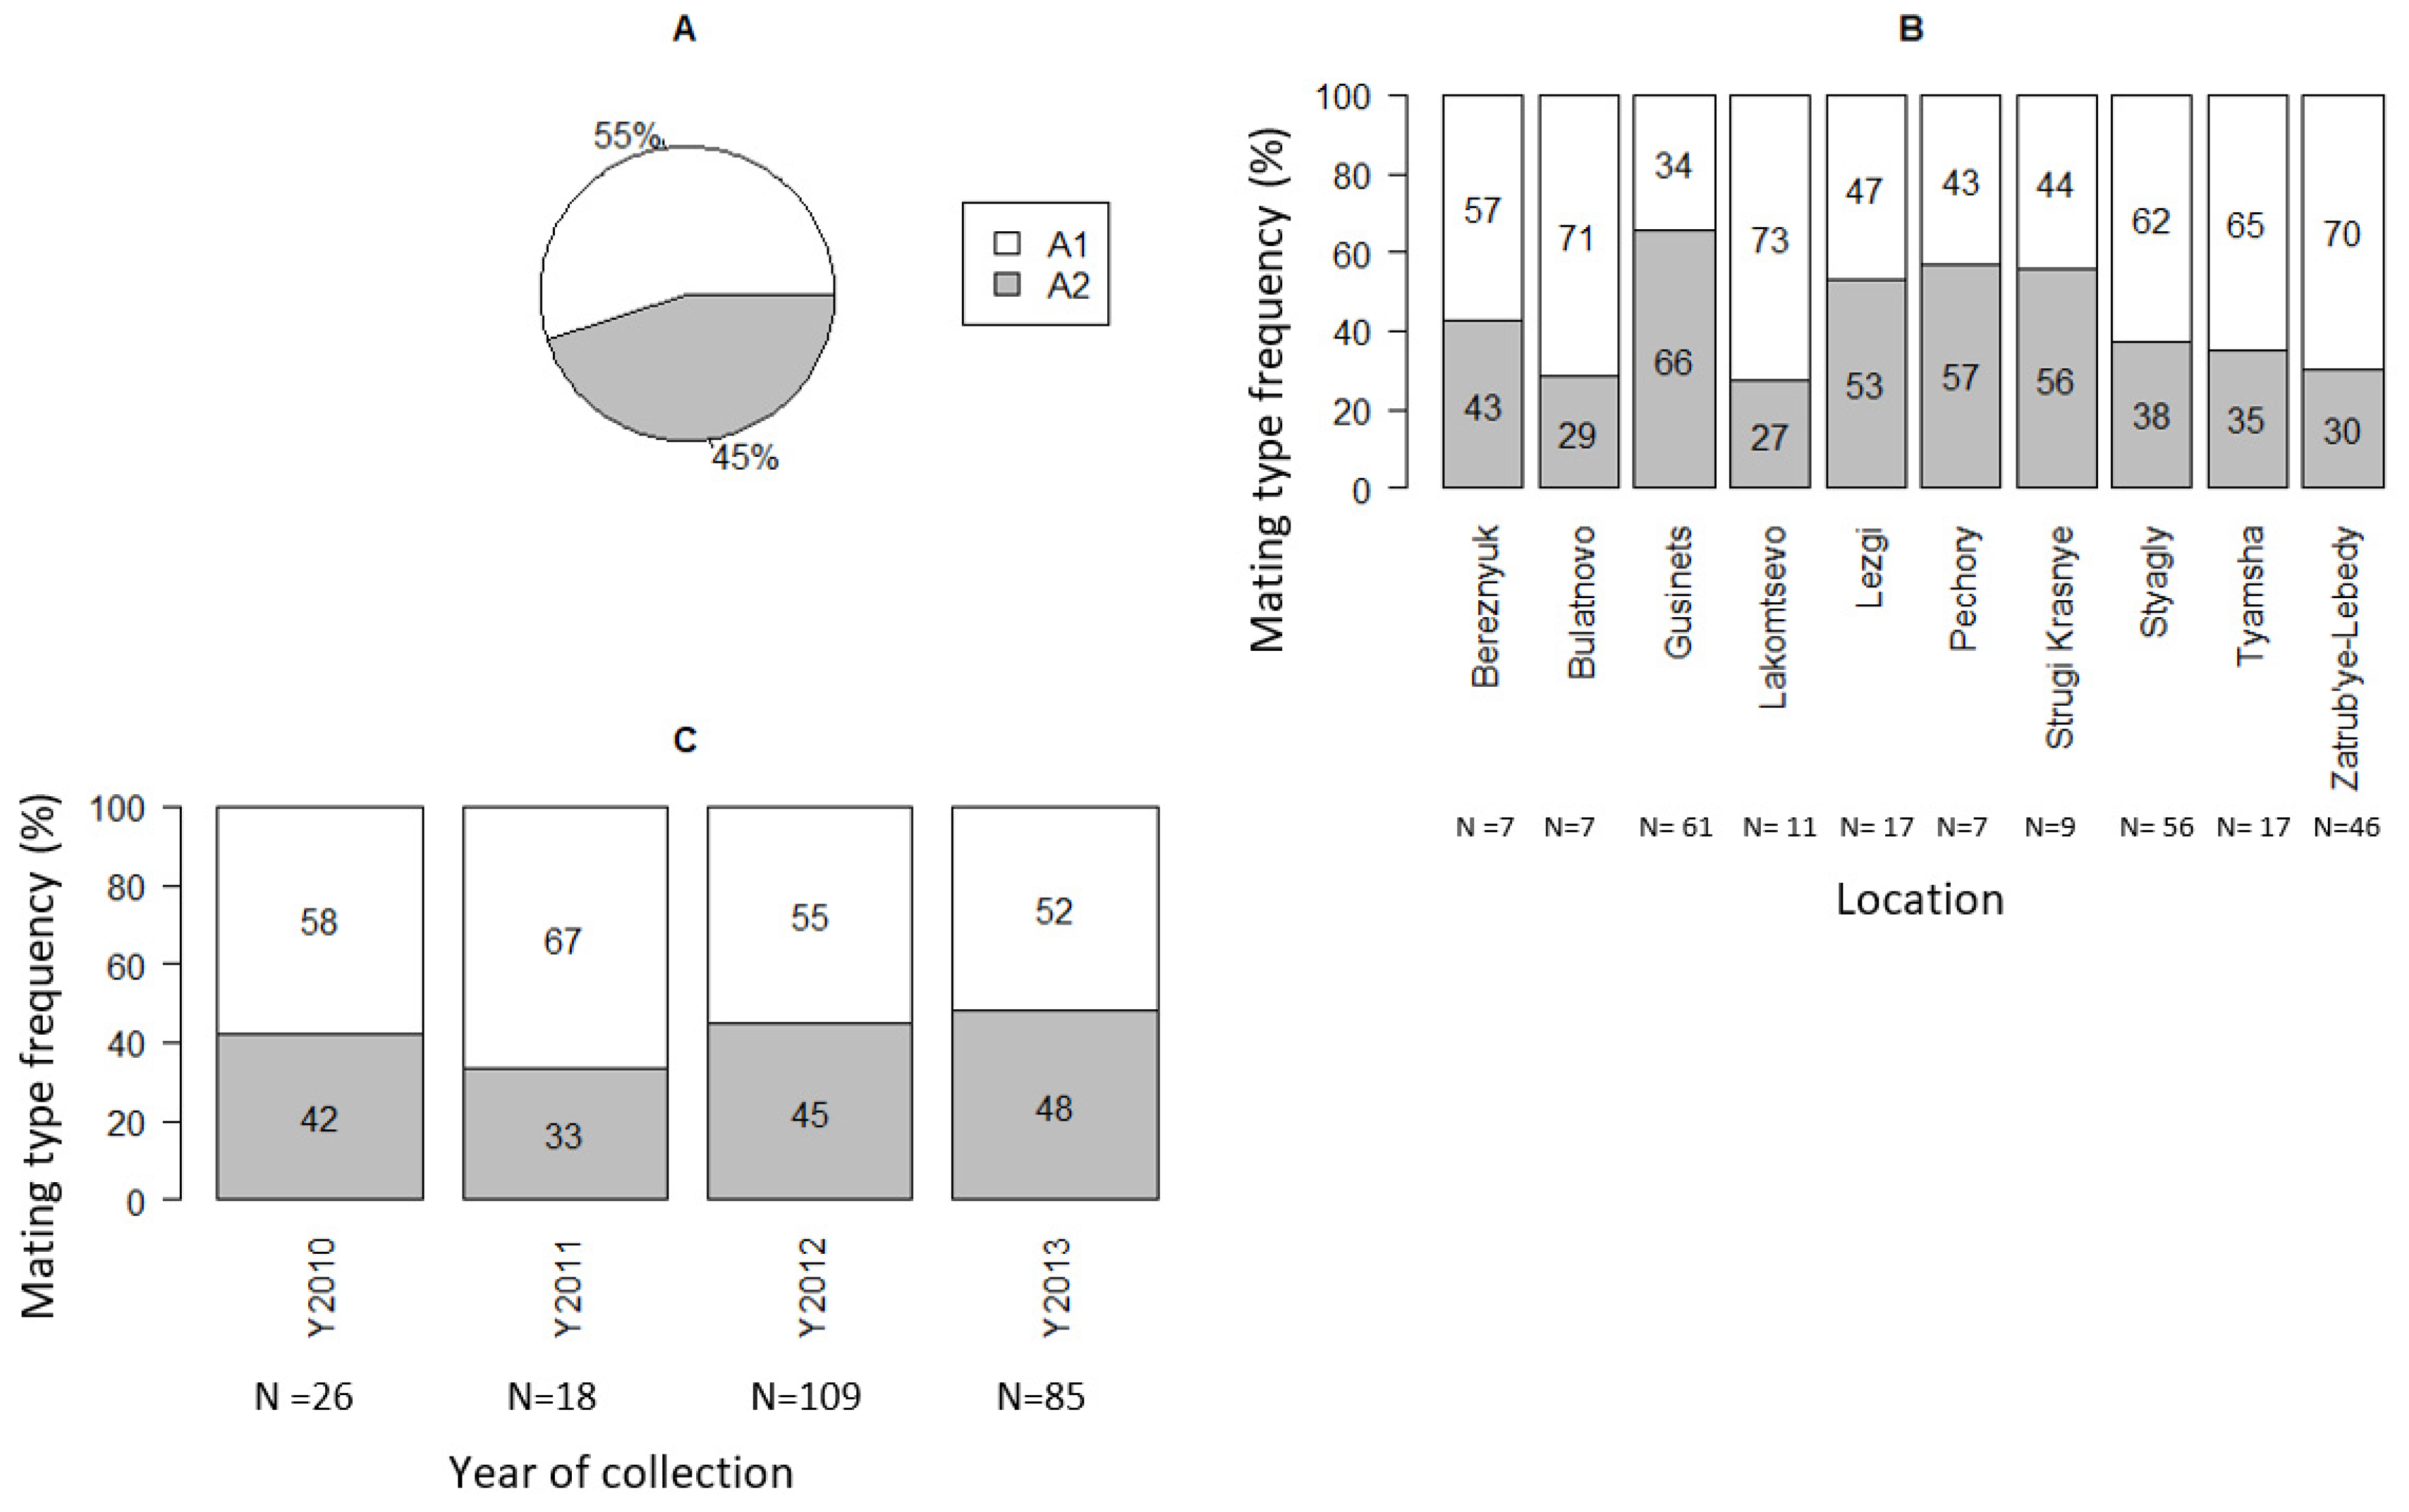
3.1. Mating Type
3.2. Metalaxyl Resistance
3.3. SSR Polymorphisms
3.4. Population Structure
3.5. Population Genetic Differentiation and Linkage Analysis
3.6. Multilocus Genotype and Genotypic Diversity
4. Discussion
4.1. Population Differentiation and Gene Flow
4.2. Evidence of Sexual Reproduction
4.3. Genotypic Diversity of P. infestans
4.4. Metalaxyl Sensitivity and Agricultural Management Practices
5. Conclusions
Supplementary Materials
Author Contributions
Funding
Institutional Review Board Statement
Informed Consent Statement
Data Availability Statement
Acknowledgments
Conflicts of Interest
References
- Fry, W.E.; Birch, P.R.; Judelson, H.S.; Grünwald, N.J.; Danies, G.; Everts, K.L.; Gevens, A.J.; Gugino, B.K.; Johnson, D.A.; Johnson, S.B.; et al. Five reasons to consider Phytophthora infestans a reemerging pathogen. Phytopathology 2015, 105, 966–981. [Google Scholar] [CrossRef] [PubMed] [Green Version]
- Haverkort, A.J.; Boonekamp, P.M.; Hutten, R.; Jacobsen, E.; Lotz, L.A.; Kessel, G.J.; Visser, R.G.; van der Vossen, E.A. Societal costs of late blight in potato and prospects of durable resistance through cisgenic modification. Potato Res. 2008, 51, 47–57. [Google Scholar] [CrossRef]
- Fry, W.E.; Goodwin, S.B.; Dyer, A.T.; Matuszak, J.M.; Drenth, A.; Tooley, P.W.; Sujkowski, L.S.; Koh, Y.J.; Cohen, B.A.; Spielman, L.J.; et al. Historical and recent migrations of Phytophthora infestans: Chronology, pathways and implications. Plant Dis. 1993, 77, 653–661. [Google Scholar] [CrossRef] [Green Version]
- Drenth, A.; Turkensteen, L.J.; Govers, F. The occurrence of the A2 mating type of Phytophthora infestans in the Netherlands; significance and consequences. Neth. J. Plant Pathol. 1993, 99, 57–67. [Google Scholar] [CrossRef]
- Dagget, S.S.; Götz, E.; Themen, C.D. Phenotypic changes in populations of Phytophthora infestans from eastern Germany. Phytopathology 1993, 83, 319–323. [Google Scholar] [CrossRef]
- Hohl, H.R.; Iselin, K. Strains of Phytophthora infestans with A2 mating type behaviour. Trans. Brit. Mycol. Soc. 1984, 83, 529–530. [Google Scholar] [CrossRef]
- Tantius, P.H.; Fyfe, A.M.; Shaw, D.S.; Shattock, R.C. Occurrence of the A2 mating type and self fertile isolates of Phytophthora infestons in England and Wales. Plant Pathol. 1986, 35, 578–581. [Google Scholar] [CrossRef]
- Frinking, H.D.; Davidse, L.C.; Limburg, H. Oospore formation by Phytophthora infestans in host tissue after inoculation with isolates of opposite mating type found in the Netherlands. Neth. J. Plant Pathol. 1987, 93, 147–149. [Google Scholar] [CrossRef]
- Vorobyeva, Y.V.; Gridnev, V.V.; Bashaeva, E.G.; Pospelova, L.A.; Kvasnyuk, N.Y.; Kuznetsova, L.N.; Shemyakina, V.P.; Morozova, E.V.; Zherebtsova, L.N.; Rozalyeva, V.V. On the occurrence of the A2 mating type isolates of Phytophthora infestans (Mont) D by in the USSR. Mikologiya Fitopatol. 1991, 25, 62–67. (In Russian) [Google Scholar]
- Drenth, A.; Janssen, E.M.; Govers, F. Formation and survival of oospores of Phytophthora infestans under natural conditions. Plant Pathol. 1995, 44, 86–94. [Google Scholar] [CrossRef]
- Choi, J.G.; Hong, S.Y.; Kessel, G.J.; Cooke, D.E.; Vossen, J.H.; Cho, J.H.; Im, J.S.; Park, Y.E.; Cho, K.S. Genotypic and phenotypic characterization of Phytophthora infestans in South Korea during 2009–2016 reveals clonal reproduction and absence of EU_13_A2 genotype. Plant Pathol. 2020, 69, 932–943. [Google Scholar] [CrossRef]
- FAO. FAOSTAT, FAO Statistical Databases. 2019. Available online: https://www.fao.org/faostat/en/#search/world%E2%80%99s%20potato%20production (accessed on 15 November 2021).
- Statsyuk, N.V.; Semina, Y.V.; Perez, F.G.; Larsen, M.M.; Kuznetsova, M.A.; Kozlovskaya, I.N.; Morozova, E.V.; Deahl, K.L.; Grünwald, N.J. Characterization of Russian Phytophthora infestans populations: DNA fingerprinting and SSR analysis. PPO Spec. Rep. 2014, 16, 255–266. [Google Scholar]
- Schiermeier, Q. Russia needs help to fend off potato famine, researchers warn. Nature 2001, 410, 1011–1012. [Google Scholar] [CrossRef] [PubMed]
- Vassilieva, Y. Overview of Potato Supply and Demand in Russia. Gain Report. Available online: https://www.potatopro.com/news/2013/gain-report-overview-potato-supply-and-demand-russia (accessed on 30 November 2021).
- Elansky, S.N.; Apryshko, V.P.; Milyutina, D.I.; Kozlovsky, B.E. Resistance of Russian strains of Phytophthora infestans to fungicides metalaxyl and dimethomorph. Mosc. Univ. Biol. Sci. Bull. 2007, 62, 11–14. [Google Scholar] [CrossRef]
- Elansky, S.N.; Pobedinskaya, M.A.; Kokaeva, L.Y.; Statsyuk, N.V.; Dyakov, Y.T. Phytophthora infestans populations from the European part of Russia: Genotypic structure and metalaxyl resistance. J. Plant Pathol. 2015, 97, 449–456. [Google Scholar]
- Filippov, A.V.; Gurevich, B.I.; Kuznetsova, M.A.; Rogozhin, A.N.; Spiglazova, S.Y.; Kravtsov, A.S.; Smetanina, T.I.; Smirnov, A.N. Horizontal resistance of potato foliage to Phytophthora infestans and aggressiveness of pathogen isolates from different geographical regions. Mikol. Fitopatol. 2004, 38, 74–88. (In Russian) [Google Scholar]
- Filippov, A.; Kuznetsova, M.; Rogozhin, A.; Iakusheva, O.; Demidova, V.; Statsyuk, N. Development and testing of a weather-based model to determine potential yield losses caused by potato late blight and optimize fungicide application. Front. Agric. Sci. Eng. 2018, 5, 462–468. [Google Scholar]
- Elansky, S.; Smirnov, A.; Dyakov, Y.; Dolgova, A.; Filippov, A.; Kozlovsky, B.; Kozlovskaya, I.; Russo, P.; Smart, C.; Fry, W. Genotypic analysis of Russian isolates of Phytophthora infestans from the Moscow region, Siberia and Far East. J. Phytopathol. 2001, 149, 605–611. [Google Scholar] [CrossRef]
- Statsyuk, N.V.; Kozlovskaya, I.N.; Koslovsky, B.E.; Ulanova, T.I.; Morozova, E.V.; Kuznetsova, M. Changes in phenotypic characteristics of the Moscow Phytophthora infestans population in the period of 2000–2011. In Proceedings of the 4th International Symposium, Tempe, Arizona, 30 April–3 May 2003; p. 60613. [Google Scholar]
- Kuznetsova, M.A.; Statsyuk, N.V.; Rogozhin, A.N.; Ulanova, T.I.; Morozova, E.V.; Demidova, V.N. Monitoring of Phytophthora infestans strains isolated from potato and tomato in Moscow region (2009–2017). Dostizheniya Nauk. Tekhniki APK 2018, 32, 28–33. (In Russian) [Google Scholar]
- Sokolova, E.A.; Kuznetsova, M.A.; Kozlovsky, B.E.; Beketova, M.P.; Malyuchenko, O.P.; Alekseev, Y.; Rogozina, E.V.; Khavkin, E.E. Virulence and aggressiveness of new Phytophthora infestans isolates collected in North-Western Russia as related to host plant resistance. PPO Spec. Rep. 2015, 17, 229. [Google Scholar]
- Rosstat. Pskov Region in Numbers. 2021. Available online: https://pskovstat.gks.ru/storage/mediabank/mPTrR1Vq/ibd210527_4.pdf (accessed on 24 November 2021).
- Aav, A.; Skrabule, I.; Bimšteine, G.; Kaart, T.; Williams, I.H.; Runno-Paurson, E. The structure of mating type, metalaxyl resistance and virulence of Phytophthora infestans isolates collected from Latvia. Zemdirb. Agric. 2015, 102, 335–342. [Google Scholar] [CrossRef] [Green Version]
- Runno-Paurson, E.; Kiiker, R.; Joutsjoki, T.; Hannukkala, A. High genotypic diversity found among population of Phytophthora infestans collected in Estonia. Fungal Biol. 2016, 120, 385–392. [Google Scholar] [CrossRef] [PubMed]
- Kiiker, R.; Hansen, M.; Williams, I.H.; Cooke, D.E.; Runno-Paurson, E. Outcome of sexual reproduction in the Phytophthora infestans population in Estonian potato fields. Eur. J. Plant Pathol. 2018, 152, 395–407. [Google Scholar] [CrossRef]
- Li, Y.; Cooke, D.E.; Jacobsen, E.; van der Lee, T. Efficient multiplex simple sequence repeat genotyping of the oomycete plant pathogen Phytophthora infestans. J. Microbiol. Methods 2013, 92, 316–322. [Google Scholar] [CrossRef]
- Runno-Paurson, E.; Fry, W.E.; Myers, K.L.; Koppel, M.; Mänd, M. Characterisation of Phytophthora infestans isolates collected from potato in Estonia during 2002–2003. Eur. J. Plant Pathol. 2009, 124, 565–575. [Google Scholar] [CrossRef]
- Caten, C.E.; Jinks, J.L. Spontaneous variability of single isolates of Phytophthora infestans. I. Cultural variation. Can. J. Bot. 1968, 46, 329–348. [Google Scholar] [CrossRef]
- Hermansen, A.; Hannukkala, A.; Hafskjold Naerstad, R.; Brurberg, M.B. Variation in populations of Phytophthora infestans in Finland and Norway: Mating type, metalaxyl resistance and virulence phenotype. Plant Pathol. 2000, 49, 11–22. [Google Scholar] [CrossRef]
- Kiiker, R.; Skrabule, I.; Ronis, A.; Cooke, D.E.; Hansen, J.G.; Williams, I.H.; Mänd, M.; Runno-Paurson, E. Diversity of populations of Phytophthora infestans in relation to patterns of potato crop management in Latvia and Lithuania. Plant Pathol. 2019, 68, 1207–1214. [Google Scholar] [CrossRef]
- SAS Institute Inc. SAS/STAT® 14.1 User’s Guide; SAS Institute Inc.: Cary, NC, USA, 2015. [Google Scholar]
- Nei, M. Estimation of average heterozygosity and genetic distance from a small number of individuals. Genetics 1978, 89, 583–590. [Google Scholar] [CrossRef]
- Kamvar, Z.N.; Tabima, J.F.; Grünwald, N.J. Poppr: An R package for genetic analysis of populations with clonal, partially clonal, and/or sexual reproduction. PeerJ 2014, 2, e281. [Google Scholar] [CrossRef] [Green Version]
- R Core Team. R: A Language and Environment for Statistical Computing; R Foundation for Statistical Computing: Vienna, Austria, 2018. [Google Scholar]
- Peakall, R.O.; Smouse, P.E. GENALEX 6: Genetic analysis in Excel. Population genetic software for teaching and research. Mol. Ecol. Notes. 2006, 6, 288–295. [Google Scholar] [CrossRef]
- Chen, R.S.; McDonald, B.A. Sexual reproduction plays a major role in the genetic structure of populations of the fungus Mycosphaerella graminicola. Genetics 1996, 142, 1119–1127. [Google Scholar] [CrossRef] [PubMed]
- Kumar, J.; Nelson, R.J.; Zeigler, R.S. Population structure and dynamics of Magnaporthe grisea in the Indian Himalayas. Genetics 1999, 152, 971–984. [Google Scholar] [CrossRef] [PubMed]
- Milgroom, M.G. Recombination and the multilocus structure of fungal populations. Annu. Rev. Phytopathol. 1996, 34, 457–477. [Google Scholar] [CrossRef]
- Grünwald, N.J.; Goodwin, S.B.; Milgroom, M.G.; Fry, W.E. Analysis of genotypic diversity data for populations of microorganisms. Phytopathology 2003, 93, 738–746. [Google Scholar] [CrossRef] [Green Version]
- Grünwald, N.J.; Hoheisel, G.A. Hierarchical analysis of diversity, selfing, and genetic differentiation in populations of the oomycete Aphanomyces euteiches. Phytopathology 2006, 96, 1134–1141. [Google Scholar] [CrossRef] [Green Version]
- Kamvar, Z.N.; Tabina, J.F.; Everhart, S.E.; Brooks, J.C.; Krueger-Hadfield, S.A.; Sotka, E. Genetic Analysis of Populations with Mixed Reproduction. 2018. Available online: https://cran.r-project.org/web/packages/poppr/poppr.pdf (accessed on 18 April 2022).
- Li, H.; Zhou, G.Y.; Liu, J.A.; Xu, J. Population genetic analyses of the fungal pathogen Colletotrichum fructicola on tea-oil trees in China. PLoS ONE 2016, 11, e0156841. [Google Scholar] [CrossRef] [Green Version]
- Brown, A.H.; Feldman, M.W.; Nevo, E. Multilocus structure of natural populations of Hordeum spontaneum. Genetics 1980, 96, 523–536. [Google Scholar] [CrossRef]
- Agapow, P.M.; Burt, A. Indices of multilocus linkage disequilibrium. Mol. Ecol. Notes 2001, 1, 101–102. [Google Scholar] [CrossRef]
- Jombart, T.; Collins, C. A Tutorial for Discriminant Analysis of Principal Components (DAPC) Using Adegenet 2.0.0. Available online: https://adegenet.r-forge.r-project.org/files/tutorial-dapc.pdf (accessed on 19 April 2022).
- Jombart, T.; Devillard, S.; Balloux, F. Discriminant analysis of principal components: A new method for the analysis of genetically structured populations. BMC Genet. 2010, 11, 94. [Google Scholar] [CrossRef] [Green Version]
- Tsykun, T.; Rellstab, C.; Dutech, C.; Sipos, G.; Prospero, S. Comparative assessment of SSR and SNP markers for inferring the population genetic structure of the common fungus Armillaria cepistipes. Heredity 2017, 119, 371–380. [Google Scholar] [CrossRef] [PubMed]
- Grünwald, N.J.; Kamvar, Z.N.; Everhart, S.E. Population Genetics in R. 2015. Online Book. Available online: http://grunwaldlab.github.io/Population_Genetics_in_R/ (accessed on 19 April 2022).
- Verity, R.; Nichols, R.A. What is genetic differentiation, and how should we measure it—GST, D, neither or both? Mol. Ecol. 2014, 23, 4216–4225. [Google Scholar] [CrossRef] [PubMed]
- Hossain, M.I.; Ahmad, K.; Vadamalai, G.; Siddiqui, Y.; Saad, N.; Ahmed, O.H.; Hata, E.M.; Adzmi, F.; Rashed, O.; Rahman, M.Z.; et al. Phylogenetic analysis and genetic diversity of Colletotrichum falcatum isolates causing sugarcane red rot disease in Bangladesh. Biology 2021, 10, 862. [Google Scholar] [CrossRef] [PubMed]
- McDermott, J.M.; McDonald, B.A. Gene flow in plant pathosystems. Annu. Rev. Phytopathol. 1993, 31, 353–373. [Google Scholar] [CrossRef]
- Wright, S. The genetical structure of populations. Ann. Eugen. 1951, 15, 323–354. [Google Scholar] [CrossRef]
- Jost, L. GST and its relatives do not measure differentiation. Mol. Ecol. 2008, 18, 4015–4026. [Google Scholar] [CrossRef]
- Ryman, N.; Leimar, O. GST is still a useful measure of genetic differentiation—A comment on Jost’s D. Mol. Ecol. 2009, 18, 2084–2087. [Google Scholar] [CrossRef]
- Wang, Y.P.; Xie, J.H.; Wu, E.J.; Yahuza, L.; Duan, G.H.; Shen, L.L.; Liu, H.; Zhou, S.H.; Nkurikiyimfura, O.; Andersson, B.; et al. Lack of gene flow between Phytophthora infestans populations of two neighboring countries with the largest potato production. Evol. Appl. 2020, 13, 18–29. [Google Scholar] [CrossRef] [Green Version]
- Kawecki, T.J.; Ebert, D. Conceptual issues in local adaptation. Ecol. Lett. 2004, 7, 1225–1241. [Google Scholar] [CrossRef] [Green Version]
- Milgroom, M.G.; Peever, T.L. Population biology of plant pathogens: The synthesis of plant disease epidemiology and population genetics. Plant Dis. 2003, 87, 608–617. [Google Scholar] [CrossRef] [Green Version]
- Firester, B.; Shtienberg, D.; Blank, L. Modelling the spatiotemporal dynamics of Phytophthora infestans at a regional scale. Plant Pathol. 2018, 67, 1552–1561. [Google Scholar] [CrossRef]
- Gao, F.; Chen, C.; Li, B.; Weng, Q.; Chen, Q. The gene flow direction of geographically distinct Phytophthora infestans populations in China corresponds with the route of seed potato exchange. Front. Microbiol. 2020, 11, 1077. [Google Scholar] [CrossRef] [PubMed]
- Chmielarz, M.; Sobkowiak, S.; Dębski, K.; Cooke, D.E.; Brurberg, M.B.; Śliwka, J. Diversity of Phytophthora infestans from Poland. Plant Pathol. 2014, 63, 203–211. [Google Scholar] [CrossRef]
- Maurice, S.; Montes, M.S.; Nielsen, B.J.; Bødker, L.; Martin, M.D.; Jønck, C.G.; Kjøller, R.; Rosendahl, S. Population genomics of an outbreak of the potato late blight pathogen, Phytophthora infestans, reveals both clonality and high genotypic diversity. Mol. Plant Pathol. 2019, 20, 1134–1146. [Google Scholar] [CrossRef] [Green Version]
- Vaghefi, N.; Nelson, S.C.; Kikkert, J.R.; Pethybridge, S.J. Genetic structure of Cercospora beticola populations on Beta vulgaris in New York and Hawaii. Sci. Rep. 2017, 7, 1726. [Google Scholar] [CrossRef]
- Li, Y.; van der Lee, T.A.; Evenhuis, A.; van den Bosch, G.B.; van Bekkum, P.J.; Förch, M.G.; van Gent-Pelzer, M.P.; van Raaij, H.M.; Jacobsen, E.; Huang, S.W.; et al. Population dynamics of Phytophthora infestans in the Netherlands reveals expansion and spread of dominant clonal lineages and virulence in sexual offspring. G3 Genes Genomes Genet. 2012, 2, 1529–1540. [Google Scholar]
- Kuznetsova, M.A.; Ulanova, T.I.; Rogozhin, A.N.; Smetanina, T.I.; Filippov, A.V. Role of oospores in the overwintering and year-on-year development of the late blight pathogen on tomato and potato. PPO Spec. Rep. 2010, 14, 223–230. [Google Scholar]
- Smirnov, A.N.; Elansky, S.N. Oospore formation in the field populations of Phytophthora infestans in Moscow region. Mikologiya Fitopatol. 1999, 33, 421–425. (In Russian) [Google Scholar]
- Brurberg, M.B.; Elameen, A.; Le, V.H.; Nærstad, R.; Hermansen, A.; Lehtinen, A.; Hannukkala, A.; Nielsen, B.; Hansen, J.; Andersson, B.; et al. Genetic analysis of Phytophthora infestans populations in the Nordic European countries reveals high genetic variability. Fungal Biol. 2011, 115, 335–342. [Google Scholar] [CrossRef]
- Sjöholm, L.; Andersson, B.; Högberg, N.; Widmark, A.K.; Yuen, J. Genotypic diversity and migration patterns of Phytophthora infestans in the Nordic countries. Fungal Biol. 2013, 117, 722–730. [Google Scholar] [CrossRef]
- Shakya, S.K.; Larsen, M.M.; Cuenca-Condoy, M.M.; Lozoya-Saldaña, H.; Grünwald, N.J. Variation in genetic diversity of Phytophthora infestans populations in Mexico from the center of origin outwards. Plant Dis. 2018, 102, 1534–1540. [Google Scholar] [CrossRef] [PubMed] [Green Version]
- Elansky, S.N.; Smirnov, A.N.; Bagirova, S.F.; Dyakov, Y.T. Phytophthora infestans populations in Moscow region. II. Comparative structure of populations infecting potato and tomato plants. Mikol. Fitopatol. 1999, 33, 353–359. [Google Scholar]
- Gisi, U.; Walder, F.; Resheat-Eini, Z.; Edel, D.; Sierotzki, H. Changes of genotype, sensitivity and aggressiveness in Phytophthora infestans isolates collected in European countries in 1997, 2006 and 2007. J. Phytopathol. 2011, 159, 223–232. [Google Scholar] [CrossRef]
- Mariette, N.; Mabon, R.; Corbière, R.; Boulard, F.; Glais, I.; Marquer, B.; Pasco, C.; Montarry, J.; Andrivon, D. Phenotypic and genotypic changes in French populations of Phytophthora infestans: Are invasive clones the most aggressive? Plant Pathol. 2016, 65, 577–586. [Google Scholar] [CrossRef]
- Kanetis, L.; Pittas, L.; Nikoloudakis, N.; Cooke, D.E.; Ioannou, N. Characterization of Phytophthora infestans populations in Cyprus, the southernmost potato-producing European country. Plant Dis. 2021, 105, 3407–3417. [Google Scholar] [CrossRef] [PubMed]
- Hansen, Z.R.; Everts, K.L.; Fry, W.E.; Gevens, A.J.; Grünwald, N.J.; Gugino, B.K.; Johnson, D.A.; Johnson, S.B.; Judelson, H.S.; Knaus, B.J.; et al. Genetic Variation within Clonal Lineages of Phytophthora infestans Revealed through Genotyping-by-Sequencing, and Implications for Late Blight Epidemiology. PLoS ONE 2016, 11, e0165690. [Google Scholar] [CrossRef] [PubMed] [Green Version]
- Saville, A.; Ristaino, J.B. Genetic Structure and Subclonal Variation of Extant and Recent US Lineages of Phytophthora infestans. Phytopathology 2019, 109, 1614–1627. [Google Scholar] [CrossRef]
- Dangi, S.; Wharthon, P.; Ambarwati, A.D.; Santoso, T.J.; Kusmana; Sulastrini, I.; Medendorp, J.; Hokanson, K.; Douches, D. Genotypic and phenotypic characterization of Phytophthora infestans populations on Java, Indonesia. Plant Pathol. 2021, 70, 61–73. [Google Scholar] [CrossRef]
- Beninal, L.; Bouznad, Z.; Corbiere, R.; Belkhiter, S.; Mabon, R.; Taoutaou, A.; Keddad, A.; Runno-Paurson, E.; Andrivon, D. Distribution of major clonal lineages EU_13_A2, EU_2_A1, and EU_23_A1 of Phytophthora infestans associated with potato late blight across crop seasons and regions in Algeria. Plant Pathol. 2022, 71, 458–469. [Google Scholar] [CrossRef]
- Njoroge, A.W.; Andersson, B.; Lees, A.K.; Mutai, C.; Forbes, G.A.; Yuen, J.E.; Pelle, R. Genotyping of Phytophthora infestans in Eastern Africa Reveals a Dominating Invasive European Lineage. Phytopathology 2019, 109, 670–680. [Google Scholar] [CrossRef] [Green Version]
- Cohen, Y.; Rubin, A.E.; Galperin, M.; Shamaba, E.; Zig, U.; Cooke, D.E.L. Migration and selection enforced multiple phenotypic and genotypic changes in the population of Phytophthora infestans in Israel during the last 36-year period. Preprints 2020, 2020010321. [Google Scholar] [CrossRef] [Green Version]
- Guha Roy, S.; Dey, T.; Cooke, D.E.L.; Cooke, L.R. 2021. The dynamics of Phytophthora infestans populations in the major potato-growing regions of Asia—A review. Plant Pathol. 2021, 70, 1015–1031. [Google Scholar] [CrossRef]
- Schepers, H.T.A.M.; Kessel, G.J.T.; Lucca, F.; Forch, M.G.; van den Bosch, G.B.M.; Topper, C.G.; Evenhuis, A. Reduced efficacy of fluazinam against Phytophthora infestans in the Netherlands. Eur. J. Plant Pathol. 2018, 151, 947–960. [Google Scholar] [CrossRef] [PubMed] [Green Version]
- McDonald, B.A.; Linde, C. Pathogen population genetics, evolutionary potential, and durable resistance. Annu. Rev. Phytopathol. 2002, 40, 349–379. [Google Scholar] [CrossRef] [Green Version]
- Ko, W.H. Reversible change of mating type in Phytophthora parasitica. Microbiology 1981, 125, 451–454. [Google Scholar] [CrossRef] [Green Version]
- Hanson, S.J.; Wolfe, K.H. An evolutionary perspective on yeast mating-type switching. Genetics 2017, 206, 9–32. [Google Scholar] [CrossRef] [Green Version]
- Tzelepis, G.; Hodén, K.P.; Fogelqvist, J.; Åsman, A.K.; Vetukuri, R.R.; Dixelius, C. Dominance of Mating Type A1 and Indication of Epigenetic Effects during Early Stages of Mating in Phytophthora infestans. Front. Microbiol. 2020, 11, 252. [Google Scholar] [CrossRef]
- Cooke, L.R.; Schepers, H.T.; Hermansen, A.; Bain, R.A.; Bradshaw, N.J.; Ritchie, F.; Shaw, D.S.; Evenhuis, A.; Kessel, G.J.; Wander, J.G.; et al. Epidemiology and integrated control of potato late blight in Europe. Potato Res. 2011, 54, 183–222. [Google Scholar] [CrossRef] [Green Version]
- Nielsen, B.J.; Schepers, H.T. Efficacy of fluazinam for control of potato late blight (Phytophthora infestans) in Danish field trials. In Proceedings of the 16th EuroBlight Workshop. PPO Spec. Rep. 2014, 16, 113–116. [Google Scholar]
- Gisi, U.; Cohen, Y. Resistance to phenylamide fungicides: A case study with Phytophthora infestans involving mating type and race structure. Annu. Rev. Phytopathol. 1996, 34, 549–572. [Google Scholar] [CrossRef] [Green Version]
- Hu, C.H.; Perez, F.G.; Donahoo, R.; McLeod, A.; Myers, K.; Ivors, K.; Secor, G.; Roberts, P.D.; Deahl, K.L.; Fry, W.E.; et al. Recent genotypes of Phytophthora infestans in the eastern United States reveal clonal populations and reappearance of mefenoxam sensitivity. Plant Dis. 2012, 96, 1323–1330. [Google Scholar] [CrossRef] [PubMed] [Green Version]
- Stroud, J.A.; Shaw, D.S.; Hale, M.D.; Steele, K.A. SSR assessment of Phytophthora infestans populations on tomato and potato in British gardens demonstrates high diversity but no evidence for host specialization. Plant Pathol. 2016, 65, 334–341. [Google Scholar] [CrossRef] [Green Version]
- Brylińska, M.; Sobkowiak, S.; Stefańczyk, E.; Śliwka, J. Potato cultivation system affects population structure of Phytophthora infestans. Fungal Ecol. 2016, 20, 132–143. [Google Scholar] [CrossRef]
- Runno-Paurson, E.; Ronis, A.; Hansen, M.; Aav, A.; Williams, I.H. Lithuanian populations of Phytophthora infestans revealed a high phenotypic diversity. J. Plant Dis. Prot. 2015, 122, 57–65. [Google Scholar] [CrossRef]
- Runno-Paurson, E.; Remmel, T.; Ojarand, A.; Aav, A.; Mänd, M. The structure of Phytophthora infestans populations from organic and conventional crops. Eur. J. Plant Pathol. 2010, 128, 373–383. [Google Scholar] [CrossRef]
- Cooke, D.; Young, V.; Birch, P.; Toth, R.; Gourlay, F.; Day, J.; Carnegie, S.; Duncan, J. Phenotypic and genotypic diversity of Phytophthora infestans populations in Scotland (1995–97). Plant Pathol. 2003, 52, 181–192. [Google Scholar] [CrossRef]
- Lehtinen, A.; Hannukkala, A.; Andersson, B.; Hermansen, A.; Le, V.H.; Naerstad, R.; Brurberg, M.B.; Nielsen, B.J.; Hansen, J.G.; Yuen, J. Phenotypic variation in Nordic populations of Phytophthora infestans in 2003. Plant Pathol. 2008, 57, 227–234. [Google Scholar] [CrossRef]
- Janiszewska, M.; Sobkowiak, S.; Stefańczyk, E.; Śliwka, J. Population structure of Phytophthora infestans from a single location in Poland over a long period of time in context of weather conditions. Microb. Ecol. 2021, 8, 746–757. [Google Scholar] [CrossRef]
- Mazákova, J.; Zouhar, M.; Ryšanek, P.; Táborský, V.; Hausvater, E.; Doležal, P. Sensitivity to fungicides in the isolates of Phytophthora infestans (Mont.) de Bary in the Czech Republic from 2003 to 2008. Plant Protect. Sci. 2011, 47, 5–12. [Google Scholar] [CrossRef] [Green Version]
- Duvauchelle, S.; Dubois, L.; Détourné, D. Evolution of the population of Phytophthora infestans in France measured by epidemiologic and phenotypic markers. In Proceedings of the III International Late Blight Conference, Beijing, China, 3–6 April 2008; Volume 834, pp. 149–154. [Google Scholar]
- Stellingwerf, J.S.; Phelan, S.; Doohan, F.M.; Ortiz, V.; Griffin, D.; Bourke, A.; Hutten, R.C.B.; Cooke, D.E.L.; Kildea, S.; Mullins, E. Evidence for selection pressure from resistant potato genotypes but not from fungicide application within a clonal Phytophthora infestans population. Plant Pathol. 2018, 67, 1528–1538. [Google Scholar] [CrossRef]
- EuroBlight. A Potato Late Blight Network for Europe. Available online: https://agro.au.dk/forskning/internationale-platforme/euroblight (accessed on 28 December 2021).


| Site | Sampling Year | Geographical Coordinates | Field Type Note | Number of Isolates | ||||
|---|---|---|---|---|---|---|---|---|
| Mating Type | Response to Metalaxyl | |||||||
| A1 | A2 | R | I | S | ||||
| Lakomtsevo (1) | 2010 | 57.7528, 28.0898 | SSC | 7 | 0 | 0 | 1 | 5 |
| Lakomtsevo (3) | 2010 | 57.7531, 28.0899 | SSC | 1 | 3 | 0 | 0 | 3 |
| Pechory | 2010 | 57.8094, 27.8182 | LSC | 3 | 4 | 0 | 0 | 5 |
| Styagly | 2010 | 57.8395, 28.0865 | SSC | 4 | 4 | 0 | 0 | 4 |
| Strugi Krasnye | 2011 | 58.2654, 29.1143 | SSC | 4 | 5 | 0 | 0 | 9 |
| Styagly (1) | 2011 | 57.8405, 28.0864 | SSC | 4 | 1 | 0 | 0 | 5 |
| Styagly (2) | 2011 | 57.8403, 28.0866 | SSC | 4 | 0 | 0 | 0 | 4 |
| Gusinets (1) | 2012 | 57.7236, 27.8221 | SSC | 6 | 9 | 0 | 1 | 7 |
| Gusinets (2) | 2012 | 57.7239, 27.8210 | SSC | 5 | 10 | 0 | 1 | 6 |
| Lezgi | 2012 | 57.8121, 27.8245 | LSC | 1 | 0 | 0 | 0 | 1 |
| Styagly (1) | 2012 | 57.8395, 28.0863 | SSC | 7 | 12 | 0 | 3 | 12 |
| Styagly (2) | 2012 | 57.8401, 28.0866 | SSC | 16 | 4 | 0 | 0 | 12 |
| Tyamsha | 2012 | 57.7457, 28.1562 | SSC | 11 | 6 | 0 | 0 | 15 |
| Zatrub’ye-Lebedy | 2012 | 57.7591, 27.6860 | LSC | 14 | 8 | 0 | 9 | 8 |
| Bereznyuk | 2013 | 57.7799, 27.6879 | LSC | 4 | 3 | 2 | 2 | 3 |
| Bulatnovo | 2013 | 57.7907, 27.6582 | LSC | 5 | 2 | 2 | 0 | 5 |
| Gusinets (1) | 2013 | 57.7235, 27.8220 | SSC | 5 | 12 | 7 | 2 | 8 |
| Gusinets (2) | 2013 | 57.7234, 27.8203 | SSC | 5 | 9 | 4 | 1 | 7 |
| Lezgi | 2013 | 57.8124, 27.8294 | LSC | 7 | 9 | 7 | 1 | 6 |
| Zatrub’ye-Lebedy | 2013 | 57.7667, 27.6854 | LSC | 18 | 6 | 7 | 3 | 11 |
| Total | 131 | 107 | 29 | 24 | 136 | |||
| SSR Locus | Nallele | λ | He | E5 | Pr.Exact |
|---|---|---|---|---|---|
| D13 | 7 | 0.255 | 0.257 | 0.391 | 0.000 |
| G11 | 8 | 0.799 | 0.802 | 0.896 | 0.000 |
| Pi02 | 4 | 0.462 | 0.464 | 0.585 | 0.100 |
| Pi04 | 3 | 0.657 | 0.660 | 0.980 | 0.000 |
| Pi4B | 4 | 0.654 | 0.657 | 0.951 | 0.214 |
| Pi63 | 4 | 0.633 | 0.636 | 0.906 | 0.561 |
| Pi70 | 2 | 0.094 | 0.095 | 0.477 | 0.001 |
| SSR2 | 2 | 0.493 | 0.494 | 0.986 | 0.840 |
| SSR4 | 8 | 0.766 | 0.769 | 0.791 | 0.749 |
| SSR6 | 2 | 0.437 | 0.439 | 0.887 | 1.000 |
| SSR8 | 3 | 0.514 | 0.516 | 0.919 | 0.427 |
| SSR11 | 3 | 0.611 | 0.613 | 0.897 | 0.582 |
| Mean | 4.17 | 0.532 | 0.534 | 0.806 |
| Source | df | Sum of Squares | Mean Squares | Variance Components | Variation (%) | p Value |
|---|---|---|---|---|---|---|
| Among locations | 9 | 33.245 | 3.694 | 0.142 | 5.306 | 0.207 |
| Within locations | 75 | 190.326 | 2.538 | 2.538 | 94.694 | |
| Total | 84 | 223.571 | 2.662 | 2.680 | ||
| Among years | 3 | 11.846 | 3.949 | 0.069 | 2.568 | 0.226 |
| Within years | 79 | 206.762 | 2.617 | 2.617 | 97.432 | |
| Total | 82 | 218.608 | 2.666 | 2.686 | ||
| Among agricultural management practices | 1 | 3.758 | 3.758 | 0.029 | 1.068 | 0.238 |
| Within agricultural management practices | 83 | 219.812 | 2.648 | 2.648 | 98.932 | |
| Total | 84 | 223.571 | 2.662 | 2.677 |
| Population | N | MLG | eMLG | λc | He | E5 |
|---|---|---|---|---|---|---|
| Location | ||||||
| Bereznyuk | 7 | 6 | 6 | 0.952 | 0.451 | 0.937 |
| Bulatnovo | 7 | 5 | 5 | 0.905 | 0.486 | 0.931 |
| Gusinets | 34 | 17 | 4.73 | 0.829 | 0.516 | 0.479 |
| Lakomtsevo | 11 | 5 | 6 | 0.782 | 0.532 | 0.815 |
| Lezgi | 10 | 6 | 3 | 0.844 | 0.541 | 0.792 |
| Pechory | 6 | 3 | 6 | 0.733 | 0.234 | 0.898 |
| Strugi Krasnye | 9 | 6 | 8.48 | 0.889 | 0.492 | 0.866 |
| Styagly | 33 | 20 | 7 | 0.962 | 0.497 | 0.854 |
| Tyamsha | 7 | 7 | 7.31 | 1 | 0.505 | 1 |
| Zatrub’ye-Lebedy | 17 | 10 | 9.36 | 0.926 | 0.530 | 0.867 |
| Mean value | 14.1 | 8.5 | 6.29 | 0.882 | 0.478 | 0.843 |
| Years | ||||||
| 2010 | 25 | 15 | 12.0 | 0.943 | 0.507 | 0.828 |
| 2011 | 18 | 11 | 11.0 | 0.928 | 0.521 | 0.841 |
| 2012 | 48 | 21 | 11.1 | 0.898 | 0.489 | 0.581 |
| 2013 | 50 | 36 | 15.9 | 0.985 | 0.551 | 0.887 |
| Mean value | 35.3 | 20.8 | 12.5 | 0.939 | 0.517 | 0.784 |
| Agricultural management practices | ||||||
| Large-scale conventional field (LSC) | 47 | 30 | 30.0 | 0.978 | 0.532 | 0.871 |
| Small-scale conventional field (SSC) | 94 | 55 | 32.9 | 0.970 | 0.531 | 0.606 |
| Mean value | 70.5 | 42.5 | 31.5 | 0.974 | 0.532 | 0.739 |
| Whole collection | 141 | 85 | 36.8 | 0.984 | 0.533 | 0.663 |
Publisher’s Note: MDPI stays neutral with regard to jurisdictional claims in published maps and institutional affiliations. |
© 2022 by the authors. Licensee MDPI, Basel, Switzerland. This article is an open access article distributed under the terms and conditions of the Creative Commons Attribution (CC BY) license (https://creativecommons.org/licenses/by/4.0/).
Share and Cite
Runno-Paurson, E.; Agho, C.A.; Zoteyeva, N.; Koppel, M.; Hansen, M.; Hallikma, T.; Cooke, D.E.L.; Nassar, H.; Niinemets, Ü. Highly Diverse Phytophthora infestans Populations Infecting Potato Crops in Pskov Region, North-West Russia. J. Fungi 2022, 8, 472. https://doi.org/10.3390/jof8050472
Runno-Paurson E, Agho CA, Zoteyeva N, Koppel M, Hansen M, Hallikma T, Cooke DEL, Nassar H, Niinemets Ü. Highly Diverse Phytophthora infestans Populations Infecting Potato Crops in Pskov Region, North-West Russia. Journal of Fungi. 2022; 8(5):472. https://doi.org/10.3390/jof8050472
Chicago/Turabian StyleRunno-Paurson, Eve, Collins A. Agho, Nadezda Zoteyeva, Mati Koppel, Merili Hansen, Tiit Hallikma, David E. L. Cooke, Helina Nassar, and Ülo Niinemets. 2022. "Highly Diverse Phytophthora infestans Populations Infecting Potato Crops in Pskov Region, North-West Russia" Journal of Fungi 8, no. 5: 472. https://doi.org/10.3390/jof8050472
APA StyleRunno-Paurson, E., Agho, C. A., Zoteyeva, N., Koppel, M., Hansen, M., Hallikma, T., Cooke, D. E. L., Nassar, H., & Niinemets, Ü. (2022). Highly Diverse Phytophthora infestans Populations Infecting Potato Crops in Pskov Region, North-West Russia. Journal of Fungi, 8(5), 472. https://doi.org/10.3390/jof8050472