1. Introduction
The number of vehicles travelling on the roads in a city varies over time, and the resulting traffic pattern is actually an important factor that logistics companies, such as those providing courier services, need to consider when planning routes for their vehicles. Generally, a courier company owns multiple outlets in a city for senders to submit their parcels. Then, the vehicles of the company have to travel to all the outlets to collect these parcels, send them for sorting, and deliver them to the respective recipients. The travelling routes of the vehicles between the outlets and the sorting center can be formulated as a Vehicle Routing Problem (VRP).
In order to improve the efficiency of parcel collection and delivery services, the courier company needs accurate traffic data in order to plan the routes of the vehicles; however, most of the existing algorithms solve the VRP by assuming that the travelling durations between locations are time invariant, and thus, they normally use only a set of travel input data to plan the vehicles’ routes all of the time. This may not be realistic because the traffic pattern in a city is variable depending on the period of the day, and this causes the travelling duration between two specific locations to change from time to time. In other words, the travel time from a location to another location is actually time dependent. Neglecting the time dependency can introduce significant errors to route planning.
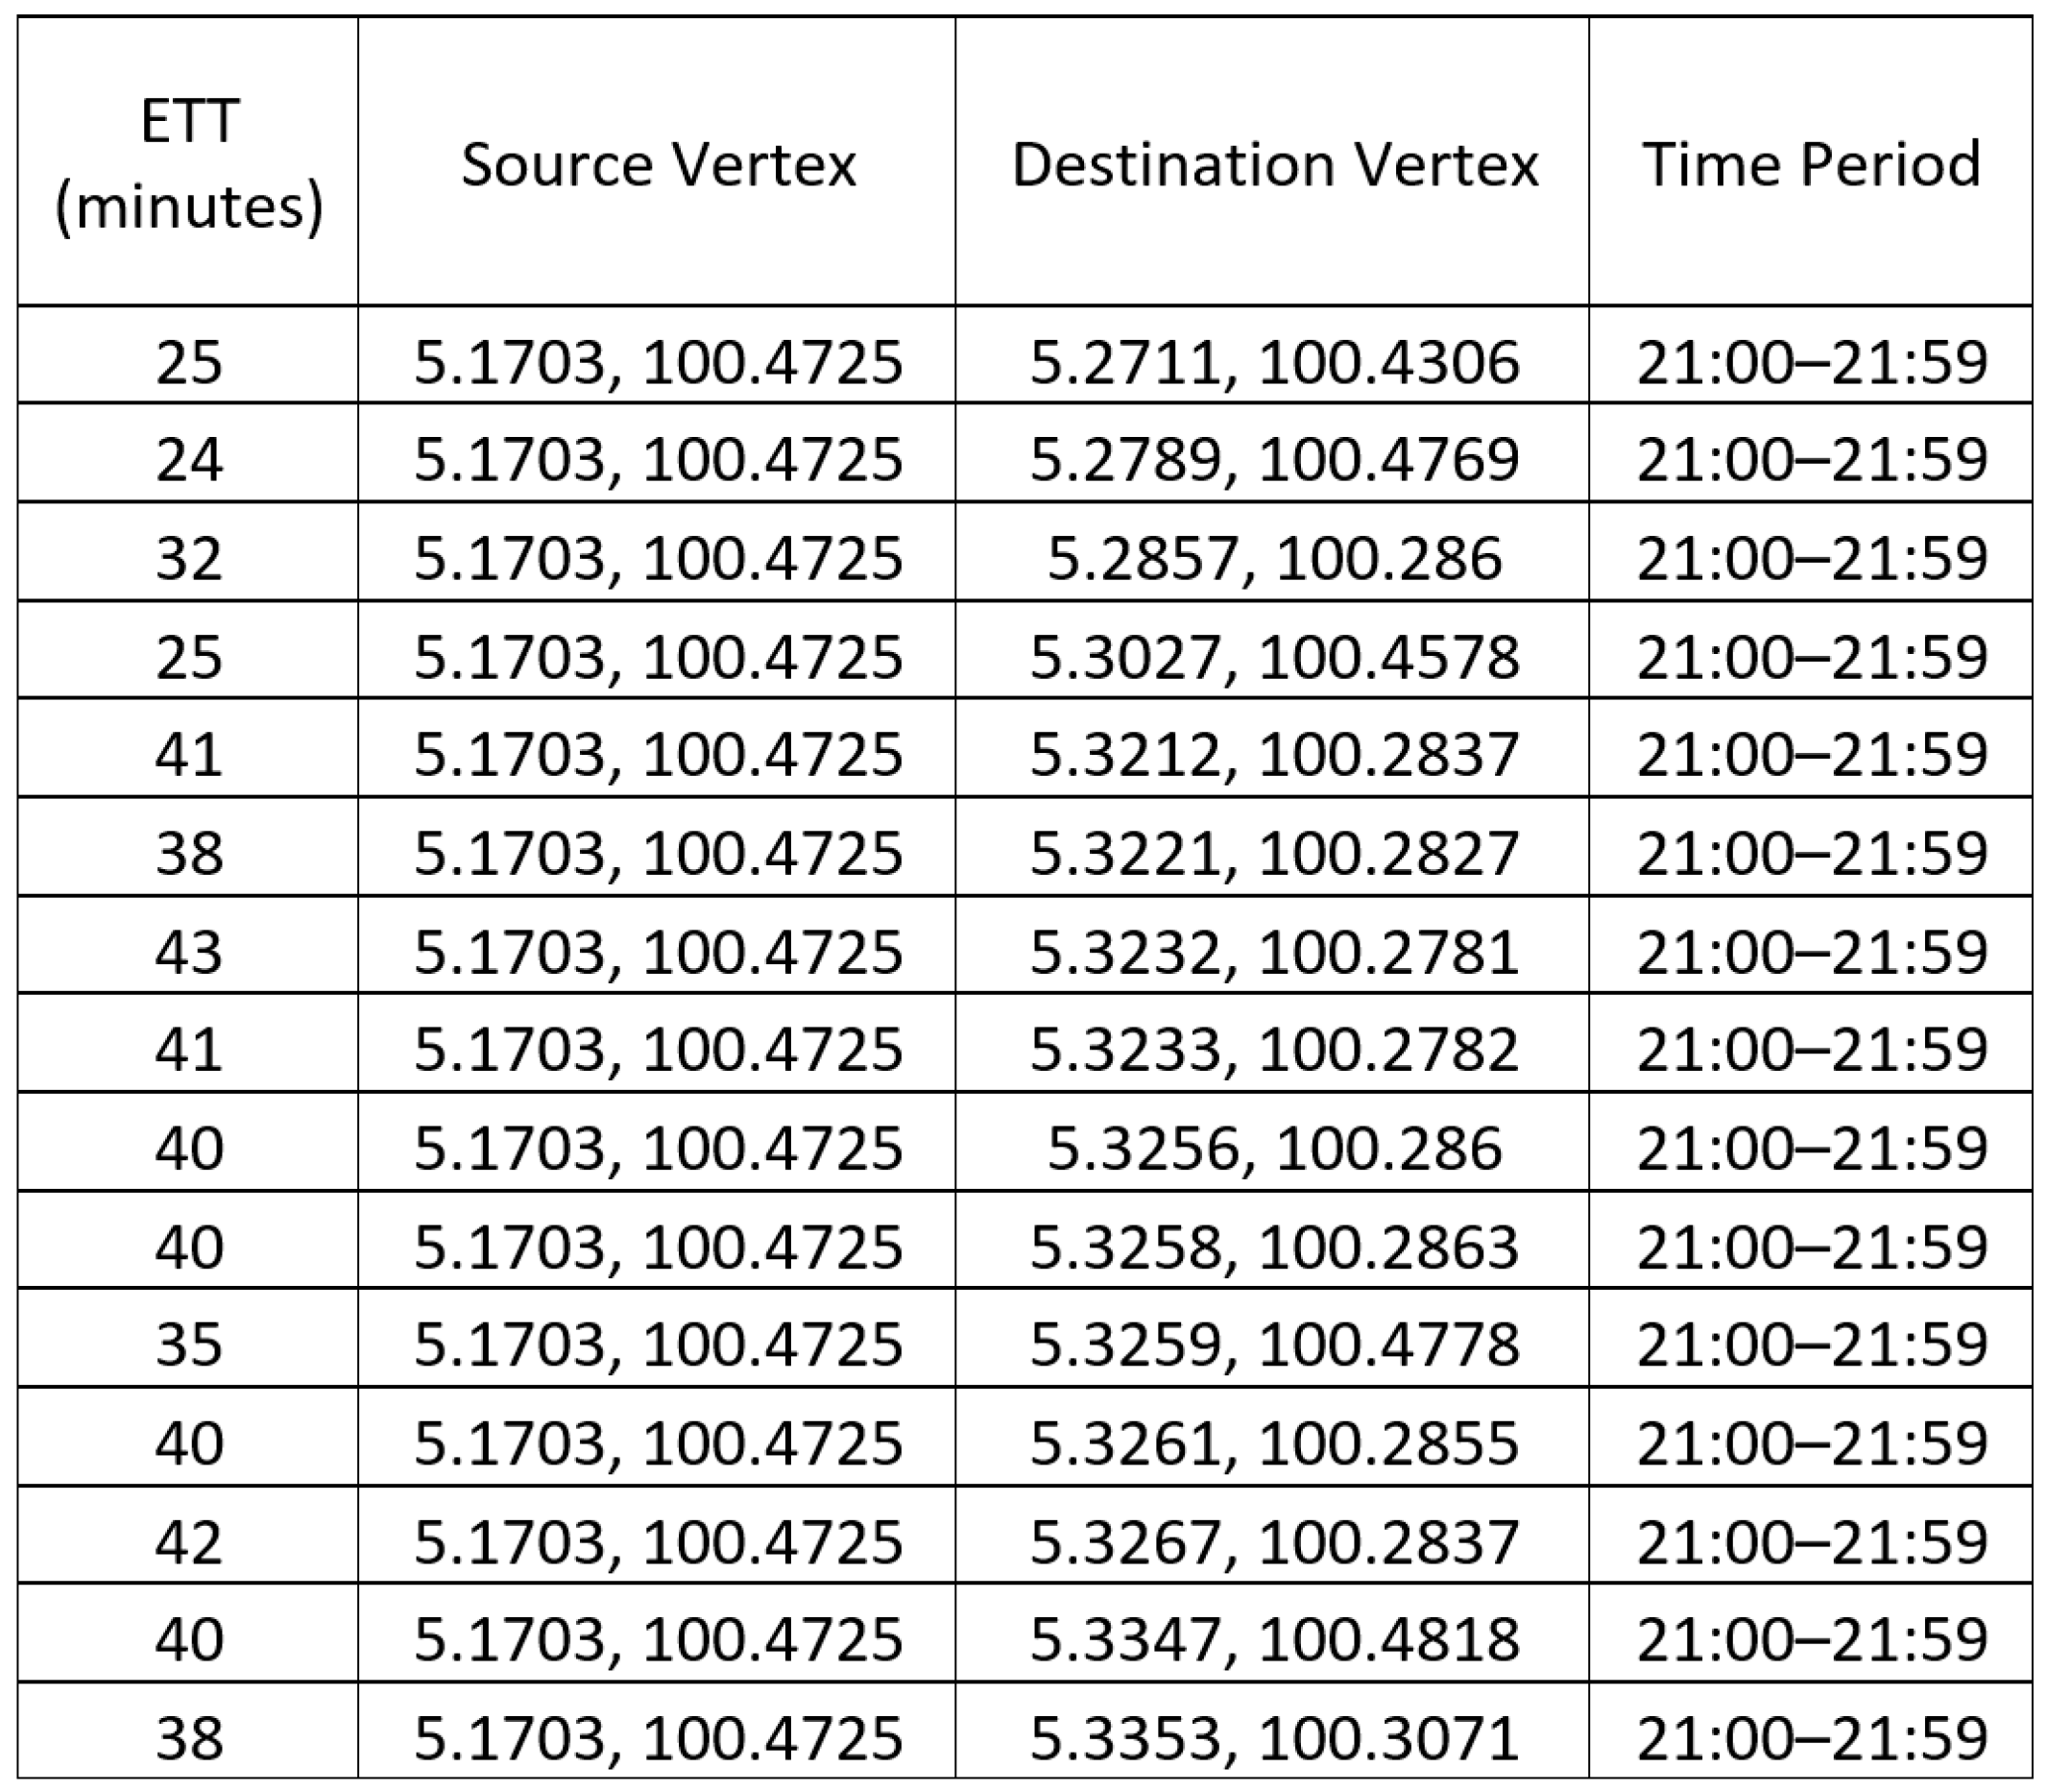
One solution to tackle the problem is to use different sets of estimated travel times (ETTs) for route planning in different time periods. Collectively, these different sets of ETTs are called the time-dependent estimated travel times (TD-ETTs). The TD-ETT is a four-dimensional data set, and each entry includes (1) the estimated travel time from (2) a source vertex to (3) a destination vertex in (4) a particular time period as shown in
Figure 1, where the vertices represent the geographical locations denoted by their respective longitude-latitude coordinates in the region.
Such TD-ETT data can actually be bought from the web-mapping companies; however, depending on the number of outlets and the sets of ETT data required, the acquisition of a full set of TD-ETT data is normally very expensive and not affordable to most courier companies.
Other than paying for web-mapping data, the courier company can also install the Global Positioning System (GPS) in their fleet of vehicles and subscribe the relevant services from a GPS service provider [
1]. This enables the courier company to keep track of the travel times spent by the vehicles to travel between their outlets accurately; however, it is impossible for the fleet of vehicles to collect all TD-ETT data between outlets because the size of the fleet is limited and thus not all sets of traveling paths in different time periods can be covered.
Another possible solution is that the courier company can capture the past traffic data, so that it can learn and analyze the past data in order to estimate the future travel times between outlets accurately. With the estimation, the routes for vehicles can be properly planned even before they depart. For this approach, however, sufficient data must be collected first so that they can be pre-processed, cleaned, and analyzed in order to produce accurate TD-ETT values for the route optimization process.
In this research, we study a low-cost and robust framework that is able to scrape, process, clean, and analyze the TD-ETT data for a set of pre-determined outlet locations in a city. The proposed framework is at a low cost because the data collection is done through scraping the data from the free web-mapping services; it is also robust because the data maintenance strategy is derived from the processing and analysis of the scraped data.
In general, the points of interest in a geographical region can be represented by a set of vertices,
V, in a directed graph,
G. The arc from vertex
i to vertex
j exists if, and only if, there is a possible route from point
i to point
j in the real map. In a city with a good road network, the representing graph
G should be a fully connected directed graph because there must be at least a route from any point of interest to another. Note that the route from
i to
j may not be the same as the route from
j to
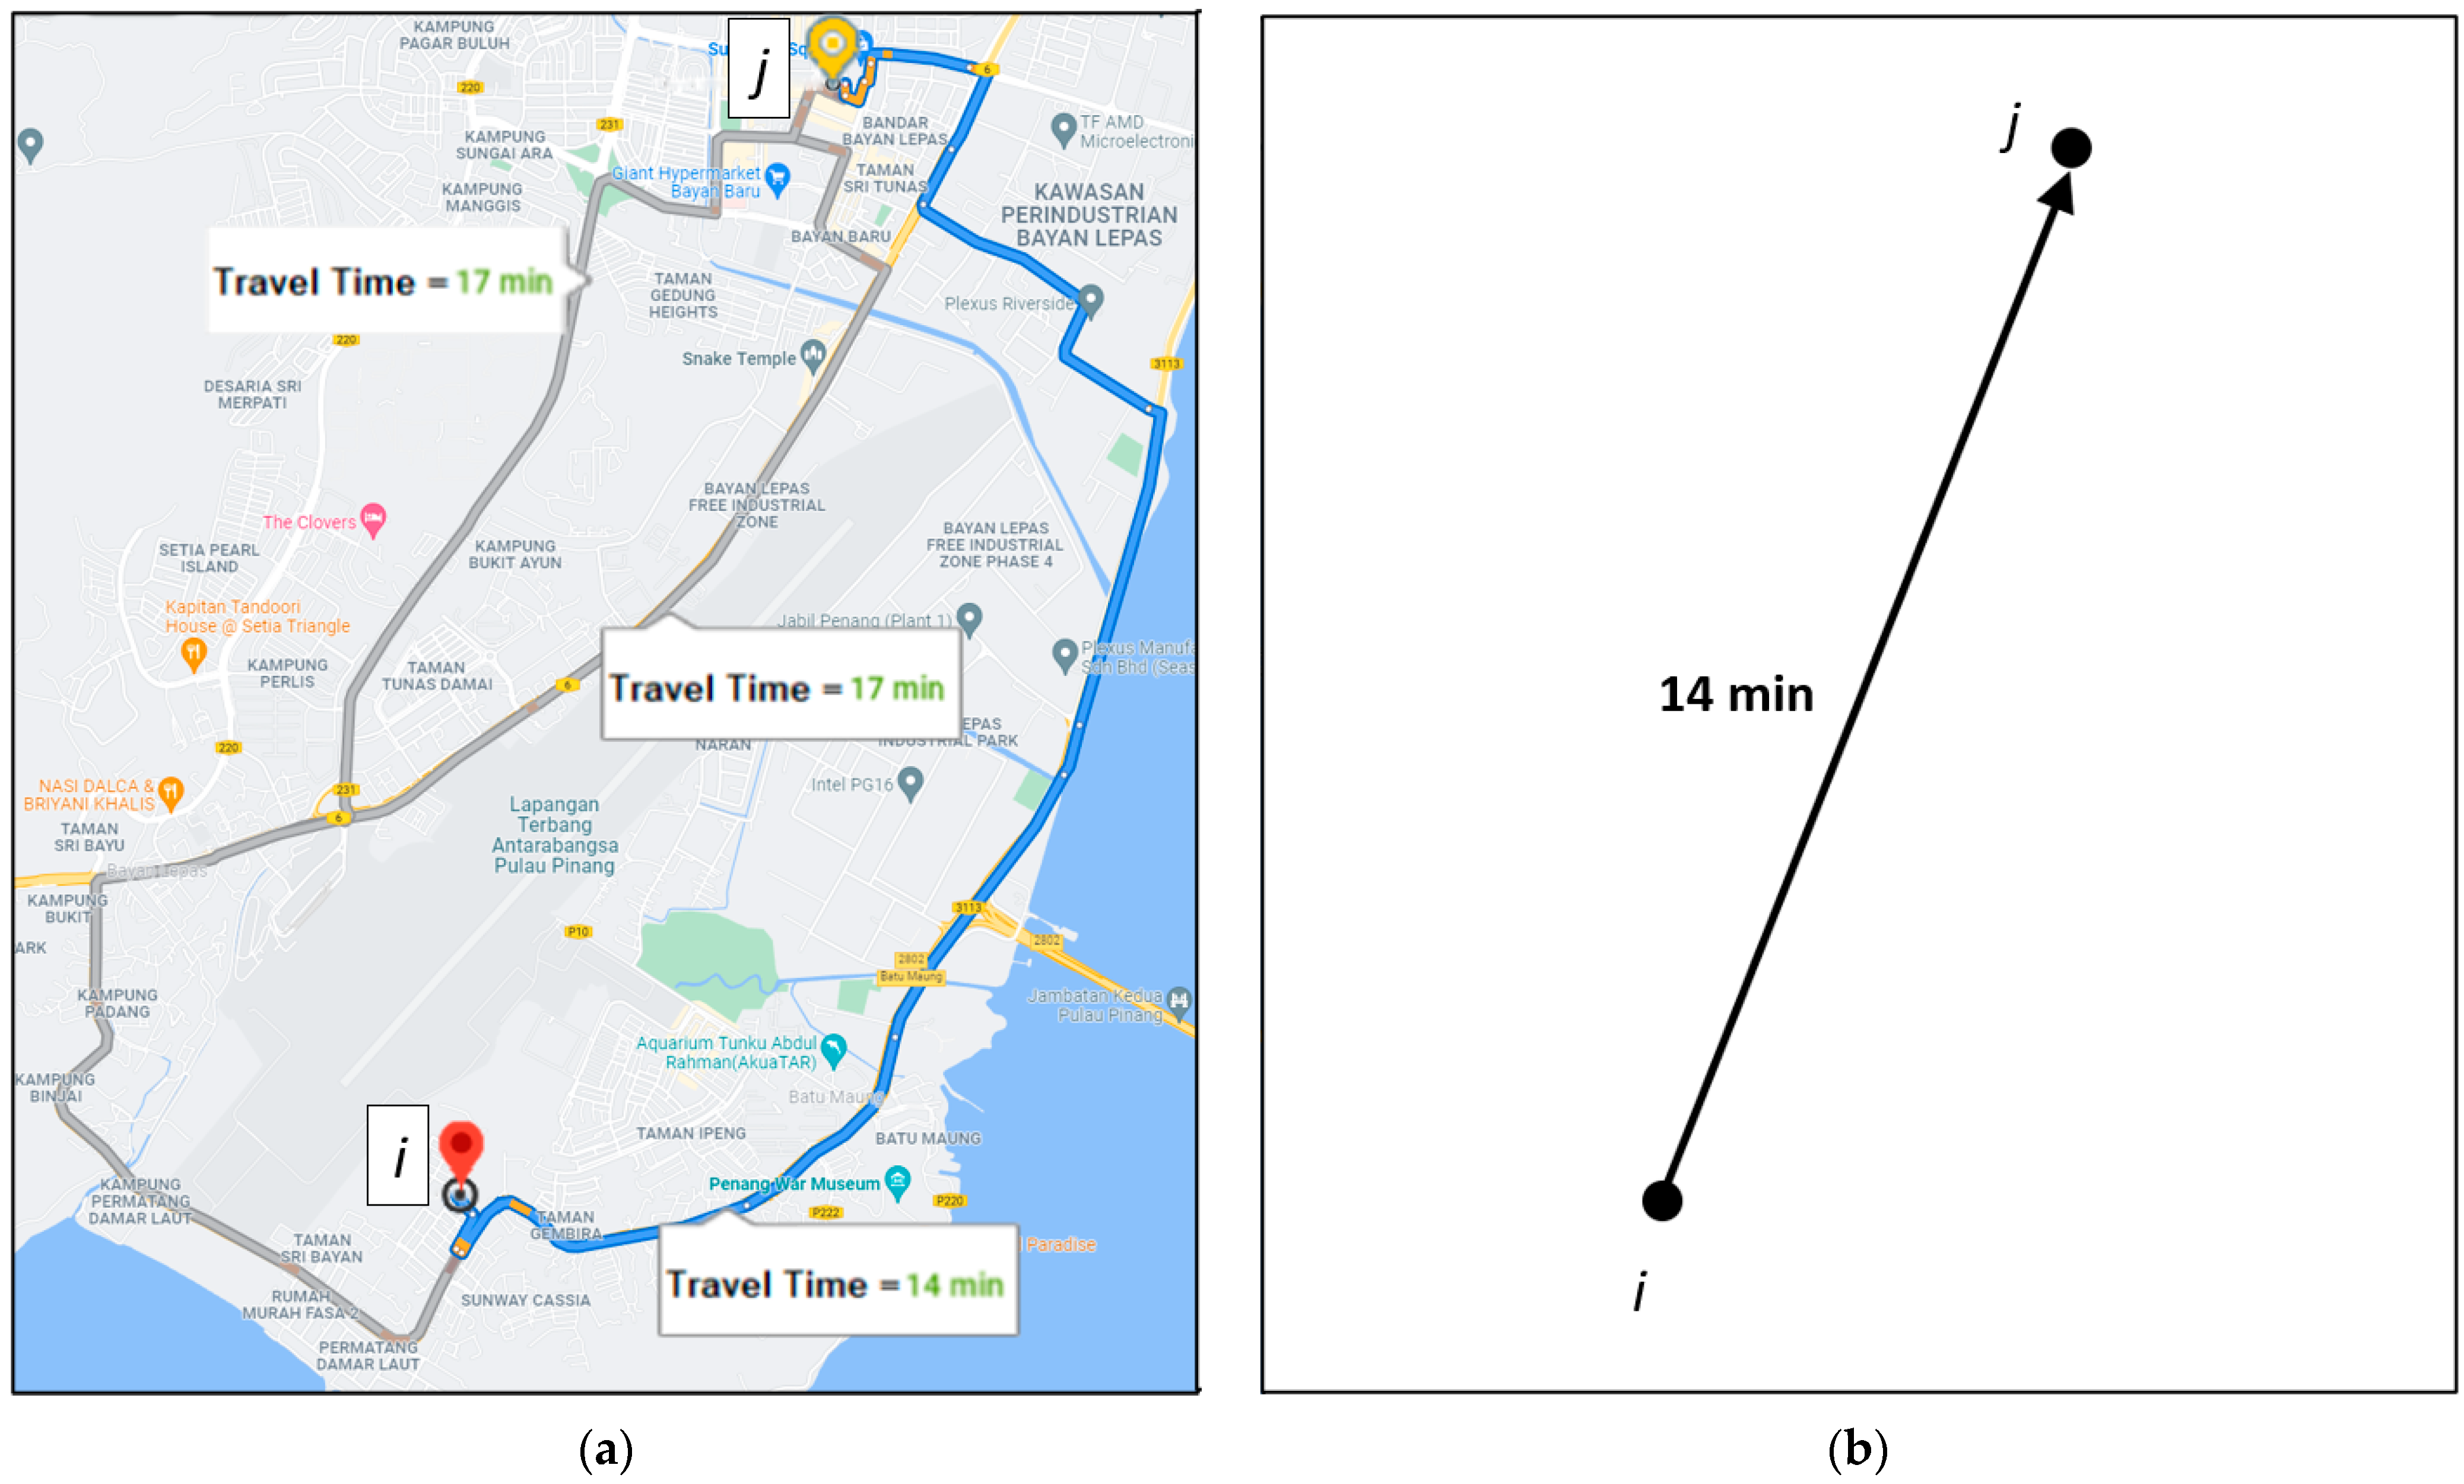
i, depending on the real road condition in the geographical region. For a particular time period, we can further label each arc in
G with the ETT of the best route as the weight of the arc. An example of traveling from one point to another on a geographical map and its representation in a directed graph is shown in
Figure 2.
Through our experiment, we found that the ETT data provided by the web-mapping company may not be always optimum, regardless of whether the data are paid or free of charge. It is because the ETT data returned from the web-mapping services are highly dependent on the route selections of the backend routing algorithm. Owing to the limitation of the backend routing algorithm, not only that the selected routes may be non-optimum, but there can also be illogicality among some routes. For instance, the ETT from vertex i to vertex j is larger than the sum of the ETTs from vertex i to vertex k and then from vertex k to vertex j, which violates the triangle inequality principle. Such illogicality is actually not uncommon with the ETTs obtained from the web-mapping services. If we directly use the ETTs returned from the web-mapping services as the weights of the arcs, then the existence of the illogicalities will affect the effectiveness and correctness of the route planning algorithms.
Therefore, a data pre-processing phase is also introduced in our framework to identify and patch the arcs with illogical scraped ETT values in order to improve the correctness of the data. Such a pre-processing phase is also important to the subsequent data scraping process because the arcs that consistently contain illogical scraped ETT values can be removed from being scraped in the future cycle, because even in the absence of the scraped data, the weights can just be patched by alternative routes with better combined ETTs. In doing so, time required to scrape ETT data in a cycle can also be reduced, and thus more cycles can be completed in a given time in order to increase the time-dependent fineness of the data.
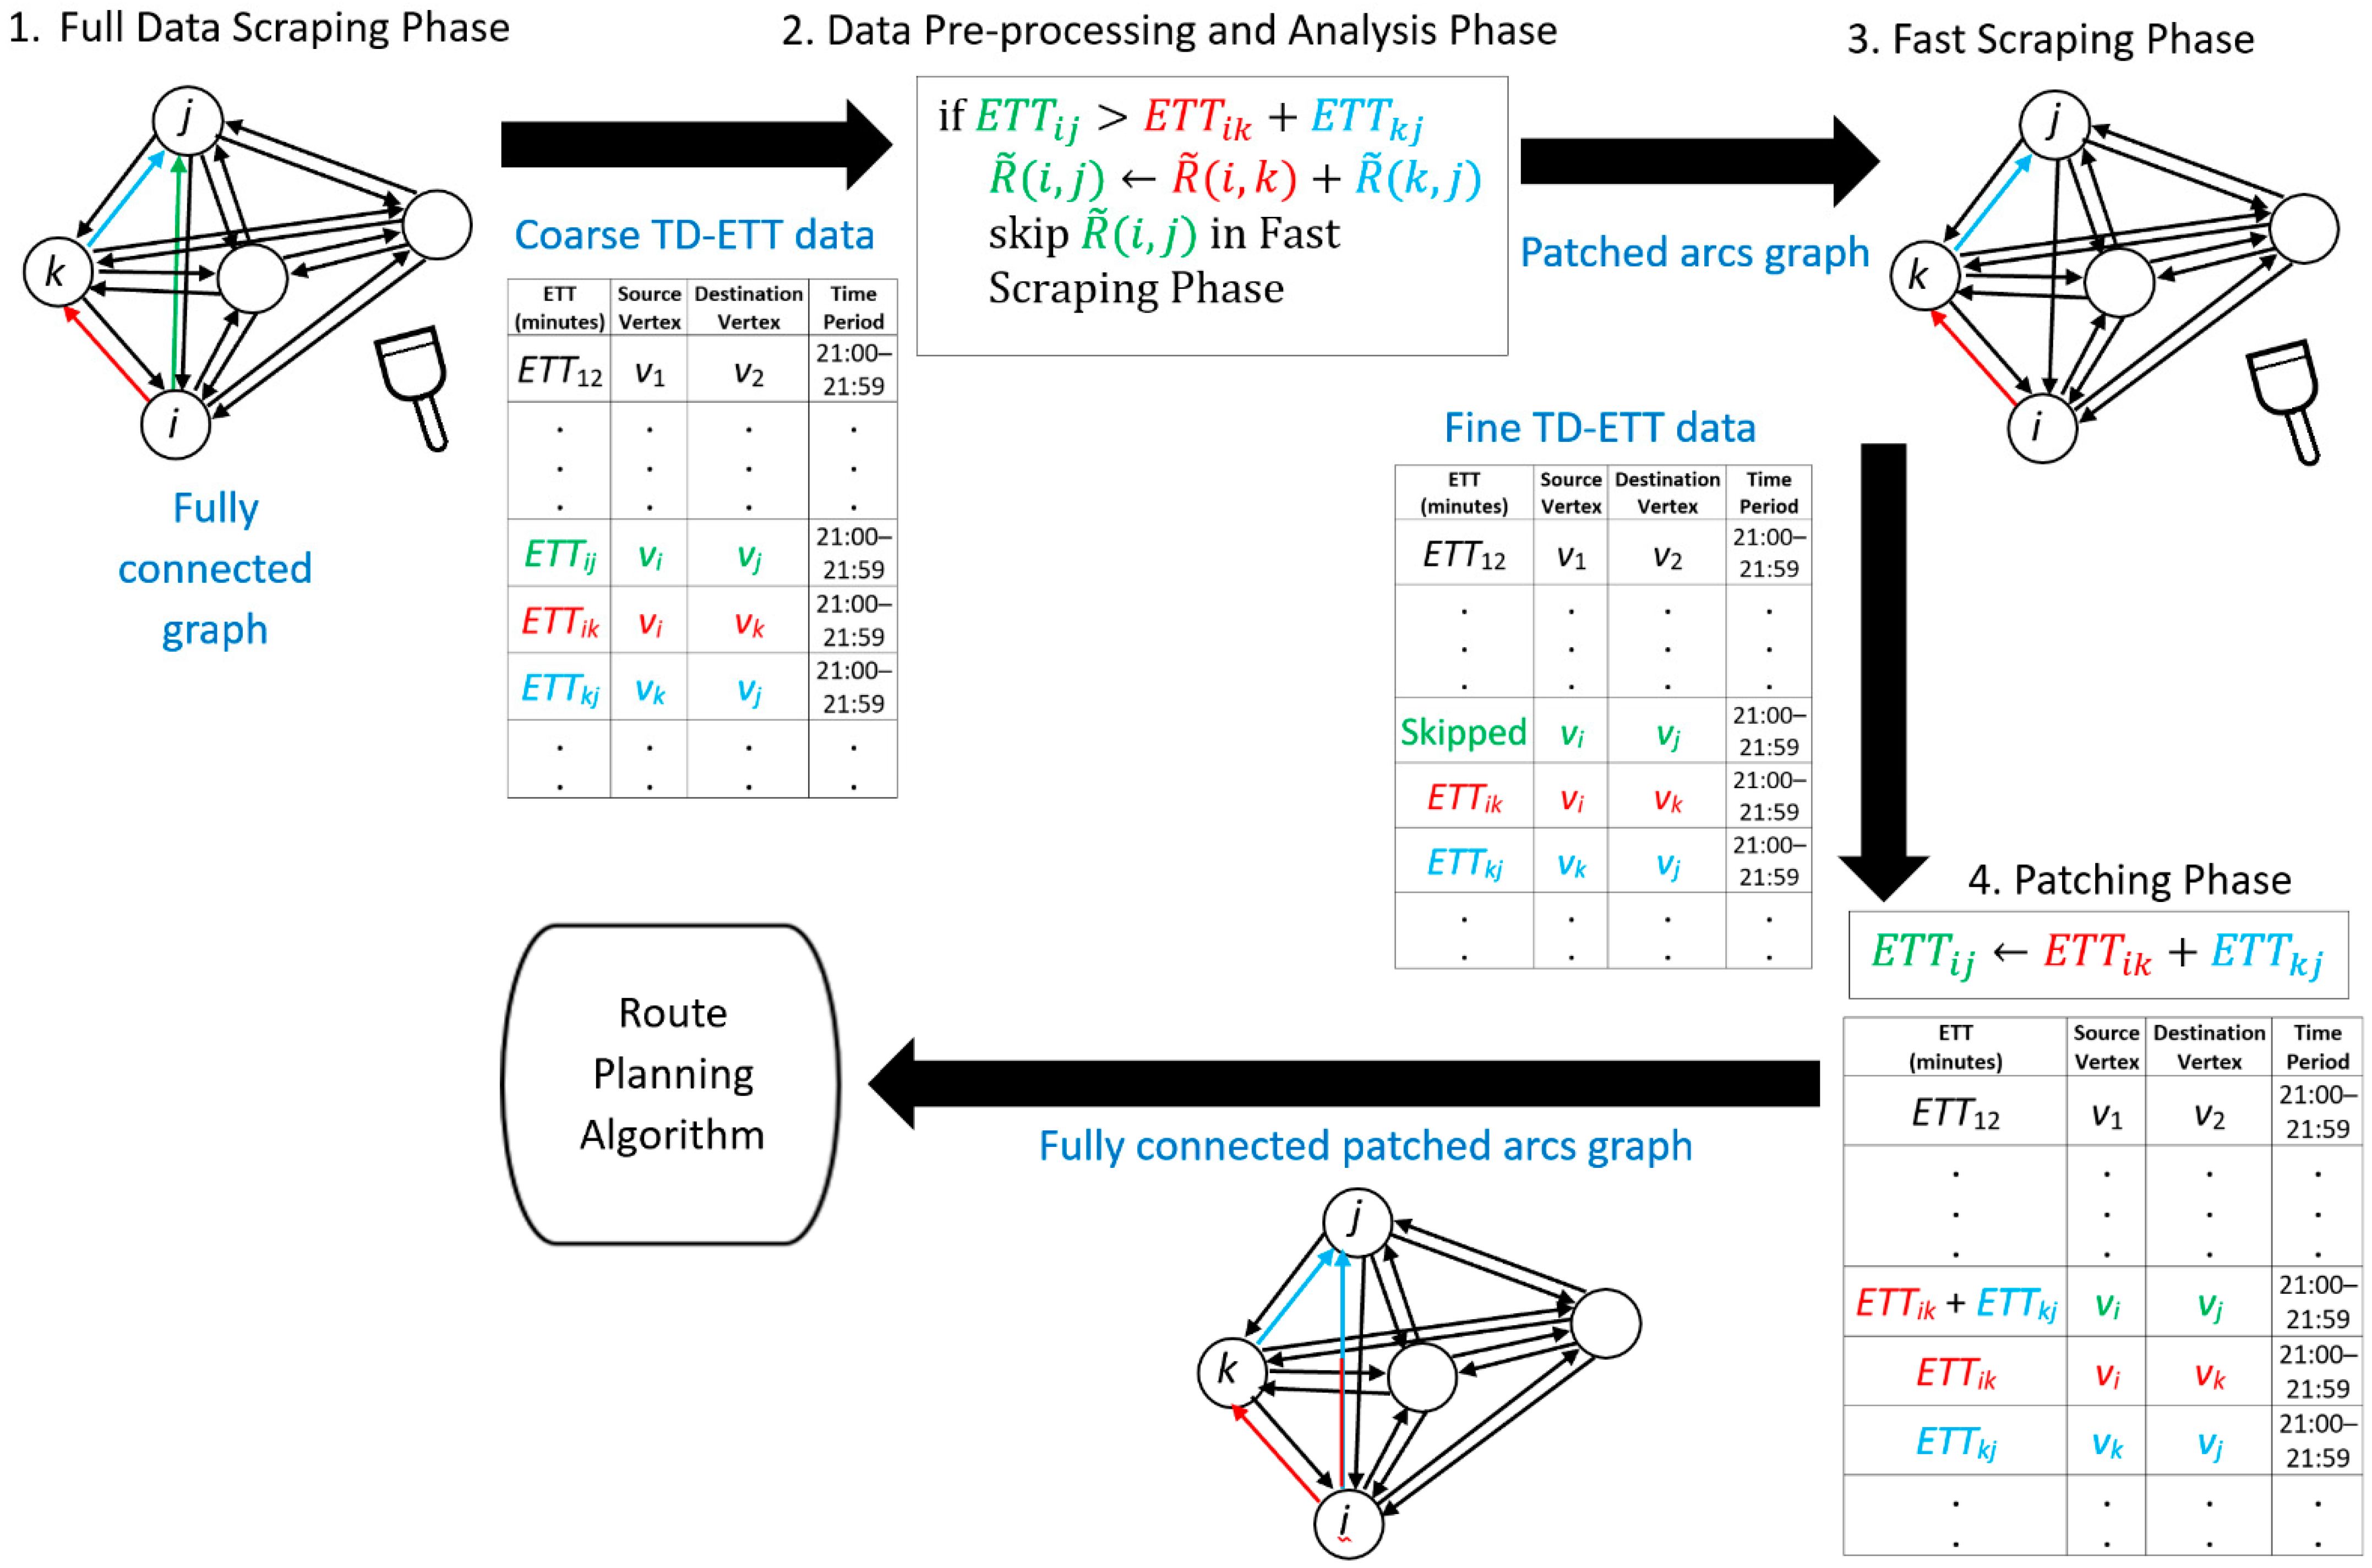
To achieve the abovementioned goal, our proposed approach can be divided into four phases, namely, (i) Full Data Scraping, (ii) Data Pre-Processing and Analysis, (iii) Fast Data Scraping, and (iv) Data Patching and Maintenance. Their objectives are described as follows.
In the (i) Full Data Scraping phase, the full set of ETTs in a particular time period will be scraped. It should be noted that since the entire set of ETTs need to be scraped, the interval of the scraping cycle is rather long, and thus the number of cycles is limited. This phase will continue for weeks in order to collect enough ETT data.
In the (ii) Data Pre-Processing and Analysis phase, the illogical ETT values will be identified by applying the inequality principle shown in Theorem 1 in
Section 3. If for a particular arc, the illogicality happens frequently up to a certain threshold, the corresponding ETT value can then be safely replaced by the alternative shorter ETT by taking another route with a transit point. Such a relationship will also be learned in this phase.
In the (iii) Fast Data Scraping phase, all the illogical arcs will be removed from the scraping process. This will shorten the scraping cycle and more cycles can be completed in a given time. As a result, the number of ETT data sets in a given time can be increased, and thus more accurate ETT data in the time period can be obtained. This process will continue until there is a need for another full data scraping.
Since the arcs with the consistently illogical scraped ETTs have been removed from the previous phase, the missing ETT values have to be patched before the entire set of TD-ETTs can be fed to the route planning algorithm; therefore, in the (iv) Data Patching and Maintenance phase, the first objective is to patch the missing ETT values with the relationships (equations) learned in phase (ii). Moreover, although we continue to use the reduced graph for data scraping in (iii), after a certain number of cycles, a new round of full data scraping needs to be executed again in order to verify and maintain the data.
The work presented in this paper is actually an extension of our previous work in [
2]. In our previous work, we only performed the first phase, (i) Full Data Scraping, and we partially performed the second phase in the proposed framework; however, the entire data cleaning process was not formulated in [
2] and the full cycle of the scraping process also takes a long time, which affects the fineness of the collected data.
The novelty of this paper lies in the following three aspects: (1) the overall concept of data cleaning for the practical implementation of VRP algorithms for route planning; (2) the analysis of the full set of TD-ETT data with the aim to reduce the amount of data to be subsequently scraped; (3) a framework that collects TD-ETT data with shortened cycles to get finer data, while maintaining the validity and accuracy of the data. This is done by introducing (ii) Data Pre-Processing and Analysis (full phase), the (iii) Fast Data Scraping phase and the (iv) Data Patching and Maintenance phase. We have also expanded our scope of research to study the relationship between the scraping efficiency and accuracy of data collection. We believe that the outcomes of this study could offer practical insights that could be useful to logistics industry.
In our experiment, we scraped, processed, cleaned, analyzed, and maintained the TD-ETT data across 68 outlets of a courier company in Penang, a state of Malaysia, for six months; we then fed the data produced by our approach to some VRP algorithms, such as the Traveling Salesman Problem algorithm, and found that the performance of our low-cost approach is comparable with that of using the full set of paid data.
The remainder of the paper is organized as follows.
Section 2 discusses the related works in the literature. In
Section 3, we elaborate the methodology of this research. Experiment setting, results and possible extended works will be presented in
Section 4. Finally, the conclusions are discussed in
Section 5.
3. Methodology
With reference to
Table 2, consider a geographical region,
G, with a set of points of interest,
V, which are connected by a set of arcs,
A. Assuming that the total number of points of interest is
, then we have the vertex set
V = {
v1,
v2, …,
vn} and arc set
A = {(
vi, vj)
|vi,
vj ∈
V,
vi ≠
vj}. Note that each arc (
vi,
vj) refers to a route in the real map; and we can further label the arc with a weight
, which represents the shortest travel time from
i to
j, as shown in the example in
Figure 2.
Definition 1. We defineas the route from i to j that is with the shortest travel time, and the shortest travel time is denoted by .
Note that it is not necessary for to equal ; on the other hand, by definition. With the above definition, we have the following theorem.
Theorem 1. For all, the following inequality must always be true Proof. We will prove this by contradiction as follows.
Assume that there exists
in such a way that their optimum routes
,
, and
have the shortest travel times,
,
, and
, respectively, that fulfil the following inequality
Consider another route
, which has a total travel time from
i to
j as
.
If (2) is true, then is smaller than , and route has a smaller travel time compared with , which contradicts the definition that is the route with the shortest travel time. Thus, Inequality (2) cannot be true, and therefore Inequality (1) must be true. □
The above theorem can actually be derived from the triangle inequality principle. That is, if the shortest-travelling-time route from i to j, , does not pass by another point k, then ; on the other hand, if passes by point k, then .
For a legitimate graph, all of the shortest travel time routes must fulfill Theorem 1; however, it is very difficult to acquire the correct value for . That is why data scraping needs to be performed in order to use the scraped ETT to substitute the value of . However, when the scraped ETT is used to substitute the value of , we observe that there are some routes which do not fulfil Theorem 1. These routes then need to be identified and their ETT values need to be rectified.
To ensure an optimal route can be found with a route planning algorithm in the time-dependent traffic condition, the framework starts at a selected time by scraping the ETT of every arc. Note that in a fully connected directed graph, the number of arcs is given by:
where
a is the number of arcs whereas
n the number of vertices.
As mentioned in the previous section, there are multiple ways of data collection to find out the ETT of each arc. One of them is to buy the data from the web-mapping company; however, such approach is monetarily expensive; therefore, in this project, the TD-ETTs of all arcs are collected using a web scraper continuously for weeks. Then, the scraped data will be pre-processed to identify the illogical arcs and record their alternative routes that consists of shorter ETTs between two vertices in that time period.
To remove the illogicality and redundancy of the directed graph, there are four phases of the framework that need to be carried out as shown in
Figure 4. These phases are demonstrated and discussed with a case study in the following subsections.
3.1. Full Data Scraping Phase
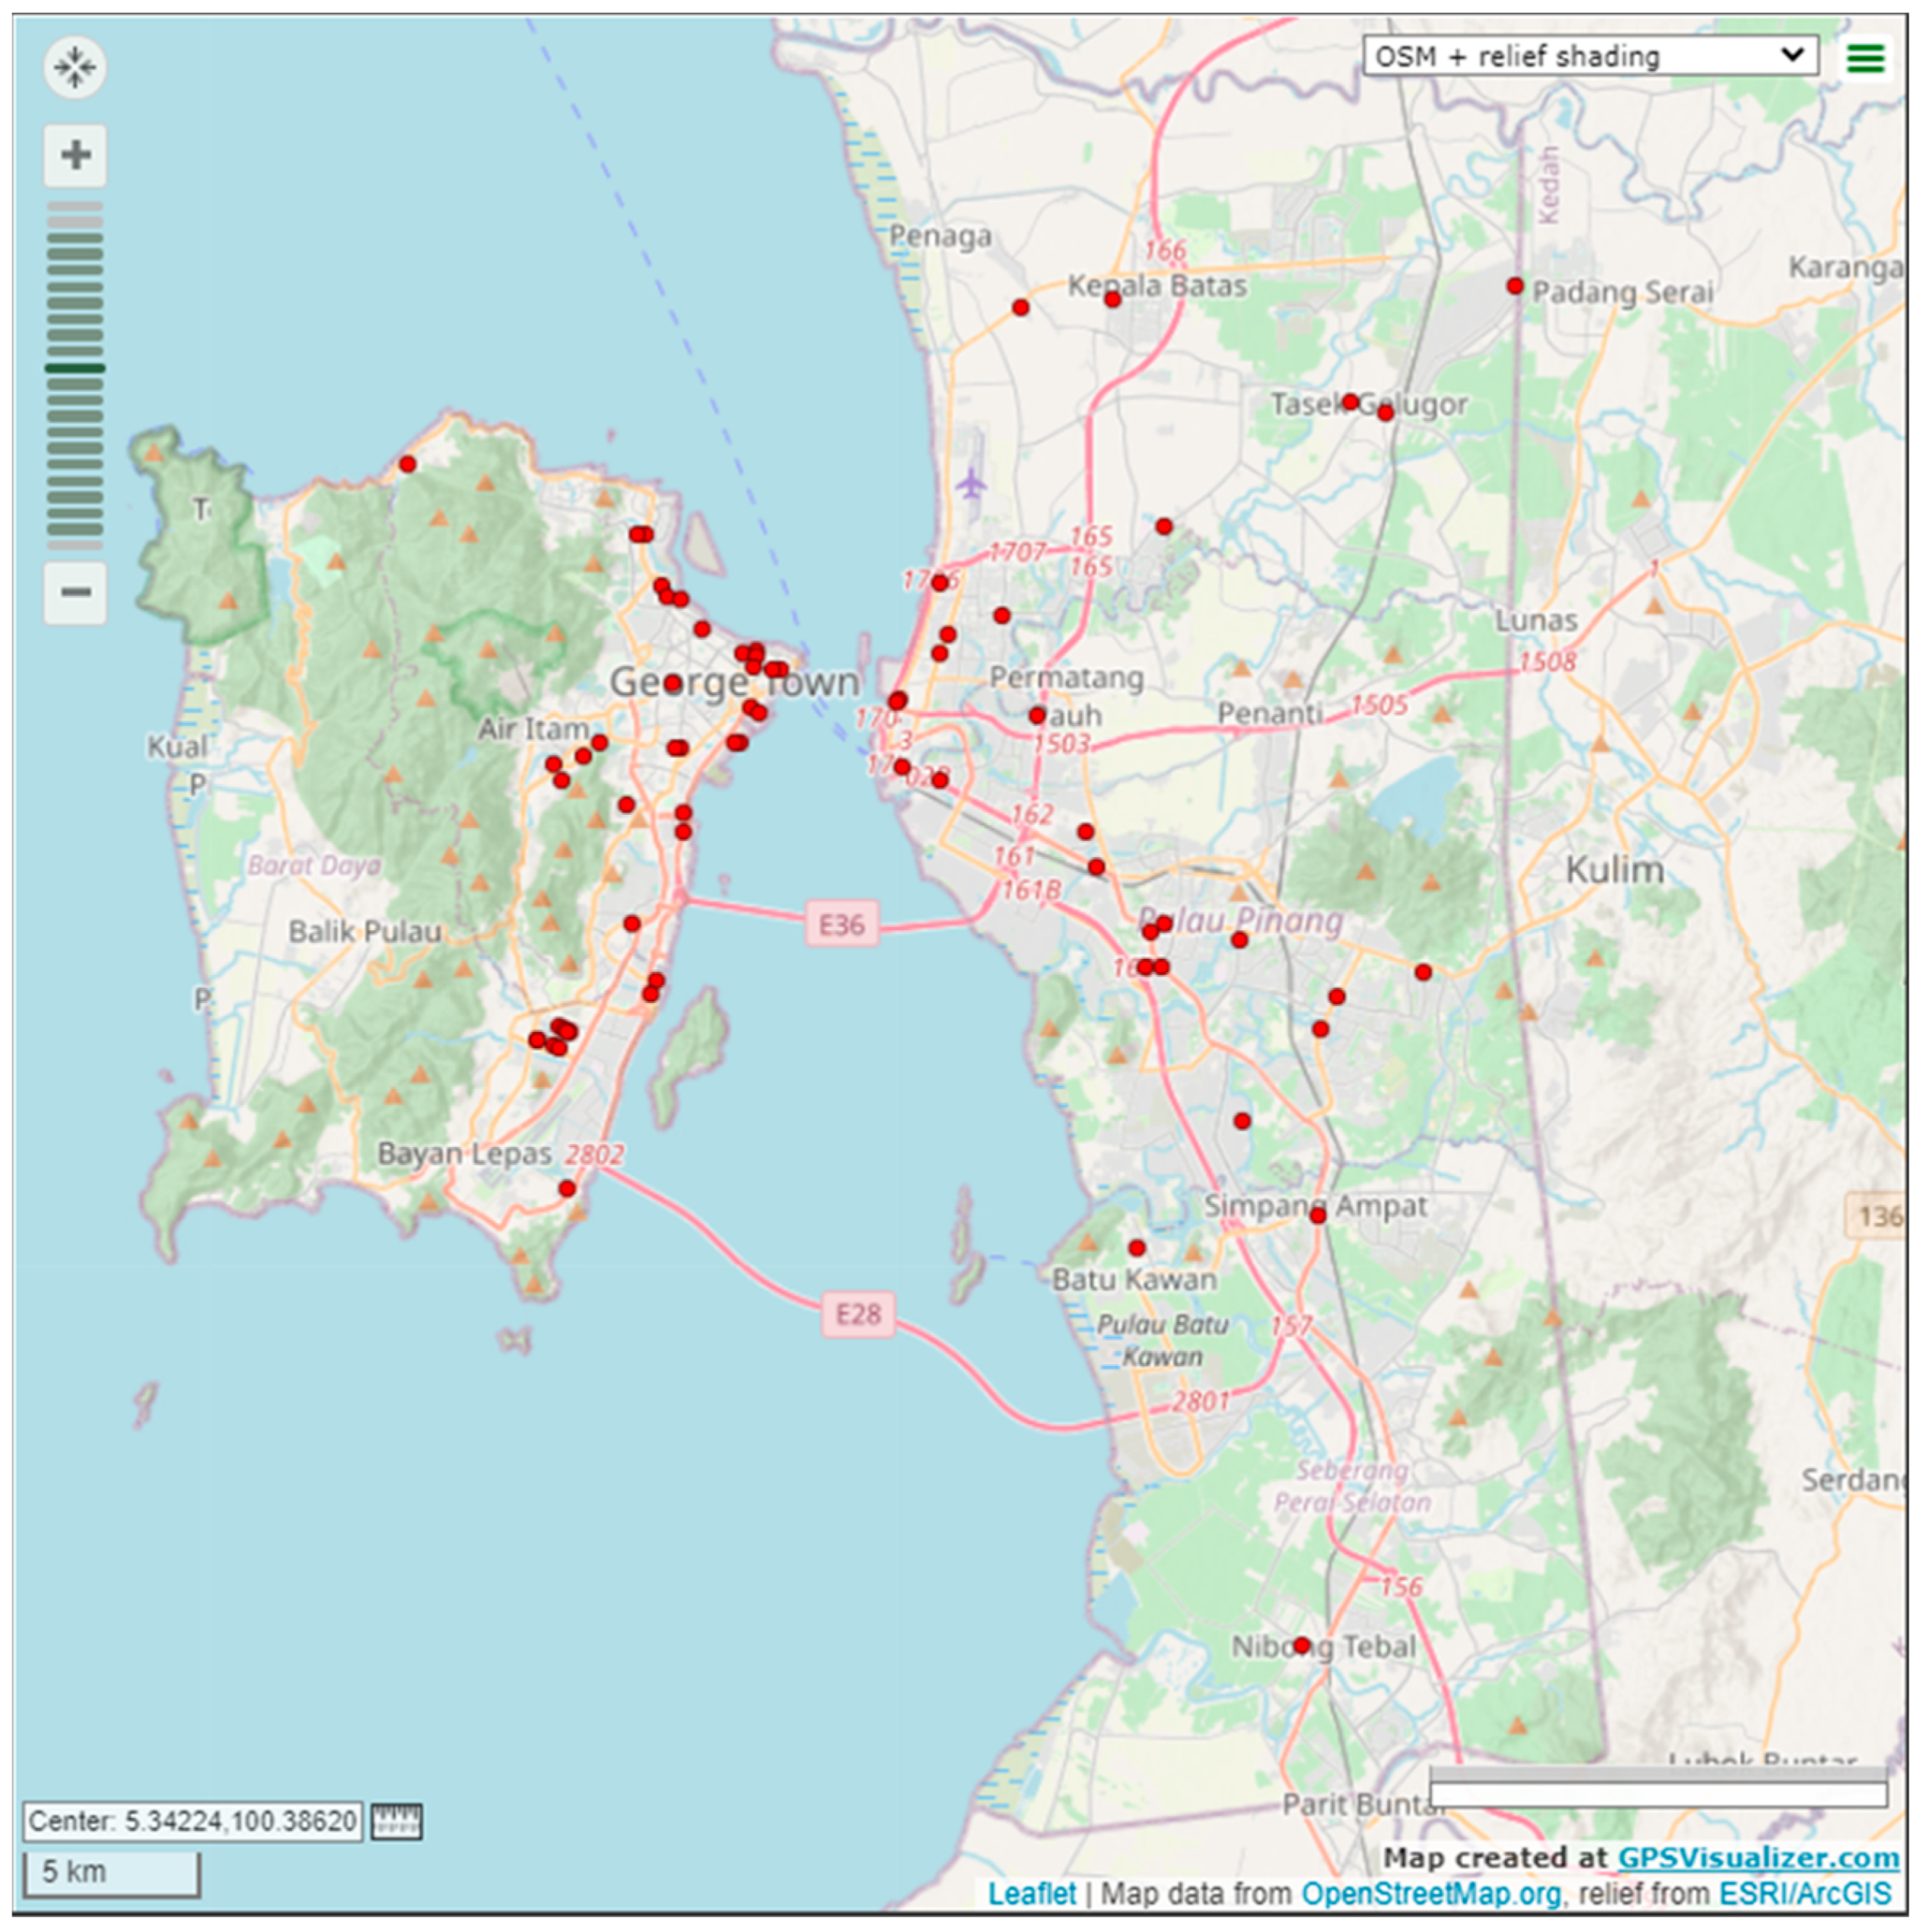
In this research, 68 vertices, each representing a logistic company outlet is considered, as shown at
Figure 5.
It consists of 4556 arcs that construct a fully connected arcs graph. For the Full Data Scraping phase, all possible ETTs are collected continuously using the developed web scraper on web mapping websites. The objective of this phase is to collect complete initial data for analysis. All possible ETTs have to be scraped in order to provide every possible route to route planning algorithms for finding the optimal route; however, the time needed to complete an iteration of scraping is fairly long. Based on the results from 765 iterations of collected data, an average of 54.87 min is needed to complete an iteration of scraping a fully connected arc graph. Thus, fully scraping is not suitable for collecting data which requires a finer iteration in terms of time setting. This phase will last for weeks to collect as many iterations of data as possible, and these data will be fed into the next phase for preprocessing and analysis.
3.2. Data Pre-Processing and Analysis Phase
After scraping the full set of ETTs over different time periods for weeks, in the Data Pre-processing and Analysis Phase, the illogicality of the scraped ETT data in each time period will be detected and the alternative paths that consists of the combination of arcs with a shorter total ETT will be identified. The objective of this phase is two-fold. Firstly, the identified arcs with consistently illogical ETTs in each time period will be removed in the Fast Data Scraping phase so that the system can perform an iteration of scraping much faster in order to get a finer time-dependent data; secondly, arc-patching graphs can also be constructed in each time period so that the missing ETTs of the removed arcs can be patched with the ETTs of their respective alternative paths later.
During the examination on the scraped data, we found that the web mapping websites will not always provide the shortest arc between two vertices in a single iteration of scraped data because it does not fulfil Theorem 1. Thus, these illogical arcs need to be detected and their ETT values need to be rectified.
Algorithm 1 briefly outlines the pseudocode for detecting and patching illogical arcs.
In order to detect the illogicality, all scraped data are divided into different time periods, where each period has a duration of an hour. For the scraped data in a particular time period, they will be further split into a training set and a testing set.
In our approach, 85% of hourly data are categorized into the training set. Within this training set, if more than 70% of the data show that an arc consistently violates the inequality principle given in Theorem 1, then we will classify the scraped data of this arc as invalid, and thus the data needs to be removed and be patched later. Furthermore, the ETT of this arc will not be scraped in the future in order to shorten the scraping cycle; however, the unscraped ETT can still be patched with the alternative route that provides a shorter ETT route.
For the remaining 15% of the data, they are categorized as the testing set. The arcs that violated the inequality principle in Theorem 1 in the training set are patched with the corresponding alternative paths in the testing set, and they (the patched arcs), together with other unpatched arcs, form a full set of Partially-Patched ETT data. In order to verify the correctness and validity of the set of Partially-Patched ETT data, it needs to be benchmarked with the full set of original, unpatched data, which is called the Fully-Unpatched ETT data. The benchmarking is done through feeding both sets of data, respectively, to the TSP algorithm to find the optimal route by traversing around every vertex.
| Algorithm 1 Pseudocode for detecting and patching illogical arcs |
1.
2.
3.
4. do
5. do
6. do
7.
8.
9.
10. end for
11. end for
12. end for |
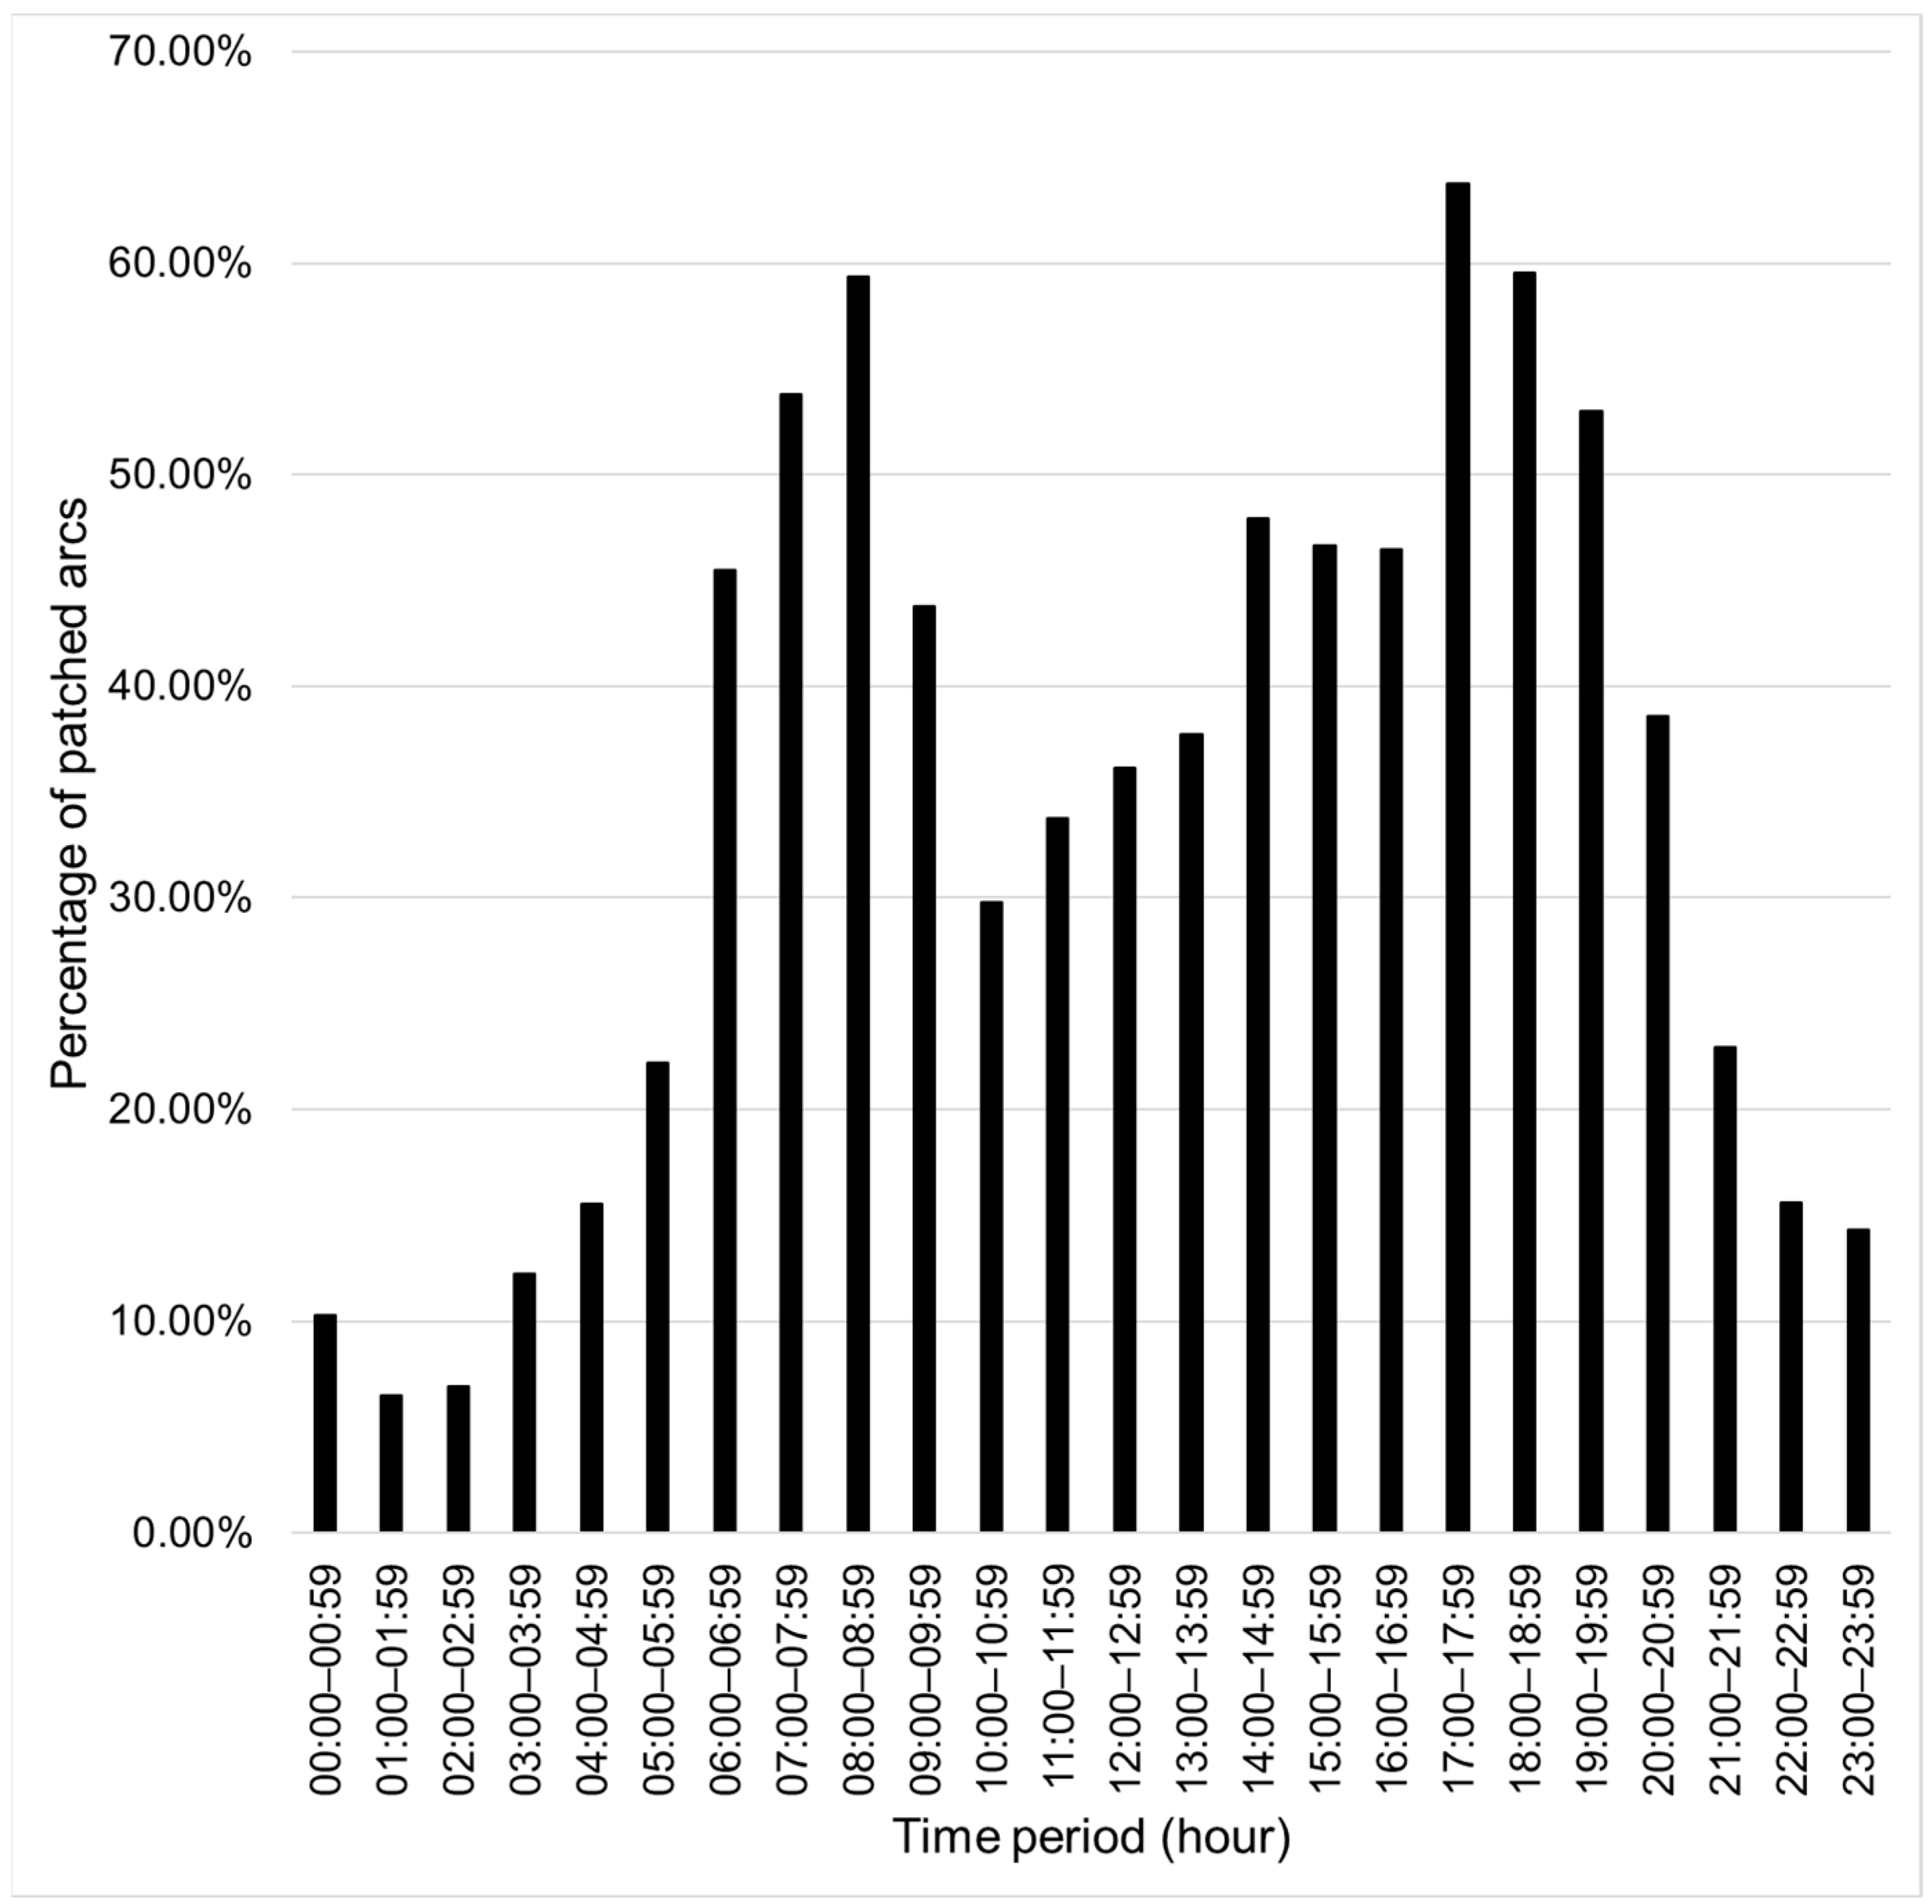
Based on the training data, an average of 34.26% (with a maximum of 63.78% and minimum of 6.50%) of arcs can be patched with shorter alternative routes in different periods from 00:00 to 23:59. The percentage of patched arcs of each hourly period is shown in
Figure 6.
To verify the validity of the graph with patched arcs, the Simulated Annealing (SA) algorithm is used for benchmarking by solving the TSP with the derived Partially-Patched graph and the original Fully-Unpatched graph, respectively.
Initially, for each time period, T (say 12:00–12:59) on each day (say a specific Monday), the ETT data of the Partially-Patched graph are fed into the SA algorithm 10 times, and only the best resulted route (with shortest TSP travel time) among the iterations is stored.
This step will be done for the same time period, T (i.e., 12:00–12:59), over different days (say all weekdays with the scraped data), and then the average TSP travel time in this time period over all weekdays by using the relevant Partially-Patched graphs will be calculated, which is denoted by CP(T).
The similar process can be applied to the Fully-Unpatched graphs in the same time period, T (i.e., 12:00–12:59) over different days (i.e., all weekdays with the scraped data), and then the average TSP travel time by using the Fully-Unpatched graphs can also be calculated, which is denoted by Co(T).
Note that by comparing
CP(
T) against
Co(
T), we will be able to compare the results of the Partially-Patched graphs against that of the Fully-Unpatched graphs. Let the percentage of TSP travel time reduction be calculated as (4).
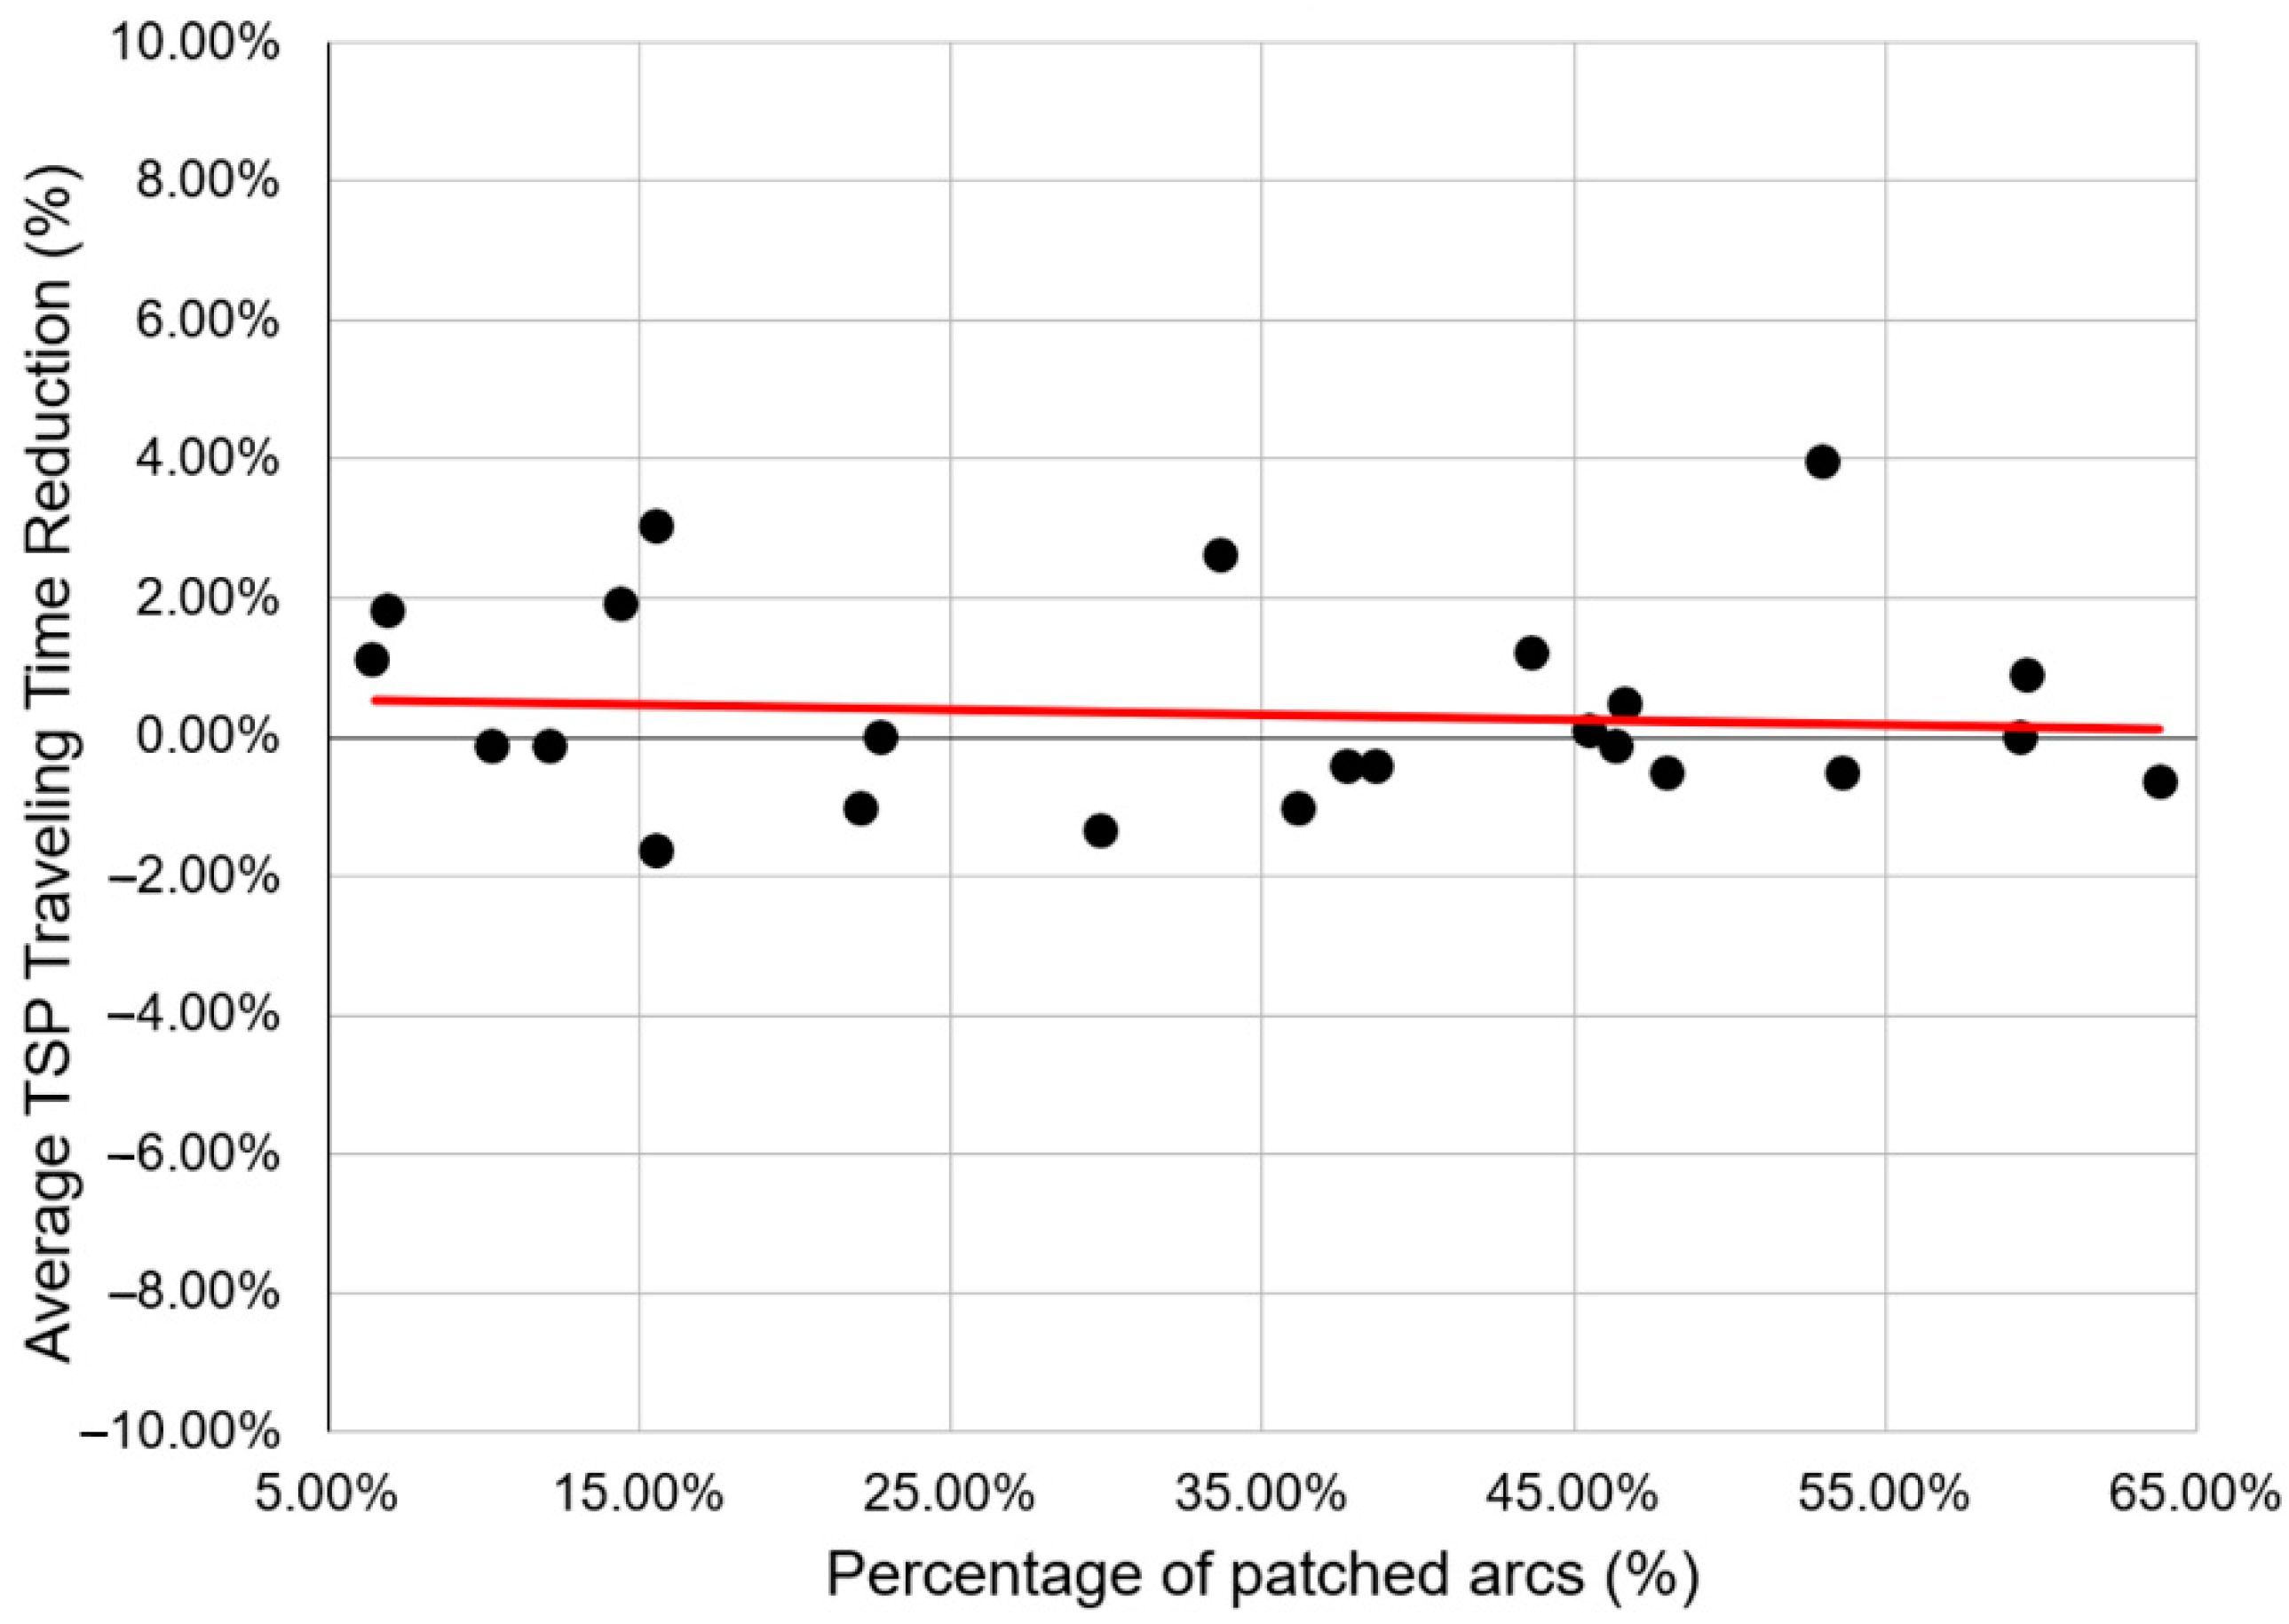
The percentage of TSP travel time reduction obtained from our experiment is plotted in
Figure 7.
Figure 7 shows the percentage difference between the routing results generated with the Partially-Patched ETT data and the corresponding Fully-Unpatched ETT data. It can be noted that the difference is insignificant, that is, it is only in the range of −2% to 4%. The linear regression shows that majority of the patched graph data has positive difference. This also proves that the Partially-Patched graph is more likely to provide a shorter route than the original Fully-Unpatched graph, showing that the latter can actually be replaced by the former; therefore, arcs that violate the inequality principle of Theorem 1 can be skipped from web scraping in the future as there are alternative routes to patch them. This also improves the efficiency of web scraping as an average of 34.26% of arcs can be skipped from scraping.
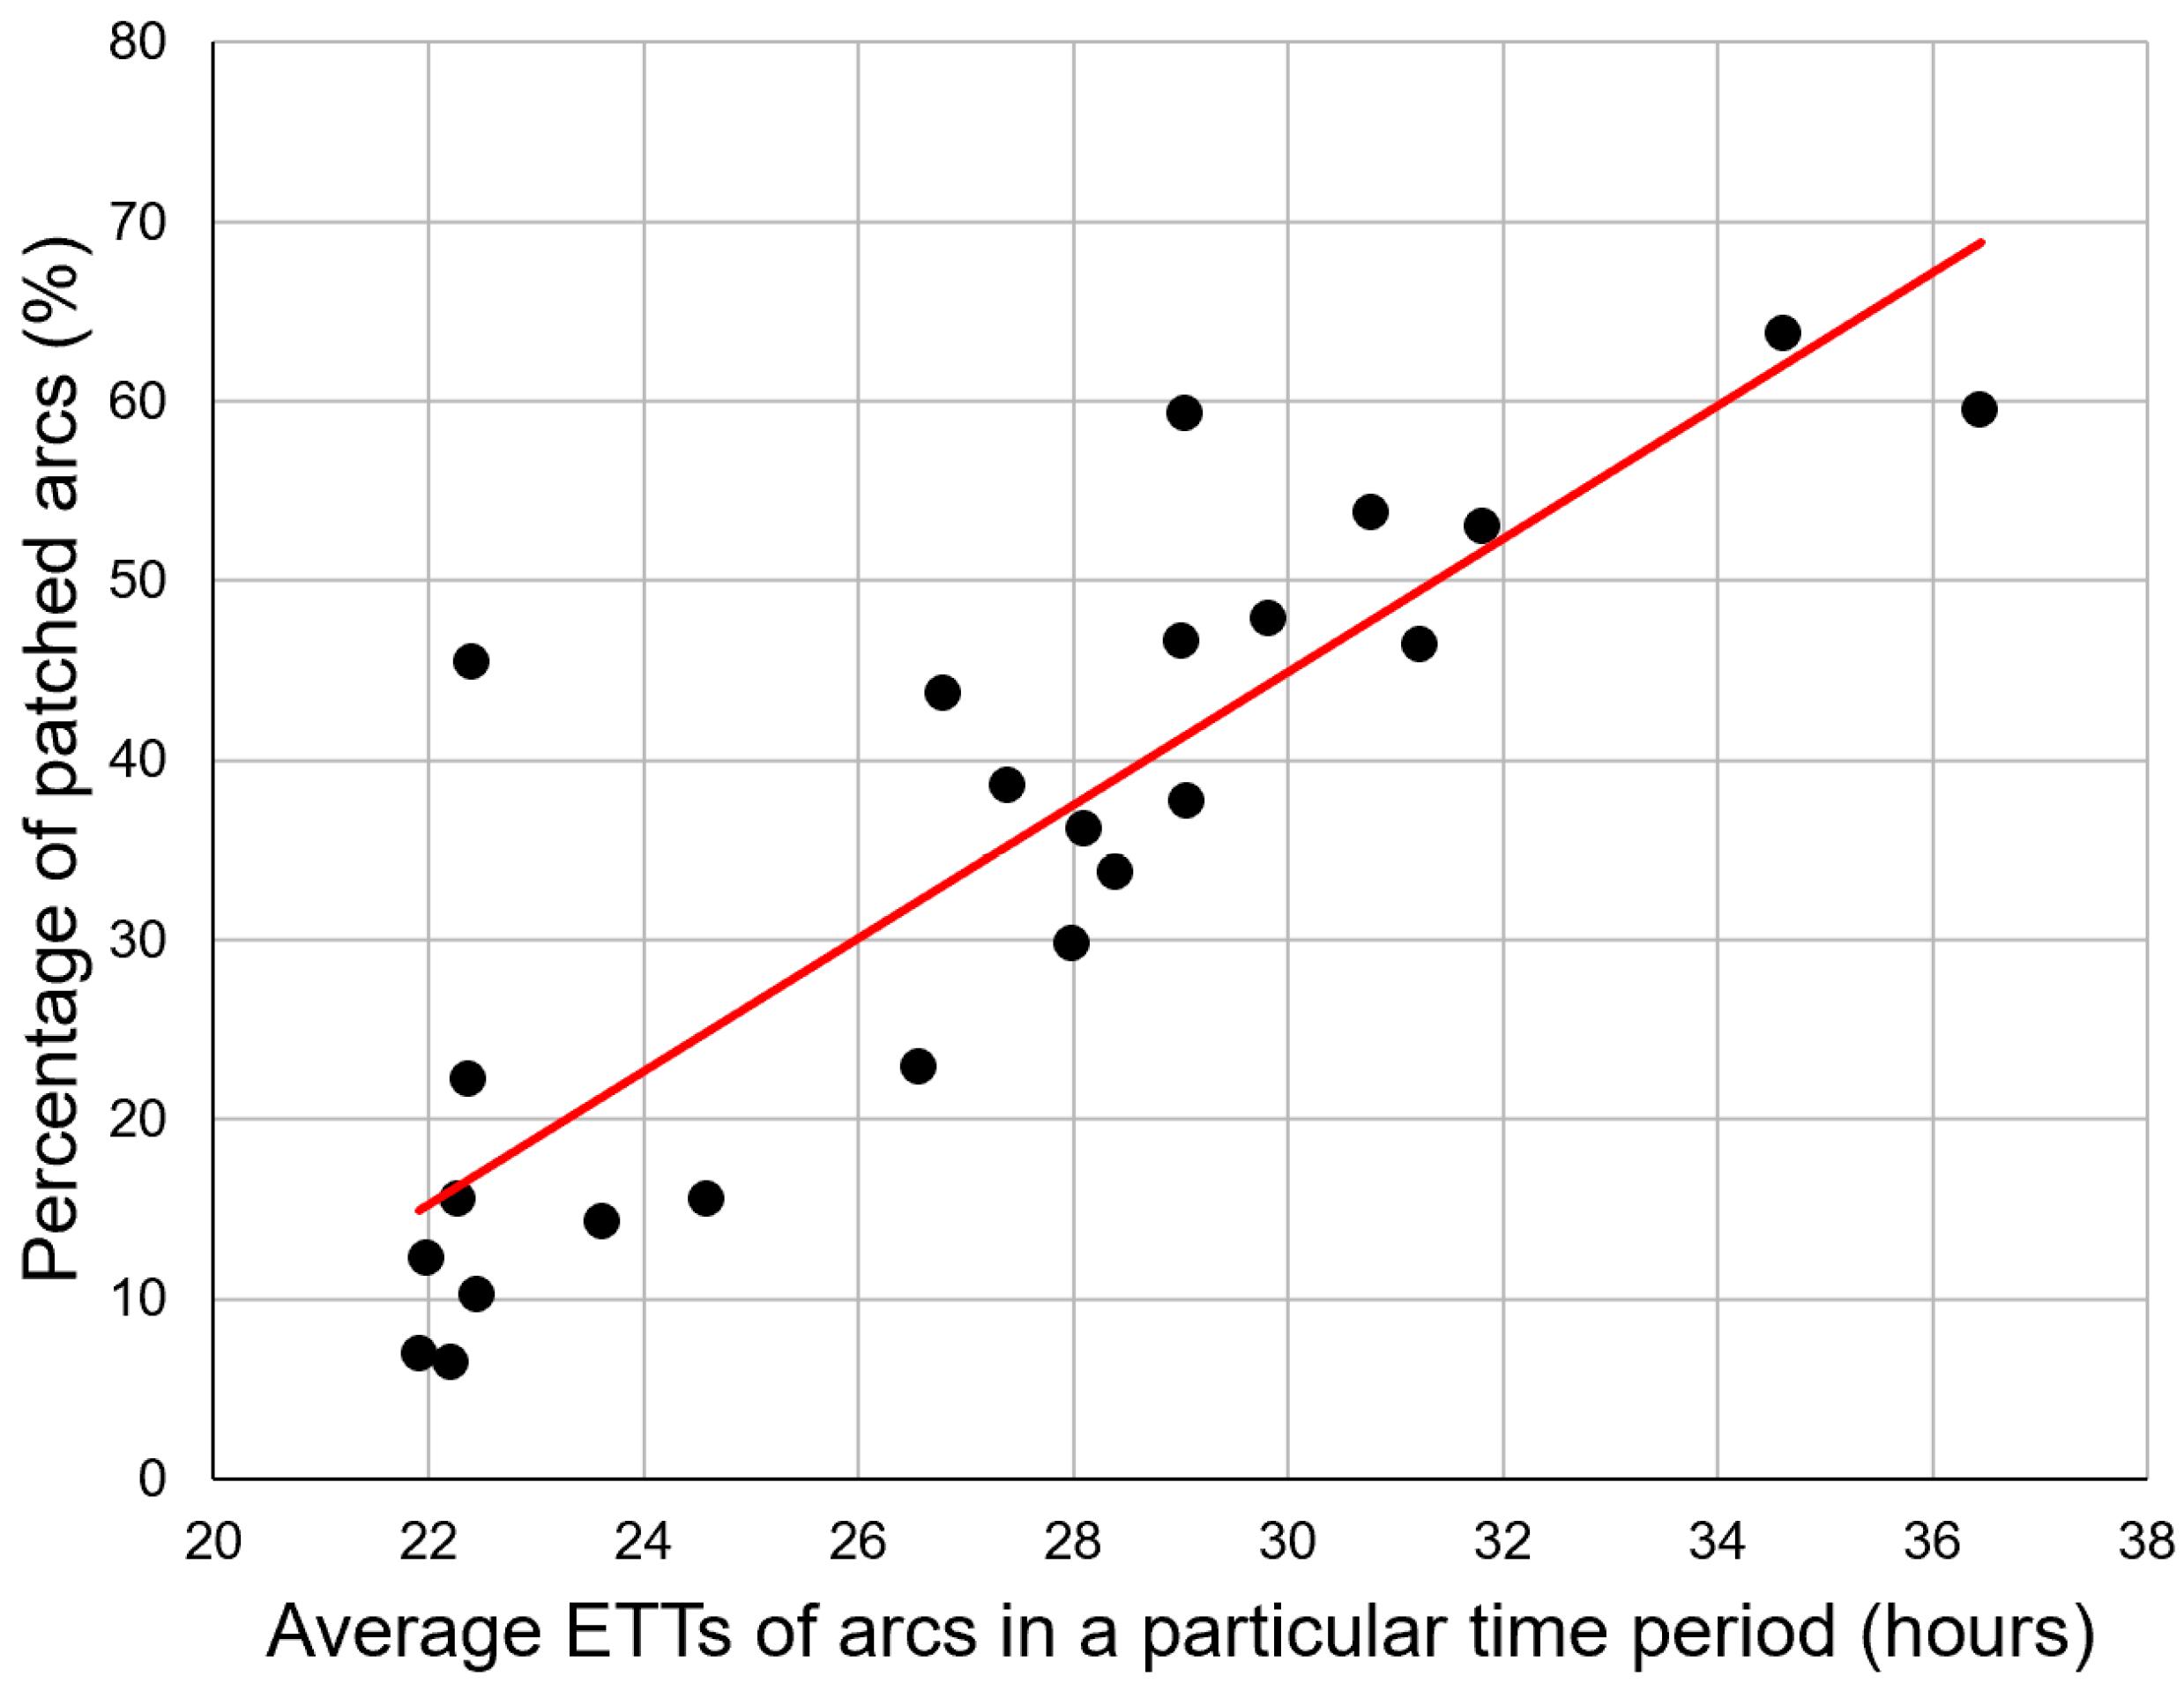
Moreover, the correlation score between percentage of patched arcs and average ETT of each subsequent hour is 0.8567, proving that the percentage of patched arcs is directly proportional to average TSP travel time. This is shown in
Figure 8.
In actuality, the average ETT of each subsequent hour can be interpreted as the traffic condition. A higher average ETT indicates a heavier traffic condition. Moreover, the percentage of patched arcs indicates the correctness of the web mapping website to provide a shorter travel time arc. A higher percentage of patched arcs shows that a higher frequency of the ETT provided by the web mapping website is not optimal. As the average ETT increases, the percentage of patched arcs increases, proving the web mapping website is not likely to provide an optimal path when the traffic condition is heavier. This shows the importance of scraping traffic data efficiently and effectively by skipping arcs that will not be used frequently.
3.3. Fast Data Scraping Phase
After verifying the usability of the Partially Patched graph, in the Fast Data Scraping Phase, those arcs that can be patched (i.e., likely to have illogical ETT values) will be removed from being scraped, and thus the cycle of scraping can be shortened. The iteration time of the Fast Data Scraping Phase is much shorter than the Full Data Scraping Phase. Hence, more iterations of web scraping can be made, and a higher accuracy of traffic data can be obtained with finer details. This process will last for weeks to continuously scrape for ETT data.
3.4. Patching Phase
After the reduced scraping phase, the scraped data has to be patched during the patching phase, as an average 34.26% of arcs from the fully connected arcs graph are not scraped in the reduced scraping phase; therefore, these arcs have to be patched with the input of shortest ETT paths that consists of multiple arcs before solving TSP with route planning algorithms.
4. Experimentation and Results
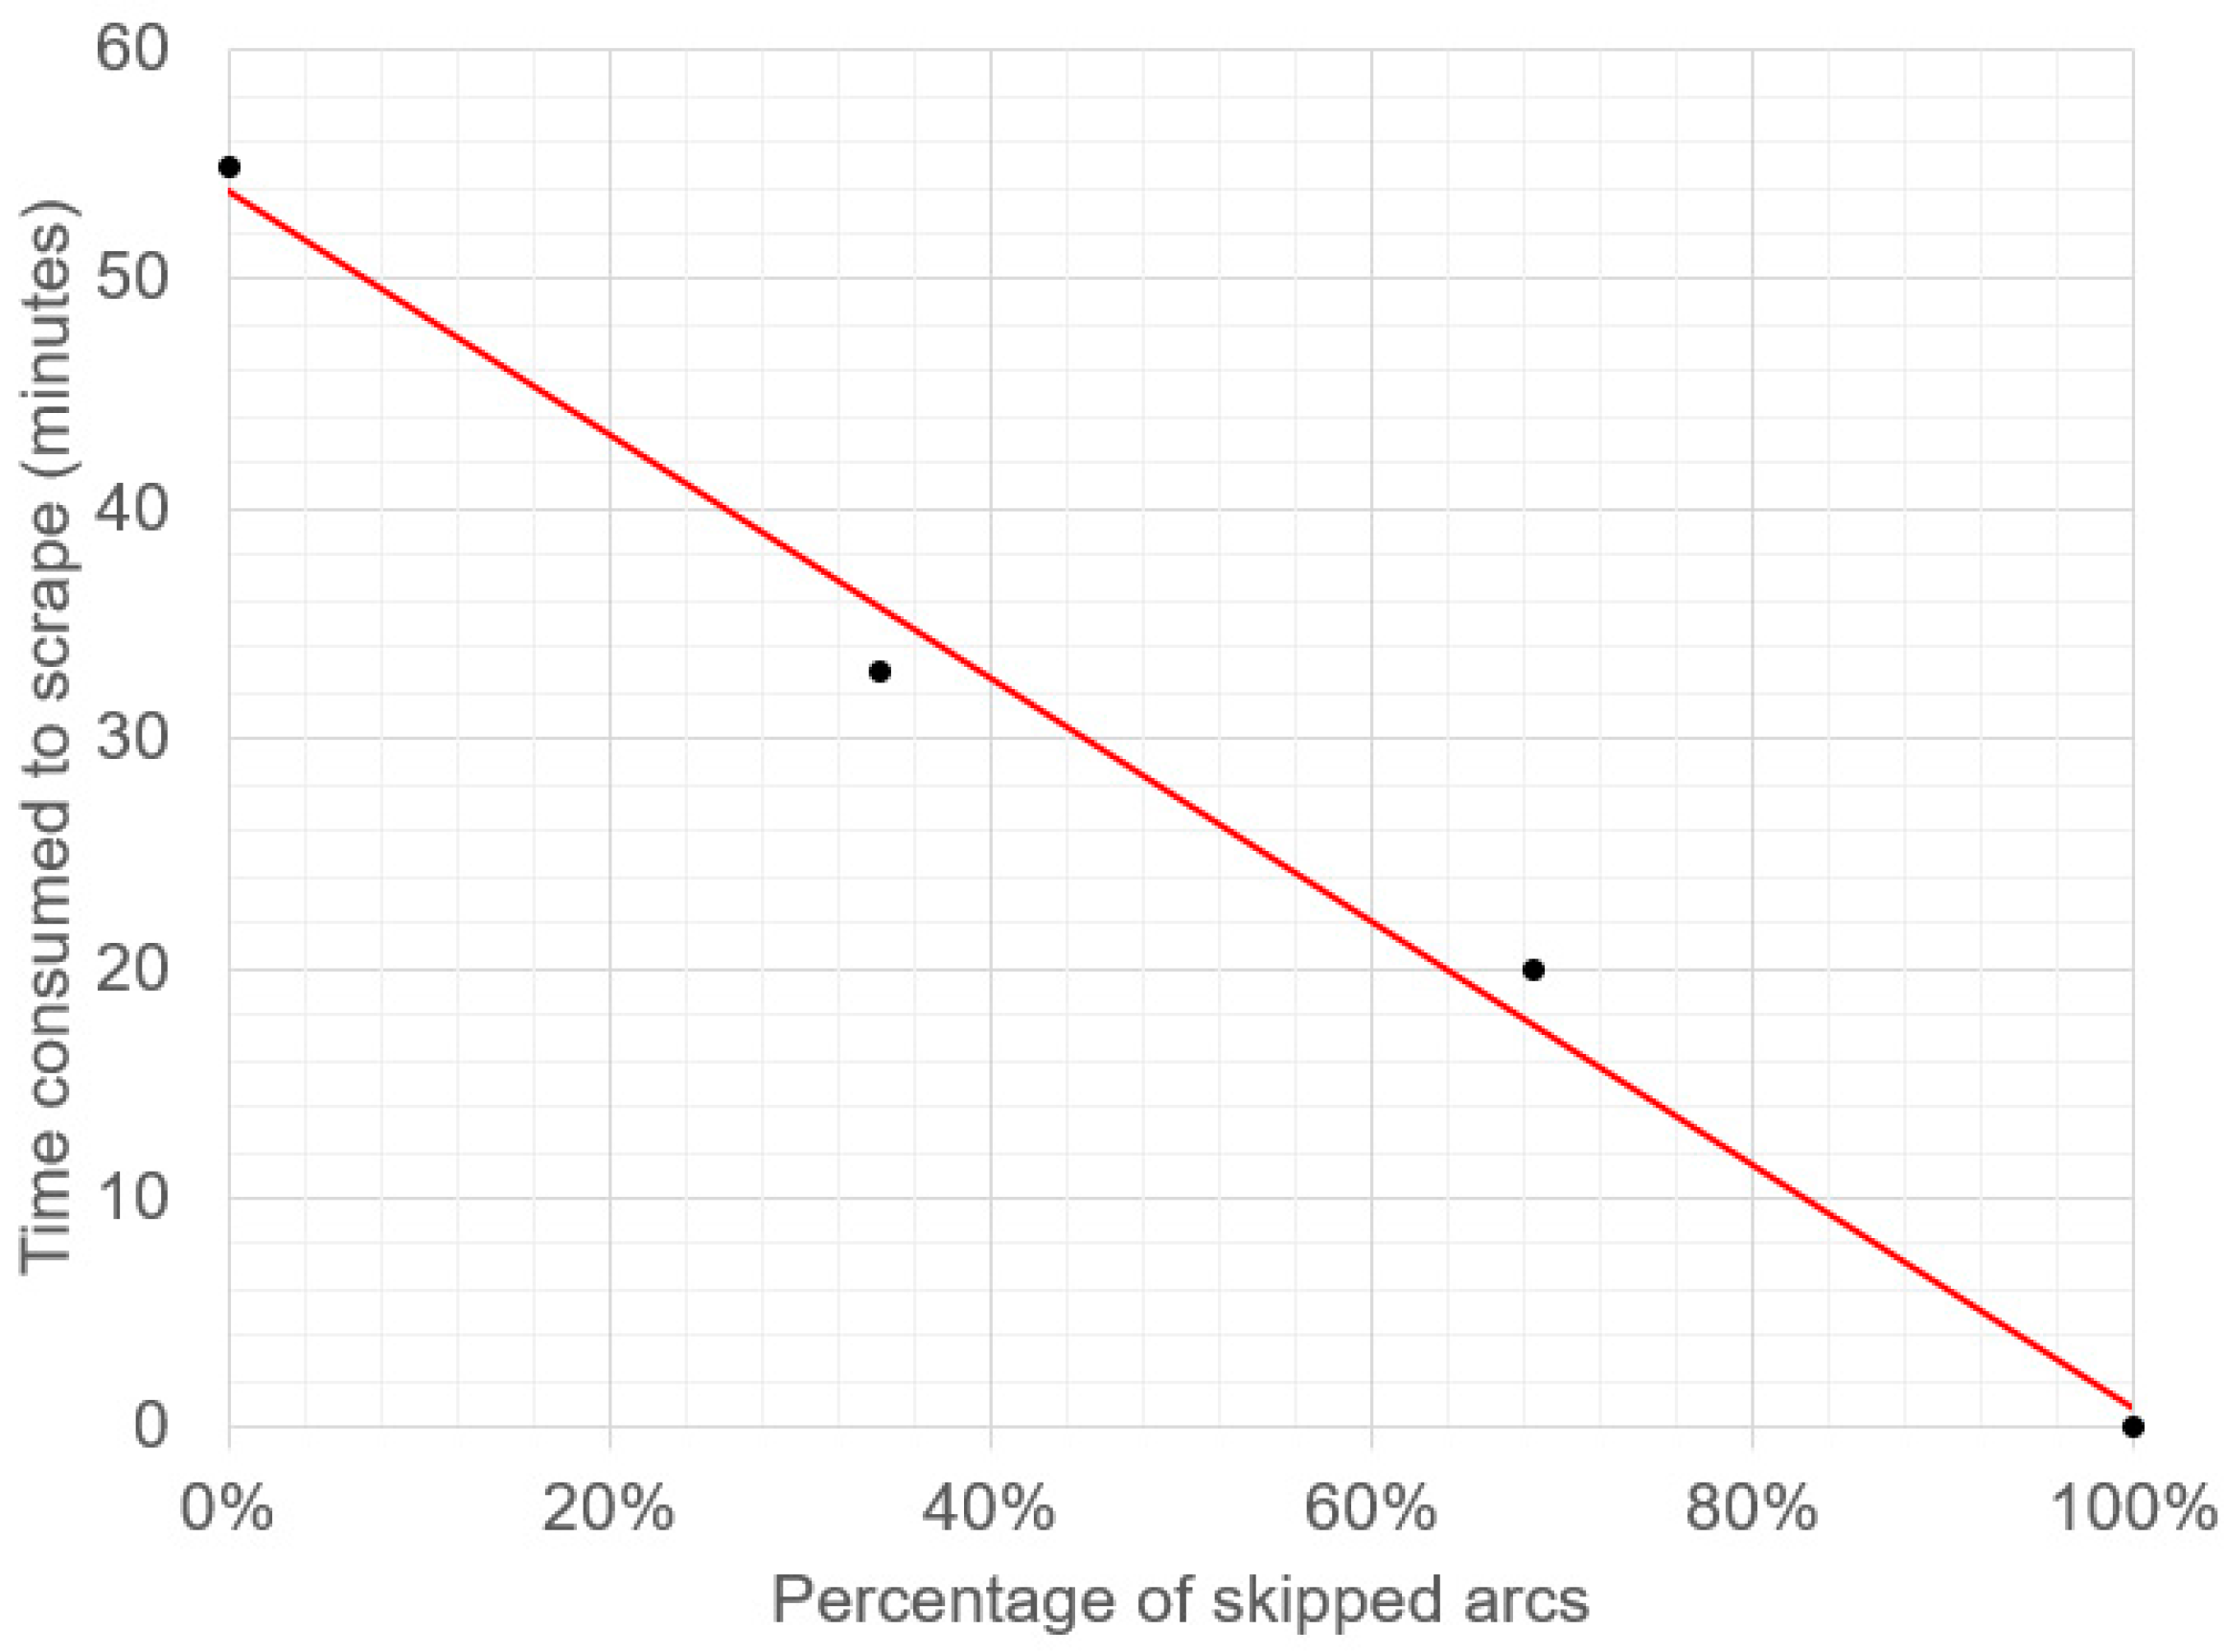
According to the scraped data from the Full Data Scraping Phase, an average of 54.87 min is spent to finish an iteration of web scraping. After skipping the 34.26% of illogical arcs in the Fast Data Scraping Phase, it only takes an average of 32.97 min to complete an iteration of web scraping, which is 40% faster than the Full Data Scraping Phase.
Figure 9 shows the correlation between the percentage of skipped arcs and the time consumed to finish an iteration of web scraping. It shows the trade-off between the percentage of skipped arcs and the scraping duration, where one could choose to reduce the time consumption by skipping more arcs.
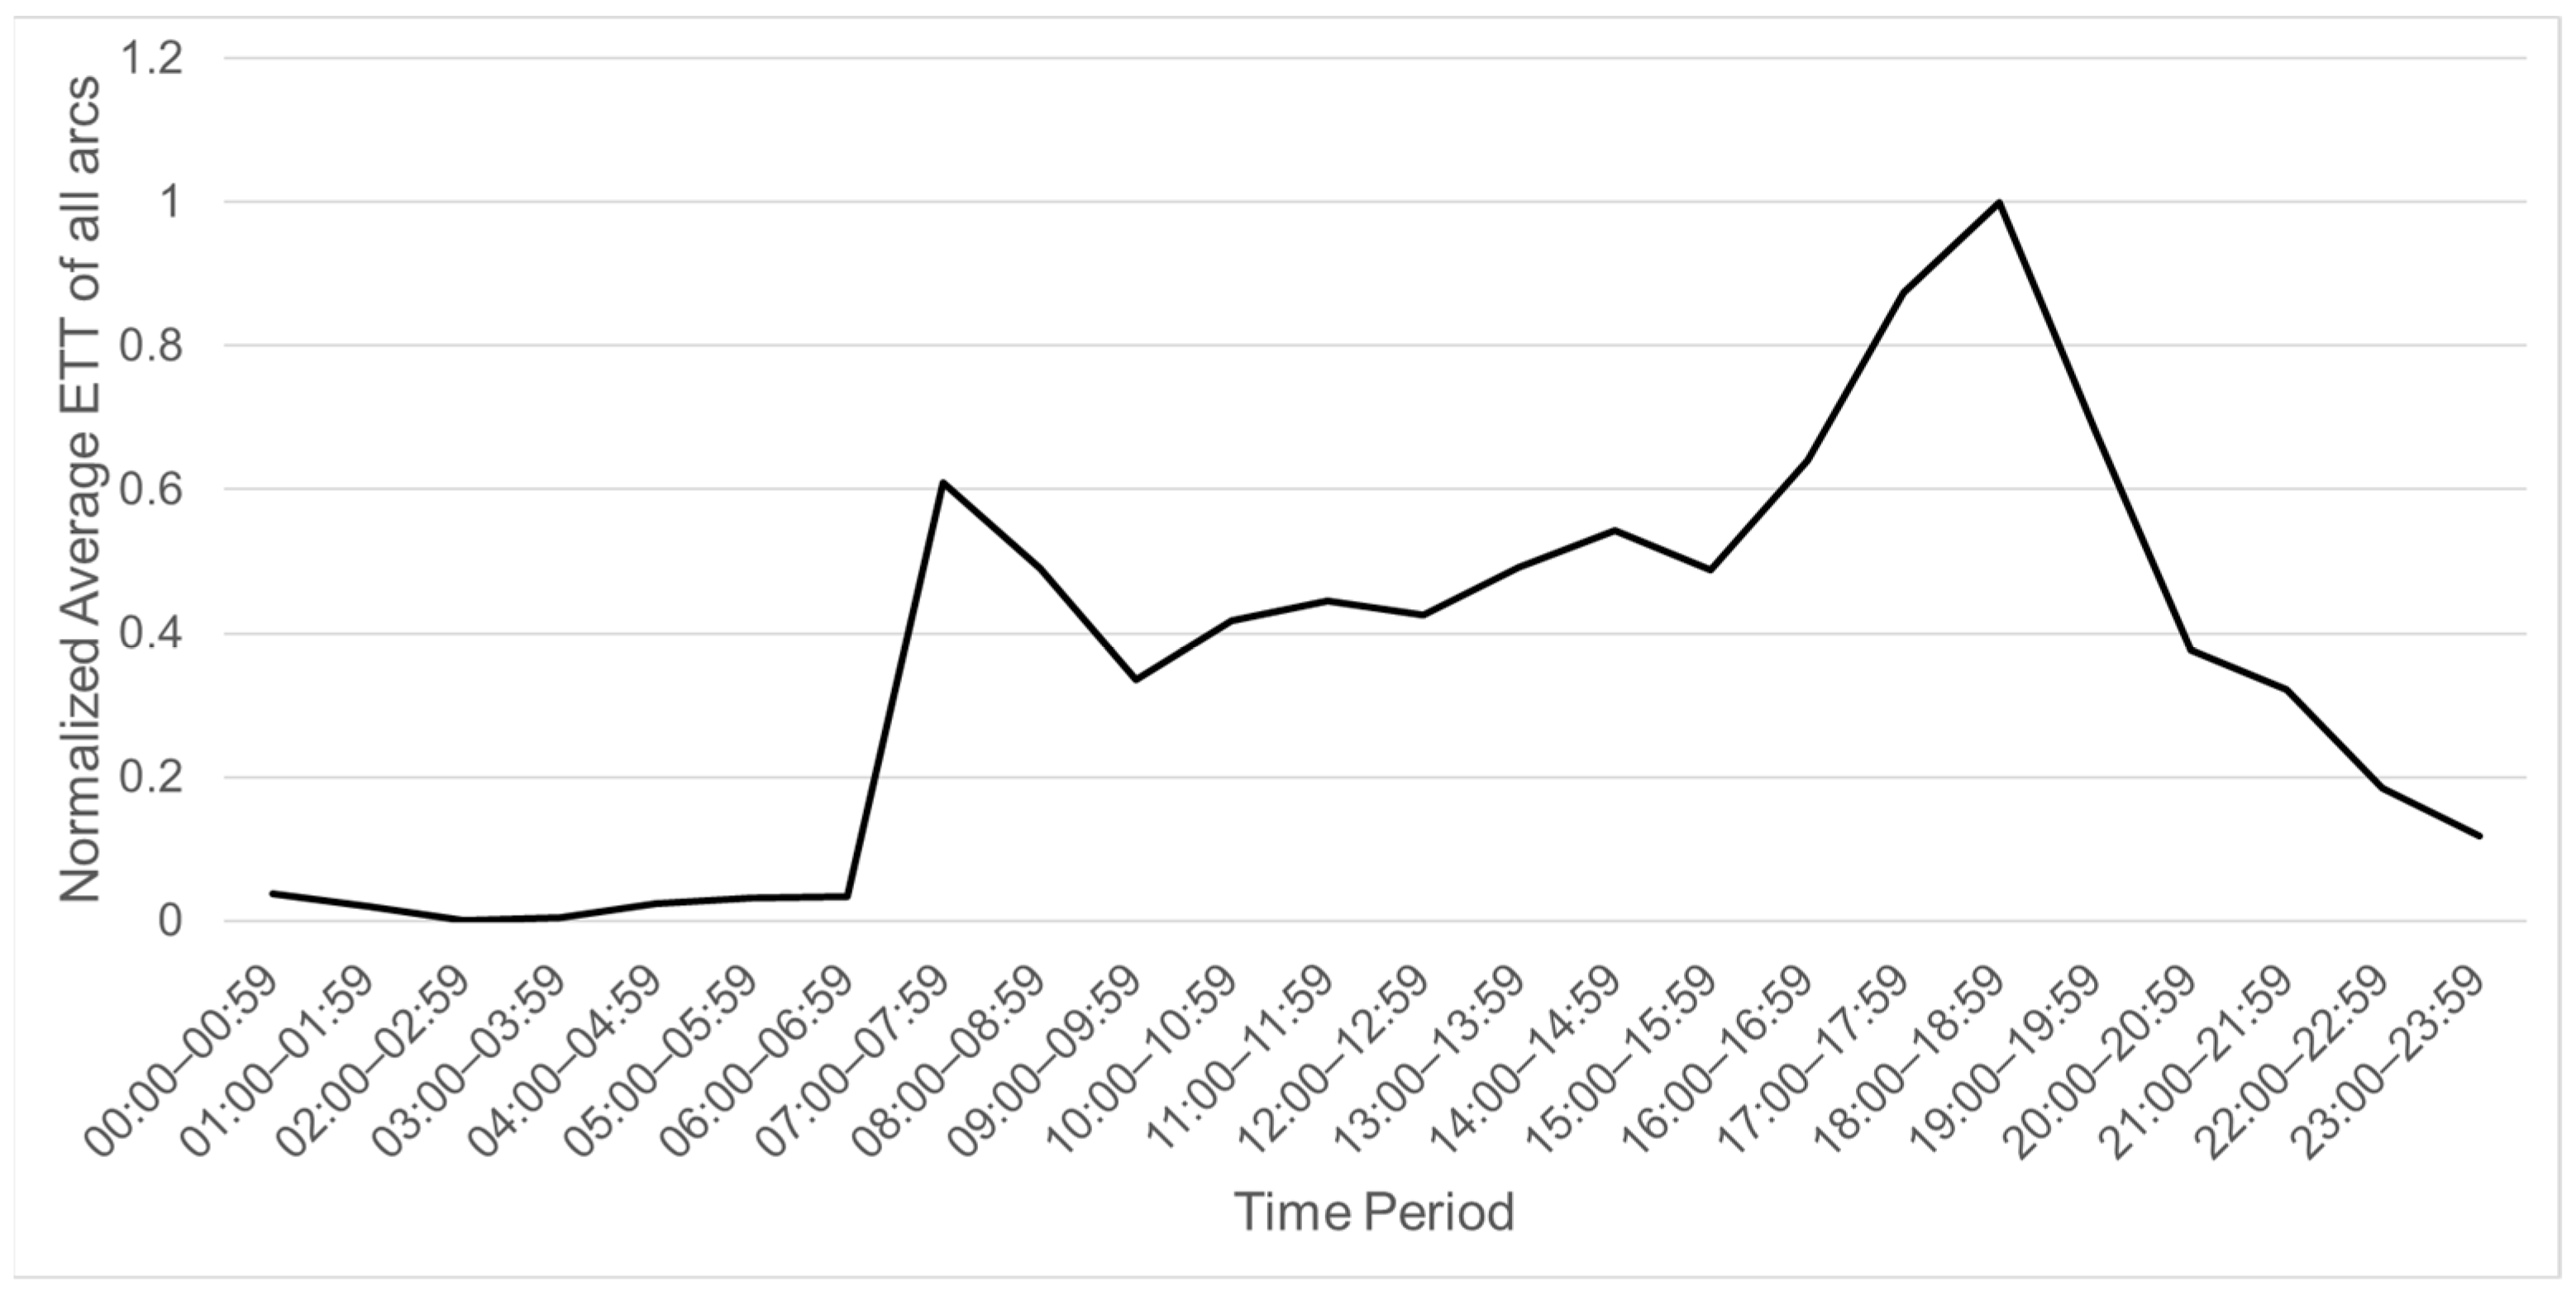
Based on scraped data, the traffic pattern can be classified according to different time ranges based on the normalized average ETT of all arcs, as shown in
Figure 10.
According to
Figure 10, the time from 07:00 to 08:59 and from 15:00 to 18:59 can be classified as the Peak period because the average traffic condition is much heavier compared with other times. Moreover, the time from 09:00 to 12:59 can be classified as the Normal period. Finally, other time ranges which are not within the Peak or Normal periods can be classified as the Traffic-free period.
As the arcs of traffic data in an iteration are not possible to be concurrently scraped, causing a time gap of an average 32.97 min between the first and the last arc, a ground truth is needed to justify the correctness of scraped data with the patched arcs graph. In this case, the ETT from the Google Distance Matrix API is used as our benchmark for comparison. This is because Google Distance Matrix API can collect an ETT of every arc within 1 min. The average TSP travel time during the Peak period and the Normal period are chosen for a comparison with the scraped data, as shown in
Figure 11.
According to
Figure 11, most of the average travel time to complete TSP from the Google matrix is higher than the scraped data, with an average of 6.17%. To ensure that the TSP route provided from scraped ETTs is applicable, the Google matrix’s ETTs are fitted into the route given by the scraped ETTs. Since the route is not optimal because of the fixed route from scraped ETTs, the average travel time of “Yellow” is 1.3% higher than “Blue”, with ranges between 1.5–7.0%. This shows the TSP route provided from scraped ETTs is applicable as there is only a 1.3% travel time difference compared to “Blue”, which is derived from the ETTs by using the Google Distance Matrix API. Without paying a huge monetary cost for the Google Distance Matrix API, even though the traffic data could not be instantaneously scraped using a web scraper, the TSP route provided from scraped ETTs does not bring much difference of the output of TSP travel time. This also verifies that our low-cost approach can be used to generate almost similar route planning results that can be generated by the data obtained from the paid Google Distance Matrix API.
One of the limitations of our proposed solution is that we only collected data within a city in Malaysia. In the future, data in other cities may need to be collected to test the model for further improvement. On the other hand, the interface or layout of the Google Map web page may change in the future; however, the data of interest will still be similar; therefore, we can use the same principle for data scraping but with a rearranged scraping position to reflect the changes in the web page layout. In addition, we only used one TSP algorithm to measure the cost of the route. In the future, we may fit the ETT data set into other VRP algorithms and simulation models [
25].
Finally, the data scraped by our framework could be extended to include not only the ETT data, but also the sequence of roads in the recommended route. Such a sequence of roads actually forms a string. Thus, if we can compare the string data (i.e., recommended road sequences) of two arcs, then we can examine the similarity/dissimilarity between these two recommended routes using a string comparison framework, such as the one proposed by Cauteruccio et al. in [
26]. Such information will be useful to improve our framework in the future.


