Abstract
Oil spills on the water surface pose a significant environmental hazard, underscoring the critical need for developing Artificial Intelligence (AI) detection methods. Utilizing Unmanned Aerial Vehicles (UAVs) can significantly improve the efficiency of oil spill detection at early stages, reducing environmental damage; however, there is a lack of training datasets in the domain. In this paper, LADOS is introduced, an aeriaL imAgery Dataset for Oil Spill detection, classification, and localization by incorporating both liquid and solid classes of low-altitude images. LADOS comprises 3388 images annotated at the pixel level across six distinct classes, including the background. In addition to including a general oil class describing various oil spill appearances, LADOS provides a detailed categorization by including emulsions and sheens. Detailed examination of both instance and semantic segmentation approaches is illustrated to validate the dataset’s performance and significance to the domain. The results on the test set demonstrate an overall performance exceeding 66% mean Intersection over Union (mIoU), with specific classes such as oil and emulsion to surpass 74% of IoU part of the experiments.
1. Introduction
Water covers approximately 71% of the Earth’s surface [1], serving as a fundamental resource that sustains life and supports a wide range of human activities, from agriculture [2] and industry to energy production and daily consumption. Water bodies—including oceans, rivers, and lakes—sustain diverse ecosystems and serve as vital arteries for global transportation and trade [3]. Although the use of waterways for transportation and trade is essential, it poses significant risks, particularly the threat of oil spills caused by accidents or intentional and potential illegal dumping [4]. These oil spills trigger environmental and economic consequences by impacting aquatic life, coastal communities, and marine ecosystems [5].
In the last decades, several oil spill incidents have occurred, including, but not limited to, the Exxon Valdez spill in Alaska’s Prince William Sound in 1989 [6], the Deepwater Horizon oil spill in the Gulf of Mexico in 2010 [7], and more recently the Sanchi oil spill in East China Sea in 2018 [8] and the Norilsk diesel fuel spill in Russia in 2020 [9]. These incidents have underscored the need to develop effective systems for the detection, localization, and prevention of oil spills by leveraging the latest advancements in Artificial Intelligence (AI), particularly in using remote sensing technologies for imagery analysis. These technologies can be categorized into two main categories considering their capturing altitude: satellite and aerial imagery [7,10].
Satellite imagery offers significant advantages for oil spill detection and localization due to its wide coverage, global accessibility, and the support of various frequency bands, including but not limited to visible, Near Infra-Red (NIR1), Short-Wave Infra-Red (SWIR2), and bands captured using a Synthetic Aperture Radar (SAR3). Satellites are mainly equipped with active and passive sensors to collect SAR and optical imagery data by sending signals or relying on sunlight, respectively. The researchers have explored both SAR and optical imagery [11,12] to detect oil spills with a particular focus on the analysis of the SAR (C-Band) as it remains independent of cloud cover, daylight, and other weather conditions [5,13,14]. Despite the benefits mentioned above, satellite imagery meets limitations in terms of spatial resolution, real-time monitoring capabilities, and revisit times. The spatial resolution of satellite images may not always be sufficient to accurately monitor and identify small or localized oil slicks; although Very High Resolution (VHR) satellite imagery could be used instead, their acquisition is costly for continuous and systematic monitoring. In addition, SAR-based approaches face challenges in identifying thick oil spills on water surfaces and distinguishing them in different classes [15].
On the other hand, aerial imagery-based approaches have also been proposed for the detection and localization of oil spills, mainly using aircraft and Unmanned Aerial Vehicles (UAVs). Both manned and unmanned aerial vehicles capture data using onboard-mounted radars such as Side-Looking Airborne Radar (SLAR), SAR, and RGB cameras. These devices offer rapid deployment, greater flexibility in maneuvering, close-up views, and the ability to fly at low altitudes, enabling higher resolution and near real-time imagery data acquisition [16] to facilitate accurate detection, localization, and classification of oil slicks [17]. Particular focus has been placed by the research community on the usage of aerial imagery for the detection and localization of oil spills, with a particular focus on SAR imagery. These approaches typically rely on polarimetric decomposition feature extraction techniques [18,19,20] and semantic segmentation learning approaches [21,22,23], taking advantage of all-weather and day-and-night imaging capabilities. Although aerial imagery seems promising, both SAR and SLAR methods face challenges when applied to multi-classification problems, i.e., for the identification of oil thickness or the distinction of oil emulsions. In addition, the acquisition of SAR imagery is costly compared to RGB cameras, resulting in the generation of datasets that usually rely on sole oil spill incidents or simulating incidents of oil spills using tubes or swimming pools [24,25,26]. This reduces generalizability due to the disparity between operating within a controlled environment and the challenges encountered in real-world incidents. Recently, an approach [27] relying on aerial imagery data acquired from RGB cameras has been published; however, it is limited to a few classes and image samples and is focused only on port environments.
To tackle the above challenges, we introduce LADOS [28], an aeriaL imAgery Dataset for Oil Spill detection, classification, and localization using semantic segmentation approaches dedicated to the visible spectrum. One of the key innovations of LADOS is the inclusion of the emulsion and sheen oil products that address a critical gap in marine pollution datasets. Emulsions can pose unique challenges and long-lasting threats to marine environments and provide additional insights for identifying specific types of pollution. Sheens are mostly related to the thinness of oil layers that are essential for the early detection of oil leaks. The latter enhances the effectiveness of oil spill response efforts, enabling rapid decision-making and targeted interventions to alleviate environmental impacts. LADOS contains 3388 RGB images gathered from online sources, including six classes—“Oil”, “Emulsion”, “Sheen”, “Ship”, “Oil-platform”, and “Background”—related to oil spill incidents of inland, coastal, and offshore water surfaces as illustrated in Figure 1. For each image sample, pixel-level annotations are provided and mapped to one of the six classes, providing additional insights that can be used, i.e., for the scale estimation of the oil spill. Taking advantage of the low-cost RGB imagery acquisition compared to SAR imagery, LADOS enables the development of economic AI-based solutions for oil spill detection and localization [29] in real-time.
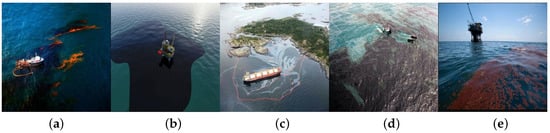
Figure 1.
LADOS Illustration of representative images and their classes: (a) “Oil”, “Emulsion”, and “Ship” [30], (b) “Oil” and “Oil-platform” [31], (c) “Sheen” and “Oil” [32], (d) “Oil”, “Sheen”, and “Ship” [31], and (e) “Emulsion” and “Oil-platform” [33]. The “Background” class is present in all images.
Our contributions are summarized as follows:
- We introduce LADOS4, the first publicly available aerial imagery dataset for oil spill detection, including six classes with pixel-level annotations for liquids: “Oil”, “Emulsion”, “Sheen”, solid objects: “Ship”, “Oil-platform”, and the “Background” class.
- We are the first to adopt the newly proposed systematic methodology for creating domain-specific datasets [34], resulting in 3388 diverse images with 6462 pixel-level annotations, providing a more comprehensive approach to the topic.
- We demonstrate the applicability of the newly generated dataset for developing cutting-edge instances and semantic segmentation deep learning models for providing insightful conclusions and enabling further research in the domain.
The remainder of the paper is organized as follows: Section 2 describes the datasets related to remote sensing for oil spills; Section 3 presents the methodology followed to generate the LADOS dataset; Section 4 defines the experiment setup; Section 5 illustrates the experimental results and discusses LADOS findings; and Section 6 concludes the paper and outlines future steps.
2. Related Datasets
In this section, an overview of recent datasets related to oil spill detection and localization is presented. The section initially covers studies focusing on satellite imagery datasets, followed by those involving aerial imagery datasets.
2.1. Satellite Datasets
The majority of satellite datasets for oil spill detection rely solely on SAR sensors, usually containing data from a single spectral band, i.e., C-Band from Sentinel-1. In Ref. [35], the dataset consists of 1112 pixel-level annotated SAR images across five classes for the evaluation of oil spill detection algorithms, particularly for the distinction of oil spills from their look-alikes. Similarly, in Refs. [36,37,38], the datasets utilized binary pixel-level annotations for 130, 6456, and 2850 SAR images, respectively. In Ref. [39], the dataset comprises 310 SAR images annotated at pixel level across five classes; however, it is used for binary classification because the oil spill class is highly underrepresented. In Refs. [40,41,42], the datasets utilized extracted SAR images from 2093, 50, 17 incidents correspondingly, for binary classification purposes. In Ref. [43], the dataset comprises 5630 binary annotated images for the detection of oil features in SAR images. Lastly, in Ref. [44], the authors used 2882 SAR images annotated both at pixel level and instance level across four classes to leverage spatial context among different instances and improve oil spill detection by distinguishing genuine spills from visually similar phenomena.
On the contrary, in Ref. [45], the dataset was gathered from two incidents and relies on multispectral imaging while encompassing both visible and infrared bands for binary pixel-level oil spill detection. In Ref. [46], the dataset comprises two incidents consisting of multiple bands, i.e., Coastal Aerosol (CA), NIR, and SWIR, for the analysis of spectral features and therefore the detection of oil spills. In Ref. [47], the authors introduced the MADOS dataset, which encompasses scenes from over 22 countries and features 15 distinct classes, with oil spill and marine debris being the primary ones. It consists of 2803 images from 13 spectral bands of the Sentinel-2 satellite, ranging from visible to infrared spectrum regions. The ROSID dataset, introduced in Ref. [48], comprises nine classes of images related to an oil spill incident with their spectral bands spanning from the visible spectrum to infrared regions. It is focused on the detection of onshore oil spills. The HOSD, introduced in Ref. [49], particularly focused on hyperspectral images acquired from one oil spill incident. Lastly, two additional datasets have been proposed that incorporate both satellite and aerial imagery. In Ref. [50], the dataset integrates SAR and multispectral imaging, comprising five classes to detect and classify oil spills according to their thickness and identify oil emulsions. In Ref. [51], the NAFTA dataset was introduced, containing 1292 RGB images gathered by satellites, drones, and first-view cameras annotated at the pixel and instance level across three classes.
2.2. Aerial Imagery Datasets
Aerial imagery datasets have also been proposed in the recent literature as offering higher resolution and rapid deployment. In Ref. [20], the dataset utilizes SAR images acquired by UAVs from one oil spill incident for the detection and classification of oil spills. In Refs. [21,22], the datasets consist of pixel-level annotated SLAR images collected from 38 and 51 UAV flight sequences, and describing two and seven classes, respectively, for the detection of oil spills and maritime objects. On the other hand, the authors in Ref. [17] used 1241 RGB binary annotated images to detect oil spills and evaluate their severity, while in Ref. [52] the authors used 10 RGB images to evaluate a distributed swarm-based UAV system for dynamic offshore oil spill mapping. In Ref. [53], the dataset consists of pixel-level annotated images spanning the visible and IR spectral bands, used for the detection of oil spills inside a port environment. More recently, the authors in Ref. [27] introduced Oil Spill Drone, the first drone-captured dataset consisting of RGB annotated images aimed at oil spill detection specifically in port environments. The dataset consists of 1268 images and three classes with the objective being the distinction of oil on water.
Table 1 summarizes the related datasets categorized by their imagery type. From left to right, the spectral bands employed, the dataset size (in terms of images, incidents, or flight sequences), the number of annotated classes, and whether or not pixel-level annotation is provided for each record are illustrated. Focusing on the Aerial imagery datasets, it is evident that there is a lack of diverse and large-scale pixel-level annotated RGB datasets related to oil spill incidents. Specifically, available datasets are either limited to two or three classes, lacking pixel-level annotations, or containing fewer than 1300 image samples. LADOS addresses these limitations by providing pixel-level annotations of six classes to more than 3300 low-altitude captured images.

Table 1.
Summarizes the related datasets categorized by their imagery type. The spectral bands employed, the dataset size (in terms of images, incidents, or flight sequences), the number of annotated classes, and whether pixel-level annotation is provided for each record are illustrated.
3. Methodology
This section outlines the methodology steps for generating the LADOS dataset. Initially, the data sources for data acquisition are illustrated. Next, the preprocessing steps for filtering the data and its annotation characteristics are described. Lastly, the challenges faced during the dataset generation are discussed, along with the structure of LADOS.
3.1. Data Acquisition
The initial step in generating LADOS is the collection of the potential image samples from online sources. Following the methodology proposed by [34], we have explored the recommended sources (Kaggle5, Roboflow6, V7 Labs7 and Google Datasets8) in addition to GitHub9. From the visual exploration of the datasets’ images, two sources were selected (Roboflow and GitHub) as they include the most relevant image samples to the LADOS dataset objectives. Considering the aforementioned sources, we utilized a list of keywords to gather the candidate datasets and, therefore, their images. These keywords were selected after review of SotA methods with a particular focus on aerial imagery approaches, and include “oil spill”, “emulsion”, “ship”, “sheen”, “oil spillage”, “ocean oil pollution”, and “marine pollution”. Taking into account the chosen online sources and the selected keywords, 26,699 images were collected from 25 datasets (Figure 2—Data Acquisition) [30,31,32,33,51,54,55,56,57,58,59,60,61,62,63,64,65,66,67,68,69,70,71,72,73,74], providing a comprehensive collection of aerial imagery samples for the LADOS dataset.
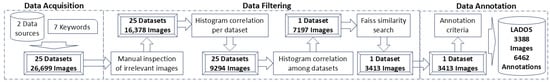
Figure 2.
Overview of LADOS generation process in three sequential steps: (1) Data Acquisition—26,699 images; (2) Data Filtering—reduced to 3413 images; (3) Data Annotation—final 3388 images annotated at pixel level across six classes.
3.2. Data Filtering
The next step of the methodology includes the filtering of the collected data before proceeding to the annotation process as depicted in Figure 2—Data Filtering. All the image annotations have been removed as the majority of the collected samples were annotated at the image level. A few of them are annotated at the pixel level; however, their annotations are limited to only one class, e.g., “pollution”, hence they were not suitable for our dataset and were also excluded. Initially, the images that were not related to oil spills were manually inspected in each dataset and removed (10,321), resulting in 16,378 images for processing in the next step. Then, a sequence of similarity search steps was performed to remove the duplicates or extremely highly similar images, as any additional image significantly increases the effort during the pixel-level annotation process. At the first step, we employed a similarity search algorithm using the OpenCV10 library for an express check of duplicate images. Specifically, the histograms of pixel values for each image were calculated and used for the comparison of all pair combinations within each acquired dataset, and a pair with a correlation of more than was considered as a duplicate. After this step, the collection of images was reduced to 9294 images from 25 datasets. Subsequently, we compared the histograms of the images in dataset pairs (product) separately, across all the datasets iteratively, until a single dataset containing 7197 unique images was obtained. Finally, we developed a simple Graphical User Interface (GUI) using the Python v3.8 library, integrated with the widely used AI similarity search approach, Faiss [75], to manually inspect for duplicate images. Specifically, the top 10 that were similar to the query image were reviewed, and if they were considered similar they were excluded, resulting in 3413 images fed to the annotation process as depicted in Figure 2.
3.3. Data Annotation
The last step of the methodology involves manually annotating each pixel of the filtered images for the generation of semantic segmentation masks to further enable the multiclass semantic segmentation modeling. The dataset was separated into three random subsets that were annotated by a group of three researchers. Each image was inspected carefully and annotated with at least one polygon of the dataset’s classes, excluding the background class. Particularly, during the manual annotation process, which is a highly time-consuming process, each researcher inspected the images to decide if the criteria for inclusion in the dataset were met. These criteria include: (a) the annotation of each image with at least one polygon to one of the following classes: “Oil”, “Emulsion”, “Sheen”, “Ship”, and “Oil-platform”, and (b) the assessment of the captured altitude to limit the dataset images to low-altitude captures that are more suitable for UAV-based applications.
For the annotation of the semantic segmentation masks (from now on referred to as masks in the remainder of the paper), two Roboflow annotation tools11 were used. Initially, the “Smart polygon tool” was used for the generation of an estimated polygon for each of the identified liquid spills (including oil, emulsion, sheen), and then manual refinements and additional annotations using the “Polygon tool” were used when necessary. For each image, the time spent was approximately 7 min for the inspection and annotation, resulting in more than 400 h of annotation. During the annotation step, 25 images were excluded as they did not fulfill the criteria, resulting in a dataset with 3388 in total as depicted in Figure 2—Data Annotation. Both the raw images and the corresponding generated masks serve as ground truth during the training and evaluation of semantic segmentation approaches.
3.4. Data Generation Challenges
Significant challenges were met during the LADOS dataset creation in the three main steps: data acquisition, filtering, and annotation. Initially, during the identification of the data sources, we observed that a lot of the selected datasets are subsets or supersets of other already selected datasets. Moreover, the majority of the datasets’ annotations do not include annotations at a pixel level, while others are annotated with only one class for all the types of liquids (oil, emulsion, sheen), or their annotation is limited to the whole image sample. To tackle these challenges, an extensive similarity search approach was adopted during the data filtering stage that includes the following steps: similarity search based on histograms, AI-based similarity search models, and manual inspection of images.
Another challenge encountered during the annotation process was the annotation complexity, particularly when more than one spills are included in an image and therefore many polygons are required as the liquids tend to spread across various spills. The higher the number of spills, the higher the time needed for the pixel-level annotation of the polygons. In addition, because the liquids of spills are on the water surface, it is not always straightforward to decide which pixels belong to which class. Hence, there is a difficulty in distinguishing pixels between classes of oil, emulsion, and sheen from water. Moreover, as emulsions and sheens are products of oil spills, but in a different form (emulsions are mixtures, sheens are thin layers), it is challenging to determine whether they are different from oil or water, respectively. Thus, additional time for refinements and careful drawing of the polygons was required.
3.5. LADOS Dataset
The aforementioned steps result in the generation of the LADOS dataset that consists of 3388 images and 6462 annotated instances (polygons) from five unique classes (in addition to the “Background”) with an average of instances per image. Table 2 depicts the distribution of images and instances per class among the training (train), validation (val), and testing (test) sets, following the commonly used split ratio of 70–20–10%. Particularly, the training set includes 2370 images with 4526 annotated instances, the validation set includes 675 images with 1323 annotated instances, and the testing set includes 343 images with 613 annotated instances. Regarding the number of images, the total number refers to the unique images included in each subset (train, val, test), as many images include annotations from more than one class. The majority of the images (3158), along with their masks have a resolution equal to pixels, and the rest (230) equal to pixels. Indicative samples of the generated dataset and the corresponding annotated masks are illustrated in Figure 3. From left to right, representative samples of LADOS images and their annotations are illustrated: (a) “Oil”, (b) “Emulsion”, (c) “Sheen”, (d) “Oil” and “Ship”, and (e) “Oil” and “Oil-platform”.
Table 2.
LADOS distribution statistics of the number of images and instances across the different classes and training, validation, and testing sets.
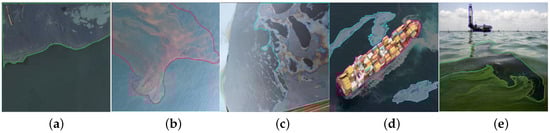
Figure 3.
LADOS representative samples including the following classes: (a) “Oil”, (b) “Emulsion”, (c) “Sheen”, (d) “Oil” and “Ship”, and (e) “Oil” and “Oil-platform”. The “Background” class is present in all samples and corresponds to pixels not included in any annotated polygons.
LADOS’s annotations include five distinct classes in addition to the “Background” class. Particularly, the “Oil-platform” and “Ship” classes describe the corresponding solid objects that might be related to oil spill events. Moreover, the “Oil” class represents the conventional oil spills, where oil floats on the water surface in distinct layers, usually characterized by dark-colored crude oil. The core innovation of LADOS is the inclusion of emulsion and sheen classes. “Emulsion” results from mixtures on the sea surface and is a complex mixture of oil, water, and other substances that form a stable colloidal suspension. Emulsions can vary in appearance, often exhibiting a reddish or brownish coloration, distinguishing them from regular oil slicks [76]. Unlike conventional oil spills, emulsions are characterized by a more homogeneous distribution, with oil droplets dispersed throughout the water column. This unique composition makes emulsions a different type from regular oil spills, posing distinct challenges for cleanup and remediation efforts. On the other hand, a “Sheen” results from the observation of oil presence on the water’s surface. The visual appearance of oil spills on the sea surface varies depending on factors such as the type of oil, environmental conditions, and the age of the spill [77]. While oil spills are commonly classified based on the thickness of the oil layer present on the water surface [78], it is not feasible to accurately determine the thickness based solely on visual appearance. Hence, in LADOS, sheens include the thin layers, often characterized by rainbow-like, silver, and blue sheens, and can be reliably distinguished from thicker slicks, which appear darker and more concentrated, using visual cues alone. Since sheens indicate the presence of thin oil layers on the water surface, they play a crucial role in the early detection of oil leaks.
4. Experimental Setup
This section outlines the experimental setup used to conduct a comprehensive performance comparison using LADOS. Initially, the benchmark models for semantic segmentation, where each pixel is assigned a class label, and instance segmentation, which distinguishes between individual objects of the same class, are described. Then, the implementation details for the training and the data augmentation techniques that were applied are presented. Finally, the adopted evaluation metrics are defined, while the hardware and software configurations are provided.
4.1. Benchmark Models
For the evaluation of LADOS-based machine and deep learning models’ performance, five SotA benchmark models are selected, including both instance and semantic segmentation approaches. For the instance segmentation, YOLOv11 [79] was employed as it features SotA accuracy and for its deployment simplicity. For the semantic segmentation, aiming at the detection, classification, and localization of non-solid objects (e.g., liquids) that LADOS incorporates, i.e., oil, emulsions, and sheens, additional SotA methods (DeepLabV3+ [80], SegFormer [81], SETR [82], Mask2Former [83]) were employed.
YOLOv11 [79] (YOLOv11m-seg) is an advanced object detection and segmentation model that incorporates attention mechanisms and optimized loss functions. These enhancements improve its ability to focus on salient features and accelerate convergence, making it more robust and efficient in diverse detection and segmentation tasks.
DeepLabV3+ [80] (deeplabv3plus_r50-d8) is a semantic segmentation Convolutional Neural Network (CNN)-based architecture that unifies Atrous Spatial Pyramid Pooling (ASPP) with an encoder–decoder structure. It is able to capture multi-scale contextual information while also refining object boundaries for more accurate segmentation results. DeepLabV3+ excels at segmenting objects with complex shapes and diverse sizes, rendering it a strong choice for detailed scene understanding.
SegFormer [81] (segformer_mit-b3) is a transformer-based semantic segmentation model that combines the strengths of transformers with lightweight, efficient Multi-Layer Perceptrons (MLPs). It uses a hierarchical transformer encoder to capture both local and global context, enabling precise segmentation across various object scales. Its simple MLP-based decoder enables fast inference while maintaining high accuracy, making it suitable for real-world applications.
SETR [82] (setr_vit-l_mla) handles the semantic segmentation as a sequence-to-sequence prediction task by deploying a pure transformer architecture. It demonstrates the effectiveness of transformers to handle tasks that require fine-grained, detailed predictions.
Mask2Former [83] (mask2former_r50-D32) unifies panoptic, instance, and semantic segmentation tasks under a single framework. Its key innovation is masked attention, which restricts cross-attention to predicted mask regions, improving localization and convergence.
4.2. Implementation and Training
To enhance the detection performance and illustrate a fair comparison, we applied transfer learning during training for both instance and semantic segmentation tasks. Specifically, for fine-tuning YOLOv1112 using LADOS, we utilized the weights trained on the COCO [84] dataset, a widely used dataset for object detection and instance segmentation tasks. For DeepLabV3+13, SegFormer14, SETR15, and Mask2Former16, the weights were retrieved from the training on the Cityscapes [85] dataset, as it offers exceptional semantic segmentation results in urban scenes. During training, most of the hyperparameters were set to default values. The batch size was set to 32 for the YOLOv11, 16 for SegFormer, DeepLabv3+, and Mask2Former, and 4 for the SETR. To implement the early stopping [86] regularization in the training, the patience hyperparameter was equally set to 10 epochs for all employed models, allowing the models a sufficient number of epochs to improve their performance by avoiding overfitting while using the validation set.
Due to the class imbalance issue of LADOS, mainly at the image level and less at the instance level, as can be observed in Table 2, the calculation of class weights for the implementation of weighted Binary Cross-Entropy17 (BCE) and Categorical Cross-Entropy (CCE)18 losses for the training of instance and semantic segmentation models, respectively, is calculated as follows:
where the weight for class i is the number of the division of the total number of instances by the multiplication of the number of instances in class i and the total number of classes.
4.3. Data Augmentation
A number of data augmentation techniques were employed during the models’ training to improve the generalization capability and overcome the issue of imbalanced classes. Horizontal flipping was applied to both instance and semantic segmentation models. This technique flips the image horizontally at 180 degrees, assisting the model’s orientation invariance. In addition, during YOLOv11 training, the following augmentations were applied: translating, scaling, mosaic, and color-related adjustments as defined in the official repository19. Translating shifts the image horizontally and vertically by a fraction of its size, assisting in the learning process of detecting partially visible objects. Scaling resizes the image by a scale factor, helping the model to recognize objects at different scales. Mosaic augmentation combines multiple images into one, offering a varied assortment of object contexts and background changes. Color-related adjustments include HSV augmentation that adjusts the hue, saturation, and brightness of the image, enhancing the models’ ability to generalize well across multiple lighting and color conditions [87]. Finally, during training of semantic segmentation models, the following augmentations20 were applied: random resizing and random cropping. The former allows the model to handle objects at different sizes. Random cropping involves the random selection of a portion of the image and its resizing to the original dimensions.
4.4. Evaluation Metrics
To assess the performance of the trained models, two evaluation metrics commonly used in instance and semantic segmentation tasks are adopted: Intersection over Union (IoU) and Accuracy. IoU quantifies the overlap between the predicted segmented region and the ground truth region, offering a measure of the effectiveness of the prediction that aligns with the actual region at the pixel level. In the experiments conducted, IoU per class (except background) and the mean IoU (mIoU) are also reported. Accuracy measures the percentage of a model’s accurate predictions and is defined as the ratio of the correctly predicted pixels to the total number of pixels. In the experiments, the mean Accuracy (mAcc) is reported to illustrate the overall performance. Note that this metric is more susceptible to dominant classes, and therefore, it should not be used in isolation for the assessment of the models. Regarding the instance segmentation model, YOLOv11, that initially detects objects in the form of bounding boxes and subsequently generates the pixel annotations for each instance, there is the possibility that a pixel belongs to more than one class (overlapped bounding boxes). To address this issue, we assigned each predicted pixel the class with the highest confidence score. The mathematical equations for the calculation of IoU and Accuracy are the following:
where TP, FP, FN and TN denote the True Positive, False Positive, False Negative, and True Negative numbers of pixels, respectively.
In addition to the metrics used for the evaluation, during the training of the instance segmentation model (YOLOv11), the mean Average Precision (mAP) was calculated for the implementation of the early stopping regularization, since mAP is the standard evaluation metric for object detection tasks, that is the primary objective of YOLOv11. In particular, a weighted average of mAP as defined in the following equation was calculated:
where mAP@50 denotes the mAP at IoU threshold set to , evaluating the performance when at least 50% of the ground truth and predicted bounding boxes overlap, and mAP@50-95 denotes the mAP across 10 thresholds from to .
4.5. Hardware and Software Configurations
The experiments were conducted on a local machine running Ubuntu 22.04, equipped with an NVIDIA RTX A6000 GPU with 48 GB of VRAM, as well as on a cloud server hosted by Amazon Web Services (AWS)21. The Python22 language was used for programming with the implementation utilizing several essential libraries, including PyTorch23 for deep learning, OpenCV24 for computer vision operations, and the MMEngine25 for deployment and training of the semantic segmentation models. GPU acceleration was also utilized to improve the speed and efficiency, particularly for training. Regarding the training times, YOLOv11 demonstrated the fastest training time, in approximately 30 min for 80 epochs, reflecting its optimized architecture for quick convergence. DeepLabV3+ exhibited relatively fast training time, taking around 2 h for 26 epochs, mainly due to its efficient use of ASPP. SegFormer proved the fastest among the transformer-based models, as a result of the use of a lightweight transformer backbone, needing approximately h for 37 epochs. SETR, on the other hand, required over 5 h for 42 epochs, due to its high computational complexity. Finally, Mask2Former displayed moderate training time, requiring around 3 h for 47 epochs, balancing accuracy and efficiency due to its masked attention and unified transformer-based architecture.
5. Performance Evaluation
In this section, the performance evaluation of the implemented benchmark models trained using LADOS is presented. Initially, by the discussion of the quantitative experimental results, and subsequently by the illustration of indicative samples from LADOS. Lastly, the limitations of LADOS and future research directions are discussed.
5.1. Experimental Results
The quantitative results of models’ performance are shown in Table 3, where for each, the IoU score per class, the mAcc, and mIoU are reported for the Validation (Val) and Test sets. Based on the results obtained, YOLOv11—aiming to predict instance masks—achieves the lower performance on both the Val and Test sets compared to the other models targeting the prediction of semantic masks. Particularly, for the classes describing liquids such as “Oil”, “Emulsion”, and “Sheen”, YOLOv11 achieves the following IoU values: , , , and , , for the Val and Test sets, respectively. This can be due to the fact that the liquids, because of their uncertain shape and their tendency to spread across various spills, are predicted by various bounding boxes with varying sizes that usually include noisy pixels (e.g., background, other classes), and therefore, it is more difficult to estimate their masks across instances. On the contrary, the classes describing solid and concrete objects such as “Ship” and “Oil-platform” are detected effectively due to them being captured across instances, so YOLOv11 achieves the following IoU values: , , and , for the Val and Test sets, respectively. The low IoU score reported on the evaluation of the “Oil-platform” class for the Test set might be a result of fewer instances, as high variances are also reported for the rest models.
Table 3.
Benchmark comparison of state-of-the-art instance and semantic segmentation models: YOLOv11, DeepLabv3+, SegFormer, SETR, and Mask2Former, fine-tuned using LADOS.
Regarding the models targeting the prediction of semantic masks, according to Table 3, the transformer-based models (SegFormer, SETR, Mask2Former) outperform the CNN-based architecture of DeepLabv3+ in all classes of LADOS. This results from the advantage of transformers to effectively encode representative and robust features, particularly for the liquids-related classes. In overall performance, we observe that DeepLabv3+ reports moderate performance () in terms of mIoU; however, it is slightly higher compared to YOLOv11. Moreover, from the visual examination at the transformer-based models, we observe that SegFormer reports the highest performance in liquid classes (“Oil”, “Emulsion”, and “Sheen”) with IoU values equal to , , , and , , for the Val and Test sets, respectively. However, it is outperformed by Mask2Former on the “Ship” and “Oil-platform” classes, where Mask2Former achieves higher IoU scores, especially on the Test set. Finally, among all models, Mask2Former demonstrates the best overall performance, attaining mIoU scores of and on the Val and Test sets, respectively, illustrating its effective performance across all classes. The only class where Mask2Former fails to achieve a high IoU score is “Oil-platform”, with mIoU scores of and on the Val and Test sets, respectively. For the same class, SegFormer reports and , while both DeepLabv3+ and SETR report on both the Val and Test sets. The large variation between the Val and Test performance in SegFormer, along with poor results across DeepLabv3+ and SETR, suggests that the limited number of instances for this class (Train 41, Val 13, and Test 8) may be insufficient for effective training and testing and should be further increased.
To tackle the issue with the imbalance classes in LADOS, and to provide a comprehensive and fair comparison among the benchmarking models, we have conducted additional experiments considering class weights calculated using Equation (1). In this manner, higher significance is given to the underrepresented classes in the dataset, resulting in a more efficient learning of such classes. The experimental results of the trained models using the corresponding loss functions (as declared in Section 4.2) are depicted with a “W” in Table 4. Specifically, Mask2Former reports the best overall performance, with mIoU scores of and in Val and Test sets, respectively. It shows a significant improvement compared to the use of standard losses, particularly for the “Oil-platform” class, where the IoU value rises from to in the Test set. It is worth mentioning that all the semantic segmentation models reported higher performance in terms of IoU in the “Oil-platform” class, indicating the effectiveness of the training using weighted losses.
Table 4.
Benchmark comparison of state-of-the-art instance and semantic segmentation models: YOLOv11, DeepLabv3+, SegFormer, SETR, and Mask2Former, fine-tuned using LADOS considering class weights.
Figure 4 illustrates a comprehensive visualization of the models’ performance in three representative dataset samples. In the first row of Figure 4, the RGB image is showcased along with its ground truth segmentation masks. In the next rows, the predicted masks for each model, followed by the corresponding default and weighted losses, are depicted. From a detailed examination of the results in first, third, and fifth columns, it is clearly illustrated the effective prediction of semantic masks using SegFormer and Mask2Former models, compared to the rest, except YOLOv11, that efficiently predicts the instance masks of the included objects (i.e., ships). In addition, a detailed examination of the predicted masks generated by each model trained with the default and the weighted losses (columns 1st–2nd, 3rd–4th, and 5th–6th) proves the effectiveness of the class weights for tackling the imbalanced classes issue. Specifically, highlights are depicted using: DeepLabv3+ in the first and second samples, SegFormer in the second sample, and Mask2Former in the first sample. Overall, the semantic segmentation approaches outperform the instance segmentation one, with the SegFormer and Mask2Former reporting higher performance trained both with default and weighted losses, with the SegFormer performing better on liquid classes, and the Mask2Former overall.
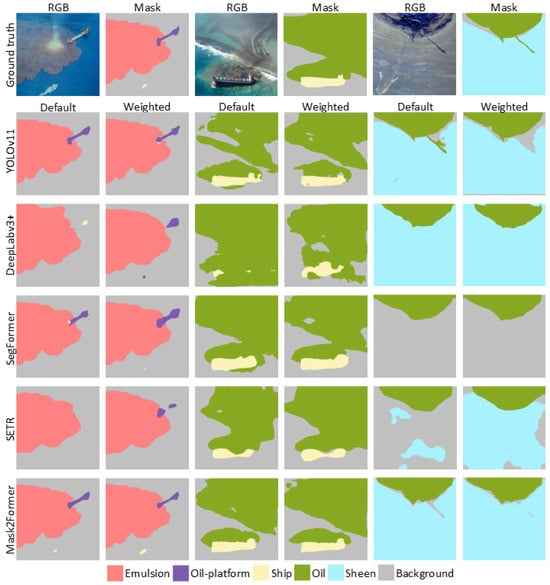
Figure 4.
Representative LADOS image samples and their ground truth masks (1st row), followed by the predicted segmentation masks for each model trained with the default and weighted losses according to the following color map: coral—“Emulsion”, purple—“Oil-platform”, yellow—“Ship”, green—“Oil”, cyan—“Sheen”, and gray—“Background”.
5.2. Limitations and Future Steps
Taking into account the performance evaluation using both instance and semantic segmentation models, three main limitations have been observed concerning the applicability of LADOS in the detection and localization of oil spills. The most noteworthy limitation is the occurrence of ambiguous class pairs such as the following: “Oil”-“Sheen”, “Oil”-“Emulsion”, and “Sheen”-“background”, with the latter typically refers to the water surface, which may also include water surface glare. All ambiguous class pairs might encompass both liquids and solid objects, presenting challenges in detecting such classes simultaneously in visual content. Although the semantic segmentation models outperform the instance one, improvements still need to be addressed to take advantage of both semantic and instance models. In addition, the possibility of enhancing the dataset with additional types of liquids is partially limited, because it is difficult to distinguish apart each among them and also from the water surface due to their transparency. However, the involvement of experts in the domain of pollutants might give additional insights to LADOS. Finally, the solid objects classes, particularly the “Oil-platform”, are highly underrepresented in LADOS; although their inclusion is more than mandatory, they are usually associated with oil spill incidents, and the inclusion of additional instances directly increases the number of liquid instances. Therefore, enriching LADOS with instances the only include the solid objects would be a valuable addition.
6. Conclusions
In this work, LADOS is introduced, an aeriaL imAgery Dataset for Oil Spill detection, classification, and localization by incorporating both liquid and solid classes. LADOS was created following a standardized methodology, resulting in a dataset containing 3388 RGB images annotated at the pixel level with 6462 instances across six unique classes, surpassing the SotA datasets in terms of number of classes and images. Furthermore, an extensive evaluation using LADOS is provided in order to analyze its effectiveness and illustrate the importance of LADOS in the domain. As a result, transformer-based models achieved an overall performance of more than mean Intersection over Union (mIoU), with some liquid classes surpassing IoU. Although the LADOS results are promising, further research to address the identified limitations is needed.
Author Contributions
Conceptualization, K.G.; Methodology, K.G. and M.M.; Software, K.G. and M.M.; Validation, K.G. and M.M.; Formal analysis, K.G.; Investigation, K.G.; Resources, K.D. and K.I.; Data curation, K.G. and M.M.; Writing—original draft preparation, K.G. and M.M.; Writing—review and editing, K.G., K.D., and K.I.; Visualization, K.G. and M.M.; Supervision, K.D. and K.I.; Project administration, S.V. and I.K.; funding acquisition, S.V. and I.K. All authors have read and agreed to the published version of the manuscript.
Funding
This work was supported by European Union’s Horizon Europe Research and Innovation Program under Grant 101073952 (PERIVALLON) and part of “the resources were granted with the support of GRNET”.
Institutional Review Board Statement
Not applicable.
Informed Consent Statement
Not applicable.
Data Availability Statement
The LADOS dataset is publicly available in a Roboflow repository (https://universe.roboflow.com/konstantinos-gkountakos/lados accessed on 10 July 2025). The trained models will be released upon publication of this work on the https://m4d.iti.gr/results/ accessed on 10 July 2025.
Acknowledgments
We would like to thank Konstantinos Klapsas K.K. for his valuable contributions to data annotation.
Conflicts of Interest
The authors declare no conflicts of interest.
Correction Statement
This article has been republished with a minor correction to resolve spelling and grammatical errors. This change does not affect the scientific content of the article.
Abbreviations
The following abbreviations are used in this manuscript:
| SAR | Synthetic Aperture Radar |
| SLAR | Side-Looking Airborne Radar |
| NIR | Near Infra-Red |
| SWIR | Short-Wave Infra-Red |
| SotA | State-of-the-Art |
| VHR | Very High Resolution |
| CA | Coastal Aerosol |
| GUI | Graphical User Interface |
| CNN | Convolutional Neural Network |
| BCE | Binary Cross-Entropy |
| CCE | Categorical Cross-Entropy |
Notes
References
- Drake, M.J.; Righter, K. Determining the composition of the Earth. Nature 2002, 416, 39–44. [Google Scholar] [CrossRef] [PubMed]
- Gkountakos, K.; Ioannidis, K.; Demestichas, K.; Vrochidis, S.; Kompatsiaris, I. A Comprehensive Review of Deep Learning-Based Anomaly Detection Methods for Precision Agriculture. IEEE Access 2024, 12, 197715–197733. [Google Scholar] [CrossRef]
- Selamoglu, M. The Effects of the Ports and Water Transportation on the Aquatic Ecosystem. Open Access J. Biog. Sci. Res. 2021, 10, 1–8. [Google Scholar] [CrossRef]
- Lega, M.; Ceglie, D.; Persechino, G.; Ferrara, C.; Napoli, R. Illegal dumping investigation: A new challenge for forensic environmental engineering. WIT Trans. Ecol. Environ. 2012, 163, 3–11. [Google Scholar]
- Naz, S.; Iqbal, M.F.; Mahmood, I.; Allam, M. Marine oil spill detection using synthetic aperture radar over indian ocean. Mar. Pollut. Bull. 2021, 162, 111921. [Google Scholar] [CrossRef]
- Bence, A.; Kvenvolden, K.A.; Kennicutt Ii, M. Organic geochemistry applied to environmental assessments of Prince William Sound, Alaska, after the Exxon Valdez oil spill—A review. Org. Geochem. 1996, 24, 7–42. [Google Scholar] [CrossRef]
- Leifer, I.; Lehr, W.J.; Simecek-Beatty, D.; Bradley, E.; Clark, R.; Dennison, P.; Hu, Y.; Matheson, S.; Jones, C.E.; Holt, B.; et al. State of the art satellite and airborne marine oil spill remote sensing: Application to the BP Deepwater Horizon oil spill. Remote Sens. Environ. 2012, 124, 185–209. [Google Scholar] [CrossRef]
- Chen, J.; Di, Z.; Shi, J.; Shu, Y.; Wan, Z.; Song, L.; Zhang, W. Marine oil spill pollution causes and governance: A case study of Sanchi tanker collision and explosion. J. Clean. Prod. 2020, 273, 122978. [Google Scholar] [CrossRef]
- Rajendran, S.; Sadooni, F.N.; Al-Kuwari, H.A.S.; Oleg, A.; Govil, H.; Nasir, S.; Vethamony, P. Monitoring oil spill in Norilsk, Russia using satellite data. Sci. Rep. 2021, 11, 3817. [Google Scholar] [CrossRef]
- Llenque, J.C.E.; Valiente, M.M.; Fababa, J.C.C.; Quiroz, L.E.; Del Castillo, M.C.; Gonzales, J.J.P.; Sanchez, M.R.; Lynes, G.M.; Ortiz, J.M.Q. Identification of the Marine Coast Area Affected by Oil Spill Using Multispectral Satellite and UAV Images in Ventanilla-Callao, Perú. In Proceedings of the 2024 IEEE Biennial Congress of Argentina (ARGENCON), San Nicolás de los Arroyos, Argentina, 18–20 September 2024; IEEE: Piscataway, NJ, USA, 2024; pp. 1–7. [Google Scholar]
- Al-Ruzouq, R.; Gibril, M.B.A.; Shanableh, A.; Kais, A.; Hamed, O.; Al-Mansoori, S.; Khalil, M.A. Sensors, features, and machine learning for oil spill detection and monitoring: A review. Remote Sens. 2020, 12, 3338. [Google Scholar] [CrossRef]
- Majidi; Nezhad, M.; Groppi, D.; Laneve, G.; Marzialetti, P.A.; Piras, G. Oil Spill Detection Analyzing “Sentinel 2 “Satellite Images: A Persian Gulf Case Study. In Proceedings of the 3rdWorld Congress on Civil, Structural, and Environmental Engineering (CSEE’18), Budapest, Hungary, 8–10 April 2018; International ASET Inc.: Orléans, ON, Canada, 2018; pp. 1–8. [Google Scholar]
- Orfanidis, G.; Ioannidis, K.; Avgerinakis, K.; Vrochidis, S.; Kompatsiaris, I. A deep neural network for oil spill semantic segmentation in Sar images. In Proceedings of the 2018 25th IEEE International Conference on Image Processing (ICIP), Athens, Greece, 7–10 October 2018; IEEE: Piscataway, NJ, USA, 2018; pp. 3773–3777. [Google Scholar]
- Krestenitis, M.; Orfanidis, G.; Ioannidis, K.; Avgerinakis, K.; Vrochidis, S.; Kompatsiaris, I. Early identification of oil spills in satellite images using deep CNNs. In Proceedings of the MultiMedia Modeling: 25th International Conference, MMM 2019; Thessaloniki, Greece, 8–11 January 2019, Proceedings, Part I 25; Springer: Berlin/Heidelberg, Germany, 2019; pp. 424–435. [Google Scholar]
- Alpers, W.; Holt, B.; Zeng, K. Oil spill detection by imaging radars: Challenges and pitfalls. Remote Sens. Environ. 2017, 201, 133–147. [Google Scholar] [CrossRef]
- Mancini, A.; Frontoni, E.; Zingaretti, P. Satellite and uav data for precision agriculture applications. In Proceedings of the 2019 International Conference on Unmanned Aircraft Systems (ICUAS), Atlanta, GA, USA, 11–14 June 2019; IEEE: Piscataway, NJ, USA, 2019; pp. 491–497. [Google Scholar]
- Jiao, Z.; Jia, G.; Cai, Y. A new approach to oil spill detection that combines deep learning with unmanned aerial vehicles. Comput. Ind. Eng. 2019, 135, 1300–1311. [Google Scholar] [CrossRef]
- Rahnemoonfar, M.; Dhakal, S. Automatic oil spill detection on quad polarimetric UAVSAR imagery. In Proceedings of the Polarization: Measurement, analysis, and remote sensing XII, Baltimore, ML, USA, 18–19 April 2016; SPIE: Bellingham, WA, USA, 2016; Volume 9853, pp. 279–285. [Google Scholar]
- Liu, P.; Li, X.; Qu, J.J.; Wang, W.; Zhao, C.; Pichel, W. Oil spill detection with fully polarimetric UAVSAR data. Mar. Pollut. Bull. 2011, 62, 2611–2618. [Google Scholar] [CrossRef]
- Hassani, B.; Sahebi, M.R.; Asiyabi, R.M. Oil spill four-class classification using UAVSAR polarimetric data. Ocean. Sci. J. 2020, 55, 433–443. [Google Scholar] [CrossRef]
- Gallego, A.J.; Gil, P.; Pertusa, A.; Fisher, R.B. Segmentation of oil spills on side-looking airborne radar imagery with autoencoders. Sensors 2018, 18, 797. [Google Scholar] [CrossRef]
- Gallego, A.J.; Gil, P.; Pertusa, A.; Fisher, R.B. Semantic segmentation of SLAR imagery with convolutional LSTM selectional autoencoders. Remote Sens. 2019, 11, 1402. [Google Scholar] [CrossRef]
- Nieto-Hidalgo, M.; Gallego, A.J.; Gil, P.; Pertusa, A. Two-stage convolutional neural network for ship and spill detection using SLAR images. IEEE Trans. Geosci. Remote Sens. 2018, 56, 5217–5230. [Google Scholar] [CrossRef]
- Li, Y.; Yu, Q.; Xie, M.; Zhang, Z.; Ma, Z.; Cao, K. Identifying oil spill types based on remotely sensed reflectance spectra and multiple machine learning algorithms. IEEE J. Sel. Top. Appl. Earth Obs. Remote Sens. 2021, 14, 9071–9078. [Google Scholar] [CrossRef]
- Yang, J.; Hu, Y.; Zhang, J.; Ma, Y.; Li, Z.; Jiang, Z. Identification of marine oil spill pollution using hyperspectral combined with thermal infrared remote sensing. Front. Mar. Sci. 2023, 10, 1135356. [Google Scholar] [CrossRef]
- Jiang, Z.; Zhang, J.; Ma, Y.; Mao, X. Hyperspectral remote sensing detection of marine oil spills using an adaptive long-term moment estimation optimizer. Remote Sens. 2021, 14, 157. [Google Scholar] [CrossRef]
- Kerf, T.D.; Sels, S.; Samsonova, S.; Vanlanduit, S. Oil Spill Drone: A Dataset of Drone-Captured, Segmented RGB Images for Oil Spill Detection in Port Environments. arXiv 2024, arXiv:2402.18202. [Google Scholar] [CrossRef]
- Gkountakos, K. LADOS Dataset. 2025. Available online: https://universe.roboflow.com/konstantinos-gkountakos/lados (accessed on 5 May 2025).
- Fingas, M.; Brown, C.E. A review of oil spill remote sensing. Sensors 2017, 18, 91. [Google Scholar] [CrossRef] [PubMed]
- Drons. OIL Dataset. 2023. Available online: https://universe.roboflow.com/drons-kogn4/oil-8sfgp (accessed on 5 May 2025).
- chris. yhyth Dataset. 2025. Available online: https://universe.roboflow.com/chris-mxxpq/yhyth (accessed on 5 May 2025).
- kriti. Oil Spillage Dataset. 2024. Available online: https://universe.roboflow.com/kriti-bcb8w/oil-spillage-4aupb (accessed on 5 May 2025).
- Toast, B. Oil Spill Two Dataset. 2024. Available online: https://universe.roboflow.com/baka-toast/oil-spill-two (accessed on 5 May 2025).
- Stavrothanasopoulos, K.; Gkountakos, K.; Ioannidis, K.; Tsikrika, T.; Vrochidis, S.; Kompatsiaris, I. CylinDeRS: A Benchmark Visual Dataset for Robust Gas Cylinder Detection and Attribute Classification in Real-World Scenes. Sensors 2025, 25, 1016. [Google Scholar] [CrossRef] [PubMed]
- Krestenitis, M.; Orfanidis, G.; Ioannidis, K.; Avgerinakis, K.; Vrochidis, S.; Kompatsiaris, I. Oil Spill Identification from Satellite Images Using Deep Neural Networks. Remote Sens. 2019, 11, 1762. [Google Scholar] [CrossRef]
- Cantorna, D.; Dafonte, C.; Iglesias, A.; Arcay, B. Oil spill segmentation in SAR images using convolutional neural networks. A comparative analysis with clustering and logistic regression algorithms. Appl. Soft Comput. 2019, 84, 105716. [Google Scholar] [CrossRef]
- Zhu, Q.; Zhang, Y.; Li, Z.; Yan, X.; Guan, Q.; Zhong, Y.; Zhang, L.; Li, D. Oil Spill Contextual and Boundary-Supervised Detection Network Based on Marine SAR Images. IEEE Trans. Geosci. Remote Sens. 2022, 60, 1–10. [Google Scholar] [CrossRef]
- Trujillo-Acatitla, R.; Tuxpan-Vargas, J.; Ovando-Vázquez, C.; Monterrubio-Martínez, E. Marine oil spill detection and segmentation in SAR data with two steps deep learning framework. Mar. Pollut. Bull. 2024, 204, 116549. [Google Scholar] [CrossRef]
- Shaban, M.; Salim, R.; Abu Khalifeh, H.; Khelifi, A.; Shalaby, A.; El-Mashad, S.; Mahmoud, A.; Ghazal, M.; El-Baz, A. A deep-learning framework for the detection of oil spills from SAR data. Sensors 2021, 21, 2351. [Google Scholar] [CrossRef]
- Bianchi, F.M.; Espeseth, M.M.; Borch, N. Large-scale detection and categorization of oil spills from SAR images with deep learning. Remote Sens. 2020, 12, 2260. [Google Scholar] [CrossRef]
- Ahmed, S.; ElGharbawi, T.; Salah, M.; El-Mewafi, M. Deep neural network for oil spill detection using Sentinel-1 data: Application to Egyptian coastal regions. Geomat. Nat. Hazards Risk 2023, 14, 76–94. [Google Scholar] [CrossRef]
- Ma, X.; Xu, J.; Pan, J.; Yang, J.; Wu, P.; Meng, X. Detection of marine oil spills from radar satellite images for the coastal ecological risk assessment. J. Environ. Manag. 2023, 325, 116637. [Google Scholar] [CrossRef] [PubMed]
- Blondeau-Patissier, D.; Schroeder, T.; Diakogiannis, F.; Li, Z. CSIRO Sentinel-1 SAR image dataset of oil- and non-oil features for machine learning (Deep Learning). Data Collect. 2022. [CrossRef]
- Yekeen, S.T.; Balogun, A.L.; Yusof, K.B.W. A novel deep learning instance segmentation model for automated marine oil spill detection. ISPRS J. Photogramm. Remote Sens. 2020, 167, 190–200. [Google Scholar] [CrossRef]
- Li, Y.; Yang, X.; Ye, Y.; Cui, L.; Jia, B.; Jiang, Z.; Wang, S. Detection of oil spill through fully convolutional network. In Proceedings of the Geo-Spatial Knowledge and Intelligence: 5th International Conference, GSKI 2017, Chiang Mai, Thailand, 8–10 December 2017; Springer: Singapore, 2018; pp. 353–362. [Google Scholar]
- Kolokoussis, P.; Karathanassi, V. Oil spill detection and mapping using sentinel 2 imagery. J. Mar. Sci. Eng. 2018, 6, 4. [Google Scholar] [CrossRef]
- Kikaki, K.; Kakogeorgiou, I.; Hoteit, I.; Karantzalos, K. Detecting Marine pollutants and Sea Surface features with Deep learning in Sentinel-2 imagery. ISPRS J. Photogramm. Remote Sens. 2024, 210, 39–54. [Google Scholar] [CrossRef]
- Nurseitov, D.B.; Abdimanap, G.; Abdallah, A.; Sagatdinova, G.; Balakay, L.; Dedova, T.; Rametov, N.; Alimova, A. ROSID: Remote Sensing Satellite Data for Oil Spill Detection on Land. Eng. Sci. 2024, 32, 1348. [Google Scholar] [CrossRef]
- Duan, P.; Kang, X.; Ghamisi, P.; Li, S. Hyperspectral remote sensing benchmark database for oil spill detection with an isolation forest-guided unsupervised detector. IEEE Trans. Geosci. Remote Sens. 2023, 61, 1–11. [Google Scholar] [CrossRef]
- Garcia-Pineda, O.; Staples, G.; Jones, C.E.; Hu, C.; Holt, B.; Kourafalou, V.; Graettinger, G.; DiPinto, L.; Ramirez, E.; Streett, D.; et al. Classification of oil spill by thicknesses using multiple remote sensors. Remote Sens. Environ. 2020, 236, 111421. [Google Scholar] [CrossRef]
- Ghorbani, Z.; Behzadan, A.H. Monitoring offshore oil pollution using multi-class convolutional neural networks. Environ. Pollut. 2021, 289, 117884. [Google Scholar] [CrossRef]
- Odonkor, P.; Ball, Z.; Chowdhury, S. Distributed operation of collaborating unmanned aerial vehicles for time-sensitive oil spill mapping. Swarm Evol. Comput. 2019, 46, 52–68. [Google Scholar] [CrossRef]
- De Kerf, T.; Gladines, J.; Sels, S.; Vanlanduit, S. Oil spill detection using machine learning and infrared images. Remote Sens. 2020, 12, 4090. [Google Scholar] [CrossRef]
- CIBER Lab. NAFTA. Available online: https://github.com/ciber-lab/nafta (accessed on 18 April 2025).
- PPE. Oil Spillage Dataset. 2024. Available online: https://universe.roboflow.com/ppe-syzfj/oil-spillage-4aupb-yytkd-1wdix-sksmd (accessed on 5 May 2025).
- kafabillariskolarngbayanpupeduph. Thesis Dataset. 2023. Available online: https://universe.roboflow.com/kafabillariskolarngbayanpupeduph/thesis-7ot3a (accessed on 5 May 2025).
- ACES. Oil Spills Dataset. 2023. Available online: https://universe.roboflow.com/aces/oil-spills-ubmlx (accessed on 5 May 2025).
- Oil Spill. Oil Stain Detection DATASET. 2024. Available online: https://universe.roboflow.com/oil-spill-a0l20/oil-stain-detection (accessed on 5 May 2025).
- ObjectdetectionFruits. Oil_spill Dataset. 2024. Available online: https://universe.roboflow.com/objectdetectionfruits-moegm/oilspill-qbagr (accessed on 5 May 2025).
- Pollution, O. Test Dataset. 2023. Available online: https://universe.roboflow.com/oil-pollution/test-ka7p4 (accessed on 5 May 2025).
- Karanov, D. Oil Spill Classification Dataset. 2023. Available online: https://universe.roboflow.com/dmitry-karanov-xnath/oil-spill-classification (accessed on 5 May 2025).
- Detection. Offshore Oil Spills3 Dataset. 2024. Available online: https://universe.roboflow.com/detection-tvlmd/offshore-oil-spills3 (accessed on 5 May 2025).
- Dataset, O. Oilspill_v2 Dataset. 2023. Available online: https://universe.roboflow.com/oilspill-dataset/oilspillv2 (accessed on 5 May 2025).
- Group, O. Sea Report Oil Dataset. 2024. Available online: https://universe.roboflow.com/open-group/sea-report-oil (accessed on 5 May 2025).
- Karanov, D. Oil Spill One Class Classification Dataset. 2023. Available online: https://universe.roboflow.com/dmitry-karanov-xnath/oil-spill-one-class-classification (accessed on 5 May 2025).
- Punthon. Oil-Spill-Segmentation Dataset. 2024. Available online: https://universe.roboflow.com/punthon-i5rmx/oil-spill-segmentation-tysge (accessed on 5 May 2025).
- Karanov, D. Oil Spots Segmentation Dataset. 2023. Available online: https://universe.roboflow.com/dmitry-karanov-xnath/oil-spots-segmentation (accessed on 5 May 2025).
- Detection. Offshore Oil Spills2 Dataset. 2024. Available online: https://universe.roboflow.com/detection-tvlmd/offshore-oil-spills2 (accessed on 5 May 2025).
- Computervision. Oil_Spill_Seg Dataset. 2024. Available online: https://universe.roboflow.com/computervision-naujm/oilspillseg (accessed on 5 May 2025).
- hamdi ali. Oil Pollution Dataset. 2022. Available online: https://universe.roboflow.com/hamdi-ali/oil-pollution (accessed on 5 May 2025).
- Drons. Oil Spills v1 Dataset. 2022. Available online: https://universe.roboflow.com/drons-kogn4/oil-spills-v1 (accessed on 5 May 2025).
- idkman. Oil Spill Dataset. 2023. Available online: https://universe.roboflow.com/idkman/oil-spill-rcnm4 (accessed on 5 May 2025).
- amjad. Oil Spli New v Dataset. 2024. Available online: https://universe.roboflow.com/amjad-myr3z/oil-spli-new-v (accessed on 5 May 2025).
- kafabillariskolarngbayanpupeduph. Custom_Data Dataset. 2023. Available online: https://universe.roboflow.com/kafabillariskolarngbayanpupeduph/customdata-5nmls (accessed on 5 May 2025).
- Johnson, J.; Douze, M.; Jégou, H. Billion-scale similarity search with GPUs. IEEE Trans. Big Data 2019, 7, 535–547. [Google Scholar] [CrossRef]
- Fingas, M.; Fieldhouse, B. Studies of the formation process of water-in-oil emulsions. Mar. Pollut. Bull. 2003, 47, 369–396. [Google Scholar] [CrossRef] [PubMed]
- Fingas, M. Visual appearance of oil on the sea. J. Mar. Sci. Eng. 2021, 9, 97. [Google Scholar] [CrossRef]
- Lewis, A. The development and use of the Bonn Agreement oil appearance code (BAOAC). In Proceedings of the Interspill Conference, Marseilles, France, 12–14 May 2009; pp. 12–14. [Google Scholar]
- Khanam, R.; Hussain, M. Yolov11: An overview of the key architectural enhancements. arXiv 2024, arXiv:2410.17725. [Google Scholar]
- Chen, L.C.; Zhu, Y.; Papandreou, G.; Schroff, F.; Adam, H. Encoder-decoder with atrous separable convolution for semantic image segmentation. In Proceedings of the European Conference on Computer Vision (ECCV), Munich, Germany, 8–14 September 2018; pp. 801–818. [Google Scholar]
- Xie, E.; Wang, W.; Yu, Z.; Anandkumar, A.; Alvarez, J.M.; Luo, P. SegFormer: Simple and efficient design for semantic segmentation with transformers. Adv. Neural Inf. Process. Syst. 2021, 34, 12077–12090. [Google Scholar]
- Zheng, S.; Lu, J.; Zhao, H.; Zhu, X.; Luo, Z.; Wang, Y.; Fu, Y.; Feng, J.; Xiang, T.; Torr, P.H.; et al. Rethinking semantic segmentation from a sequence-to-sequence perspective with transformers. In Proceedings of the IEEE/CVF Conference on Computer Vision and Pattern Recognition, Nashville, TN, USA, 20–25 June 2021; pp. 6881–6890. [Google Scholar]
- Cheng, B.; Misra, I.; Schwing, A.G.; Kirillov, A.; Girdhar, R. Masked-attention mask transformer for universal image segmentation. In Proceedings of the IEEE/CVF Conference on Computer Vision and Pattern Recognition, New Orleans, LA, USA, 18–24 June 2022; pp. 1290–1299. [Google Scholar]
- Lin, T.Y.; Maire, M.; Belongie, S.; Hays, J.; Perona, P.; Ramanan, D.; Dollár, P.; Zitnick, C.L. Microsoft coco: Common objects in context. In Proceedings of the Computer Vision–ECCV 2014: 13th European Conference; Zurich, Switzerland, 6–12 September 2014, Proceedings, Part V 13; Springer: Cham, Switzerland, 2014; pp. 740–755. [Google Scholar]
- Cordts, M.; Omran, M.; Ramos, S.; Scharwächter, T.; Enzweiler, M.; Benenson, R.; Franke, U.; Roth, S.; Schiele, B. The cityscapes dataset. In Proceedings of the CVPR Workshop on the Future of Datasets in Vision, Boston, MA, USA, 7–12 June 2015; Volume 2, p. 1. [Google Scholar]
- Hussein, B.M.; Shareef, S.M. An empirical study on the correlation between early stopping patience and epochs in deep learning. In Proceedings of the ITM Web of Conferences, Dehradun, India, 11–12 October 2024; EDP Sciences: Les Ulis, France, 2024; Volume 64, p. 01003. [Google Scholar]
- Maharana, K.; Mondal, S.; Nemade, B. A review: Data pre-processing and data augmentation techniques. Glob. Transitions Proc. 2022, 3, 91–99. [Google Scholar] [CrossRef]
Disclaimer/Publisher’s Note: The statements, opinions and data contained in all publications are solely those of the individual author(s) and contributor(s) and not of MDPI and/or the editor(s). MDPI and/or the editor(s) disclaim responsibility for any injury to people or property resulting from any ideas, methods, instructions or products referred to in the content. |
© 2025 by the authors. Licensee MDPI, Basel, Switzerland. This article is an open access article distributed under the terms and conditions of the Creative Commons Attribution (CC BY) license (https://creativecommons.org/licenses/by/4.0/).