Abstract
Consumption of non-alcoholic beer (NAB) is continuously increasing in many countries. NABs are produced with varying technologies, resulting in different sensory properties. Previous studies have focused on understanding the consumers’ acceptance and preferences among different types of NAB. However, few studies have focused on the sensory characterization of commercial NABs produced with different methods. This study aimed to find key sensory characteristics in lager, Indian pale ale, and pilsner-type NABs with untrained panels by conducting tests in Finland and China. Participants were asked to Check-All-That-Apply for odors and Rate-All-That-Apply for flavors. Additionally, hedonic responses to odor and flavor pleasantness were rated. Chinese participants used more different and more often-used attributes to describe NABs. More varying descriptors were used on the NAB samples chosen as the most pleasant ones, indicating more complex sensory properties. Participants from both locations preferred lager-type beers characterized as ‘fresh’ odor and ‘fruity’, ‘floral’, and ‘sweet’ flavors and less frequently found Indian-pale-ale-type NABs pleasant, describing them as ‘sour’, ‘bitter’, ‘fermented’, and ‘pungent’ flavors. The flavor pleasantness correlated more with the samples frequently chosen as the most pleasant than odor pleasantness. No clear connection was found between the production method of NAB and consumers’ acceptance, demonstrating that all production methods can be used to produce non-alcoholic beers with sensory properties acceptable to consumers.
1. Introduction
Consumption of non- and low-alcoholic beer (NAB) has increased in many countries [1], especially within the younger generations [2,3,4]. Consumers are increasingly concerned about their health and potential harmful impact caused by alcohol consumption. High consumption of alcohol may cause a reduction in lifespan through various diseases, such as cancer, liver cirrhosis, and cardiovascular disease [5]. The European Union (EU) defines NABs as containing 0.5% or less alcohol by volume (ABV) [6]. The attraction towards NABs increases, as they are suitable for consumers with limitations to consuming alcohol due to religion, lower tolerance to alcohol, pregnancy, or need to drive a car or other motorized vehicle. In addition, NABs contain less calories compared to regular alcoholic beer [7]. In Finland, the consumption of NABs increased by 10.2% in 2020 only, illustrating well the interest of Finnish consumers towards NABs. At the same time, the consumption of alcoholic brewed beverages decreased by approximately 3% [8]. Furthermore, in the EU region, the consumption of NABs has doubled between 2013 and 2019 [6].
Since 2002, China has been the largest market for beer in the world. For example, only in 2021, the annual consumption of beer was 45.7 billion liters in China. China is also the largest producer of beer [9] and, in the 2023, the sixth biggest beer importer [10]. Compared to heterogenous European beer taste profiles containing both typical light lager beers and crafted Indian pales ales (IPAs), Chinese beers are generally homogenous groups of mild-tasting pale lagers with lower alcohol content compared to European beers [11]. However, the preferences by Chinese consumers have shifted more towards craft beers, such as IPAs, and high-end products, and they are purchasing more premium beer over less expensive mass-produced beers. At the same time, non-alcoholic beers represent an emerging trend in Chinese beer markets [9].
NABs are more often purchased by consumers in better socioeconomic prospects, such as higher levels of education and income [12,13]. For example, studies conducted between 2017 and 2018 in Finland showed that NAB is more likely bought by older people or men than younger people and women [13]. However, in the United Kingdom, NABs are more likely purchased by younger age groups [12]. NAB consumers most likely want to enjoy the flavor of beer without the harmful effects of alcohol. In addition, NAB consumers are more likely to have a healthy lifestyle in addition to decreasing alcohol consumption [14]. Negative and limited conceptualizations of NAB can affect the consumption rates: NAB is still often seen more as a substitute than a primary product, and their sensory properties can surprise consumers positively when consumed [15]. Furthermore, NABs arouse neutral to negative emotions, such as disappointed, rational, and conscious, in contrast to regular beer, which evokes highly positive emotions, such as energetic and adventurous [16], and even the label NAB can decrease the intensity of positive emotions usually perceived from beers [17]. Sensory properties of NAB are reported to be more negative, such as watery and bland, compared to the alcoholic counterparts, resulting in decreased liking of NABs [14].
The dealcoholizing production method affects the sensory properties of the final NAB products. Currently used methods can be roughly divided to physical (e.g., vacuum evaporating and reverse osmosis) and biological (e.g., interrupted fermentation, low-ethanol-producing yeast) methods based on the processed used to reduce the alcohol content [18,19,20,21,22,23]. All physical methods for removing alcohol have been reported to significantly decrease the content of volatile compounds, which are important for sensory properties [22]. The perceptible properties of NABs can be improved by restoring the aroma compounds after distillation, adding natural aromas or dry hopping after the ethanol removal [24]. Biological methods may cause wort flavor, a high diacetyl content, and a bready, grain-like, and sweet taste [19,25]. Bauwens et al. (2021) [25] studied alcoholic pale lager beers and their non-alcoholic counterparts with chemical analyses and sensory tests. They reported higher volatile compound contents in alcoholic beers and different sensory properties compared to their NAB counterparts. In addition, NABs were sweeter and discriminated by the production methods.
Check-All-That-Apply (CATA) asks participants to select all the appropriate sensory attributes describing the sample from the given list of words or phrases. CATA is a simple and quick way to gather information about sensory characteristics from consumers [26,27], and the method has become very popular in research [26,28]. CATA questions have been recently used to describe the non-alcoholic beers [14,29,30,31]. However, these publications only focused on consumers from one cultural background (American, Canadian, Spanish, respectively), and they studied many different NAB types or only lager types, respectively. CATA provides results in a binary format, as samples either have or do not have a certain characteristic. The data are typically summarized using contingency tables (shown typically with percentages) and assessed using non-parametric statistical methods, such as Cochran’s Q test or McNemar’s test, or multivariate models, such as Correspondence Analysis, presenting sensory maps of samples and CATA attributes. In consumer studies, CATA questions are typically included together with hedonic liking ratings, and the data can be combined to identify the drivers of liking and/or disliking, e.g., in partial least squares (PLS) regression or principal component analysis (PCA) models. Despite their simplicity, CATA questions may accurately discriminate samples, and consumers are capable of accurately describing sensory characteristics of food using CATA terms, and eventually they may provide similar results as descriptive analyses by trained sensory panels [26]. On the other hand, the binary format of the CATA questions may provide concerns. They may not be suitable for discrimination of samples based on their sensory attributes that have very high or low intensities [32] or are generally very similar [33]. Additionally, the obtained frequency data cannot be directly used to measure intensities of the attributes [34]. The Rate-All-That-Apply (RATA) questions have been since introduced as a variant of CATA and gained popularity [26]. In RATA, the selected attributes are rated on a given scale, and the RATA questions can be used to discriminate the samples [27]. RATA questions have recently been used to characterize wheat beers [35] and beer body [36], but it has not been used to characterize NAB. RATA can even increase the amount of chosen sensory attributes in comparison to CATA [37]. Both methods have been shown to provide similar conclusions about the differences and similarities among samples [38]. Unlike CATA, RATA provides quantitative data, which may be more reliably linked to other factors measured on scales, such as liking ratings. Whereas in both cases, attention should be paid to the design of the attribute lists to include sufficient variety of relevant attributes in randomized order. Terms positioned at the beginning of the lists are typically more easily found and frequently selected, whereas too-short attribute lists may result in decreased discrimination and too-long lists result in decreased attention to all terms by the participants [26].
The cultural background of the consumer influences the food choices and adjusts their taste perception and preferences. All these will affect how much they consume certain food products or beverages [39]. Preference of the beer style can be affected by locally developed beers in some countries due to limited availability of other beers. [17] The lager-type beers are the most produced and distributed beers by the multi-national brewing companies, and IPAs are popular craft beers. However, beer consumers from different cultural backgrounds may prefer different beer types, and, thus, they may also prefer similar NABs. This study aimed to identify the key sensory characteristics of NABs by conducting sensory tests with untrained panels in Finland and China. In China, sensory tests were conducted in two locations, in a university and in a local bar. This study focused especially on lager- and IPA-type NABs produced with different dealcoholizing or fermentation methods. To our best knowledge, this is the first study focusing on the characterization of commercial NABs with participants from two different beer consumption countries, Finland and China. In addition, this study aimed to study and compare the perceptions and liking of NABs by the Chinese and Finnish consumer panels. The studied NABs in the sensory tests were designed to include three beer types (lager, IPA, pilsner), aiming to cover the most common NAB types in Finnish supermarkets. CATA and RATA methods were chosen for the sensory tests to provide rapid characterization of the concept products [27,37].
2. Materials and Methods
2.1. Non-Alcoholic Beer Samples
Commercially available NABs were purchased from the local supermarket or ordered online. For consumer tests in Finland and China, six NABs were selected from 30 commercial NABs by the chemical composition and the production methods. The NAB samples included four lagers (L), two Indian pale ales (IPA), and one pilsner (P; Table 1). One lager sample (L3) used in the Finnish consumer test was not available for the Chinese consumer test, and it was replaced with a Chinese lager-type NAB (L17).

Table 1.
Non-alcoholic beer samples used in the studies.
2.2. Participants in the Tests
Three consumer tests were conducted in 2023 and 2024. The detailed information on the participants are presented in Table 2. First one was carried out in Finland with Finnish consumers, the second and third ones were performed in China with two different participant groups. Recruitment criteria for the study held in Finland were that 50% of participants consumed NABs on a regular basis, 50% were regular beer users, and 50% of participants were between the age of 25 of 40 years and 50% between 46 and 55 years. Recruiting of consumers, data collection, and handling were carried out by Aistila Oy (Turku, Finland).
Table 2.
Characteristics of participant groups in consumer tests arranged in Finland and China.
The first study in China was carried out in Beijing Forestry University at College of Biological Sciences and Biotechnology (Beijing, China). The participants of this study were recruited from the students and staff members of Beijing Forestry University. The second study in China was conducted in a local bar in Beijing (China). The recruitment was performed by Beijing Zhongxin Zhicheng Business Consulting Co. (Beijing, China). The recruitment criteria for the Chinese group 2 were for participants to be regular beer drinkers, having 50% females and 50% males with the age range between 25 and 44 years.
All participants received written information about the study and then gave their written informed consent before participation. The present study was performed according to the principles established by the Declaration of Helsinki. The protocol of non-alcoholic beers conducted in Finland was approved by the Ethical Committee of the University of Turku (nr. 58/2022; approved 14 December 2022) for the consumer test conducted in Finland and by the Human Study Ethics Committee of Beijing Forestry University (BJFUPSY-2024-051; approved 13 August 2024) for the consumer test in China.
2.3. Sensory Tests in Finland and China
Three separate sensory characterization tests of NABs were carried out using untrained panels. To characterize NAB, the CATA method was used for odors and the RATA method for flavor intensities [35]. The CATA attribute list consisted of 19 descriptors for odors, and the RATA attribute list consisted of 20 descriptors for flavors presented on one page (Finland) or two descriptors side by side in ten rows (China) and in fixed order for all samples and panelists (Table S1). RATA was performed in nine-point intensity scales (categories from very mild to intense). Attributes on the CATA/RATA lists were based on the descriptive analysis and existing literature-related sensory properties of beers [40]. In each test, the participants were asked to rate the pleasantness and intensity of odor of samples in seven-point hedonic pleasantness scale (categories from 1 very unpleasant, 4 neither unpleasant or pleasant, and 7 very pleasant) and nine-point intensity scale (categories from very mild to intense), respectively, continuing to rate pleasantness of flavor in seven-point hedonic pleasantness scale (categories from 1 very unpleasant, 4 neither unpleasant or pleasant, and 7 very pleasant).
The questionnaires for the sensory evaluations were created with Compusense software (version 23 in Finland and 24.0.26998 in China, Compusense Inc., Guelph, ON, Canada), and the data were collected in Finnish in Finland and in Chinese in China using the software. The samples (six/study) were presented to the participants all at the same time in randomized order with three-digit random codes on the sample cups. The participants were instructed to examine the samples in the given order monadically, rate the pleasantness of odor and flavor and the intensity of the odor, and then select all possible CATA/RATA descriptors in the sample. Additionally, the participants were instructed to drink water to rinse their mouths between the samples. Sensory tests were organized in controlled laboratory conditions in individual sensory booths at the University of Turku, Finland, or at the Beijing Forestry University, China, and the second sensory test with Chinese participants was organized in a local bar in Beijing.
2.4. Statistical Analysis
The results from ANOVA using Tukey’s test of pleasantness ratings and the intensity differences in RATA, and the results from Cochran’s Q test of CATA were collected from Compusense standard report. IBM SPSS Statistics 28.0 (IBM Corporation, Armonk, NY, USA) was used to conduct an independent sample t-test. The independent sample t-test was conducted to see if there were significant differences in pleasantness of odor and flavor and odor intensity between each group and between the consumption clusters in each group. Principal component analyses (PCAs) were used to study the correlations between CATA attributes (citation rates by the consumer groups) and samples (n = 6 and one model containing all samples from these studies, n = 18). The PCA was chosen over correspondence analysis because the ratings of odor and flavor pleasantness, odor intensity, and the frequency of choosing samples as the most pleasant sample were included in the multivariate analysis.
3. Results
3.1. Sensory Descriptors of NAB
3.1.1. Characterization of NAB with Check-All-That-Apply
Summed-up citation rates for each evaluated NAB sample also showed differences between consumer groups (Table S2), although all consumer groups had most often described the odor of IPA6 (FI 4.29, CH1 4.89, CH2 4.33), which also had the most intense and pleasant odor (Table 3). CH groups chose “Fresh”, “Citrus”, “Fruity”, “Floral”, and “Sweet” odor descriptors to describe IPA6 more often than the FI group (Table S2). However, CH1 also least often described the flavor of IPA6 (4.17), whereas CH2 most often described the flavor of IPA6. FI and CH1 had the most often characterized flavor of the sample, which was not included in the other groups’ evaluations, but CH2 had described IPA1 most often. Finally, all groups characterized least often the flavor of P1 sample.
Table 3.
Odor and flavor pleasantness and odor intensity rates (mean ± standard deviation) by Finnish, Chinese group 1, and Chinese group 2.
The four most used odor descriptors were ‘Sweet’ (summed-up citation rate 1.68), ‘Fruity’ (1.56), ‘Citrus’ (1.25), and ‘Fresh’ (1.21) within FI; ‘Hops’ (2.77), ‘Fermented’ (2.37), ‘Malt’ (2.17), and ‘Fruity’ (1.88) within CH1; and ‘Hops’ (2.9), ‘Malt’ (2.27), ‘Fermented’ (1.93), and ‘Fresh’ (1.66) within CH2 (Table S2). The most used flavor descriptors were ‘Bitter’ (2.22), ‘Sour’ (1.61), ‘Hops’ (1.38), and ‘Fruity’ (1.2) within FI; ‘Bitter’ (3.22), ‘Hops’ (2,77), ‘Green’ (2,69), and ‘Sour’ (2.42) within CH1; and ‘Hops’ (2.88), ‘Fermented’ (2.11), ‘Malt’ (2.08), and ‘Sour’ (1.93) within CH2.
Seven principal component analysis (PCA) models were constructed with the results of odor and flavor pleasantness, odor intensity, frequency of selection as the most pleasant sample, and citation rates (Figure 1 and Figure S1a–e). The first two PCs of the PCA constructed with all CATA descriptors (n = 40) and the samples used in all consumer tests (n = 18) explained 51% of variance (PC1 31% and PC2 20%, Figure 1). Odor pleasantness and intensity are positively correlated with IPA6 samples described by Chinese participants (CH1 and CH2), whereas IPA6 described by Finnish consumers (FI) is more correlated with ‘Metallic’, ‘Pungent’, and ‘Roasted’ flavors. ‘The most pleasant sample’ is positively correlated with many variables, such as ‘Grassy’, ‘Neutral’, and ‘Fruity’ odors and ‘Smooth’, ‘Sweet’, and ‘Fruity’ flavors. Furthermore, flavor pleasantness is also positively correlated with the sample chosen most frequently as the most pleasant sample (L3 and L17), indicating flavor pleasantness to be important property in pleasantness of NAB.
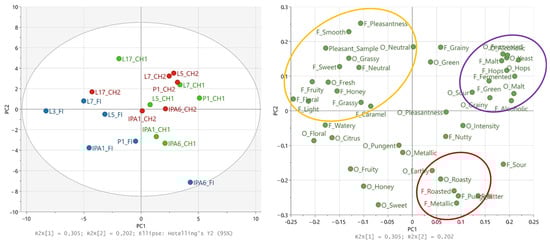
Figure 1.
Principal component analysis based on the citation rates from check-All-That-Apply (CATA) descriptors used to characterize non-alcoholic beer samples in three sensory tests (Table 2). Scores and loading plots for samples (n = 18) and variables (n = 40) studied in all sensory tests (blue: Finnish participants FI, green: Chinese group 1 CH1, red: Chinese group 2 CH2). L: lager, IPA: Indian pale ale, P: pilsner, O_: odor attribute, F_: flavor attribute, F/O_: Pleasantness flavor or odor ratings for pleasantness (Table 3), Pleasant_: frequency of sample chosen as the most pleasant sample. Orange, purple, and red ovals indicate grouping of variables.
All participation groups showed some similarities and differences in discrimination of NABs. FI and CH1 discriminated NABs by their flavor more similarly compared to CH2: lagers formed one group, and IPAs and pilsner formed another group (Figure S1b,d,f), whereas CH2 did not show similar grouping. Interestingly, the CATA results of CH2 grouped L7, IPA1, and IPA6 together and L5 and P1 together on PC2, and L17 negatively correlated with these two groups on PC1 (Figure S1e). In addition, CH2 has used different descriptors with L5, P1, and L7 compared to CH1.
PCA models (Figure S1a–e) constructed with data collected from FI, CH1, and CH2 show the positive correlation of IPA6 and many sensory variables, such as ‘Roasty’, ‘Malt’, and ‘Hops’, including both odor pleasantness and intensity. In addition, IPA6 is mostly negatively correlated with other samples in all PCAs, indicating FI and CH1 have evaluated it differently compared to other samples. Other samples were not as similarly described in CATA by the participants from different countries. Two most differently rated samples between FI and CH2 consumer groups were P1 and L7 based on the PCA (Figure 1). Based on the evaluation by FI, P1 positively correlated only with few descriptors, such as ‘Metallic’ and ‘Pungent’ odors, odor intensity, and ‘Honey’ flavor, whereas P1 as evaluated by CH2 positively correlated with higher number of descriptors, such as ‘Grainy’ and ‘Malt’ odors and ‘Alcoholic’, ‘Fermented’, and ‘Hops’ flavors. L7 as evaluated by FI positively correlated some descriptors, such as ‘Fresh’ odor and ‘Light’, ‘Neutral’, ‘Watery’, and ‘Floral’ flavors, whereas L7 in evaluation by CH2 positively correlated with ‘Yeast’, ‘Alcoholic’, and ‘Fermented’ odors and ‘Green’ and ‘Malt’ flavors.
In the PCAs containing flavor descriptors (Figure S1b,d,f), L3 and L17 positively correlated with the highest amount of flavor descriptors. Some of the descriptors are generally thought as positive characteristics, such as ‘Fruity’, and ‘Floral’, but some can be thought more as neutral, such as ‘Neutral’, or even negative, such as ‘Watery’. In addition, L3 and L17 negatively correlated with the IPA6 sample in every PCA (Figure S1a–f). Furthermore, all groups evaluated flavor of IPA6 as ‘Bitter’, ‘Metallic’, and ‘Pungent’ (Figure S1b,d,f), which are generally thought as more negative characteristics. In addition, IPA6 negatively correlated with the ‘Flavor pleasantness’ and the ‘Most pleasant sample’ in PCAs containing flavor descriptors (Figure S1b,d). Surprisingly, ‘Hops’ flavor negatively correlated with both IPA samples in PC2 in PCA constructed with the responses of Chinese participants (Figure S1d), whereas Finnish consumers described IPA6 with ‘Hops’ flavor.
Clear patterns between odor or flavor pleasantness or the most frequently chosen as the most pleasant sample and certain descriptors can be observed from the PCAs constructed with citation rates of odor or flavor descriptors from each participating group (Figure S1a–f). The PCA models constructed with citation rates obtained from FI (Figure S1a,b) showed a link between ‘Odor intensity’ and ‘Sweet’ odor and odor pleasantness. The PCA models constructed with citation rates obtained from CH1 (Figure S1c,d) showed the link between ‘Fresh’, ‘Citrus’, and ‘Floral’ odor descriptors and the odor pleasantness. Finally, the PCA models constructed with citation rates obtained from CH2 (Figure S1e,f) showed a link between ‘Fresh’ and ‘Honey’ odor descriptors and the odor pleasantness. Flavor descriptors ‘Smooth’, ‘Floral’, and ‘Fruity’ are linked to flavor pleasantness by FI, ‘Smooth’, ‘Light’, and ‘Neutral’ by CH1 and ‘Light’, ‘Sweet’, and ‘Honey’ by CH2. The sample rated as the most pleasant one is linked to ‘Floral’, ‘Fruity’, and ‘Light’ flavor by FI, ‘Sweet’, ‘Smooth’, and ‘Neutral’ flavors by CH1, and ‘Light’, ‘Sweet’, and ‘Honey’ by CH2.
3.1.2. Discrimination of NAB with Rate-All-That-Apply
Statistically significant differences between samples rated by FI were observed in seven RATA descriptors (Table S3), whereas only five were rated by CH1 and four rated by CH2. ‘Fruity’ was the only descriptor, which was statistically different between the samples for every group. The most ‘Fruity’ samples were L3 (FI) and L17 (CH1 and CH2). Even though, IPA6 was rated as the most ‘Bitter’ sample by every group, it was not statistically significantly different compared to other samples as rated by CH2. However, IPA6 was statistically significantly more bitter than every other sample, except P1 by FI and P1 and IPA1 by CH1. L3 and L17, the samples which were most often chosen as the most pleasant ones, were the least bitter, sour, malty, and alcoholic samples, whereas they were the most intensively fruity.
A PCA model was constructed using RATA intensity data obtained from all three groups. Twenty flavor descriptors (‘Caramel’ and ‘Nutty’ excluded) and flavor pleasantness rate as used variables (n = 21) and NABs as samples (n = 18; Figure 2). Surprisingly, samples are grouped differently than in the PCA model containing CATA data from all three groups (Figure 1): here, FI and CH1 samples were not separated from each other, and CH2 was grouped to the other side of loadings plot. RATA intensities showed a similar pattern between certain descriptors and flavor pleasantness: ‘Fruity’, ‘Neutral’, ‘Floral’, and ‘Smooth’ were linked to the flavor pleasantness on PC2 as they were also in the CATA PCA (Figure 1). ‘Sweet’, ‘Honey’, ‘Watery’, ‘Light’, and ‘Roasted’ are correlating with the samples most frequently chosen as the most pleasant ones by FI and CH1.
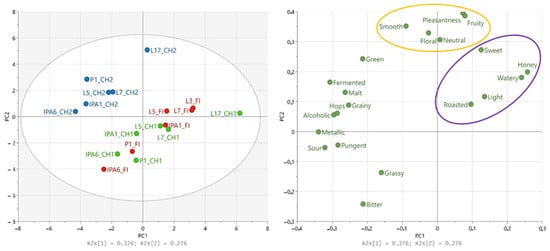
Figure 2.
Principal component analysis based on the intensities from Rate-All-That-Apply (RATA) descriptors (n = 19) used to characterize non-alcoholic beer samples (n = 18) and the flavor pleasantness of samples in three sensory tests (Table 2). Red: Finnish participants, green: Chinese group 1 participants, blue: Chinese group 2 participants. Orange and purple ovals indicate the grouping of variables.
3.1.3. Effects of Production Method on Discrimination of NAB
PCA models constructed with CATA citation rates (Figure 1) and RATA (Figure 2) were colored to better observe the effects of production methods on the discrimination of NAB samples. The citation rates do not show clear difference between the production methods (Figure S2), but the sample produced with reverse osmosis are all, except P1_FI, located on the positive side of PC1, indicating some similarities between the samples. The intensities obtained from RATA (Figure S2) showed also that the samples produced with reverse osmosis were more similar to each other compared to other samples. CH2 was further removed from the PCA data (Figure S3) because of clear difference on scale usage. In this PCA (Figure S3), two L5 samples, produced with fermentation, were also located nearer to each other, but still, they did not clearly separate from vacuum evaporation samples.
3.2. Acceptance Ratings of NABs
FI and CH1 rated IPA6 to have the most pleasant odor, whereas CH2 rated L17 with the most pleasant odor. In addition, IPA6 was rated with the most intense odor by FI and CH2, and the second most intense odor by CH1. However, IPA6 was rated as the least pleasant sample regarding flavor by all participant groups. FI rated L7 to have the most pleasant flavor, although it was only statistically significantly different compared to IPA6 with the least pleasant flavor. Surprisingly, L7 was not chosen most frequently as the most pleasant sample by FI: 38% of participants chose L3, and 27% chose L7 as the most pleasant sample (Table 3). The sample pleasantness may have depended more on the overall perception, because L3 was also rated with the second most pleasant odor, whereas L7 was only the fifth based on the odor pleasantness ranking by FI. L17 was clearly rated with the most pleasant flavor by CH1 and CH2, and it was also chosen most frequently as the most pleasant sample by both CH groups: 46% chose L17 as the most pleasant sample in CH1 and 34% in CH2 (Table 3). However, two Chinese participant groups were not in agreement with the second most pleasant sample: CH1 rated L5 (19%) as the second most pleasant sample, whereas CH2 rated both IPA1 and P1 (16%) as the second most pleasant samples, and L5 was only the fifth most pleasant sample (11%). IPA6 was least frequently rated as the most pleasant sample by all three groups.
Pleasantness of Odor and Flavor Between Consumption Clusters
The FI group did show statistically significant difference in IPA6 and P1: the odor and flavor pleasantness of IPA6 was rated higher by the FI participants, which consumed NAB more often (Table S4). The CH1 group showed only few statistically significant differences between the consumption groups: flavor pleasantness of L7 and the odor intensity of P1 were rated more pleasant or intense, respectively, by the participants who consumed NABs more often. CH2 showed only one statistically significant difference between the consumption groups: the flavor pleasantness of IPA1 was rated more pleasant by the participants who did not consume NABs so often or never.
Some differences were seen in the sample clustering in the PCAs constructed with the CATA results (Figure 1 and Figure S1a–e). The main difference was observed with the clusters in PCA constructed with CH2 data (Figure S1e). The differences could have been caused by the fact that participants in CH groups had different levels of experience with beer drinking. However, the Finnish consumers were also either regular NAB drinkers or regular beer drinkers, and the age range was more similar to CH2 than CH1 (Table 2), indicating that the different rating of the samples in CH2 and FI due to cultural differences in the Finnish and Chinese participants.
4. Discussion
4.1. Characterization of NAB with CATA and RATA
In our study, untrained panelists were able to discriminate NABs by using CATA. CATA is a simple and quick way to gather information about sensory characteristics from untrained consumers [27]. Consumers are able to use CATA terms accurately to describe sensory characteristics of food, consumers are using CATA terms similarly, and CATA results can show perceived difference in attribute intensity between the evaluated samples [28]. The CATA and RATA lists were translated first to English, then to Chinese, and translations were checked by two native Chinese speakers. However, translations of scale anchors, such as dislike, good, very good, and verbal anchors of the 9-point hedonic scale is difficult, because some languages do not have corresponding words, and may mislead participants [41]. In addition, scale scores are known to be affected by the cultural background: Asian participants have been reported to avoid expressing negative opinions and extreme answers compared to European and American participants [42]. In our study, CH2 participants used RATA scale scores differently compared to those of FI and CH1 (Figure 2). Scale usage differences may have been caused by the fact that the sensory test was made in the bar. Nijman et al. [43] studied how two different consumption locations (laboratory and bar) and evoked context effected on the hedonic preference of lager- and ale-type beers. They observed that some of the beer consumers were more sensitive for location change, and they evaluated beers differently based on the location [43]. Furthermore, RATA results of FI included more statistically significant discrimination of NABs compared to those of the CH results. Both anchor translations and use of scale score have been observed to affect the response styles [41].
The summed-up citation rate of IPA6 was the highest by all the groups (Table S2). This is most likely caused by the higher amount of hops used in IPA production [44]. However, some of the summed-up flavor citation rates of lager-type NABs were higher compared to IPAs. IPA NABs were evaluated as statistically significantly more bitter compared to lager NABs, which may have suppressed other flavors.
Generally, CH1 and CH2 participants often chose more characteristics to describe each NAB compared to FI. They used almost every odor and flavor descriptor more often compared to the Finnish participants. Only ‘Floral’, ‘Earthy’, and ‘Roasty’ odors and ‘Floral’, ‘Watery’, ‘Pungent’, and ‘Light’ flavors obtained higher summed-up citation rates calculated from the responses of FI compared to either of the CH groups (Table S2). This was also well seen in the descriptors used by the groups to describe the odor of IPA6: PCA figure showed clear correlation between IPA6 and odor descriptors for FI and CH groups (Figure 1). There were also some clear differences in types of descriptors used by the participant groups. For example, ‘Fermented’, ‘Hops’, and ‘Alcoholic’ odors were more often used by CH participants compared to the FI participants. In addition, only the FI group showed clearly statistically significant difference in ‘Hops’ odor between IPA and lager beers. This phenomenon may have been caused by the differences in conceptualization of the descriptor [45]. Kim et al. (2018) [45] observed that Korean, Chinese, and Western participants described ‘nuttiness’ differently. However, they did not observe difference in the intensity of nuttiness when it was evaluated from soy milk by participants from different countries. Furthermore, the intensity of ’Fruity’ descriptor was statistically significantly different between the samples in every group in our study. The familiarity of ‘Fruity’ flavor may have made it easy to evaluate, and, thus, it was rated in all samples. On the contrary, ‘Green’ was statistically significantly different within both CH groups but not within FI samples. ‘Green’ descriptor possibly had a different meaning to Chinese participants, or it has been clearer to them, making it easier to evaluate. Furthermore, ‘Hops’ flavor correlated differently between the participation groups in PCAs (Figure 1). The difference may be caused by the different conception of ‘Hops’ flavor between the participant groups.
4.2. Effects of Dealcoholization or Fermentation Methods
NABs used in this study were produced using different methods (Table 1). Different dealcoholizing methods have shown to result in different taste properties [46]. However, our results did not show clear difference between the beers of different production methods in CATA and RATA analyses. Similar results were reported in a previous study [17]. The difference between the samples were more likely caused by the differences in beer type than the production method. Only NABs produced with reverse osmosis were notably different from other NABs mostly by their more ‘Bitter’, ‘Grassy’, ‘Pungent’, and ‘Sour’ taste (Figure 1 and Figure 2). In a previous study, reverse osmosis was reported to decrease bitterness, total polyphenols, and volatile compounds, eventually affecting the sensory properties [20]. However, in our study, samples prepared with reverse osmosis were evaluated as the most bitter samples by every group. Ramsey et al. [20] reported that benzene rings or branches in the volatile compounds increased the retention in reverse osmosis dealcoholizing for those compounds compared to linear compounds. This can cause unbalanced and unpleasant sensory properties, because linear volatile compounds, such as ethyl esters and aldehydes, are typically important for fruity, citrus, and sweet aromas [29]. These aroma and flavor attributes correlated with the pleasantness of NAB samples also in our study.
Rettberg et al. [46] reported different production methods of NAB resulted in different physiochemical and sensory properties. For example, in their study, they observed vacuum and membrane dealcoholizing methods resulting in sourer and less aromatic NABs compared to mixed methods and fermentation [46]. Our results did not show similar results for vacuum-evaporated samples, but only for NABs prepared with reverse osmosis (IPA6 and P1), which were evaluated with a high sourness intensity by every group. Less sour samples were either produced with fermentation or vacuum evaporation methods. In addition, the NABs chosen most frequently as the most pleasant ones (L3 or L17) were least sour for the all three groups.
A clearer difference was observed between the NAB types: similar types of NABs correlated more with each other on CATA and RATA PCs (Figure 1 and Figure 2). Similar results were reported by [46]. They observed that the dealcoholizing method had only a minor effect on the flavor profile. For example, L3 and L7 were produced with biological and vacuum evaporation methods, respectively. Still, they correlated on both CATA and RATA PCAs when the results of FI are considered (Figure S1b and Figure 2). However, Rettberg et al. [46] also reported that fermentation with maltose-intolerance yeast resulted in the best quality of taste and overall harmony of sensory properties. This agreed with our results, which showed better sensory properties of NAB produced using biological method: L3 and L5 were produced with biological methods, and they both showed relatively high pleasantness of flavor by every group evaluating them.
4.3. Acceptance of NABs
All three consumer groups chose lager-type NAB as the most pleasant sample. Similar results have been reported [29]. They studied NABs with chemical and sensory techniques to clarify which compounds are responsible for the “beer flavor” in NABs and which kind of NABs Northern Californian consumers like. They reported North Californian consumers to be satisfied with lager- and wheat-type NABs due to their fruity, sweet, and honey aromas. The same research group has also published another publication from the same NAB data [30]. In this later study, they concluded that Northern Californian consumers preferred NABs with more soda-like, such as fruity and sweet, aromas over NABs with a more beer-like aroma. In addition, Moss et al. (2022) [14] observed that sweet and aromatic characteristics drove Canadian participants to like certain NAB or regular beers. These results are consistent with our findings: participant groups from both Finland and China preferred the samples which they described with ‘Fresh’ odor and ‘Fruity’, ‘Floral’, and ‘Sweet’ flavors and found the samples described with ‘Sour’, ‘Bitter’, ‘Fermented’, and ‘Pungent’ flavors, among others, less pleasant (Figure 1 and Figure 2). The sweetness of NABs may have also suppressed the bitterness, making them more preferable for participants [25].
Bitterness is generally undesirable taste in foods and beverages. Bitterness of beer is caused by isomerized α-acids originating from hops [47], and sweetness suppresses bitterness. Sweetness is mainly caused by different mono- and dimeric sugars, but many volatile compounds can affect the total sweetness perception [48]. Production method of NAB affects the final volatile compound contents and, thus, possibly decreases the intensity of sweetness. For example, separation of ethanol with thermal (e.g., vacuum evaporation) or membrane method (e.g., reverse osmosis) removes partially or totally also other volatile compounds, affecting the final sensory properties [49]. Bitterness has been previously reported to decrease the pleasantness of NABs [29]. In our study, unpleasantness of bitterness in NABs was also observed; both IPA samples and P1 were rated the most bitter samples and the least frequently chosen as the most pleasant sample. Blackmore et al. (2022) [50] demonstrated in their study that the color of regular beer or NAB affects the expected and perceived bitterness, refreshment, and body of beer. They observed that darker colored beers were expected and perceived as more bitter and fuller body. In our study, we did not ask participants to evaluate color properties of NAB, but they were not hidden either. In out study, the color of NABs was not evaluated. However, IPA6 was clearly darker colored than other evaluated NABs, and this may have had an effect on how participants evaluated its bitterness.
When both IPA’s and pilsner’s most pleasant sample ratings were combined, they were together chosen as the most pleasant ones by 18% (FI), 19% (CH1), or 41% (CH2) of participants. Pleasantness of bitter beers is previously connected to experience, gender, and age of consumers, and more experienced older male consumers like more bitter beers more than less experienced younger females [51]. However, this phenomenon was not seen in our results. Furthermore, personality traits may have a positive effect on the liking of bitter beer [52]. Indeed, a recent study observed that certain personality traits, such as Sensation seeker, are positively related to pale ale beer consumption and bitter taste perception [52]. More studies are still needed to determine if the NAB consumers choose NAB types with certain taste profiles similarly to regular beer consumers.
4.4. Effects of Familiarity
Familiarity and cultural differences have been reported to affect the comprehensive liking (appearance, aroma, taste, and texture) of food products [53]. Familiarity, previous knowledge, and interest in beers are reported to be better explainers for liking than demographics [53]. In addition, more familiar regular beers have been observed to be concerned as appropriate drinks in varying situations as refreshment compared to less familiar ones [54]. In the same study, they also observed that the level of familiarity strongly correlated with usage versality. Furthermore, Gliszczyńska-Świgło et al. [55] observed that habit is one of the most important factors influencing the decision to purchase NABs. However, another study has reported that people still experience negative taste properties compared to regular beer, affecting the willingness to purchase NABs [56].
In our study, all consumer groups most frequently chose beer with origin from the same country to be the most pleasant one, likely due to the taste being familiar to the participants. In addition, consumers who more often consume NABs found NABs more pleasant compared to the consumers who less often consume NABs, which is in accordance with a previous study by Wakihira et al. (2025) [57]. When NABs are consumed more often, they become more familiar and they can become a habit, further making it easier for consumers to anticipate the taste properties.
As mentioned before, the consumption of NABs have increased rapidly in the last decade [1]. The same phenomenon was observed with craft beers in the 2010s, and after that, their consumption and production increased. Studies have shown that similar demographic segments which were interested in craft beers are now interested in NABs [2,3,4,58]. It is possible that more consumers will find NABs pleasant when they become more common. In future studies, the usage level of NABs and its changes could be studied to see if the familiarity of NABs has the same effects on the usage situations and versality as has been reported with regular beer [54].
4.5. Effects of Labeling as Non-Alcoholic
The knowledge of samples to be alcohol-free may have affected the rating of pleasantness of NABs. Liking of beer may increase directly by actual alcohol content and indirectly by labeled alcohol content [50]. This study also reported that labeling beers as “0.0% ABV” lowered participants’ expectations of liking them. A recent study by Wakihira et al. [57] confirmed this result with Japanese alternative beer (less than 1% ethanol) and regular beer users. In their study, Wakihira et al. observed that the satisfaction level of alternative beers significantly decreased when the NAB was labeled as “less than 1%” within regular beer users. In addition, labeling NABs decreased the wanting level of both “less than 1%” beers within both beer user groups. They also observed that regular beers had higher satisfaction levels compared to “less than 1%” beers. Furthermore, Silva et al. [17] observed that labeling NAB as beer significantly increased the liking. In addition, labeling beer as NAB did not change the liking but reduced six positive emotions, namely comforted, good, happy, loving, joyful, and exuberant [17]. The knowledge of drinking NAB may have affected the ratings of pleasantness of odor and flavor in our study. Fifty percent of recruited Finnish consumers were regular NAB users, and the other 50% were interested in NABs. Between the FI consumption groups (Table S4), a statistically significant difference in the odor and flavor pleasantness was only observed for IPA6: participants consuming more NABs found the odor and flavor of IPA6 more pleasant. In our sensory tests in China, we did not have NAB consumption as a recruitment criterion for Chinese participants. However, 18.5% of CH1 and 62.5% of CH2 participants reported consuming NABs “weekly” or “a few times a month” (Table S4). Similarly to FI, CH consumption groups showed only little statistically significant difference for the odor and flavor pleasantness (Table S4): within the CH1 consumption groups, only the flavor pleasantness of L7 was rated significantly higher by the participants consuming NABs more often, and, within CH2 consumption groups, less-often-consuming participants found the flavor of IPA1 more pleasant than the ones consuming NABs more often. Knowledge about beers has reported to decrease the perceived complexity [40], which then shifts the hedonic response to more positive. In addition, mere exposure to novel foods and beverages, such as craft beers or NABs, can shift the preference to complex or novel products, in this case NABs [59].
4.6. Limitations of the Study
During our study, sample L3 was removed from production, and it was not available for consumer tests held in China; therefore, a new Chinese sample (L17) was added to the sample set used in China. The sample was chosen because it was also a lager and it represented well Chinese beers. This reflects well the fast-changing selection of NABs and the difficulty to develop a good NAB which is still profitable after some years.
In this study, color, mouthfeel, bubble size, or fullness of beer were not considered when sensory properties of NABs were evaluated. However, the intensity of carbonation and mouthfeel of regular beer and NABs have been identified as important characteristics when evaluating different kinds of beers [7,14,60,61]. Carbonation has a great impact on the mouthfeel and release of flavors [60]. However, most of the physical methods used to dealcoholize beers also remove carbon dioxide, making an additional carbonation step necessary in NAB production [22]. The added carbonation usually has bigger bubbles compared to natural carbonation, making the mouthfeel harsher. This can further affect the overall liking of the NAB product.
CATA has been demonstrated as a powerful tool to discriminate food and beverage samples by consumer panel [26,39]. In this study, CATA and RATA descriptors were given in Finnish to Finnish evaluators and in Chinese to Chinese evaluators. Still, the descriptors can be misunderstood, or, as in this study, they may be mistranslated when the test was moved to another culture. To reduce the effect of translation, Chinese translations were checked by two Chinese food scientists to be sure that they were correct. Moreover, CATA questions may be asked together with evaluation of ‘ideal product’, i.e., to describe the ideal non-alcoholic beer in this case, and assessed using penalty analysis [26]. With this methodology, instead of only identifying the key sensory attributes driving the liking or disliking, the effects of deviations between real products and the ‘ideal’ on hedonic ratings are assessed. Thus, assessing the ‘ideal product’ with penalty analysis may provide more information and directions for the beverage industry to reformulate and develop new NABs.
5. Conclusions
Participant groups from Finland and China were able to characterize and discriminate the non-alcoholic beer samples produced with different methodologies. In addition, clear differences between different beer types were observed within all groups, but dealcoholizing or fermentation methods only had a small effect on the discrimination. The lager-type non-alcoholic beers were described with ‘Fresh’ odor, and ‘Fruity’, ‘Floral’, and ‘Sweet’ flavors were more often chosen as the most pleasant sample; IPAs were found less frequently pleasant, described with ‘Sour’, ‘Bitter’, ‘Fermented’, and ‘Pungent’ flavors, among others. In addition, the samples most frequently chosen as the most pleasant sample correlated with a high number of descriptors, indicating a more complex flavor profile to be a pleasant property for non-alcoholic beers. The high intensities of ‘Fruity’ flavor and lower intensities of ‘Bitter’, ‘Sour’, ‘Malty’, and ‘Alcoholic’ indicated sample pleasantness more often. The pleasantness of non-alcoholic beers correlated more with flavor pleasantness than odor pleasantness. Chinese participants often chose more characteristics to describe each NAB compared to Finnish participants. In addition, they used almost every odor and flavor descriptor more often compared to the Finnish participants. Furthermore, Finnish and Chinese participants most frequently chose the typical beer type for their culture as the most pleasant sample. In addition, all participation groups agreed more about the pleasantness of the flavor of NABs compared to the pleasantness of odor. However, differences between the samples in pleasantness of odor and flavor and odor intensities were only slightly affected by the frequency of NAB consumption inside participation groups. Some differences were observed when the groups were compared. The Chinese participants rated pleasantness and odor intensities higher than the Finnish group.
This study confirmed findings on the key sensory properties of liked non-alcoholic beers from previous studies, such as pleasantness of fruity flavor and sweet taste in non-alcoholic beer. Even though this study did not observe clear differences in beer preferences between two studied cultures, the Finnish and the Chinese, the results showed that non-alcoholic beers originating from certain region are also accepted in corresponding cultures, and consumers from different cultures use descriptors in different rates. This result emphasizes the importance of NAB producers to take into account the target markets and the local odor and flavor preferences when introducing new products. No clear connection was found between the production method of non-alcoholic beers and consumers’ acceptance, indicating that all production methods can be used to produce non-alcoholic beers with accepted sensory properties. Even though consumption of non-alcoholic beers have been increasing over several years, their familiarity level can still be low, affecting how the sensory properties are perceived. In addition, consumers may still have negative assumptions of taste properties of non-alcoholic beers, further affecting the perceived pleasantness. More studies are still needed on impacts of familiarity on the pleasantness of non-alcoholic beers. Furthermore, future studies are also needed in the field of consumers of non-alcoholic beer to establish stable non-alcoholic beer markets with products pleasing the consumers.
Supplementary Materials
The following supporting information can be downloaded at: https://www.mdpi.com/article/10.3390/beverages11020047/s1, Figure S1: Principal component analysis based on the citation rates from Check-All-That-Apply (CATA) descriptors used to characterize non-alcoholic beer samples in three sensory tests (Table 2). (a) odors (n = 19) by Finnish (FI) participants; (b) flavors (n = 21) by FI participants; (c) odors (n = 19) by Chinese group 1 (CH1) participants; (d) flavors (n = 21) by CH1 participants; (e) odors (n = 19) by Chinese group 2 (CH2) participants; (f) flavors (n = 21) by CH2 participants. L lager, IPA Indian pale ale, P pilsner, O odor, F flavor, Pleasant_Sample frequency of sample chosen as the most pleasant sample. Figure S2: Principal component analysis based on the citation rates from Check-All-That-Apply (CATA) descriptors used to describe non-alcoholic beer samples in three sensory tests (Table 2). Scores and loading plots for samples (n = 18) and variables (n = 40) studied in all sensory tests. Orange NABs produced with vacuum evaporation, Purple NABs produced with reverse osmosis, and Light green NABs produced with fermentation technologies. Figure S3: Principal component analysis based on the intensities from Rate-All-That-Apply (RATA) descriptors used to rate non-alcoholic beer samples in Finland (FI) and China group 1 (CH1; Table 2). Scores and loading plots for samples (n = 12) and variables (n = 16; Table S4) studied. Orange NABs produced with vacuum evaporation, Purple NABs produced with reverse osmosis, and Light green NABs produced with fermentation technologies. Table S1: Check-all-that-apply and Rate-All-That-Apply descriptors in Finnish and English. Table S2: Citation rates from Check-All-That-Apply for odor and flavor descriptors (see separate Excel file). Table S3: Rate-All-That-Apply intensities for flavor descriptors (see separate Excel file). Table S4: Pleasantness of odor and flavor and intensity of odor in non-alcoholic beer samples compared by consumption habits of non-alcoholic beers.
Author Contributions
N.K.: Conceptualization; data curation; formal analysis; funding acquisition; investigation; methodology; supervision; validation; visualization; writing—original draft. Y.Z.: investigation; methodology; writing—review and editing. T.R.: formal analysis; investigation; methodology; writing—review and editing. B.Y.: resources; writing—review and editing. B.Z.: resources; writing—review and editing. O.L.: conceptualization; data curation; methodology; supervision; validation; writing Conceptualization; Data curation; Methodology; Supervision; Validation; —review and editing. All authors have read and agreed to the published version of the manuscript.
Funding
This research was funded by the Southwestern Finland Regional Funds of the Finnish Cultural Foundation (85222197) and the Finnish Food Research Foundation, and the Turku University Foundation (081650).
Institutional Review Board Statement
The present study was performed according to the principles established by the Declaration of Helsinki. The sensory evaluation protocol of non-alcoholic beers conducted in Finland was approved by the Ethical Committee of the University of Turku (nr. 58/2022; approved 14 December 2022) for the consumer test conducted in Finland, and by the Human Study Ethics Committee of Beijing Forestry University (BJFUPSY-2024-051; approved 13 August 2024) for the consumer test in China.
Informed Consent Statement
Informed consent was obtained from all subjects involved in the study.
Data Availability Statement
Data available on request due to restrictions.
Acknowledgments
Yunuo Li, Xiaoyi Liu, Guiying Qian, Lijuan Yang, Xiaoyue Hu, and Chuncao Yin are thanked for their help in contribution on organizing the sensory evaluation in Beijing Forestry University.
Conflicts of Interest
The authors declare no conflicts of interest.
Abbreviations
The following abbreviations are used in this manuscript:
| NAB | Non-alcoholic beer |
| IPA | Indian pale ale |
| L | Lager |
| P | Pilsner |
| PCA | Principal component analysis |
| FI | Finnish participant |
| CH1 | Chinese participant group 1 |
| CH2 | Chinese participant group 2 |
References
- Statista Market Forecast. Statista Non-Alcoholic Beer—Worldwide. Available online: https://www.statista.com/outlook/cmo/alcoholic-drinks/beer/non-alcoholic-beer/worldwide (accessed on 12 March 2025).
- Statista Consumer Insights Global Target Audience: Non-Alcoholic Beer Drinkers in Germany. Available online: https://www.statista.com/study/137170/target-audience-non-alcoholic-beer-drinkers-in-germany/ (accessed on 12 March 2025).
- Statista Consumer Insights Global Target Audience: Non-Alcoholic Beer Drinkers in the United States. Available online: https://www.statista.com/study/137175/target-audience-non-alcoholic-beer-drinkers-in-the-united-states/ (accessed on 12 March 2025).
- Statista Consumer Insights Global Target Audience: Non-Alcoholic Beer Drinkers in the United Kingdom. Available online: https://www.statista.com/study/144762/target-audience-non-alcoholic-beer-drinkers-in-the-united-kingdom/ (accessed on 12 March 2025).
- World Health Organization. Status Report on Alcohol Consumption, Harm and Policy Responses in 30 European Countries; The Regional Office for Europe of the World Health Organization: Copenhagen, Denmark, 2019. [Google Scholar]
- Kokole, D.; Jané Llopis, E.; Anderson, P. Non-Alcoholic Beer in the European Union and UK: Availability and Apparent Consumption. Drug Alcohol Rev. 2021, 41, 550–560. [Google Scholar] [CrossRef] [PubMed]
- Krebs, G.; Müller, M.; Becker, T.; Gastl, M. Characterization of the Macromolecular and Sensory Profile of Non-Alcoholic Beers Produced with Various Methods. Food Res. Int. 2019, 116, 508–517. [Google Scholar] [CrossRef] [PubMed]
- Pipinen, L.; Heikkinen, O. Alkoholittomien Juomien Myynti Tuki Panimoteollisuutta Koronavuonna 2020. Available online: https://www.sttinfo.fi/tiedote/alkoholittomien-juomien-myynti-tuki-panimoteollisuutta-koronavuonna-2020?publisherId=69817389&releaseId=69901770 (accessed on 24 January 2022).
- Interesse China’s Beer Market: Outlook and Opportunities. Available online: https://www.china-briefing.com/news/chinas-beer-market-outlook-and-opportunities/ (accessed on 4 June 2024).
- Beer in China. Available online: https://oec.world/en/profile/bilateral-product/beer/reporter/chn (accessed on 7 March 2025).
- Wang, O.; Gellynck, X.; Verbeke, W. Chinese Consumers and European Beer: Associations between Attribute Importance, Socio-Demographics, and Consumption. Appetite 2017, 108, 416–424. [Google Scholar] [CrossRef] [PubMed]
- Anderson, P.; O’Donnell, A.; Kokole, D.; Jané Llopis, E.; Kaner, E. Is Buying and Drinking Zero and Low Alcohol Beer a Higher Socio-Economic Phenomenon? Analysis of British Survey Data, 2015–2018 and Household Purchase Data 2015–2020. Int. J. Environ. Res. Public Health 2021, 18, 10347. [Google Scholar] [CrossRef]
- Katainen, A.; Uusitalo, L.; Saarijärvi, H.; Erkkola, M.; Rahkonen, O.; Lintonen, T.; Fogelholm, M.; Nevalainen, J. Who Buys Non-Alcoholic Beer in Finland? Sociodemographic Characteristics and Associations with Regular Beer Purchases. Int. J. Drug Policy 2023, 113, 103962. [Google Scholar] [CrossRef]
- Moss, R.; Barker, S.; McSweeney, M.B. An Analysis of the Sensory Properties, Emotional Responses and Social Settings Associated with Non-Alcoholic Beer. Food Qual. Prefer. 2022, 98, 104456. [Google Scholar] [CrossRef]
- Day, I.; Deroover, K.; Kavanagh, M.; Beckett, E.; Akanbi, T.; Pirinen, M.; Bucher, T. Australian Consumer Perception of Non-Alcoholic Beer, White Wine, Red Wine, and Spirits. Int. J. Gastron. Food Sci. 2024, 35, 100886. [Google Scholar] [CrossRef]
- Silva, A.P.; Jager, G.; van Bommel, R.; van Zyl, H.; Voss, H.-P.; Hogg, T.; Pintado, M.; de Graaf, C. Functional or Emotional? How Dutch and Portuguese Conceptualise Beer, Wine and Non-Alcoholic Beer Consumption. Food Qual. Prefer. 2016, 49, 54–65. [Google Scholar] [CrossRef]
- Silva, A.P.; Jager, G.; Voss, H.-P.; van Zyl, H.; Hogg, T.; Pintado, M.; de Graaf, C. What’s in a Name? The Effect of Congruent and Incongruent Product Names on Liking and Emotions When Consuming Beer or Non-Alcoholic Beer in a Bar. Food Qual. Prefer. 2017, 55, 58–66. [Google Scholar] [CrossRef]
- Adamenko, K.; Kawa-Rygielska, J.; Kucharska, A.Z. Characteristics of Cornelian Cherry Sour Non-Alcoholic Beers Brewed with the Special Yeast Saccharomycodes Ludwigii. Food Chem. 2020, 312, 125968. [Google Scholar] [CrossRef]
- Gernat, D.C.; Brouwer, E.; Ottens, M. Aldehydes as Wort Off-Flavours in Alcohol-Free Beers—Origin and Control. Food Bioprocess Technol. 2020, 13, 195–216. [Google Scholar] [CrossRef]
- Ramsey, I.; Yang, Q.; Fisk, I.; Ayed, C.; Ford, R. Assessing the Sensory and Physicochemical Impact of Reverse Osmosis Membrane Technology to Dealcoholize Two Different Beer Styles. Food Chem. X 2021, 10, 100121. [Google Scholar] [CrossRef] [PubMed]
- Ramsey, I.; Yang, Q.; Fisk, I.; Ford, R. Understanding the Sensory and Physicochemical Differences between Commercially Produced Non-Alcoholic Lagers, and Their Influence on Consumer Liking. Food Chem. X 2021, 9, 100114. [Google Scholar] [CrossRef] [PubMed]
- Salanță, L.C.; Coldea, T.E.; Ignat, M.V.; Pop, C.R.; Tofană, M.; Mudura, E.; Borșa, A.; Pasqualone, A.; Zhao, H. Non-Alcoholic and Craft Beer Production and Challenges. Processes 2020, 8, 1382. [Google Scholar] [CrossRef]
- Brendel, S.; Hofmann, T.; Granvogl, M. Dry-Hopping to Modify the Aroma of Alcohol-Free Beer on a Molecular Level—Loss and Transfer of Odor-Active Compounds. J. Agric. Food Chem. 2020, 68, 8602–8612. [Google Scholar] [CrossRef]
- Bellut, K.; Arendt, E.K. Chance and Challenge: Non-Saccharomyces Yeasts in Nonalcoholic and Low Alcohol Beer Brewing—A Review. J. Am. Soc. Brew. Chem. 2019, 77, 77–91. [Google Scholar] [CrossRef]
- Bauwens, J.; van Opstaele, F.; Eggermont, L.; Weiland, F.; Jaskula-Goiris, B.; De Rouck, G.; De Brabanter, J.; Aerts, G.; De Cooman, L. Comprehensive Analytical and Sensory Profiling of Non-Alcoholic Beers and Their Pale Lager Beer Counterparts. J. Inst. Brew. 2021, 127, 385–405. [Google Scholar] [CrossRef]
- Ares, G.; Jaeger, S.R. Chapter 12—Check-All-That-Apply (CATA) Questions with Consumers in Practice: Experimental Considerations and Impact on Outcome. In Rapid Sensory Profiling Techniques, 2nd ed.; Delarue, J., Lawlor, J.B., Eds.; Woodhead Publishing Series in Food Science, Technology and Nutrition; Woodhead Publishing: Cambridge, UK, 2023; pp. 257–280. ISBN 978-0-12-821936-2. [Google Scholar]
- Jaeger, S.R.; Beresford, M.K.; Lo, K.R.; Hunter, D.C.; Chheang, S.L.; Ares, G. What Does It Mean to Check-All-That-Apply? Four Case Studies with Beverages. Food Qual. Prefer. 2020, 80, 103794. [Google Scholar] [CrossRef]
- da Silva, W.B.; Santos, W.W.V.; dos Santos Silva, M.E.; da Silva, S.P. Evaluation of Trends and Future Prospects in the Use of the Descriptive Check-All-That-Apply Method. Food Sci. Biotechnol. 2025, 34, 1–11. [Google Scholar] [CrossRef]
- Lafontaine, S.; Senn, K.; Dennenlöhr, J.; Schubert, C.; Knoke, L.; Maxminer, J.; Cantu, A.; Rettberg, N.; Heymann, H. Characterizing Volatile and Nonvolatile Factors Influencing Flavor and American Consumer Preference toward Nonalcoholic Beer. ACS Omega 2020, 5, 23308–23321. [Google Scholar] [CrossRef]
- Lafontaine, S.; Senn, K.; Knoke, L.; Schubert, C.; Dennenlöhr, J.; Maxminer, J.; Cantu, A.; Rettberg, N.; Heymann, H. Evaluating the Chemical Components and Flavor Characteristics Responsible for Triggering the Perception of “Beer Flavor” in Non-Alcoholic Beer. Foods 2020, 9, 1914. [Google Scholar] [CrossRef] [PubMed]
- Sandilya, S.; Oroya, N.; Moral, T.; Vázquez-Araújo, L. Effect of Recipient’s Tactile Properties and Expectations on Beer Perception. Beverages 2023, 9, 75. [Google Scholar] [CrossRef]
- Jaeger, S.R.; Chheang, S.L.; Jin, D.; Ryan, G.S.; Ares, G. How Do CATA Questions Work? Relationship between Likelihood of Selecting a Term and Perceived Attribute Intensity. J. Sens. Stud. 2023, 38, e12833. [Google Scholar] [CrossRef]
- Varela, P.; Ares, G. Sensory Profiling, the Blurred Line between Sensory and Consumer Science. A Review of Novel Methods for Product Characterization. Food Res. Int. 2012, 48, 893–908. [Google Scholar] [CrossRef]
- Jaeger, S.R.; Chheang, S.L.; Jin, D.; Roigard, C.M.; Ares, G. Check-All-That-Apply (CATA) Questions: Sensory Term Citation Frequency Reflects Rated Term Intensity and Applicability. Food Qual. Prefer. 2020, 86, 103986. [Google Scholar] [CrossRef]
- Byeon, Y.S.; Heo, J.; Kim, M.-R.; Kim, S.S. Investigation on Consumer Perception and Acceptance of Wheat Beer Using Sorted Napping and Rate-All-That-Apply (RATA) Questions. Int. J. Food Sci. Technol. 2023, 58, 4770–4779. [Google Scholar] [CrossRef]
- Ivanova, N.; Yang, Q.; Bastian, S.E.P.; Wilkinson, K.L.; Johnson, T.E.; Ford, R. The Impact of Varying Key Sensory Attributes on Consumer Perception of Beer Body. Food Qual. Prefer. 2023, 112, 105004. [Google Scholar] [CrossRef]
- Ares, G.; Bruzzone, F.; Vidal, L.; Cadena, R.S.; Giménez, A.; Pineau, B.; Hunter, D.C.; Paisley, A.G.; Jaeger, S.R. Evaluation of a Rating-Based Variant of Check-All-That-Apply Questions: Rate-All-That-Apply (RATA). Food Qual. Prefer. 2014, 36, 87–95. [Google Scholar] [CrossRef]
- Vidal, L.; Ares, G.; Hedderley, D.I.; Meyners, M.; Jaeger, S.R. Comparison of Rate-All-That-Apply (RATA) and Check-All-That-Apply (CATA) Questions across Seven Consumer Studies. Food Qual. Prefer. 2018, 67, 49–58. [Google Scholar] [CrossRef]
- Jeong, S.; Lee, J. Effects of Cultural Background on Consumer Perception and Acceptability of Foods and Drinks: A Review of Latest Cross-Cultural Studies. Curr. Opin. Food Sci. 2021, 42, 248–256. [Google Scholar] [CrossRef]
- Reinbach, H.C.; Giacalone, D.; Ribeiro, L.M.; Bredie, W.L.P.; Frøst, M.B. Comparison of Three Sensory Profiling Methods Based on Consumer Perception: CATA, CATA with Intensity and Napping®. Food Qual. Prefer. 2014, 32, 160–166. [Google Scholar] [CrossRef]
- Ares, G. Methodological Issues in Cross-Cultural Sensory and Consumer Research. Food Qual. Prefer. 2018, 64, 253–263. [Google Scholar] [CrossRef]
- Chen, C.; Lee, S.; Stevenson, H.W. Response Style and Cross-Cultural Comparisons of Rating Scales Among East Asian and North American Students. Psychol. Sci. 1995, 6, 170–175. [Google Scholar] [CrossRef]
- Nijman, M.; James, S.; Dehrmann, F.; Smart, K.; Ford, R.; Hort, J. The Effect of Consumption Context on Consumer Hedonics, Emotional Response and Beer Choice. Food Qual. Prefer. 2019, 74, 59–71. [Google Scholar] [CrossRef]
- Salamon, R.V.; Dabija, A.; Ferencz, Á.; Tankó, G.; Ciocan, M.E.; Codină, G.G. The Effect of Dry Hopping Efficiency on β-Myrcene Dissolution into Beer. Plants 2022, 11, 1043. [Google Scholar] [CrossRef]
- Kim, S.-H.; Petard, N.; Hong, J.-H. What Is Lost in Translation: A Cross-Cultural Study to Compare the Concept of Nuttiness and Its Perception in Soymilk among Korean, Chinese, and Western Groups. Food Res. Int. 2018, 105, 970–981. [Google Scholar] [CrossRef]
- Rettberg, N.; Lafontaine, S.; Schubert, C.; Dennenlöhr, J.; Knoke, L.; Diniz Fischer, P.; Fuchs, J.; Thörner, S. Effect of Production Technique on Pilsner-Style Non-Alcoholic Beer (NAB) Chemistry and Flavor. Beverages 2022, 8, 4. [Google Scholar] [CrossRef]
- King, B.M.; Moreau, N. A Comparison of Bitter Perception in High-Alcohol, Low-Alcohol and Alcohol-Free Beer. J. Inst. Brew. 1996, 102, 419–425. [Google Scholar] [CrossRef]
- Holt, S.; Miks, M.H.; de Carvalho, B.T.; Foulquié-Moreno, M.R.; Thevelein, J.M. The Molecular Biology of Fruity and Floral Aromas in Beer and Other Alcoholic Beverages. FEMS Microbiol. Rev. 2019, 43, 193–222. [Google Scholar] [CrossRef]
- Piornos, J.A.; Koussissi, E.; Balagiannis, D.P.; Brouwer, E.; Parker, J.K. Alcohol-Free and Low-Alcohol Beers: Aroma Chemistry and Sensory Characteristics. Compr. Rev. Food Sci. Food Saf. 2023, 22, 233–259. [Google Scholar] [CrossRef]
- Blackmore, H.; Hidrio, C.; Yeomans, M.R. How Sensory and Hedonic Expectations Shape Perceived Properties of Regular and Non-Alcoholic Beer. Food Qual. Prefer. 2022, 99, 104562. [Google Scholar] [CrossRef]
- Haddad, F.F.; Vieira, K.C.; Carneiro, J.d.D.S. Influence of Consumption Experience on the Behavior of Craft Beer Consumers: Beginner and Experienced Consumers. Br. Food J. 2023, 126, 682–697. [Google Scholar] [CrossRef]
- Higgins, M.J.; Bakke, A.J.; Hayes, J.E. Personality Traits and Bitterness Perception Influence the Liking and Intake of Pale Ale Style Beers. Food Qual. Prefer. 2020, 86, 103994. [Google Scholar] [CrossRef]
- Torrico, D.D.; Fuentes, S.; Gonzalez Viejo, C.; Ashman, H.; Dunshea, F.R. Cross-Cultural Effects of Food Product Familiarity on Sensory Acceptability and Non-Invasive Physiological Responses of Consumers. Food Res. Int. 2019, 115, 439–450. [Google Scholar] [CrossRef]
- Giacalone, D.; Frøst, M.B.; Bredie, W.L.P.; Pineau, B.; Hunter, D.C.; Paisley, A.G.; Beresford, M.K.; Jaeger, S.R. Situational Appropriateness of Beer Is Influenced by Product Familiarity. Food Qual. Prefer. 2015, 39, 16–27. [Google Scholar] [CrossRef]
- Gliszczyńska-Świgło, A.; Klimczak, I.; Klensporf-Pawlik, D.; Rybicka, I. Quality Characteristics and Consumer Perception of Non-Alcoholic Beers in the Context of Responsible Alcohol Consumption. Sci. Rep. 2025, 15, 7145. [Google Scholar] [CrossRef]
- Staub, C.; Contiero, R.; Bosshart, N.; Siegrist, M. You Are What You Drink: Stereotypes about Consumers of Alcoholic and Non-Alcoholic Beer. Food Qual. Prefer. 2022, 101, 104633. [Google Scholar] [CrossRef]
- Wakihira, T.; Visalli, M.; Schlich, P. Effects of Alcohol Content Information on Sensory Perception and Satisfaction of Full Portions of Regular Beers and Beer Alternatives Consumed at Home. Food Qual. Prefer. 2025, 128, 105478. [Google Scholar] [CrossRef]
- Hernández-Mora, Y.N.; Verde-Calvo, J.R.; Malpica-Sánchez, F.P.; Escalona-Buendía, H.B. Consumer Studies: Beyond Acceptability—A Case Study with Beer. Beverages 2022, 8, 80. [Google Scholar] [CrossRef]
- Jaeger, S.R.; Worch, T.; Phelps, T.; Jin, D.; Cardello, A.V. Preference Segments among Declared Craft Beer Drinkers: Perceptual, Attitudinal and Behavioral Responses Underlying Craft-Style vs. Traditional-Style Flavor Preferences. Food Qual. Prefer. 2020, 82, 103884. [Google Scholar] [CrossRef]
- Gonzalez Viejo, C.; Fuentes, S.; Howell, K.; Torrico, D.D.; Dunshea, F.R. Integration of Non-Invasive Biometrics with Sensory Analysis Techniques to Assess Acceptability of Beer by Consumers. Physiol. Behav. 2019, 200, 139–147. [Google Scholar] [CrossRef]
- Habschied, K.; Krstanović, V.; Mastanjević, K. Beer Quality Evaluation—A Sensory Aspect. Beverages 2022, 8, 15. [Google Scholar] [CrossRef]
Disclaimer/Publisher’s Note: The statements, opinions and data contained in all publications are solely those of the individual author(s) and contributor(s) and not of MDPI and/or the editor(s). MDPI and/or the editor(s) disclaim responsibility for any injury to people or property resulting from any ideas, methods, instructions or products referred to in the content. |
© 2025 by the authors. Licensee MDPI, Basel, Switzerland. This article is an open access article distributed under the terms and conditions of the Creative Commons Attribution (CC BY) license (https://creativecommons.org/licenses/by/4.0/).