Abstract
Streams and rivers of the Luquillo Experimental Forest, Puerto Rico, have been the subject of extensive watershed and aquatic research since the 1980s. This research includes understanding stream export of nutrients and coarse particulate organic matter, physicochemical constituents, aquatic fauna populations and community structure. However, many of the streams and watersheds studied do not appear in standard scale maps. We document recent collaborative and multi-institutional work to improve hydrological network information and identify knowledge gaps. The methods used to delimit and densify stream networks include establishment and incorporation of an updated new vertical datum for Puerto Rico, LIDAR derived elevation, and a combination of visual-manual and automated digitalization processes. The outcomes of this collaborative effort have resulted in improved watershed delineation, densification of hydrologic networks to reflect the scale of on-going studies, and the identification of constraining factors such as unmapped roadways, culverts, and other features of the built environment that interrupt water flow and alter runoff pathways. This work contributes to enhanced knowledge for watershed management, including attributes of riparian areas, effects of road and channel intersections and ridge to reef initiatives with broad application to other watersheds.
Keywords:
streams; non-perennial streams; DEM; flow paths; watersheds; runoff; ecology; story-maps; Caribbean; tropics 1. Introduction
Hydrological maps are used for decision-making, and there is an implicit expectation that they are accurate representations of the landscape conditions they illustrate. For those who work along forested montane streams, hydrological maps have until recently only partially conveyed information about perennial and non-perennial channels in the landscape. Mapping of freshwater resources and their associated landscape features, including potential catchment areas, small-scale watersheds, and floodplains is of vital importance to understanding the Caribbean region [1,2] ridge to reef ecosystem connections and more globally for developing research on disturbance along hydrologic networks [3]. Freshwater in the Caribbean is a complex resource that can be scarce and limited for consumption [4], affect forest ecosystems and aquatic fauna [5,6], or become a management challenge during storms and floods [7]. In mountainous areas, headwater streams are prone to flash floods with a rapid onset of high flows and then an equally rapid return to baseflow conditions [8]. It is precisely these smaller order streams in headwater systems that are often not documented in standard or continental scale (1:20,000) maps, despite their global importance to ecosystem processes such as greenhouse gas exchange [9]. The maps at 1:20,000 were meant for a specific designation or fitness for use because of the scale and the associated level of detail. These maps were valid for the municipal and regional levels, and not meant for specific sites such as research watersheds, and their associated hydrological networks. As the LEF has been under forest cover consistently and under cloud cover often, mapping this steep and complex terrain has always been a challenge for land surveyors to conduct field work. With the availability of improved and accessible remote sensing technologies (e.g., Light Detection and Ranging, LiDAR) in combination with long-term stream ecology research, we are now able to rethink our understanding of these aquatic systems and move forward to identify gaps in the research needed to improve watershed ecological knowledge.
2. Methods
2.1. Study Site
The Luquillo Experimental Forest (LEF) is located in the Luquillo mountain range, northeastern Puerto Rico (Figure 1). The LEF is home to the Luquillo Long-Term Ecological Research (LUQ-LTER) program and the Luquillo Critical Zone Observatory (LCZO), both of which have been funded by the US National Science Foundation (NSF) [10,11]. The 11,330 hectares (28,000 acres) area is the only tropical forest in the USDA Forest Service National Forest System and bears two official names: El Yunque National Forest and LEF, which refers to the forest’s additional designation as a research experimental forest [10], encompassing the entire National Forest and nearby forested and developed areas as a research area.
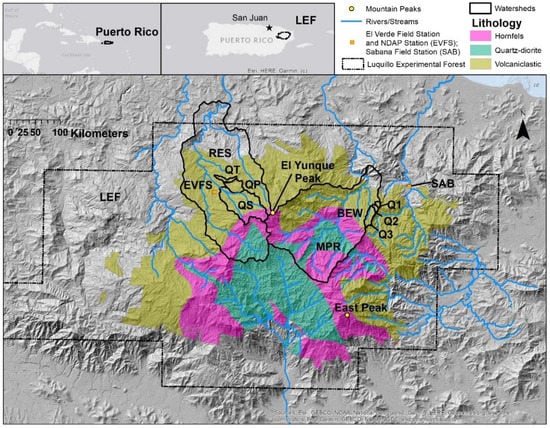
Figure 1.
Map of the Luquillo Mountains of Puerto Rico and the Luquillo Experimental Forest (LEF). (panel b) Colors represent major lithology types and the watersheds discussed here. MPR: Mameyes at Puente Roto contains the subcatchments Q1-3: Bisley 1,2, and 3 (Bisley Experimental Watershed: BEW); RES: Río Espíritu Santo contains the subcatchements QS: Quebrada Sonadora; QP: Quebrada Prieta; QT: Quebrada Toronja. Inset maps show the position of the LEF in Northeastern Puerto Rico and the position of Puerto Rico in the broader Caribbean.
2.2. Data Needs for Densification of the Hydrographic Network
The combined investment of various agencies through time has made possible the current and ongoing work of hydrological network densification taking place in the LEF. The cumulative process among State and Federal agencies and integration of products to establish the baseline for producing the densification of the hydrographic network started two decades ago (Figure 2). In the past, to generate detailed topographic maps involved methods such as conducting plane table surveying and taking elevations in the field. Although these resulted in maps with an appropriate level of detail, this was cumbersome as it required moving people and equipment through forested areas to take x, y, z readings plus bearing angles. In a steep and forested landscape such as the LEF this work could take years from the initial field campaign to data compilation, and the final actual placement on a map at the scale of 1 in 20,000. Starting in 2002, the National Geodetic Survey (NGS-NOAA) began to carry out the geodetic leveling process for Puerto Rico [12]. This geodetic leveling process was financed by three agencies in Puerto Rico; PR Office of Management and Budget (agency initials in Spanish/English, OGP/PROMB); Electric Power Authority (AEE/PREPA); Department of Transportation and Public Works (DTOP/PRDOTPW), and the Engineers and Land Surveyors Corps [13].

Figure 2.
Process to generate the digital elevation model and the densified hydrographic network.
The geodetic survey of Puerto Rico was the fundamental and critical component to generating a reliable mathematical model (geoid) that would allow the production of elevation data (Figure 1). The development of the local geoid/geodetic model (Puerto Rico Vertical Datum 2002, PRVD02) was a necessary precursor, that established sufficient elevational benchmarks, to enable collection of and integration with other spatial data resources (e.g., USGS, LiDAR) and create a finely detailed 1 m2 DEM. After the new vertical datum for Puerto Rico was published in 2010 (PRVD02), the United States Geological Survey (USGS), through the 3D Elevation Program (3DEP [14], financed the generation of elevation data via aerial LiDAR surveys. This survey was able to cover greater than 98% of the Puerto Rican archipelago with only a small portion of the southeast of the main island not surveyed due to constant cloud cover. Once the LiDAR data set was produced, then it could be downloaded from the USGS site, and used to generate the digital bare-earth elevation model which has a spatial resolution of 1 square meter per cell. For the first time in Puerto Rico we were able to obtain a digital model of high resolution and accurate elevations, from which multiple levels of data can be extracted (Figure 3).
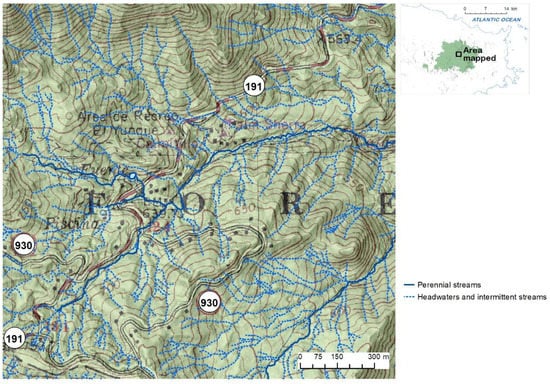
Figure 3.
Detail of the derived surface model and the topographic map (panel a, top figure).
2.3. Processing Decisions and Trade-Offs in Generating a Hydrographic Network
Since the elevation model generated based on LiDAR and the new datum provides a high degree of detail, and in the absence of a densified hydrographic product for the LEF area, we decided to experiment by generating a much denser hydrographic network than currently available. This step allowed us to identify and illustrate hydrologic networks where long-term ecological research has been taking place in the LEF [15,16].
3. Results
3.1. The Sonadora Sub-Watershed and Stream Systems, a Long-Term Research Area Densification Case Study
Part of the Espíritu Santo Watershed, the Quebrada Sonadora (QS) stream flows from El Yunque Peak (1010 m elevation) through the El Verde Research Area (EVRA). Improved mapping of this sub-watershed and its hydrological network will allow researchers to better apply findings from long term observations to other headwater streams and watersheds in the LEF and elsewhere in the Caribbean. Initial field work in the 1980s on the Quebrada Sonadora, for example, revealed that the 2 stream channels shown on USGS topographic quadrangles [17] greatly underestimate perennial channels in this basin, limiting the ability to characterize the entire drainage network (Figure 4).
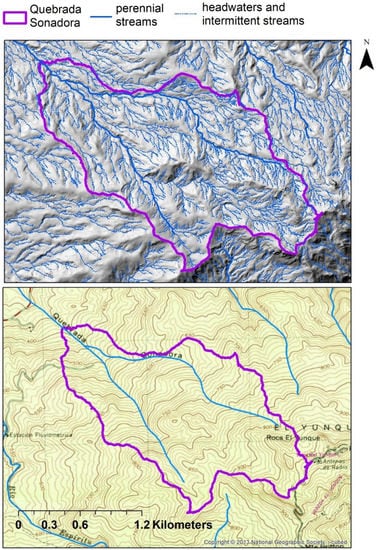
Figure 4.
Bottom panel: Delineation of the Quebrada Sonadora sub-watershed boundary (purple color outline) with the two permanent bodies of water shown on USGS quadrangle topographic maps. Top panel: densification, with flow accumulation ≥ 2000 cells. This densification registers 1216 elements within the Sonadora watershed. Most headwaters and tributaries shown are perennial. Long-term monitoring shows that headwaters in the easternmost portion of the Sonadora headwaters, for example, are perennial up to 50–100 m from the ridge.
Use of a flow accumulation of ≥2000 cells results in a drainage network of just over 1200 elements, identifying both perennial and non-perennial runoff. Using the automated method as a guide, on a flow accumulation of ≥10,000 cells (one cell = 1 m2), the network consists of 123 elements within the sub-watershed. Generating and validating items with this level of detail using a flow accumulation threshold ≥ 2000 cells, and an average scale of 1:200, can be cumbersome and time consuming within each square kilometer.
LiDAR was flown in 2010–2011 as part of the Luquillo Critical Zone Observatory [18] and watershed delineations were generated based on a bare earth Digital Elevation Model (DEM) created from that LiDAR data. This dataset originally had a number of issues such as lack of coverage at high elevations due to cloud cover when the flights were conducted, low LiDAR point cloud densities (also due to cloud cover) and other artifacts. As a result, older USGS quadrangle 10 square meter DEMs were used to fill in the gaps. With the availability of the new USGS LiDAR based on a 1 square meter DEM, these watersheds were delineated again. This resulted in better defined watersheds for many of the sampling sites and corrected flow paths. In some cases, due to the rugged terrain in the LEF, narrow ridges that are the boundaries between watersheds were sometimes missed and flow paths were misrouted when using the 10 m2 DEM. Using the flow accumulation from the 10 m2 DEM results in the flow path for Quebrada Prieta A (QPA) being misrouted into the Quebrada Toronja (QT) (Figure 5). Use of the 1 m2 DEM successfully identified the ridge that forms the boundary between Quebrada Prieta (QP) and QT, and the watershed flow paths are corrected for the first time in a map product that that agrees with field observations (Figure 5).
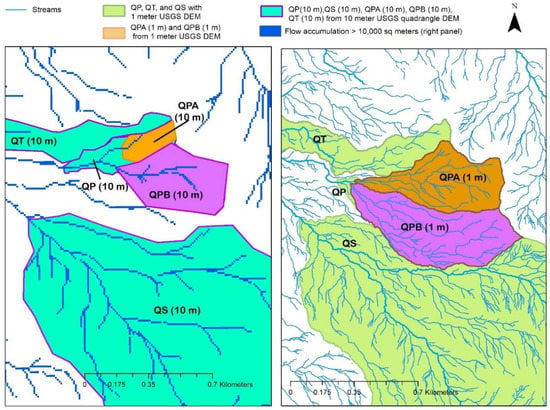
Figure 5.
Map of streams in the El Verde Research area. Left panel contains stream networks derived from 10 square meter DEM from USGS quadrangle maps, right panel includes streams derived from 1 square meter USGS DEM. Watersheds derived from 10 m DEM are labeled (10 m). The watersheds outlined are QT: Quebrada Toronja; QP: Quebrada Prieta; QPA: Quebrada Prieta A; QPB: Quebrada Prieta B; QS: Quebrada Sonadora.
3.2. Other or Ongoing Challenges of Work within the LEF and Surrounding Landscape
The work of densifying the hydrographic network will not be limited to the research example watersheds. The goal is to cover the entire area of the LEF. After consulting LUQ LTER and USDA Forest Service scientists who conduct research in the study area, a flow accumulation threshold of ≥5000 cells or 0.5 hectare (ha) was established. Flow paths below 0.5 ha could be derived but a flow accumulation of 0.5 ha is likely well below the threshold for perennial streams and channel formation; overland flow still occurs along flow paths with areas below 0.5 ha during high intensity rainfall events [19].
We generated the flow accumulation model process using the ArcGIS Pro 2.4 program: DEM > Depression-less DEM > Flow Direction > Flow Accumulation > Linework derivation (stream to feature).
This last step, the stream to feature geoprocessing tool converts the flow accumulation raster to vector format from a specified accumulation threshold. Limitations to this method include bridges or road culverts that are not registered in the base map nor in the DEM. However, with the high-resolution DEM we can find grooves that indicate a path or route for flow and manual adjustments can be made.
Raster-based flow accumulation of <1000 square meters (1 m2 cells) becomes too dense (Figure 6) and impractical to field validate, and thus the threshold >5000 square meter provides the optimal details needed for current applications for watershed and aquatic research needs.
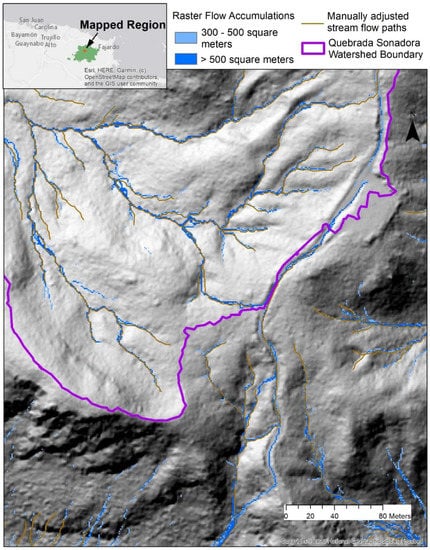
Figure 6.
Here we show the raster based flow accumulation down to 300 m2, with the manually adjusted stream flow path features in brown. This level of detail is not practical at the landscape scale due to the amount of effort it would require. However, was done here for an intensively studied Quebrada Sonadora watershed.
Figure 7 shows a manually validated hydrological network with a threshold ≥ 5000 accumulated cells (5000 square meters). Previous work in the BEW used a 6-ha threshold [20] from field knowledge. However, it is evident that this threshold is too high in many parts of the LEF and use of a lower threshold such as 5000 cells is more appropriate as shown in Figure 7. Here we can see clear flow paths in the hillshade up to near the watershed boundary.
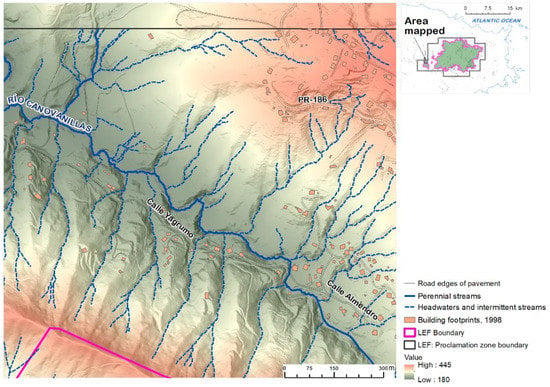
Figure 7.
Example of headwaters, intermittent flow paths, and perennial channels derived from a threshold ≥5000 accumulated cells (0.5 ha).
To organize and record daily work over the LEF, a grid of one square kilometer was arranged for the study area. Considering the threshold ≥5000 accumulated cells, each 1 km frame can take several hours of computing time and researcher review to process and validate the hydrological network, depending on the number of generated flow paths and flow diversions caused by road/trail surfaces and roadside channels/culverts. The presence of anthropogenic channels and surfaces requires a significant investment of time and researcher validation to interpret and correct flow paths through the built environment. Sometimes it is not possible to find the groove or depression that connects flow networks, making this work susceptible to errors. Follow up field work can help validate these flow path corrections.
4. Discussion
4.1. Ongoing Work with Densified Hydrological Networks
In the case of the LEF, the densified hydrological networks can be combined with other products like the high-resolution Goddard’s Lidar, Hyperspectral and Thermal, G-LiHT, [21] aerial photography from flights flown by NASA in 2017 and 2018 and rendered together using tools such as ArcGIS story maps or journal maps to show more detailed views of study areas [15]. Such story maps are now available on the Luquillo LTER website, illustrating the immediate integration of densified hydrological networks with other ecological site information [https://luq.lternet.edu/ (accessed on 3 January 2021)]. More accurate hydrological networks and watershed delineations will aid researchers in identifying study sites, correctly identifying a location within a reach or watershed, and integrating complementary data on aquatic ecosystems and their ecological communities.
Initial work with the densified hydrological networks included analyzing watersheds to determine the percent area of different lithologies [22], mean elevation, mean precipitation [23], mean annual runoff based on estimated annual rainfall [24] as shown in Table 1. Many of these datasets are available on Hydroshare [25,26] and presented as a story map https://arcg.is/1XfiO4 (accessed on 3 January 2021) [15]. Watershed delineations have been completed for more than 36 watersheds above long-term water quality research locations with the aim to better understand the variability in water quality due to factors such as variability in lithology, landcover, forest cover type, slope and other factors.

Table 1.
Zonal statistics for watersheds delineated using 1-m and 10-m resolution DEMs. Notes: Cubic meters per second (CMS) is mean annual discharge (following Pike and Scatena 2008 [27]), mean annual precipitation is derived from the model presented in Murphy et al. 2017 [23].
4.2. Opportunities and Challenges to Improve Watershed Ecological Knowledge
A suggested next step is to create a more appropriate definition of flow accumulation areas to establish perennial streams based on concurrent variation in mean annual rainfall across the landscape [24,27]. Establishing a threshold beyond the previously established 6 ha value developed for specific conditions in the watersheds of the BEW [20] is needed to enhance the value of this newly available 1 m DEM. This advances our understanding of headwater streams, which have ephemeral responses to flow and are tightly coupled to catchment hillslope processes, including the accumulation of organic matter and sediments [28,29]. Drought conditions in the Caribbean region and specifically the LEF are predicted to increase in frequency [30,31]. One outstanding issue is how changing environmental conditions may alter the dynamics of riparian forest organic matter inputs to stream ecosystems [32]. As a basal resource for stream fauna communities the effects of accumulation of leaflitter in non-perennial network streams and the pulsed input of nutrients and organic matter when either seasonal or flash-flood event flows are established can now be quantified. For example, in temperate systems, non-perennial streams have been estimated to contribute up to 10% of the daily CO2 emission from perennial rivers and streams [33]. The newly densified hydrology in the LEF long-term research catchments/watersheds will allow the quantification of ecosystem process such as CO2 emissions from tropical headwater perennial and non-perennial streams, which are important elements in carbon cycling assessments [9].
Future research in hydrological and ecosystem science will now be able to investigate differences in the distribution and conditions of intermittent and ephemeral streams, stratified by geological substrates, elevation, and forest types. Flash-flood hazard potential and risks assessment identification in headwater areas could also be improved [34]. Additionally, work quantifying connectivity and drought conditions of stream reaches in relation to the ecology of migratory aquatic fauna [4,5,35] can elucidate the role of headwater streams previously not identified in hydrological maps. The re-delineated and densified hydrological networks presented here provide more accurate depictions of discharge and stream habitats, opening up new lines of knowledge development and practical applications.
Author Contributions
Conceptualization, T.H.-S., M.C.L. and I.S.; methodology led by, I.S., and further integrated by M.C.L. and W.H.M.; original draft preparation, writing, reviewing review and editing by all authors. All authors have read and agreed to the published version of the manuscript.
Funding
This research was funded in part by NSF and LTER (BSR-9911902 and BSR-8811764) grants to the University of Puerto Rico and USDA Forest Service, International Institute for Tropical Forestry. Authors received support from their institutions; the PRITS supported I.S.; UNH LUQ LTER (NSF DEB-1831952) and LCZO (NSF EAR-1331841) supported M.C.L. and USDA FS T.H.-S. Partial funding was provided by the New Hampshire Agricultural Experiment Station, and this is Scientific Contribution Number 2886. This work was supported by the USDA National Institute of Food and Agriculture McIntire-Stennis Project (1019522).
Institutional Review Board Statement
Not Applicable.
Informed Consent Statement
Not Applicable.
Data Availability Statement
The data presented in this study are openly available in HydroShare [doi:10.4211/hs.1c8ffe88d6ec46bca853fd836bd2948e], additional data are available through referenced datasets, please see references for the locations/addresses in References section.
Acknowledgments
We would like to thank Olga M. Ramos González of the USDA Forest Service International Institute for Tropical Forestry for providing feedback on an early draft of this manuscript. All research at the International Institute of Tropical Forestry, USDA Forest Service, is done in collaboration with the University of Puerto Rico (UPR). Field work for the development of the geodetic survey included contributions from many engineers, land surveyors and also the academic personnel, students, and staff associated to UPR-Mayagüez. The findings, conclusions, and views expressed in this manuscript are those of the authors and do not necessarily represent the views of the USDA Forest Service nor PRITS.
Conflicts of Interest
The authors declare no conflict of interest.
References
- Carlson, R.R.; Foo, S.A.; Asner, G.P. Land use impacts on coral reef health: A ridge-to-reef perspective. Front. Mar. Sci. 2019, 6, 562. [Google Scholar] [CrossRef]
- Pringle, C.M. Threats to US public lands from cumulative hydrologic alterations outside of their boundaries. Ecol. Appl. 2000, 10, 971–989. [Google Scholar] [CrossRef]
- Allen, G.H.; Pavelsky, T.M. Global extent of rivers and streams. Science 2018, 361, 585–588. [Google Scholar] [CrossRef] [PubMed]
- Heartsill Scalley, T. Freshwater resources in the insular Caribbean: An environmental perspective. Caribb. Stud. 2012, 40, 63–93. [Google Scholar] [CrossRef]
- Smith, W.E.; Kwak, T.J. Tropical insular fish assemblages are resilient to flood disturbance. Ecosphere 2015, 6, 1–16. [Google Scholar] [CrossRef]
- Gutiérrez-Fonseca, P.E.; Ramírez, A.; Pringle, C.M.; Torres, P.J.; McDowell, W.H.; Covich, A.; Crowl, T.; Pérez-Reyes, O. When the rainforest dries: Drought effects on a montane tropical stream ecosystem in Puerto Rico. Freshw. Sci. 2020, 39, 197–212. [Google Scholar] [CrossRef]
- Colón-Rivera, R.J.; Feagin, R.A.; West, J.B.; López, N.B.; Benítez-Joubert, R.J. Hydrological modification, saltwater intrusion, and tree water use of a Pterocarpus officinalis swamp in Puerto Rico. Estuar. Coast. Shelf Sci. 2014, 147, 156–167. [Google Scholar] [CrossRef]
- Pike, A.S.; Scatena, F.N.; Wohl, E.E. Lithological and fluvial controls on the geomorphology of tropical montane stream channels in Puerto Rico. Earth Surf. Process. Landforms 2010, 35, 1402–1417. [Google Scholar] [CrossRef]
- Horgby, Å.; Segatto, P.L.; Bertuzzo, E.; Lauerwald, R.; Lehner, B.; Ulseth, A.J.; Vennemann, T.W.; Battin, T.J. Unexpected large evasion fluxes of carbon dioxide from turbulent streams draining the world’s mountains. Nat. Commun. 2019, 10, 4888. [Google Scholar] [CrossRef] [PubMed]
- Harris, N.L.; Lugo, A.E.; Brown, S.; Heartsill-Scalley, T. Luquillo Experimental Forest: Research History and Opportunities; Experimental Forest and Range EFR-1; USDA Forest Service: Washington, DC, USA, 2012; 152p. Available online: https://www.fs.usda.gov/detail/iitf/research/?cid=fseprd488601 (accessed on 12 March 2021).
- Brantley, S.L.; Megonigal, J.P.; Scatena, F.N.; Balogh-Brunstad, Z.; Barnes, R.T.; Bruns, M.A.; Van Cappellen, P.; Dontsova, K.; Hartnett, H.E.; Hartshorn, A.S.; et al. Twelve Testable Hypotheses on The Geobiology of Weathering. Geobiology 2011, 9, 140–165. [Google Scholar] [CrossRef] [PubMed]
- Doyle, D.R.; Smith, D.A. Definition and Densification of the Puerto Rico Vertical Datum of 2002. Surv. Land Inf. Sci. 2012, 72, 109–118. [Google Scholar]
- Cifuentes, E. Crean un Mecanismo para Estudiar la faz de la Tierra. El Nuevo Dia, 17 March 2002; 32–33. [Google Scholar]
- Arundel, S.T.; Archuleta, C.M.; Phillips, L.A.; Roche, B.L.; Constance, E.W.U.S. Geological Survey Techniques and Methods: Book 11. In 1-Meter Digital Elevation Model Specification; U.S. Geological Survey: Reston, VA, USA, 2015; Chapter B7; 25p. [Google Scholar] [CrossRef]
- Leon, M.C.; Heartsill-Scalley, T.; Santiago, I.; McDowell, W.H. Watersheds and Stream Networks in the Luquillo Experimental Forest, Puerto Rico; HydroShare: Cambridge, MA, USA, 2021. [Google Scholar] [CrossRef]
- McDowell, W.; Leon, M.; Shattuck, M.; Potter, J.; Heartsill-Scalley, T.; Gonzalez, G.; Shanley, J. Luquillo Experimental Forest: Catchment Science in the Montane Tropics. Authorea Preprints. 2020. Available online: https://www.authorea.com/doi/full/10.22541/au.160193299.93849714 (accessed on 12 March 2021).
- U.S. Geological Survey. National Geospatial Program US Topo Product Standard, EL Yunque, PR Quadrangle; U.S. Geological Survey: Reston, VA, USA, 2011.
- Luquillo Critical Zone Observatory. Luquillo Critical Zone Observatory 2010–2011 LiDAR Survey for the Rio Mameyes and Rio Blanco Watersheds; NCALM, NSF EAR-0922307; HydroShare: Cambridge, MA, USA, 2011. [Google Scholar] [CrossRef]
- Schellekens, J.; Scatena, F.N.; Bruijnzeel, L.A.; van Dijk, A.I.J.M.; Groen, M.M.A.; van Hogezand, R.J.P. Stormflow generation in a small rainforest catchment in the Luquillo Experimental Forest, Puerto Rico. Hydrol. Process. 2004, 18, 505–530. [Google Scholar] [CrossRef]
- Pike, A.S. Application of Digital Terrain Analysis to Estimate Hydrological Variables in the Luquillo Mountains of Puerto Rico; Conference Proceeding; IAHS-AISH Publication: Wallingford, UK, 2006; pp. 81–85. Available online: https://iahs.info/uploads/dms/13640.18-81-85-78-308-Pike.pdf (accessed on 12 March 2021).
- Cook, B.D.; Nelson, R.F.; Middleton, E.M.; Morton, D.C.; McCorkel, J.T.; Masek, J.G.; Ranson, K.J.; Ly, V.; Montesano, P.M. NASA Goddard’s Lidar, Hyperspectral and Thermal (G-LiHT) airborne imager. Remote Sens. 2013, 5, 4045–4066. [Google Scholar] [CrossRef]
- Bawiec, W.J. (Ed.) Geology, Geochemistry, Geophysics, Mineral Occurrences and Mineral Resource Assessment for the Commonwealth of Puerto Rico; Open-File Report 98-038; U.S. Geological Survey: Reston, VA, USA, 1999; available online only.
- Murphy, S.F.; Stallard, R.F.; Scholl, M.A.; González, G.; Torres-Sánchez, A.J. Reassessing rainfall in the Luquillo Mountains, Puerto Rico: Local and global ecohydrological implications. PLoS ONE 2017, 12, e0180987. [Google Scholar] [CrossRef] [PubMed]
- Pike, A.S.; Scatena, F.N. Longitudinal Patterns in Stream Channel Geomorphology and Aquatic Habitat in the Luquillo Mountains of Puerto Rico. Ph.D. Thesis, University of Pennsylvania, Philadelphia, PA, USA, 2008. [Google Scholar]
- Leon, M.C. LCZO–GIS/Map Data–Puerto Rico–(1998–2012), HydroShare. 2020. Available online: http://www.hydroshare.org/resource/cabf89b7f00f4dd4ab2c556f10aae0ef (accessed on 12 March 2021).
- Leon, M.C. LCZO-GIS/Map Data-GIS Web Map and Datasets-Northeastern Puerto Rico-(1998–Ongoing), HydroShare. 2020. Available online: http://www.hydroshare.org/resource/663a9d44e9a24b2391b2903b2bb266fc (accessed on 12 March 2021).
- Strauch, A.M.; MacKenzie, R.A.; Giardina, C.P.; Bruland, G.L. Climate driven changes to rainfall and streamflow patterns in a model tropical island hydrological system. J. Hydrol. 2015, 523, 160–169. [Google Scholar] [CrossRef]
- Sidle, R.C.; Gomi, T.; Tsukamoto, Y. Discovery of zero-order basins as an important link for progress in hydrogeomorphology. Hydrol. Process. 2018, 32, 3059–3065. [Google Scholar] [CrossRef]
- Gomi, T.; Sidle, R.C.; Richardson, J.S. Understanding processes and downstream linkages of headwater systems: Headwaters differ from downstream reaches by their close coupling to hillslope processes, more temporal and spatial variation, and their need for different means of protection from land use. BioScience 2002, 52, 905–916. [Google Scholar]
- Taylor, M.A.; Stephenson, T.S.; Chen, A.A.; Stephenson, K.A. Climate change and the Caribbean: Review and response. Caribb. Stud. 2012, 40, 169–200. [Google Scholar] [CrossRef]
- Herrera, D.A.; Ault, T.R.; Fasullo, J.T.; Coats, S.J.; Carrillo, C.M.; Cook, B.I.; Williams, A.P. Exacerbation of the 2013–2016 pan-Caribbean drought by anthropogenic warming. Geophys. Res. Lett. 2018, 45, 10619–10626. [Google Scholar] [CrossRef]
- Heartsill-Scalley, T.; Scatena, F.N.; Moya, S.; Lugo, A.E. Long-term dynamics of organic matter and elements exported as coarse particulates from two Caribbean montane watersheds. J. Trop. Ecol. 2012, 28, 127–139. Available online: https://www.jstor.org/stable/41411841 (accessed on 12 March 2021). [CrossRef]
- Datry, T.; Foulquier, A.; Corti, R.; Von Schiller, D.; Tockner, K.; Mendoza-Lera, C.; Clement, J.C.; Gessner, M.O.; Moleon, M.; Stubbington, R.; et al. A global analysis of terrestrial plant litter dynamics in non-perennial waterways. Nat. Geosci. 2018, 11, 497–503. [Google Scholar] [CrossRef]
- Sidle, R.C.; Tsuboyama, Y.; Noguchi, S.; Hosoda, I.; Fujieda, M.; Shimizu, T. Stormflow generation in steep forested headwaters: A linked hydrogeomorphic paradigm. Hydrol. Process. 2000, 14, 369–385. [Google Scholar] [CrossRef]
- Covich, A.P.; Crowl, T.A.; Heartsill-Scalley, T. Effects of drought and hurricane disturbances on headwater distributions of palaemonid river shrimp (Macrobrachium spp.) in the Luquillo Mountains, Puerto Rico. J. N. Am. Benthol. Soc. 2006, 25, 99–107. [Google Scholar] [CrossRef]
Publisher’s Note: MDPI stays neutral with regard to jurisdictional claims in published maps and institutional affiliations. |
© 2021 by the authors. Licensee MDPI, Basel, Switzerland. This article is an open access article distributed under the terms and conditions of the Creative Commons Attribution (CC BY) license (http://creativecommons.org/licenses/by/4.0/).