Abstract
The impact of drought is intensifying due to climate change, leading to significant environmental consequences, particularly concerning river water quality. While drought is typically classified as meteorological or hydrological, studies assessing its environmental impacts remain limited. Drought-induced hydrological alterations in rivers often degrade water quality, necessitating the development of an environmental drought index. This study introduces a novel methodology for calculating an index to evaluate the effects of drought on river water quality, specifically applied to tributaries of the Nakdong River in South Korea. The index was constructed by reviewing existing water quality and drought indices, selecting relevant parameters, and weighting each factor following the National Sanitation Foundation Water Quality Index (NSFWQI) methodology. Factors integrated into the index encompass both meteorological and hydrological indicators, with priority given to variables measurable in real time. Real-time parameters—such as flow rate, cumulative precipitation, days without rainfall, and sensor-based metrics (pH, electrical conductivity [EC], dissolved oxygen [DO], and total organic carbon [TOC])—were incorporated. Additionally, for rivers with upstream dams, dam discharge data were included to reflect its influence on flow conditions. The applicability of the calculated index was assessed by comparing index values to observed water quality data. A class interval structure was implemented to enhance the index’s usability across diverse riverine conditions. Furthermore, the utility of the index was validated by comparing it to the basin’s target water quality, thereby assessing its sensitivity to drought-induced water quality deterioration. The environmental drought index proposed in this study enables the proactive and real-time monitoring of water quality under drought conditions. When applied to 10 tributaries of the Nakdong River, the index demonstrated a clear correlation between drought conditions and water quality deterioration. This index provides a practical tool for river management, facilitating early response strategies to mitigate water quality impacts associated with environmental drought.
1. Introduction
Recently, due to climate change, the number of days of extreme heat in summer has increased, and the impact of drought is intensifying. Changes in water resources due to rising temperatures and droughts tend to increase the impacts of pollutant loads, resulting in complex detrimental impacts on water quality and aquatic ecosystems [,,]. Climate change increases the volatility of rainfall patterns and causes reductions in river flow, impacting the physical and chemical properties of flow. Drought is a stochastic phenomenon that is usually identified by characteristics such as intensity, duration, and magnitude. These characteristics are dependent on and affect one another []. In addition, different hydrological variables, which are affected by drought, are usually statistically correlated. The drought in different sub-regions of the basin are essentially a multi-regional combination problem of meteorological and hydrological variables [,,]. These changes negatively affect water quality, influencing the health of aquatic ecosystems and human water use. For instance, decreases in river discharge during drought events can lead to increased concentrations of various pollutants [,]. Different hydrological variables, which are affected by drought, are usually statistically correlated []. Additionally, drought affects river water quality by disturbing the hydrological regime in a variety of ways, and can degrade water quality by reducing surface and groundwater availability []. The prediction of water quality parameters becomes more challenging with these extremes since water quality is strongly related to hydro-meteorological conditions and is particularly sensitive to climate change []. These complex factors lead to a deterioration in water quality. To cope with the environmental impacts of these droughts, preemptive responses and real-time observation are necessary.
To minimize the impact of drought on the water environment, the importance of early warning systems and real-time water quality monitoring is emphasized. Through real-time observations, changes in water quality can be quickly identified, and management strategies that can prevent or alleviate water quality deterioration due to drought can be immediately implemented. This can provide a scientific basis for the sustainable management of water resources and protection of the aquatic ecosystem.
Research on drought is applied to identify the condition of the subject by applying various indices. These droughts can disrupt the hydrological cycle of rivers and cause changes in water quality and environment. The effects of drought on water quantity are well known [,], but the consequences for water quality are still poorly []. A representative example is the standardized precipitation index (SPI) [], which evaluates meteorological drought. The SPI is the most commonly used drought index due to its limited data requirements and flexibility in assessing precipitation deficits over user-defined accumulation periods [].
The World Meteorological Organization (WMO) uses indices that evaluate drought, including the Palmer drought severity index (PDSI), standardized precipitation evapotranspiration index (SPEI), standardized groundwater level index (SGI), soil moisture index (SMI), effective drought index (EDI), streamflow drought index (SDI), and standardized streamflow index (SSI). The reservoir drought index (RDI), which is calculated using the current and average annual storage rates to evaluate agricultural drought, is a representative agricultural drought index. The hydrological drought index includes the streamflow drought index (SDI), which classifies drought severity and duration based on monthly flow, and the standardized streamflow index (SSI), which is calculated through the cumulative probability function of daily flow [,]. As a representative meteorological drought index, the SPI proposed in [] is highly useful as it interacts with groundwater volume, reservoir storage, and river discharge due to a decrease in precipitation []. These indices are used to evaluate meteorological, agricultural, and hydrological droughts. Recently, research has been conducted to quantitatively evaluate drought occurring in the environmental field. The authors in [] applied SPI and non-parametric kernel density estimation to quantify the impact of drought on water quality, and identified areas vulnerable to extreme drought by diagnosing water quality risk by calculating the probability of exceeding water quality according to drought conditions. In Ref. [], the authors used SPI to compare droughts by season, analyze the frequency of occurrence of severe droughts, calculate the target water quality achievement ratio of biochemical oxygen demand (BOD), total organic carbon (TOC), and total phosphorus (T-P) by SPI 1, 2, 3 condition, and analyze the causality between drought and water quality through Bayesian network analysis. In the case of water quality indices are calculated using multiple parameters. The Canadian Council of Ministers of the Environment Water Quality Index (CCME WQI) uses the following parameters: pH, BOD, suspended solid (SS), dissolved oxygen (DO), TP, total coliforms (TC), and fecal coliforms (FC) []. The National Sanitation Foundation Water Quality Index (NSFWQI) includes DO, fecal coliforms, pH, BOD, temperature gradient, total phosphate, nitrate, turbidity, and total solids []. The parameters used in the Oregon Water Quality Index (OWQI) are temperature, DO, BOD, pH, ammonia, nitrate nitrogen, total phosphorus, total solids, and fecal coliforms. In the real-time water quality index (RTWQI), the parameters include DO, pH, water temperature, electrical conductivity (EC), TOC, total nitrogen (T-N), and TP [,]. These indices mainly focus on water quality parameters. However, there are some areas that are less able to be measured in real time, including organic matter. Additionally, these indices do not include hydrological and meteorological factors, so they are insufficient in terms of hydrological changes. In Refs. [,], SPI and SSI were used to distinguish between drought periods and track anthropogenic contributions to water quality due to climate change by identifying thresholds for flow and water quality, and by characterizing meteorological and hydrological drought for the cumulative drought period. The impact on water quality according to changes in the accumulation period was analyzed. Previous studies have mainly utilized the correlation between weather and water quality rather than directly estimating changes in water quality. When examining the existing index calculation method and research utilizing the index, research on calculation methods that link weather, water quality, and flow rate as calculation factors was insufficient.
In this study, we aim to quantitatively assess the impact of drought on water quality, focusing on how hydrological variability in rivers influences water quality under drought conditions. Unlike existing water quality and drought indices, this research incorporates factors that account for hydrological variability, allowing for a more precise evaluation of drought’s environmental impact, particularly on water quality. The proposed index calculation method offers a tool to more accurately assess drought and fluctuations in water quality, providing valuable foundational data for developing effective water quality management strategies in response to climate change and drought. This study intends to contribute to sustainable water management practices by proposing a scientific and systematic approach to mitigating drought effects and improving water quality.
2. Methods
2.1. Study Area and Factors
The study was conducted on the Nakdong River in South Korea. The main tributary rivers of the Nakdong River were targeted, and 10 target rivers were selected. Since the main stream should consider the influence of the tributaries when they join, this study targeted tributaries that could be analyzed individually. The selection criteria for the target rivers were those located downstream of the dam and those joining the main stream of the Nakdong River (Figure 1). Water quality and flow rate data were obtained from a measuring network located downstream of the river. Since water quality and flow observatories are located in these areas, we considered whether the factors needed to calculate the index could be obtained. The target rivers were categorized into three flow conditions: normal water season, low water season, and dry season, using each river’s standard flow rate (Table 1). The flow conditions were classified as follows: 0% to 10% for flood conditions, 10% to 40% for moist conditions, 40% to 60% for normal conditions, 60% to 90% for dry conditions, and 90% to 100% for low flow conditions. In this study, standard flow rates were based on measured flow rate values, as calculated in [].
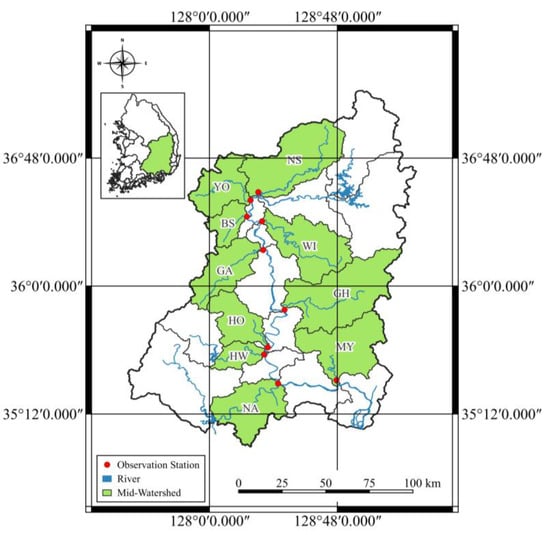
Figure 1.
Study area.

Table 1.
Tributary watershed unit standard flow.
The water quality and flow rate data used in this analysis were obtained from the Water Environment Measurement Network, provided by the Water Environment Information System (http://water.nier.go.kr) acceseed on 5 April 2024, spanning the period from 2013 to 2022. The analysis was based on data from the total amount measurement network, with water quality and flow rate recorded at 7-day intervals. All available data, excluding any missing entries, were included. Meteorological data were sourced from the Meteorological Data Disclosure Portal (https://data.kma.go.kr) to acceseed on 5 April 2024, meteorological influences on hydrology, water quality, and the impact of drought on water quality and the environment. To maintain temporal consistency, the dataset was structured with a 7-day interval, aligned with the water quality data.
2.2. Environmental Drought Index Calculation Method
The indices used to calculate the drought index were investigated. The calculation factors, calculation formulas, and purposes of the drought index and water quality index were investigated. The drought index was investigated domestically and internationally. SPI is a standardized precipitation index and the most widely used meteorological drought index. It has the advantage of a simple calculation method, result comparison, and period evaluation. However, there are limitations to simplicity by using a single variable. In addition, the Palmer drought severity index (PDSI) and standardized precipitation evapotranspiration index (SPEI) consider evapotranspiration along with precipitation. This has the disadvantage of increasing data requirements and making evapotranspiration data uncertain. The standardized groundwater level index (SGI) and soil moisture index (SMI) utilize groundwater data, which results in insufficient data and limitations in usability. The streamflow drought index (SDI) and standardized streamflow index (SSI) use flow rate to standardize flow variability, but it was also determined that the reliability of the results was low because it was difficult to continuously acquire single variable and flow data. We attempted to determine the usability of the existing drought index calculation method. The index used included subjective elements in areas such as thresholds, so it was considered to have limitations for application in this study. In addition, among the calculation methods, the Canadian Council of Ministers of the Environment Water Quality Index (CCME WQI) method has the advantage of being free in setting factors, but has difficulties in setting standards for exceeding values. Therefore, this study applied the National Sanitation Foundation Water Quality Index (NSF WQI) method, which calculates the index by applying the relationship between each factor as a weight. The NSFWQI was developed by the National Sanitation Foundation and is a method of calculating the water quality index by assigning weights to water quality items. Among the water quality indices, the Canadian Council of Ministers of the Environment Water Quality Index (CCME WQI) allows for flexible factor selection, but presents difficulties in defining exceedance thresholds. In contrast, this study applied the National Sanitation Foundation Water Quality Index (NSF WQI), which calculates the index using weighted relationships among factors. Developed by the National Sanitation Foundation, the NSF WQI reduces researcher subjectivity by assigning specific weights to key water quality items, making it possible to objectively identify the primary factors affecting river water quality. The NSF WQI results are categorized into five grades: Excellent (100-91), Good (90-71), Medium (70-51), Bad (50-26), and Very Bad (25-0). The calculation involves multiplying the rating standard value of each water quality item by its assigned weight.
After reviewing various indices, the NSF WQI was determined to be suitable as a method that can take into account water quality, hydrology, and meteorology, including factor composition and weighting. Therefore, this study employed the NSF WQI calculation method to create a comprehensive index that integrates water quality, flow, and meteorological factors.
To evaluate water quality, the modified NSFWQI calculation method proposed in [] was used. The calculation method is presented in Equation (1). is the grade reference value of each water quality item, means the weight of each water quality item, and n is the number of water quality items. In this study, the environmental drought index was calculated using the NSFWQI calculation method. The settings for the factors were reconstructed and utilized in this study.
2.3. Setting up Environmental Drought Index Calculation Items
Current water quality and drought indices have limitations in assessing water quality under hydrological and meteorological changes. This study aimed to determine water quality changes during environmental droughts. Existing water quality indices include measures of organic substances like biochemical oxygen demand (BOD), total nitrogen (T-N), and total phosphorus (T-P). These concentrations are typically identified through laboratory analyses, which only reveal changes after water quality is affected, leaving limited time for proactive responses. Therefore, this study sought to assess water quality status using real-time sensor data.
With advancements in sensor technology, a variety of water quality parameters can now be monitored in real time [,,]. High-frequency monitoring has become essential [], as sensor-based measurements can capture temporal fluctuations in water quality more effectively [,]. Sensor data and modeling offer time, cost, and labor efficiencies in water quality management []. In this study, we applied an index calculation method that does not utilize modeling and only uses sensor-based data. In the existing calculations of water quality indices, there were no cases where only sensor-based data were used. This study uniquely applied an index calculation method based solely on sensor data, leveraging the advantages of real-time monitoring. This approach allowed us to track water quality dynamics immediately, enhancing the potential for early intervention.
The calculation items included Flow, Cumulative Precipitation, Rainless Days, pH, Electrical Conductivity (EC), Dissolved Oxygen (DO), and Total Organic Carbon (TOC)—all parameters obtainable in real time. For rivers with upstream dams, Dam Outflow was also included. Priority was given to sensor-based and real-time factors, and factor correlations were considered to improve calculation accuracy. Flow, Cumulative Precipitation, and Rainless Days were set based on studies investigating flow rate and meteorological impacts on river water quality, particularly through the Load Duration Curve (LDC) approach []. Specifically, cumulative precipitation was considered over the 28 days prior to each measurement date, while the threshold for “Rainless Days” was set at ≥10 mm, in line with the precipitation criteria for nonpoint source pollution monitoring in management guidelines.
To capture the impacts of environmental drought on water quality, the selected parameters informed the index range and served as indicators of water quality deterioration. Given that BOD is a key regulatory standard for river water quality in Korea, this study focused on BOD as an index parameter. The index for BOD was calculated using the NSF WQI formula, with specific calculation factors and weights established as proposed in this study. This approach allowed us to present an index capable of detecting water quality changes due to environmental drought.
2.4. Weights and Normalization Methods
In composite indices, the ranges and units of individual factors differ, so standardization is essential to make them dimensionally consistent. In this study, weights were applied to calculate the index, determined by obtaining a weight vector through ordinary least squares (OLS) regression, minimizing the residual sum of squares (RSS). Flow, Cumulative Precipitation, Rainless Days, pH, Electrical Conductivity (EC), Dissolved Oxygen (DO), Total Organic Carbon (TOC), and Dam Outflow were used as independent variables, while Biochemical Oxygen Demand (BOD) served as the dependent variable. Weights were calculated by analyzing varied hydrological conditions—including moist, normal, dry, and low flow—while excluding flood season flows.
BOD was selected as the target parameter for water quality assessment due to its use as a regulatory standard by the Ministry of Environment for each basin. This choice allowed us to align with existing water quality management benchmarks. Weight calculations were applied across all flow conditions.
Normalization was implemented to allow for the relative comparison of the composite index results. Without normalization, the index could be biased toward factors with broader ranges, introducing implicit weighting and potentially skewing the results []. To ensure that the indicators were on a common scale, Min–Max Normalization was applied, converting each factor into a dimensionless score []. This method maintains the characteristics of complex index construction while adjusting the values for comparability []. The final index values were scaled to a range of 1 to 10.
3. Results and Discussion
3.1. Environmental Drought Index Applicability Assessment
The environmental drought index was calculated by applying weights specific to each basin. The weighted values were incorporated into the index, which was then normalized to a scale of 1 to 10. To evaluate the index’s applicability, the relationship between the calculated index values and BOD concentrations is displayed in Figure 2, with the index values on the x-axis and BOD concentrations on the y-axis (in log scale). This visualization allowed us to assess the index’s relevance for real rivers by examining its relationship with BOD. Class intervals were established using the Ministry of Environment’s target water quality standards for each basin. Additionally, applicability was quantitatively assessed through the R2 and correlation coefficients (Table 2). The correlation coefficient ranged from 0.46 to 0.86, while the coefficient of determination (R2) ranged from 0.1 to 0.77, with values under dry and low-flow conditions ranging from 0.06 to 0.84. These results indicate that the environmental drought index calculation method presented in this study is broadly applicable. However, the applicability was lower in the Hwang River, where the water quality remained low and showed minimal response to flow rate and weather variability. The index calculation results revealed areas with significant drought impact and others, like the Hwang River, where hydrological variability had a limited effect on water quality. This index calculation method successfully distinguished between areas with high and low susceptibility to drought impacts.
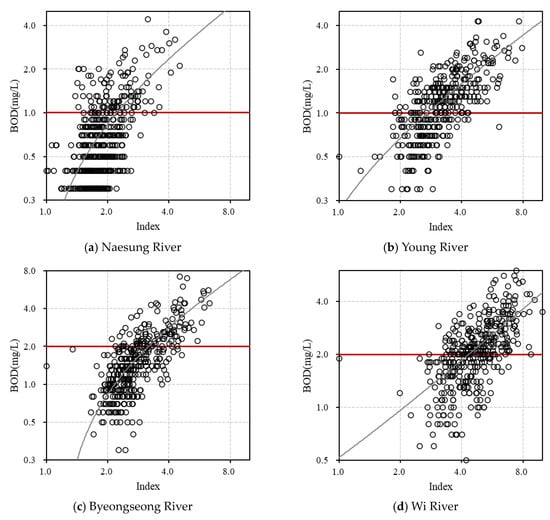
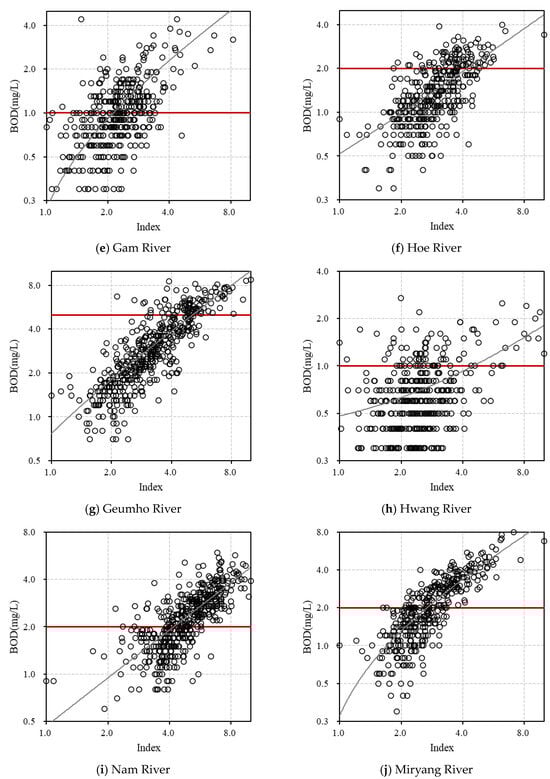
Figure 2.
Environmental drought index applicability assessment.
Table 2.
Environmental drought index applicability evaluation results.
3.2. Class Interval Settings
The standardized precipitation index (SPI), a meteorological drought index, classifies conditions as Extremely Wet, Severely Wet, Moderately Wet, Mild Wet, Mild Drought, Moderate Drought, Severe Drought, and Extreme Drought based on index values, providing an assessment of drought and wetness relative to precipitation levels. The Water Quality Index (WQI), in contrast, categorizes water quality as Excellent, Good, Medium, Bad, and Very Bad, indicating overall water quality status. The water quality and environmental drought index developed in this study aims to assess river water quality under drought conditions, differentiating itself from the SPI’s focus on meteorological wetness and drought and the WQI’s general water quality assessment. Instead, it seeks to identify water quality risk levels associated with hydrological variability. To standardize its application across different rivers, the index class intervals were set to a consistent range, ensuring usability. Thresholds for each interval were determined using BOD target water quality values for each river, as shown in Figure 2. In this figure, the red line represents the BOD target water quality, and the class intervals were defined by whether the index exceeded this target. Five classification levels were established: Normal, Concern, Attention, Warning, and Critical, to reflect water quality risk related to meteorological and hydrological changes (Table 3).
Table 3.
Environmental drought index applicability evaluation results.
3.3. Environmental Drought Index Calculation Results
By applying the calculation method and class intervals defined in this study, the final results for the environmental drought index were presented. Calculation factors included Flow, Cumulative Precipitation, Rainless Days, pH, Electrical Conductivity (EC), Dissolved Oxygen (DO), Total Organic Carbon (TOC), and Dam Outflow (applied only in rivers with upstream dams). Dam flow data were used for the Naesung, Wi, Geumho, Hwang, Nam, and Miryang rivers. To enhance the applicability of the index to individual rivers, the calculated values were weighted by river, allowing for the representation of unique river conditions. As a result, while index values and BOD concentrations might differ among rivers, each river’s condition could still be interpreted according to the defined class intervals. A five-level class interval was applied using the Ministry of Environment’s target water quality for each basin, and the results are shown in Figure 3 as a box plot. This figure indicates that water quality concentration tends to increase as the class interval escalates from Normal to Critical. In the Hwang River, however, distinctions between the Normal, Concern, and Attention levels were less pronounced. The target water quality exceedance rate for each section is displayed alongside Figure 3 (Table 4), illustrating the relationship between index value and BOD concentrations: as the index values rise, so does the exceedance rate relative to the target water quality. This trend shows that as environmental drought intensifies across the watershed—from Normal to Concern, Attention, Warning, and Critical—the likelihood of surpassing target water quality also increases. To further examine the impact under low flow conditions, the exceedance rates were separately evaluated for standard flow, dry conditions, and low flow (Table 5). These results confirm that even under reduced flow, water quality exceedance rates increase significantly. In critical sections of basins (excluding the Hwang River), target water quality was surpassed in over 80% of cases. Although this approach does not provide exact water quality predictions, it supports probabilistic assessments of water quality deterioration risk. This index can thus serve as a foundational tool for early and preemptive responses to potential river water quality issues.
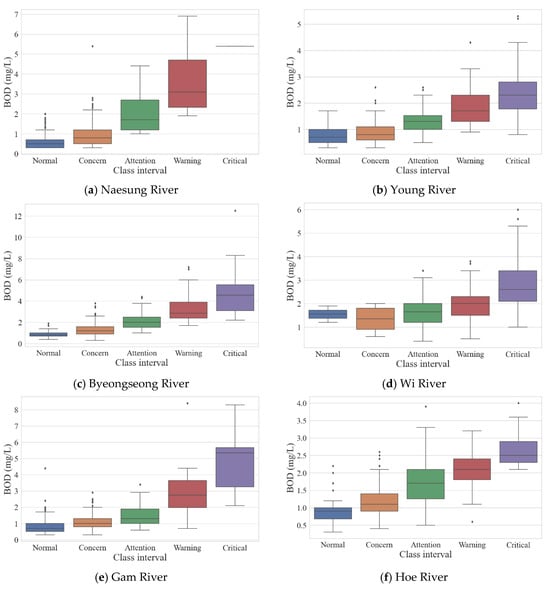
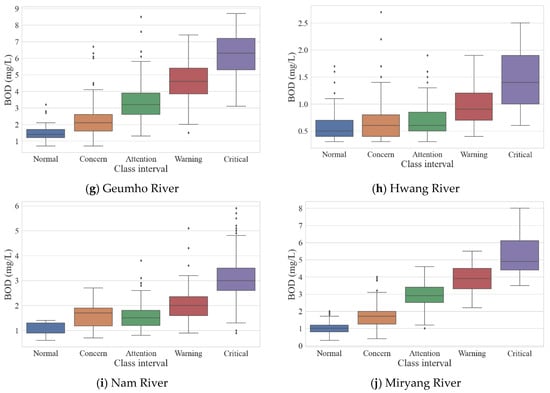
Figure 3.
Environmental drought index results by class interval.
Table 4.
Target water quality exceedance rate according to class interval.
Table 5.
Target water quality exceedance rate according to class interval—Dry, Low.
4. Conclusions
This study introduces a new environmental drought index to address limitations in traditional drought indices, such as the standardized precipitation index (SPI), which are inadequate for assessing real-time water quality variations driven by weather and hydrological changes. Traditional indices struggle to provide timely data, hindering early response to water quality deterioration. By incorporating real-time sensor data, this study proposes an improved index calculation method that enhances responsiveness to immediate environmental changes.
The index calculation is based on the NSFWQI calculation method, modified through linear regression to assign factor weights and normalized by watershed. Testing across 10 rivers in the Nakdong River basin showed correlation coefficients from 0.64 to 0.86 and coefficients of determination between 0.4 and 0.7, indicating the index’s efficacy in capturing water quality variations. These results indicate the index’s capacity to capture variations in water quality across diverse river sections.
The index categorizes water quality into five stages—Normal, Concern, Attention, Warning, and Critical—guiding early intervention. The results showed that as the index levels rose, the water quality concentrations increased, affecting the exceedance rate of target water quality. The observed relationship between index levels and the exceedance rates of target water quality for different basins emphasizes the potential of the environmental drought index as a predictive tool, albeit with limitations regarding the precise quantification of concentrations.
This environmental drought index supports early response measures for water quality management, especially downstream of dams, aiding in flow regulation and river maintenance. Although precise concentration predictions remain challenging, the index offers a proactive tool for managing water quality under drought conditions. Future developments could involve refining the index to adapt to specific river characteristics, contributing to broader water resource management efforts.
Author Contributions
Conceptualization, B.G.J.; formal analysis, B.G.J. and J.L.; investigation, B.G.J.; methodology, J.L.; project administration, B.G.J., J.L. and J.-H.L.; resources, J.-H.L. and Y.D.K.; supervision, J.-H.L.; validation, B.G.J.; visualization, B.G.J. and J.L.; writing—original draft, B.G.J.; writing review and editing, J.-H.L. and Y.D.K.; funding acquisition, J.-H.L. All authors have read and agreed to the published version of the manuscript.
Funding
This research was supported by Korea Environment Industry & Technology Institute (KEITI) through the Aquatic Ecosystem Conservation Research Program (or Project), funded by Korea Ministry of Environment (MOE) (2022003050007).
Institutional Review Board Statement
Not applicable.
Informed Consent Statement
Not applicable.
Data Availability Statement
The original contributions presented in this study are included in the article. Further inquiries can be directed to the corresponding author(s).
Acknowledgments
The authors gratefully acknowledge the Myongji University and Joongbu University.
Conflicts of Interest
The authors declare no conflicts of interest.
References
- Poff, N.L.; Brinson, M.M.; Day, J.W. Aquatic ecosystems and global climate change. Pew Cent. Glob. Clim. Chang. Arlingt. VA 2002, 44, 1–36. [Google Scholar]
- Park, J.H.; Duan, L.; Kim, B.; Mitchell, M.J.; Shibata, H. Potential effects of climate change and variability on watershed biogeochemical processes and water quality in Northeast Asia. Environ. Int. 2010, 36, 212–225. [Google Scholar] [CrossRef] [PubMed]
- Sjerps, R.M.; Ter Laak, T.L.; Zwolsman, G.J. Projected impact of climate change and chemical emissions on the water quality of the European rivers Rhine and Meuse: A drinking water perspective. Sci. Total Environ. 2017, 601, 1682–1694. [Google Scholar] [CrossRef] [PubMed]
- Zavareh, M.M.; Mahjouri, N.; Rahimzadegan, M.; Rahimpour, M. A drought index based on groundwater quantity and quality: Application of multivariate copula analysis. J. Clean. Prod. 2023, 417, 137959. [Google Scholar] [CrossRef]
- Zhang, X.; Huang, S. Research progress, challenges, and prospects in drought propagation. Adv. Earth Sci. 2023, 38, 563–579. [Google Scholar]
- Zhang, Y.; You, Q.; Ullah, S.; Chen, C.; Shen, L.; Liu, Z. Substantial increase in abrupt shifts between drought and flood events in China based on observations and model simulations. Sci. Total Environ. 2023, 876, 162822. [Google Scholar] [CrossRef]
- Wang, H.; Wang, S.; Shu, X.; He, Y.; Huang, J. Increasing occurrence of sudden turns from drought to flood over China. J. Geophys. Res. Atmos. 2024, 129, e2023JD039974. [Google Scholar] [CrossRef]
- Macintosh, K.A.; Jordan, P.; Cassidy, R.; Arnscheidt, J.; Ward, C. Low flow water quality in rivers; septic tank systems and high-resolution phosphorus signals. Sci. Total Environ. 2011, 412, 58–65. [Google Scholar] [CrossRef]
- Burt, T.P.; Worrall, F.; Howden, N.J.; Anderson, M.G. Shifts in discharge-concentration relationships as a small catchment recover from severe drought. Hydrol. Process. 2015, 29, 498–507. [Google Scholar] [CrossRef]
- Seo, J.; Won, J.; Lee, H.; Kim, S. Probabilistic monitoring of meteorological drought impacts on water quality of major rivers in South Korea using copula models. Water Res. 2024, 251, 121175. [Google Scholar] [CrossRef]
- Fabian, P.S.; Kwon, H.H.; Vithanage, M.; Lee, J.H. Modeling, challenges, and strategies for understanding impacts of climate extremes (droughts and floods) on water quality in Asia: A review. Environ. Res. 2023, 225, 115617. [Google Scholar] [CrossRef] [PubMed]
- Van Vliet, M.T.H.; Zwolsman, J.J.G. Impact of summer droughts on the water quality of the Meuse river. J. Hydrol. 2008, 353, 1–17. [Google Scholar] [CrossRef]
- Safavi, H.R.; Malek Ahmadi, K. Prediction and assessment of drought effects on surface water quality using artificial neural networks: Case study of Zayandehrud River, Iran. J. Environ. Health Sci. Eng. 2015, 13, 68. [Google Scholar] [CrossRef] [PubMed]
- Zwolsman, J.J.G.; Van Bokhoven, A.J. Impact of summer droughts on water quality of the Rhine River-a preview of climate change? Water Sci. Technol. 2007, 56, 45–55. [Google Scholar] [CrossRef]
- McKee, T.B.; Doesken, N.J.; Kleist, J. The relationship of drought frequency and duration to time scales. In Proceedings of the 8th Conference on Applied Climatology, Anaheim, CA, USA, 17–22 January 1993; Volume 17, pp. 179–183. [Google Scholar]
- Barker, L.J.; Hannaford, J.; Chiverton, A.; Svensson, C. From meteorological to hydrological drought using standardised indicators. Hydrol. Earth Syst. Sci. 2016, 20, 2483–2505. [Google Scholar] [CrossRef]
- Lee, J.W.; Kim, K.H.; Kim, S.; Woo, S.; Kim, S.J. Evaluation of the Relationship between Meteorological Drought and Agricultural Drought of Geum River Basin during 2014~2016. J. Wetl. Res. 2019, 21, 80–89. [Google Scholar] [CrossRef]
- Kim, S.H.; Chung, E.S. Analysis of peak drought severity time and period using meteorological and hydrological drought indices. J. Korea Water Resour. Assoc. 2018, 51, 471–479. [Google Scholar] [CrossRef]
- Kwak, J.S.; Kim, G.S.; Jung, Y.H.; Um, M.J. Drought Assessment with SPI and DRI in Uiryeong-Gun. KSCE J. Civ. Environ. Eng. Res. 2022, 42, 457–467. [Google Scholar]
- Kim, J.S.; Jain, S.; Lee, J.H.; Chen, H.; Park, S.Y. Quantitative vulnerability assessment of water quality to extreme drought in a changing climate. Ecol. Indic. 2019, 103, 688–697. [Google Scholar] [CrossRef]
- Yoo, J.; Ryu, J.H.; Lee, J.H.; Kim, T.W. Probabilistic assessment of causal relationship between drought and water quality management in the Nakdong River basin using the Bayesian network model. J. Korea Water Resour. Assoc. 2021, 54, 769–777. [Google Scholar] [CrossRef]
- Park, K.D.; Kang, D.H.; So, Y.H.; Kim, I.K. Temporal-spatial variations of water quality level and water quality index on the living environmental standards in the west Nakdong River. J. Environ. Sci. Int. 2019, 28, 1071–1083. [Google Scholar] [CrossRef]
- Nayak, J.G.; Patil, L.G.; Patki, V.K. Development of water quality index for Godavari River (India) based on fuzzy inference system. Groundw. Sustain. Dev. 2020, 10, 100350. [Google Scholar] [CrossRef]
- Tyagi, S.; Sharma, B.; Singh, P.; Dobhal, R. Water quality assessment in terms of water quality index. Am. J. Water Resour. 2013, 1, 34–38. [Google Scholar] [CrossRef]
- Park, J.; Kal, B.; Kim, S. Long-term trend analysis of major tributaries of Nakdong River using water quality index. J. Wetl. Res. 2018, 20, 201–209. [Google Scholar]
- Peña-Guerrero, M.D.; Nauditt, A.; Muñoz-Robles, C.; Ribbe, L.; Meza, F. Drought impacts on water quality and potential implications for agricultural production in the Maipo River Basin. Cent. Chile Hydrol. Sci. J. 2020, 65, 1005–1021. [Google Scholar] [CrossRef]
- Giri, S.; Mishra, A.; Zhang, Z.; Lathrop, R.G.; Alnahit, A.O. Meteorological and hydrological drought analysis and its impact on water quality and stream integrity. Sustainability 2021, 13, 8175. [Google Scholar] [CrossRef]
- Study on Establishing Management Standards for Total Water Pollution Load Management in the Four Major Rivers (I) Nakdong River System; National Institute of Environmental Research: Inchon, Republic of Korea, 2017.
- Nazir, H.M.; Hussain, I.; Zafar, M.I.; Ali, Z.; AbdEl-Salam, N.M. Classification of drinking water quality index and identification of significant factors. Water Resour. Manag. 2016, 30, 4233–4246. [Google Scholar] [CrossRef]
- Blaen, P.J.; Khamis, K.; Lloyd, C.E.; Bradley, C.; Hannah, D.; Krause, S. Real-time monitoring of nutrients and dissolved organic matter in rivers: Capturing event dynamics, technological opportunities and future directions. Sci. Total Environ. 2016, 569, 647–660. [Google Scholar] [CrossRef]
- Pellerin, B.A.; Bergamaschi, B.A.; Gilliom, R.J.; Crawford, C.G.; Saraceno, J.; Frederick, C.P.; Downing, B.D.; Murphy, J.C. Mississippi River nitrate loads from high frequency sensor measurements and regression-based load estimation. Environ. Sci. Technol. 2014, 48, 12612–12619. [Google Scholar] [CrossRef]
- Wong, B.P.; Kerkez, B. Real-time environmental sensor data: An application to water quality using web services. Environ. Model. Softw. 2016, 84, 505–517. [Google Scholar] [CrossRef]
- Martinez, K.; Hart, J.K. Environmental Sensor Networks: A revolution in Earth System Science? In Proceedings of the AGU Fall Meeting Abstracts, San Francisco, CA, USA, 10–14 December 2007. IN11A-0095. [Google Scholar]
- Jordan, P.; Arnscheidt, A.; McGrogan, H.; McCormick, S. Characterising phosphorus transfers in rural catchments using a continuous bank-side analyser. Hydrol. Earth Syst. Sci. 2007, 11, 372–381. [Google Scholar] [CrossRef]
- Kirchner, J.W.; Feng, X.; Neal, C. The Fine Structure of Water-Quality Dynamics: The Wave of the Future in Catchment Hydrochemistry? In Proceedings of the AGU Fall Meeting Abstracts, San Francisco, CA, USA, 13–17 December 2004. H51G-02. [Google Scholar]
- Sinshaw, T.A.; Surbeck, C.Q.; Yasarer, H.; Najjar, Y. Artificial neural network for prediction of total nitrogen and phosphorus in US lakes. J. Environ. Eng. 2019, 145, 04019032. [Google Scholar] [CrossRef]
- Jo, B.G.; Lee, S.W.; Kim, Y.D.; Lee, J.H. Drought impact on water quality environment through linkage analysis with meteorological data in Gamcheon mid-basin. J. Korea Water Resour. Assoc. 2023, 56, 823–835. [Google Scholar]
- Booysen, F. An overview and evaluation of composite indices of development. Soc. Indic. Res. 2002, 59, 115–151. [Google Scholar] [CrossRef]
- Salzman, J. Methodological Choices Encountered in the Construction of Composite Indices of Economic and Social Well-Being; Centre for the Study of Living Standards: Oxford, UK, 2003. [Google Scholar]
- Mazziotta, M.; Pareto, A. Normalization methods for spatio-temporal analysis of environmental performance: Revisiting the Min–Max method. Environmetrics 2022, 33, e2730. [Google Scholar] [CrossRef]
Disclaimer/Publisher’s Note: The statements, opinions and data contained in all publications are solely those of the individual author(s) and contributor(s) and not of MDPI and/or the editor(s). MDPI and/or the editor(s) disclaim responsibility for any injury to people or property resulting from any ideas, methods, instructions or products referred to in the content. |
© 2024 by the authors. Licensee MDPI, Basel, Switzerland. This article is an open access article distributed under the terms and conditions of the Creative Commons Attribution (CC BY) license (https://creativecommons.org/licenses/by/4.0/).