Abstract
The primary objective of this study was to examine the quality of volunteered geographic information (VGI) data for flood mapping of Hurricane Harvey. As a crowdsourcing platform, the U-Flood project mapped flooded streets in the Houston metro area. This research examines the following: (1) If there are any significant differences in water depth (WD) among the hydraulic and hydrologic (H&H) model, the Federal Emergency Management Agency (FEMA) reference floodplain map, and the VGI? (2) Are there any significant differences in the inundated areas between the floodplain modeled by the VGI and hydraulic simulation? This study used HEC-RAS to simulate flood inundation maps and validated the results with high water marks (HWM) and the FEMA-modeled floodplain after Hurricane Harvey. The statistical results showed that there were significant differences in the WD, the inundated road count, and the length inside/outside of HEC-RAS-modeled floodplain. The results also showed that a less consistent decreasing trend between the U-Flood data and the modeled floodplain over time and space. This study empirically evaluated the data quality of the VGI based on observed and modeled data in flood monitoring. The findings from this study fill the gaps in the literature by assessing the uncertainty and data quality of VGI, providing insights into using supplementary data in flood mapping research.
1. Introduction
Enabled by the increasing penetration rate of mobile devices with internet connections, citizens serve as sensors to crowdsource data, contribute volunteered geographic information (VGI), and participate in citizen science projects [1,2,3]. To map flood inundation, crowdsourced data emerged as alternative and supplementary data sources to augment conventional geospatial datasets such as remotely sensed imagery and stream gauges. For example, the inundation extent and water depth data could be extracted from social media to support rapid flood inundation mapping in Dresden, Germany [4]. As a subset of crowdsourced data, VGI requires the voluntary submission of geographic observations by the users. Schnebele et al. [5] also utilized multi-sources of non-authoritative data, which included both crowdsourced and volunteered aerial photos, to map the potential road damage of Hurricane Sandy in the United States. These crowdsourced observations can produce valuable hydraulic data to support flood modeling in France, Argentina, and New Zealand [6].
Besides crowdsourced and VGI data, citizen science projects typically involve the training of participants in collecting high-quality data for a specific project. For example, trained citizens can actively collect in situ data at a high temporal resolution in near real time for flood mapping [7,8]. Such citizen science projects can gather quantitative hydraulic data, such as the flow rate and discharge, by crowdsourcing geotagged pictures and videos for subsequent hydrologic and hydraulic modeling to simulate the flood process [6].
Comparing to authoritative data acquired by government agencies, however, crowdsourced and VGI data often lack clear data standards and quality assurance/quality control (QA/QC) procedures to ensure data quality [9]. Nevertheless, a small panel of crowdsourced flood observations from YouTube videos were integrated with a hydraulic model and the results showed minor but persistent improvements to flood mapping in the downstream portion [10]. Based on the feedback of three projects across the continents, elements of successful citizen science projects include “a clear and simple procedure, suitable tools for data collecting and processing, an efficient communication plan, the support of local stakeholders, and the public awareness of natural hazards” [6].
It is possible to filter and extract a data subset relevant to different aspects of a flood. Disaster-specific terms, such as ”flood”, “inundation”, and “damage”, can be used to filter social media posts related to a specific flood. Based on passive crowdsourced data, such as taxi GPS or phone records, Kong et al. [11] classified roads by comparing delayed human mobility with some baselines. Their study used logistic regression to identify flood-affected roads and reported a 60% true positive rate as compared to the authoritative flood report. However, the accuracy is very sensitive to data sampling frequency. Using photos of stop signs, it is possible to train a deep neural network to estimate flood depth by comparing the pole length during the flood with the dry pole from Google StreetView Images [12]. The results showed a mean absolute error of 32.08 cm (equivalent of 12.63 in.) in flood depth estimation. Compared to active crowdsourced data with a clear project objective, these attempts can be regarded as using passive crowdsourced data as they require the use of proxy data to infer the intended target. As a result, their reliability is determined by the distribution of the proxy phenomenon (e.g., human mobility) instead of the geographic phenomenon of interest (i.e., flooding). Nevertheless, any creative use of passive crowdsourced data for flood modeling can provide valuable insights about the dynamic landscape at a critical time.
Regardless of the active or passive approach, it is necessary to validate the quality of crowdsourced data to explore its possible use in flood modeling beyond gathering discrete observations about the flood extent and road damage. The primary objective of this study was to examine the quality of VGI from the U-Flood project for flood mapping. This study used HEC-RAS to model flood inundation maps in the Houston area affected by Hurricane Harvey and compared the resulting maps with the volunteered dataset. The high temporal resolution of U-Flood data also offered a unique lens to ascertain the impacts of dam release as a flood management practice from Addick Reservoir and Barker reservoirs during the floods. By simulating the flood extent during Hurricane Harvey (which included dam release water from the Addick Reservoir and Barker Reservoir during the floods), this study provides useful references for disaster management in urban areas for future risk assessment and mitigation.
The research questions of this study include:
- (1)
- Are there any significant differences in the water depth for the H&H model (i.e., HEC-RAS), authorized reference (i.e., FEMA), and VGI (i.e., U-Flood data)?
- (2)
- Are there any significant differences in the inundated areas between the HEC-RAS-modeled floodplain and U-Flood data observations?
To answer these research questions, this study validated the VGI with a modeled floodplain to examine its effectiveness in supporting the flood inundation map of the HEC-RAS model. This study also discussed possible ways of using VGI to improve the model prediction.
To examine the quality of U-Flood data and its potential to improve the HEC-RAS model prediction, the null hypothesis (HA0) states that there are no significant differences in water depth (WD) among the HEC-RAS, FEMA, and U-Flood data (i.e., WDHEC-RAS = WDFEMA = WDU-Flood). The alternative hypothesis (HA1) is that there would be significant differences between these three data sources. To examine the agreement between the HEC-RAS model and the U-Flood data, the null hypothesis (HB0) states that there are no significant differences in the covered area between the HEC-RAS-modeled floodplain and the U-Flood data observations (i.e., Covered AreaHEC-RAS = Covered AreaU-Flood). The alternative hypothesis (HB1) is that there would be significant differences between these two data results.
2. Materials and Methods
2.1. Study Area and Data
The study area lies within the Buffalo Bayou watershed, which is primarily located in west-central Harris County, downstream of the Addicks Reservoir and Barker Reservoir in the Houston area (Figure 1). Buffalo Bayou, with a drainage area of 264.2 km2, is the primary stream, which runs approximately 170.59 km through a high-density residential area in Harris County, with a population of around 444,602. To examine the flood extent during Hurricane Harvey, four United States Geological Survey (USGS) stream gauges (08073500, 08073600, 08073700, and 08074000) were used in the HEC-RAS model, starting from the dam release of Addicks and Barker reservoirs upstream to the outflow downstream of Houston downtown.
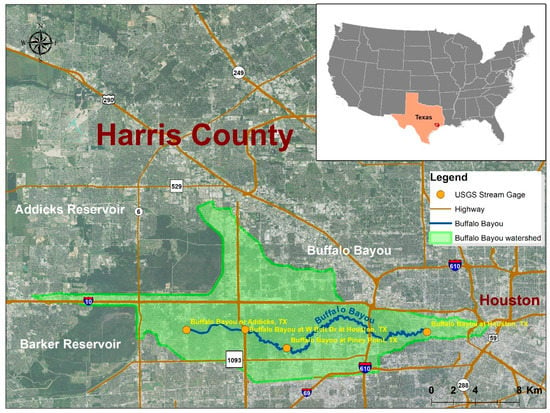
Figure 1.
The USGS stream gauges in the study area in Buffalo Bayou watershed [13].
Hurricane Harvey made landfall on 25 August 2017 and caused widespread flooding in the study area. However, U-Flood could only launch pro-actively and started data collection from 31 August to 6 September 2017. In this study, the input data for flood modeling were acquired from authoritative GIS databases such as the Texas Natural Resources Information System (TNRIS), the U.S. Geological Survey (USGS), and the Federal Emergency Management Agency (FEMA). Harvey high water marks from USGS were used for model validation. This study compiled the following geospatial data to examine the quality of VGI and its potential for inundation mapping (Table 1).

Table 1.
Data used in this research.
The flooded streets data used in this study were crowdsourced by the public and were acquired from the U-Flood project (map.u-flood.com).(The access date is 30 August 2017, and the full URL is https://u-flood.com/. The u-flood project, however, has been deprecated after Harvey and the domain is now used by a company selling Sump Pumps. You can see a blog about this website from here: https://wxshift.com/news/blog/were-mapping-flooded-streets-in-real-time-heres-how-to-help) The data adopted the GeoJSON format and were converted into shapefile for HEC-RAS modeling. The U-Flood data were segregated into hourly intervals from 31 August to 6 September 2017. The resulting polyline shapefile was visualized in GIS with a timestamp, road types, and flood types in the attribute table (Figure 2).
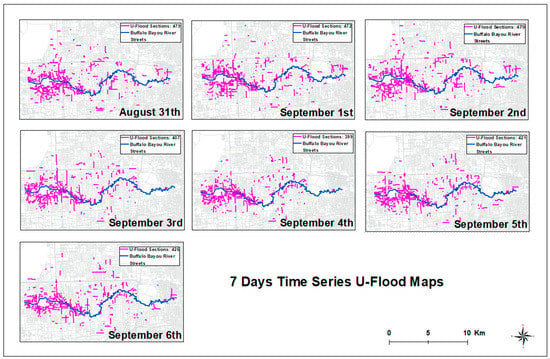
Figure 2.
The time series of 7 days of U-Flood maps [13].
All GIS shapefiles and raster data used the state plate coordinate system of Texas zone 4204 for spatial reference. The lidar-derived digital elevation model (DEM) data were clipped, mosaicked, and converted to a TIN file within the Buffalo Bayou watershed for further geometric data processing. The stream centerline, bank lines, flow path centerline, and cross section cut lines were digitized to prepare the RAS layers needed (Figure 3). This study digitized 80 cross section lines across the Buffalo Bayou watershed to capture the places of hydraulic interest (e.g., change in geomorphological landforms) and USGS gauges along the Buffalo Bayou stream. Based on the land cover data, Manning’s n values (e.g., 0.04 for channels, 0.06 for developed areas, 0.08 for vegetated areas) were assigned to the stream channel and floodplain. All RAS layers were prepared and exported from HEC-geoRAS and then imported into the HEC-RAS model for the flood simulation.
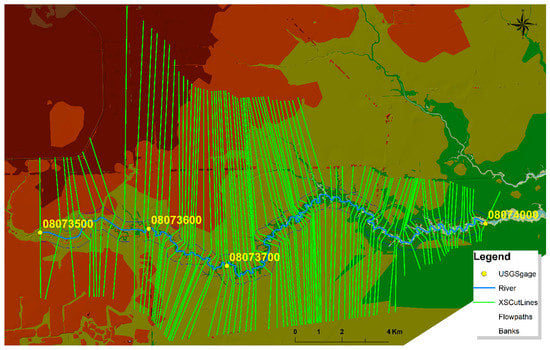
Figure 3.
Digitized river centerline, banks, flow paths, and cross sections for H&H modeling in HEC-RAS [13].
2.2. Flood Simulation and Analysis
The workflow of the methodology involves the following steps: (1) the flood simulation and inundation mapping using HEC-RAS; (2) model validation against authoritative data of the FEMA flood inundated map; (3) comparison of the extent and WD among the modeled flood inundation maps and U-Flood (Figure 4).
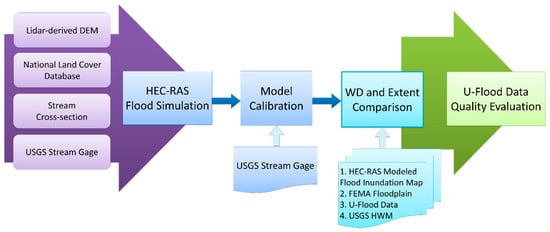
Figure 4.
Flow chart of data input, model simulation, calibration, result comparison, and data quality evaluation [13].
This study simulated a 7-day scenario of flood inundation maps to match the dates of the U-Flood data crowdsourced from 31 August to 6 September 2017. The peak discharges from the four USGS stream gauges were used as inflow data to conduct steady flow analysis and simulate the flood routed through the Buffalo Bayou from the reservoirs to downtown Houston. In addition, gauge heights over time were used to interpolate the water surface, which was assumed to be evenly distributed for each cross-section along the main channel. For example, Table 2 lists the input parameters of the four selected USGS stream gauges along the Buffalo Bayou mainstream, which include gauge number, gauge name, date, time, discharge (cms), and gauge height (m). In this research, the peak discharge of the USGS stream gauge 08074000 on any given day from August 31 to September 6 was used as the threshold to calibrate the model, because it holds the largest flow discharge value compared to the other gauges, which represents the worst flood scenario. Therefore, the time/date when the peak discharge occurred at gauge 08074000 was applied in the other three gauges to simulate the worst flood situation.

Table 2.
Flow data input parameters of four USGS stream gauges on 31 August 2017 at 13:30.
The quality of the U-Flood data was examined by comparing (a) the water depth (WD) among the HEC-RAS-modeled floodplain, the FEMA flood map, and the USGS HWM and U-Flood data (RQ1), and (b) the extent of the modeled floodplain (RQ2). This study compared various flood datasets to answer the research questions (Table 3).

Table 3.
Comparison set among HEC-RAS model, FEMA flood map, and U-Flood data.
To verify the quality of the HEC-RAS model, this research examined any significant difference in the WD between the HEC-RAS-modeled floodplain and two authoritative data sources, i.e., the FEMA floodplain and USGS HWM. The FEMA floodplain WD data, however, were only available from 27 August 2017 to 1 September 2017 (but without 31 August). Thus, this study compared the modeled floodplain of HEC-RAS against the FEMA floodplain on 1 September 2017, the only matching date in the two FEMA and U-Flood datasets. This study examined the agreement in the WD between the baseline HEC-RAS and FEMA floodplain at 1000 random points. The modeled floodplain (i.e., HEC-RAS or FEMA) was overlaid with the lidar-derived DEM, and a zonal maximum value of the DEM was used to infer the water surface elevation (WSE). Assuming the WSE is flat within the HEC-RAS or FEMA floodplain, the WD is simply the difference between the WSE and DEM at random points (Figure 5).
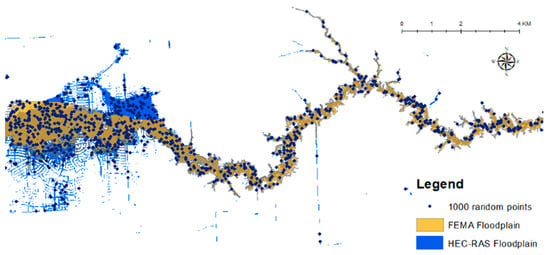
Figure 5.
1000 random points in constrained floodplain extent [13].
The USGS HWM points were measured at 1258 sites after Hurricane Harvey, recording visual clues of the peak stream height reached by floodwaters during the storm. There were 29 points available to be used in the statistical comparison. Similar to previous operation, the 29 HWM points with WSE were subtracted from the base DEM to derive the WD at those locations. However, the HWM data did not reveal the date of the highest watermark and, hence, there is uncertainty about its timing for comparison with the flood simulated on 31 August.
The third comparison set was to examine any significant differences in the WD among the HEC-RAS-modeled floodplain, the FEMA flood map, and the U-Flood data. While there is no WD directly encoded in the U-Flood data, this study derived the WD from the inundated street segment of the U-Flood data using a GIS approach. This study used a 7.62 m (equivalent of 25 ft) buffer around the crowdsourced U-Flood centerline, based on the standard width of a lane: 3.66 m (i.e., about 12 ft) (the American Association of State Highway and Transportation Officials), and the typical width of a two-way road segment in the US: nearly 7.62 m. Next, this study created random points and obtained zonal maximum elevation by overlaying the buffered inundated street segments with the lidar-derived DEM. There were 184 points available to be used in the statistical comparison. Assuming a constant water surface across the inundated street segment, the 184 points within the buffered street segment would represent WSE, which was again subtracted from the DEM to estimate the WD along the U-Flood inundated street segment. Similarly, the U-Flood WDs were compared with those extracted from the FEMA and HEC-RAS floodplain on 1 September. In addition to comparing the WD of U-Flood, FEMA, and HEC-RAS, this study also compared the WD of U-Flood and HEC-RAS over 7 days (from 31 August to 6 September 2017).
Besides the WD, this study also examined any significant differences in the flood extent between the HEC-RAS-modeled floodplain and the U-Flood data in terms of the U-Flood count and the length from 31 August to 6 September 2017. This study assessed them based on count % and length % of U-Flood, inside and outside of the HEC-RAS-modeled floodplain. All U-Flood data were intersected and constrained in the Buffalo Bayou bounding polygon (which was generated based on the zone covered with cross sections in HEC-RAS). The first assessment was to compute the percentage of the U-Flood data counts inundated in the HEC-RAS-modeled floodplain over the total number of U-Flood data. In this study, the street segments from U-Flood that intersected with the HEC-RAS floodplain were selected to illustrate the inundated roads reported by the crowd. The second assessment method was to compare the length of inundated street segments reported in U-Flood and the HEC-RAS-modeled floodplain to the total length of U-Flood data. The inundated length of the U-Flood road was then clipped within the HEC-RAS-modeled floodplain to be compared. All comparison sets were used to conduct a normality test and either a parametric or non-parametric statistical analysis as appropriate.
3. Results
Based on the stream gauge data, flood maps were simulated from 31 August 2017 to 6 September 2017, in HEC-RAS (Figure 6). In general, the water receded (i.e., the WSE was lower) and the flood inundation extent gradually decreased over time. The upstream area of Buffalo Bayou had the largest flood extent and the biggest change across the 7 days.
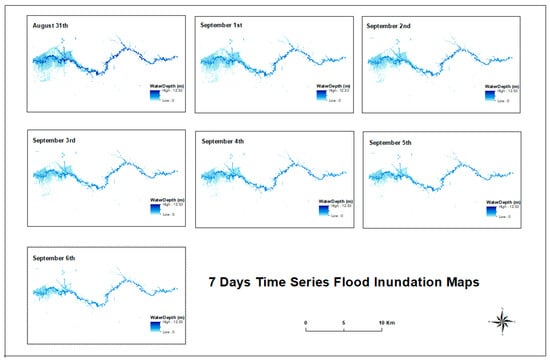
Figure 6.
The time series flood inundation maps from 31 August to 6 September 2017 [13].
The WD difference map of one dataset subtracted from another (e.g., FEMA—HEC-RAS) over the random points were visualized to represent the spatial distribution of WD differences (Figure 7). There were five different point types to represent the WD difference (WDD) level between each pair of dataset comparisons as follows: (1) ≤−2 m, (2) −2 m < WDD ≤ −1 m, (3) −1 m < WDD ≤ 1 m, (4) 1 m < WDD ≤ 2 m, and (5) >2 m. Take FEMA—HEC-RAS for example, the positive value indicates the overestimation of FEMA over HEC-RAS, while the negative value indicates the underestimation of FEMA over HEC-RAS (Figure 7A).
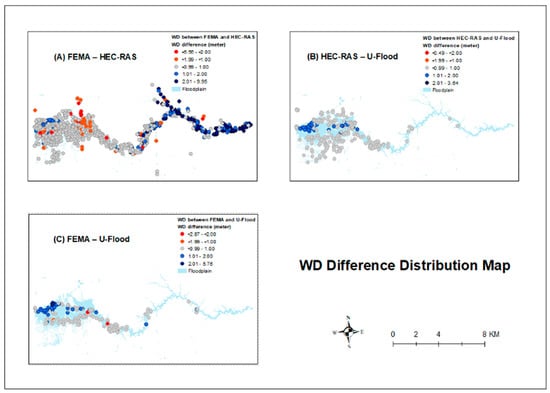
Figure 7.
WD difference maps between: (A) FEMA and HEC-RAS; (B) HEC-RAS and U-Flood; and (C) FEMA and U-Flood [13].
The following subsections present the statistical results from each comparison set (Table 3).
3.1. WD Comparison Results of HEC-RAS and FEMA
This study compared 1000 WD values between the FEMA and HEC-RAS models using the paired sample t-test. The mean the WD from FEMA was 0.38 m higher than the HEC-RAS counterpart. Despite the HEC-RAS WD being highly correlated with the FEMA WD (r = 0.878), there was a significant difference between the two sources (t = 8.239; p < 0.0001; n = 1000). Based on Figure 7A, most WD differences were in the range −1 m–1 m (grey points), which indicated minor WD differences between the FEMA- and HEC-RAS-modeled floodplain. However, the HEC-RAS model often overestimated the WD, with >−2 m (bright orange points) being observed in the upstream areas, and an opposite trend of underestimation with a >2 m (dark blue points) cluster along the downstream portion. One possible reason for the WD differences was that FEMA data did not indicate the time it used for the flood simulation. Therefore, the result of FEMA may be different from HEC-RAS, which was modeled with the USGS gauge peak flow discharge on 1 September 2017.
3.2. WD Comparison between HEC-RAS-Modeled Floodplain and HWMs
Due to the small sample size (n = 29) and the results of the Shapiro–Wilk normality test, the Wilcoxon Signed-Rank test was used to compare the WD of HEC-RAS and HWMs on 31 August 2017. Using only the HEC-RAS and HWM WD values at 29 sample points, there was a significant difference at the 0.05 level (Z = −2.0001, p = 0.0455).
3.3. WD Comparison among U-Flood, HEC-RAS, and FEMA
Similarly, the normality test revealed that the WD of U-Flood, HEC-RAS, and FEMA were not normally distributed (p-value < 0.05). The WD on 1 September 2017 was selected because it was the only date when these three data sources were available. The Friedman (X2r) statistics result rejected the research hypothesis, which indicated that there was a significant difference among the three groups at the α = 0.01 significance level (p-value < 0.01).
3.3.1. U-Flood and HEC-RAS
Using the Wilcoxon Signed-Rank test, there were significant differences in the WD between U-Flood and HEC-RAS from 31 August to 6 September 2017 at the 0.01 level (Z = 10.732 to 15.087, p < 0.0001). Most WD differences were in the range −1 m–1 m (grey points), which indicates that there was only a small WD difference between the HEC-RAS-modeled floodplain and U-Flood (Figure 7B). However, there were some scattered WD differences in the range 1 m–2 m (blue points) for the cluster near the upstream area of Buffalo Bayou.
3.3.2. U-Flood and FEMA
The results of the Wilcoxon Signed-Rank test revealed a significant difference in the WD between U-Flood and FEMA at the 0.05 level (Z = −2.4217, n = 190, p = 0.01552). Most WD differences were in the range −1 m–1 m (grey points), suggesting only a small WD difference between FEMA and U-Flood (Figure 7C). However, some major WD differences in the range 1 m–2 m (blue points) for the cluster near the upstream Buffalo Bayou. Moreover, there were a couple red points indicating a >2 m WD difference in the mid-upper floodplain.
3.4. U-Flood Data and HEC-RAS-Modeled Flood Inundation Map Comparison
In terms of the flood extent, the U-Flood data and the HEC-RAS-modeled floodplain were compared on 1 September 2017 (Figure 8). While the U-Flood street data outside of the HEC-RAS floodplain (the grey lines) could not be examined, the majority of the U-Flood street data (85.9%) had a WD difference less than 1 m from the HEC-RAS results. About 8.8% of the WD difference (solid line) fell between 1 to 2 m, and 5.3% of the WD difference ranged between 2 and 8 m (thick solid line). Nevertheless, it is clear that those U-Flood segments with a significant WD difference (2–8 m), represented by black bold lines, were totally inside of the floodplain.
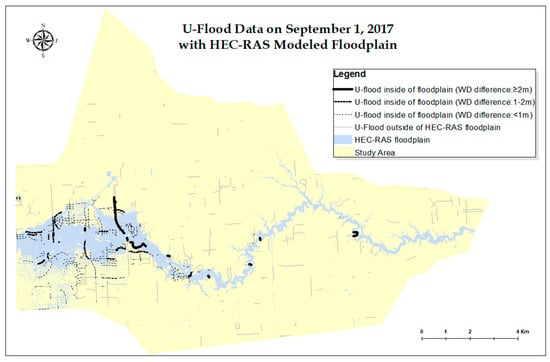
Figure 8.
U-Flood data and HEC-RAS-modeled floodplain on 1 September 2017 [13].
3.4.1. Count Comparison
The total number of U-Flood data points per day from 31 August 2017 to 6 September 2017 ranged between 399 and 479, while the number of U-Flood data points within the modeled floodplain per day during the same period ranges from 188 to 295 (i.e., 44.13%–61.59% of all U-Flood data). The reported U-Flood data count inside the modeled floodplain consistently decreased, whereas the total U-Flood observations from 31 August 2017 to September 6 changed at a slower rate and often rebounded, especially after 4 September (Figure 9). While both the modeled floodplain and U-flood data shrank in extent (i.e., the receding flood), there were relatively less U-flood reported from inside the modeled floodplain over time (i.e., there were more U-Flood data outside the floodplain). The decreasing trend over time may indicate less U-Flood data being reported. It is important to note that the HEC-RAS model only accounts for riverine flooding in the main channel, whereas U-Flood observations may account for tributary flooding and other storm surges (e.g., overland flow, stormwater backlash). In general, most of the intersected U-Flood data were clustered near the reservoir discharge outlet and upstream area of Buffalo Bayou.
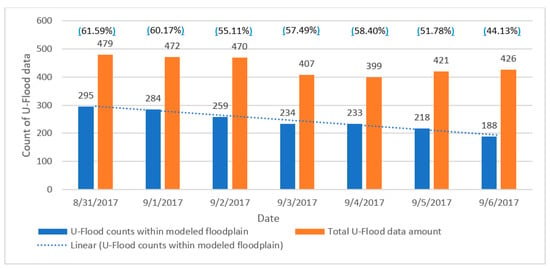
Figure 9.
Temporal trend of total U-Flood counts and those within HEC-RAS-modeled floodplain [13].
3.4.2. Length Comparison
The total of U-Flood data length in the study area for 31 August 2017 to September 6 was about 107.83–132.87 km, and the of the U-Flood data length within the floodplain was about 34.81–63.00 km, which represents 29.06%–47.43% of the total of the U-Flood data length. Similar to the trend observed in the count comparison, there was a decreasing trend for the reported U-Flood data length inside the floodplain over time (Figure 10).
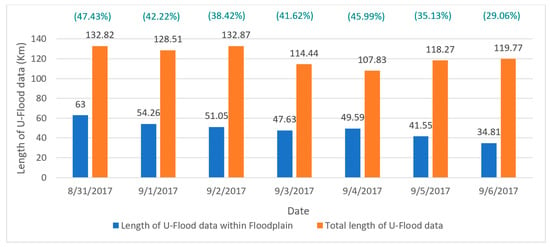
Figure 10.
Temporal trend of total U-Flood length and those within HEC-RAS-modeled floodplain [13].
In summary, the average agreement of the count was 55.52%, while the average agreement of the length was 39.98%. Therefore, the length percentage agreement was too low to indicate much agreement between the U-Flood data and HEC-RAS model results. As explained earlier, such a difference could be attributed to the fact that HEC-RAS only predicts riverine flooding in the main channel, whereas the U-Flood data have the potential to act as supplementary data and bring the HEC-RAS model or FEMA up to full strength, based on its real-time characteristic.
4. Discussion
With regards to the first research question (RQ1), there were significant differences among the H&H model (i.e., HEC-RAS), the authorized references (i.e., FEMA and USGS HWM), and the crowdsourced U-Flood data. Nevertheless, the geographic pattern of WD among U-Flood, FEMA, and HEC-RAS displayed high similarity in the floodplain, while the degree of WD differences was higher along the river (Figure 7). For RQ2, which examined any significant differences in the inundated areas between the HEC-RAS-modeled floodplain and U-Flood observations, the statistics comparison results indicate that there was a significant difference between the HEC-RAS and U-Flood data (Figure 9 and Figure 10). Specifically, the percentages for the U-Flood data outside of the floodplain for the count and length comparisons were 38.41–55.87% and 52.57–70.94% respectively.
Due to significant differences found among the U-Flood data, the HEC-RAS model and the FEMA floodplain, it is recommended to exercise caution in interpreting U-Flood data and using these data to calibrate the HEC-RAS model. However, U-Flood data still have the potential to supplement real-time observations, especially outside of the floodway and the immediate floodplain to the main channel, and even outside of the modeled floodplain area (Figure 9 and Figure 10). Floodplain modeling (e.g., HEC-RAS) is typically restricted to the main channel, but not the tributaries and upstream floodplain due to the need and availability of USGS gauge data for calibration. Thus, such a modeling approach is only as good (or as comprehensive) as the gauge data that support it. Hence, non-riverine flooding in those remote areas would go unrecorded and their impacts on the local communities could be underestimated. At this time, U-Flood data could be potentially helpful as a supplementary data source for HEC-RAS modeling by offering valuable observations in regions without USGS stream gauges or authoritative data.
Moreover, U-Flood data would not fully represent the peak discharge reflected by the water depth for several reasons. First, these crowdsourcing projects are often a response to an urgent need (e.g., a natural disaster) that involves a time lag. This indicates that we should learn from this and be proactive in the future. The data reported from the public were only available from 31 August 2017 to 6 September. This was already far after the most severe flooding, which happened around the 25 August 2017 to 28 August. In fact, the daily peak flow discharge of USGS stream gauge 08074000 was observed when the dam released floodwater on 28 August 2017. Second, some data may be reported by the public that do not match the exact time and location of the flood. Some people reported inundated streets or roads hours or even days after they had access to the internet, while the flood might have already receded or flowed rapidly elsewhere. Thus, the time lag in the crowdsourced report might not reflect the realistic flooding situation corresponding to the time stamp in the U-Flood data. Third, U-Flood data have a lot of uncertainties. Some users might report a flood when they were walking or traveling in a boat, so the WSE is uncertain. Moreover, U-Flood data do not provide attributes indicative of the context of local inundation, some of them may come from dam-released flood water or direct stormwater runoff. Finally, the U-Flood data do not contain the water depth, and any water depth extraction from U-Flood would have errors as compared with the other flood datasets used in this study.
There were several reasons for the different underlying geographic patterns among the HEC-RAS model, the FEMA flood data, and the U-Flood data. First, the HEC-RAS and FEMA did not model the tributaries. Instead, the HEC-RAS model deployed in this study only simulated the main channel of the Buffalo Bayou watershed with only four USGS gauges. However, some U-Flood data could be observed near the tributaries or far from the main channel. Second, the U-Flood data outside the floodplain may have been caused by ineffective sewer drainage compounded with increased surface runoff from overland flow. We overlaid the Houston storm sewer map with a kernel line density surface produced from the U-Flood distribution (Figure 11) for illustration. The map reveals several high-density clusters of the U-Flood distribution near the upstream areas and two dams. As there were 45.34% (214 out of 472) U-Flood street segments that intersected with storm sewers, this might suggest that areas with U-Flood data that did not intersect with the storm sewer lines (54.64%) would suffer from flood inundation due to the absence of sewer lines to drain overflows during Hurricane Harvey. Those areas without storm sewers may need to build more storm sewers to cope with future flooding, e.g., during 500-year flood levels and above. These U-Flood data were observed in the urban area, so it was possible that the inundated streets were affected by the floodwater from multiple sources besides riverine flooding (e.g., damaged pipelines).
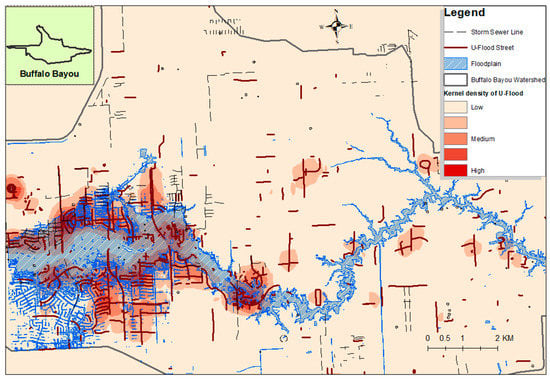
Figure 11.
The kernel density surface of U-Flood data overlaid with stormwater sewers [13].
Third, the absence of U-Flood data in some areas (e.g., the HEC-RAS-modeled floodplain and the FEMA floodplain) could be attributed to sampling bias in which no or less volunteers could observe or report the inundated streets [11]. The results showed a less consistent decreasing trend for the U-Flood data and the modeled floodplain over time. It could be a result of (a) fewer observations volunteered by the crowd, or (b) less flooding across 7 days over a spatially heterogeneous inundation landscape. With regards to the former cause, people may not report flood information because they do not have good signals or devices during or immediately after the flood, or some places where floods happened are sparsely populated. This phenomenon may be further compounded by the geographic disparity of the digital divide. However, there was a decreasing reporting trend (about an 11% reduction) in the total number of U-Flood data observations during the study period from 31 August 2017 to September 6, and there was about a 36% reduction in the U-Flood data count inside the HEC-RAS-modeled floodplain (Figure 11). This indicates means less observations volunteered by the crowd might be a partial cause of the inconsistency. Moreover, the modeled flood inundation maps (Figure 6) and the USGS gauge records showed that the flood receded gradually over the 7-day period.
In this study, the WD extraction method for U-Flood used a zonal maximum approach, which assumed the street segments were entirely inundated and estimated the WD using the maximum difference from underlaying the DEM. As a result, it tended to overestimate the WD, especially when (1) the U-Flood road segment was long, and (2) the slope along those segments was steep (i.e., large elevation change). This WD discrepancy was particularly noticeable at the edge of the HEC-RAS floodplain (Figure 8) when the U-Flood streets were not completely contained by the modeled floodplain (i.e., did not have at least one end within the floodplain boundary). In this case, the base DEM could be extracted from a location that was not suitable to derive the real water surface elevation (WSE). Therefore, this study suggests that future VGI studies should exclude crowdsourced features that are not “completely contained in the modeled floodplain” to mitigate WD discrepancy. It might also be possible to investigate other WD extraction methods that avoid these assumptions.
Nevertheless, the quality of U-Flood is of vital importance to the accuracy and utility of flood monitoring. Furthermore, it might be possible to reduce the uncertainties of U-Flood data by setting gatekeepers to review reported observations from the public. For example, Goodchild and Li [13] described a social approach that imitates the structure of traditional authoritative mapping agencies, with “experts” who serve as gatekeepers to reconcile any inconsistent observations and assure the quality of voluntary contributions. The crowdsourcing approach [13] leverages the power of the crowd to approximate the “ground truth” and to validate the errors that can potentially improve the credibility of the U-Flood data. For example, a single observation can be examined by nearby observations to flag any sampling bias. Moreover, informing and educating the public to report scientific observations can improve the data quality as a long-term strategy. For example, empowering the public with clear instructions for a data collection protocol along with a user-friendly web/mobile interface can enable effective citizen science and ensure the essential attributes for each observation are recorded (i.e., GPS location, flood status, etc.). As a result, such instructions may reduce the spatial and/or temporal uncertainties associated with this VGI.
In summary, this study provides some suggestions for “best practices” for crowdsourcing data on digital platforms (i.e., app or website) for future applications: (a) Provide a form with a simple user interface designed to ease user input; (b) users should report data with GPS turned on for accurate location of flood; (c) use existing media outlets (e.g., radio stations, social media) to promote the app before storm season to raise public awareness. Overall, the combination of the strategies stated above would improve the quality of U-Flood data.
5. Conclusions
The primary purpose of this study was to evaluate the quality of crowdsourced data for flood mapping of Hurricane Harvey in the Houston area. This study provides a preliminary assessment of the data quality of VGI by comparing the WD among crowdsourced data, authoritative data, and modeled output. This fills a gap in the literature concerning the usefulness of crowdsourced data in floods, but also provides useful insights about their spatio-temporal uncertainties. Being able to prove where and when these uncertainties are with empirical data and visualize them in this study is a good start to understanding the quality of big data analytics. In addition, learning to better plan crowdsourcing projects ahead of time of the disaster (so there would be less time lag) and being aware of any spatial sampling biases are of practical significance. The findings from this study also open a new research agenda for improving and assessing uncertainties regarding the crowdsourced data quality, and crowdsourcing data supplements in flood mapping research.
The reasons for the significant differences and geographic distribution are worth investigating in future studies and will help illustrate the appropriate caution necessary when using crowdsourced data as supplementary data for data-driven geographic knowledge discovery [14]. It is necessary to pay more attention to evaluating the accuracy of crowdsourced data by checking their quality and improving the workflow when acquiring such crowdsourced data. Despite the spatio-temporal uncertainties in the crowdsourced U-Flood dataset (e.g., the lack of water depth, the reporting lag from the public), it may present an opportunity to serve as supplementary observations to calibrate hydrologic and hydraulic models, especially in areas without USGS stream gauges or that are not covered by the FEMA floodplain maps. In particular, crowdsourced data available outside the modeled floodplain could provide supplementary data from outside of observed USGS stream gauge and HEC-RAS model. The emergence of such crowdsourced data presents an opportunity to can be cautiously exploited in future citizen science projects.
While the availability of U-Flood data is unique to the Harvey event in the United States, the findings from this research can be applicable to other VGI projects of a similar nature elsewhere [15]. Understandably, the availability and usability of such VGI projects in other parts of the world might depend on a list of factors, including, but not limited to, hazard impacts, physical and social vulnerability, disaster preparation, the digital divide, civil awareness, etc. Nevertheless, previous studies revealed some success in initiating and implementing VGI projects for flood management [4,6,16,17,18]. Future work can examine the quality of other crowdsourced data for flood modeling and other applications [19].
Author Contributions
Conceptualization, J.C., T.E.C. and K.M.; project implementation and execution, J.C.; writing—original draft preparation, T.E.C. and J.C.; writing—review and editing, J.C., T.E.C. and K.M. All authors have read and agreed to the published version of the manuscript.
Funding
This research received no external funding.
Data Availability Statement
The U-Flood project website has been terminated by the original data curators (see acknowledgments below). The authors created a repository of U-Flood data, which has not been altered, on GitHub for data sharing purposes. The open data can be accessible under the Creative Common Attribution-ShareAlike license (CC By-SA 2.0) at: https://github.com/jchientx/Uflood (accessed on 15 May 2023) The authors do not claim any ownership, rights or liability in using this open data.
Acknowledgments
The authors appreciate the constructive comments from the three anonymous reviewers. The crowdsourced data used in this study were extracted from the U-Flood project, which was initiated and conducted by the consultants at the environmental firm Marine Weather and Climate and the tech company Tailwind Labs. The effort from all volunteers who crowdsourced those U-Flood data are appreciated.
Conflicts of Interest
The authors declare no conflict of interest.
References
- Goodchild, M.F. Citizens as sensors: The world of volunteered geography. GeoJournal 2007, 69, 211–221. [Google Scholar] [CrossRef]
- Sui, D.; Goodchild, M.; Elwood, S. Volunteered geographic information, the exaflood, and the growing digital divide. Crowdsourc. Geogr. Knowl. 2012, 1–12. [Google Scholar] [CrossRef]
- Douvinet, J.; Kouadio, J.; Bonnet, E.; Gensel, J. Crowdsourcing and crisis-mapping in the event of floods: Tools and challenges. Floods 2017, 2, 209–223. [Google Scholar] [CrossRef]
- Fohringer, J.; Dransch, D.; Kreibich, H.; Schröter, K. Social media as an information source for rapid flood inundation mapping. Nat. Hazards Earth Syst. Sci. 2015, 15, 2725–2738. [Google Scholar] [CrossRef]
- Schnebele, E.; Cervone, G.; Waters, N. Road assessment after flood events using non-authoritative data. Nat. Hazards Earth Syst. Sci. 2014, 14, 1007–1015. [Google Scholar] [CrossRef]
- Le Coz, J.; Patalano, A.; Collins, D.; Guillén, N.F.; García, C.M.; Smart, G.M.; Bind, J.; Chiaverini, A.; Le Boursicaud, R.; Dramais, G.; et al. Crowdsourced data for flood hydrology: Feedback from recent citizen science projects in Argentina, France and New Zealand. J. Hydrol. 2016, 541, 766–777. [Google Scholar] [CrossRef]
- Dell’Acqua, F.; De Vecchi, D. Potentials of active and passive geospatial crowdsourcing in complementing Sentinel data and supporting Copernicus Service portfolio. Proc. IEEE 2017, 105, 1913–1925. [Google Scholar] [CrossRef]
- Haklay, M. Citizen science and volunteered geographic information: Overview and typology of participation. Crowdsourc. Geogr. Knowl. 2012, 105–122. [Google Scholar] [CrossRef]
- Kutija, V.; Bertsch, R.; Glenis, V.; Alderson, D.; Parkin, G.; Walsh, C.; Robinson, J.; Kilsby, C. Model Validation Using Crowd-sourced Data from a Large Pluvial Flood [WWW Document]. CUNY Academic Works. Available online: https://academicworks.cuny.edu/cc_conf_hic/415/ (accessed on 10 March 2023).
- Annis, A.; Nardi, F. Integrating VGI and 2D hydraulic models into a data assimilation framework for Real Time Flood forecasting and mapping. Geo-Spat. Inf. Sci. 2019, 22, 223–236. [Google Scholar] [CrossRef]
- Kong, X.; Yang, J.; Qiu, J.; Zhang, Q.; Chen, X.; Wang, M.; Jiang, S. Post-event flood mapping for road networks using taxi gps data. J. Flood Risk Manag. 2022, 15, e12799. [Google Scholar] [CrossRef]
- Alizadeh Kharazi, B.; Behzadan, A.H. Flood depth mapping in street photos with image processing and deep neural networks. Comput. Environ. Urban Syst. 2021, 88, 101628. [Google Scholar] [CrossRef]
- Chien, J. Validating the Quality of Crowdsourced Data for Flood Modeling of Hurricane Harvey in Houston, Texas; Texas State University: San Marcos, CA, USA, 2019. [Google Scholar]
- Goodchild, M.F.; Li, L. Assuring the quality of volunteered geographic information. Spat. Stat. 2012, 1, 110–120. [Google Scholar] [CrossRef]
- Miller, H.J.; Goodchild, M.F. Data-driven geography. GeoJournal 2014, 80, 449–461. [Google Scholar] [CrossRef]
- Safaei-Moghadam, A.; Tarboton, D.; Minsker, B. Estimating the likelihood of roadway pluvial flood based on crowdsourced traffic data and depression-based DEM analysis. Nat. Hazards Earth Syst. Sci. 2023, 23, 1–19. [Google Scholar] [CrossRef]
- Praharaj, S.; Zahura, F.T.; Chen, T.D.; Shen, Y.; Zeng, L.; Goodall, J.L. Assessing trustworthiness of crowdsourced flood incident reports using Waze data: A Norfolk, Virginia case study. Transp. Res. Rec. 2021, 2675, 650–662. [Google Scholar] [CrossRef]
- Hung, K.-C.; Kalantari, M.; Rajabifard, A. Methods for assessing the credibility of volunteered geographic information in flood response: A case study in Brisbane, Australia. Appl. Geogr. 2016, 68, 37–47. [Google Scholar] [CrossRef]
- Ostermann, F.; Spinsanti, L. Context analysis of volunteered geographic information from social media networks to support disaster management: A case study on forest fires. Int. J. Inf. Syst. Crisis Response Manag. 2012, 4, 16–37. [Google Scholar] [CrossRef]
Disclaimer/Publisher’s Note: The statements, opinions and data contained in all publications are solely those of the individual author(s) and contributor(s) and not of MDPI and/or the editor(s). MDPI and/or the editor(s) disclaim responsibility for any injury to people or property resulting from any ideas, methods, instructions or products referred to in the content. |
© 2023 by the authors. Licensee MDPI, Basel, Switzerland. This article is an open access article distributed under the terms and conditions of the Creative Commons Attribution (CC BY) license (https://creativecommons.org/licenses/by/4.0/).