Article

Detection of Heavy Metals, Their Distribution in Tilapia spp., and Health Risks Assessment

1
Resiliency and Sustainable Development Laboratory, Yuchengco Innovation Center, Mapua University, Intramuros, Manila 1002, National Capital Region, Philippines
2
Food Processing Technology Research and Development Center (FPTRDC), Mindoro State University (MinSU)-Calapan City Campus, Masipit, Calapan City 5200, Oriental Mindoro, Philippines
3
The Graduate School, University of Santo Tomas, España Blvd, Sampaloc, Manila 1008, National Capital Region, Philippines
4
College of Teacher Education, Mindoro State University (MinSU)-Calapan City Campus, Masipit, Calapan City 5200, Oriental Mindoro, Philippines
5
Graduate School, Mindoro State University (MinSU)-Calapan City Campus, Masipit, Calapan City 5200, Oriental Mindoro, Philippines
6
MIMAROPA Food Innovation Center (FIC), Mindoro State University (MinSU)-Calapan City Campus, Masipit, Calapan City 5200, Oriental Mindoro, Philippines
7
Mapua-MSC Joint Research Laboratory, Marinduque State College, Boac 4900, Marinduque, Philippines
8
College of Environmental Studies, Marinduque State College, Boac 4900, Marinduque, Philippines
9
Research Center for the Natural and Applied Sciences, University of Santo Tomas, Sampaloc, Manila 1008, National Capital Region, Philippines
10
Department of Biochemistry, Faculty of Pharmacy, University of Santo Tomas, Sampaloc, Manila 1008, National Capital Region, Philippines
11
College of Business and Management, Mindoro State University (MinSU)-Calapan City Campus, Masipit, Calapan City 5200, Oriental Mindoro, Philippines
12
School of Civil, Environmental, and Geological Engineering, Mapua University, Intramuros, Manila 1002, National Capital Region, Philippines
*
Author to whom correspondence should be addressed.
Toxics 2023, 11(3), 286; https://doi.org/10.3390/toxics11030286
Submission received: 17 February 2023 / Revised: 16 March 2023 / Accepted: 17 March 2023 / Published: 20 March 2023
(This article belongs to the Special Issue Environmental and Health Effects of Heavy Metal)

Abstract

:
Concentrations of heavy metals (HMs) were assessed in Tilapia spp. from selected communities in Calapan City, Philippines. Eleven (11) inland farmed tilapia samples were collected and analyzed for HMs concentration using X-ray fluorescence (XRF). The 11 fish samples were cut into seven pieces, according to the fish body parts, constituting a total of 77 samples. These fish samples were then labeled as bone, fins, head, meat, skin, and viscera. Results showed that the mean concentration of Cd in all parts of tilapia exceeded the Food and Agriculture Organization/World Health Organization (FAO/WHO) limits. The highest concentration was recorded in the fins, which was sevenfold higher than the limit. The trend of the mean concentration of Cd in different parts of tilapia was fins > viscera > skin > tail > head > meat > bone. The target hazard quotient (THQ) recorded a value less than 1. This means that the population exposed to tilapia, within the area where fish samples originated, were not at risk to non-carcinogens. The concentrations of Cu, Pb, Mn, Hg, and Zn in different parts, particularly in skin, fins, and viscera, also exceeded the FAO/WHO limits. The calculated cancer risk (CR) in consuming the fish skin, meat, fins, bone, viscera, and head was higher than the USEPA limit. This indicated a possible carcinogenic risk when consumed regularly. Most of the correlations observed between HMs in various parts of the tilapia had positive (direct) relationships, which were attributed to the HM toxicity target organ characteristics. Results of the principal component analysis (PCA) showed that most of the dominating HMs recorded in tilapia were attributable to anthropogenic activities and natural weathering within the watershed of agricultural areas. The agriculture area comprises about 86.83% of the overall land area of Calapan City. The identified carcinogenic risks were associated with Cd. Therefore, regular monitoring of HMs in inland fishes, their habitat, and surface water quality shall be carried out. This information is useful in creating strategies in metals concentration monitoring, health risks reduction program, and relevant guidelines that would reduce the accumulation of HM in fish.

1. Introduction

After milkfish, tilapia is the second most farmed fish in the Philippines [1], with an average annual consumption of 4.6 kg per person [2]. The Mozambique tilapia (Oreochromis mossambicus), imported from Thailand in 1950, was the first tilapia to be introduced to the Philippines. Meanwhile, the Nile tilapia (O. niloticus) was introduced in 1972 and is now the country’s main species of tilapia being farmed [3] (pp. 75–91). In 2019, the tilapia per capita availability for Filipinos was 2.9 kg/y, compared to 2.5 kg/y for milkfish [4] (p. 25). Luzon (mostly freshwater) is the country’s largest producer of farmed tilapia, accounting for 92% of total output (261,210 MT) in the country, followed by Mindanao (freshwater and seawater) at 6%, as well as the Visayas (mostly brackish water) at 2% [1,5]. Tilapia aquaculture is one of Calapan City’s inland fishing industries, providing living and a source of food to many residents. The city of Calapan is located on the northeastern coast of the island of Mindoro and the capital city of Oriental Mindoro. It covers an area of 21,730 hectares and is composed of 62 barangays (the smallest administrative local government unit). A total of 18,607.8 hectares (86.83% of the total area) are dedicated to agriculture (rice fields) and fishing, with 1300 hectares (5.98% of the total area) dedicated to inland fishing and the rest to other agricultural, residential, commercial activities, and few industry sectors [6].
Fish, including tilapia, are some of the most consumed animal-derived food items due to their high nutritional content, which includes high-quality animal protein and a variety of minerals and other essential nutrients [7,8,9,10,11]. With food safety being a significant public health concern worldwide, there is a tremendous demand for studies on the safety of food products such as fish consumed by people. Risks connected with consuming of contaminated foods have been a prominent focus of scientific investigation in recent decades [12]. Heavy metals (HMs) are among the most dangerous contaminants in food production and distribution [13,14], including fisheries. These issues are becoming increasingly serious over the world, particularly in developing countries [12].
HMs introduced to the aquatic environment, primarily as a result of human activities [15], accumulate in the water environment and subsequently pass via the food chain to aquatic organisms [16]. The quantities of HMs in fish have been intensively examined in many locations throughout the world during the last several decades [17]. Fish are also employed as bioindicators of aquatic ecosystems to determine the extent of HM pollution and the risk of bioaccumulation to humans [18]. This is because fish are particularly vulnerable to pollution and changes in their surrounding environment [19]. The study of Ali et al. [20] shows that fish, indeed, can be used for the biomonitoring of aquatic ecosystems.
Several studies have been conducted in the Philippines in recent years to study the level of HM concentrations in selected species of tilapia [21,22,23] and their potential as bioindicators of water pollution [24,25,26]. To the best of the authors’ knowledge, this is the first study that investigated the level of concentrations of HMs in meat and various organs of Tilapia spp. in Calapan City and even in the whole province of Oriental Mindoro. With that, this study aimed to (i) provide baseline data on the distribution of HMs in various parts of Tilapia spp. samples from selected communities in Calapan City, Philippines and (ii) assess the health risks associated with the consumption of the investigated tilapia samples. The levels of HMs in the fish samples can give preliminary insights on the level of aquatic pollution in the area, while the result of the health risks assessment will have implications on food safety and quality.

2. Materials and Methods

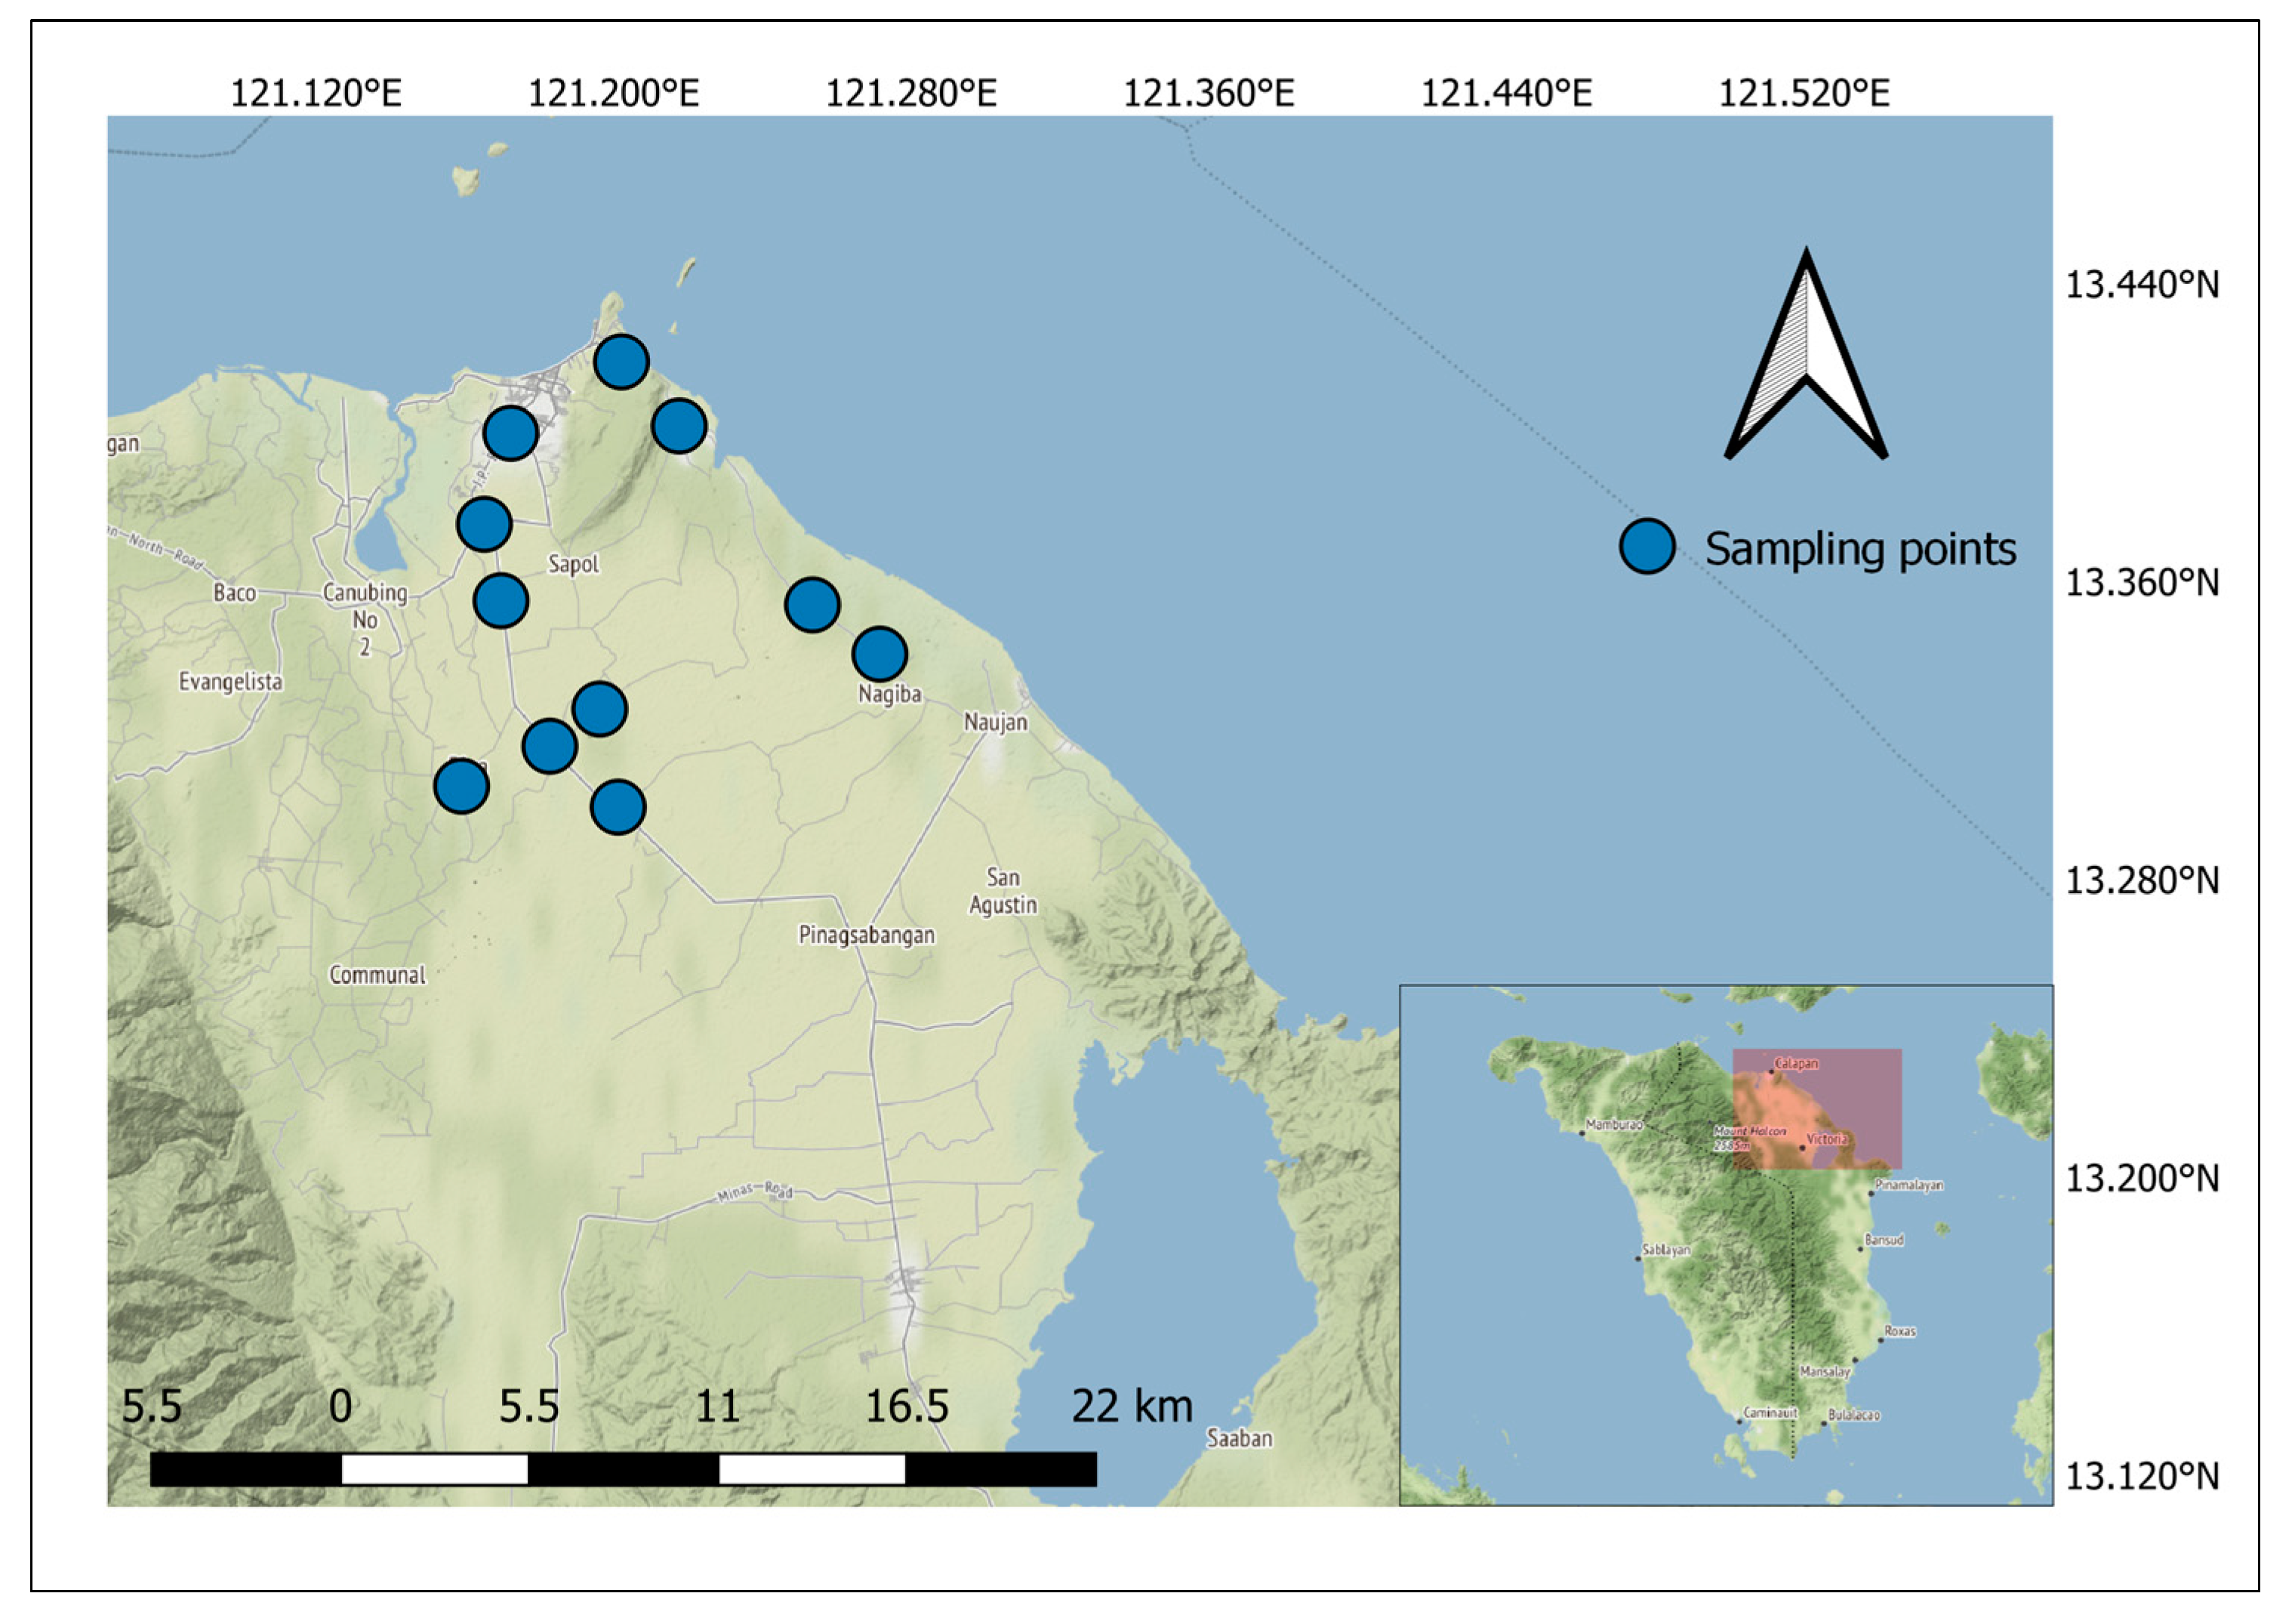
2.1. Study Area and Sample Collection

Eleven (11) samples of Tilapia spp. were collected from vendors in the barangays of Calapan City, as described by the global positioning system (GPS) plots in Figure 1. These are the barangays that had available Tilapia spp. that could spatially represent Calapan City. This city is about 73.28 nautical miles (about 5 h of travel by land and sea) from Manila, the Philippines’ capital city. Barangays are the most basic territorial, administrative, and local government units in the Philippines [21]. In addition, GPS coordinates for collection sites were recorded to map the source or origin of fish samples. The eleven (11) barangays from which the fish samples were collected were: Bayanan II, Biga, Comunal, Lalud, Managpi, Nag-iba I, Nag-iba II, Panggalaan, Parang, Sta. Isabel, and Suqui.

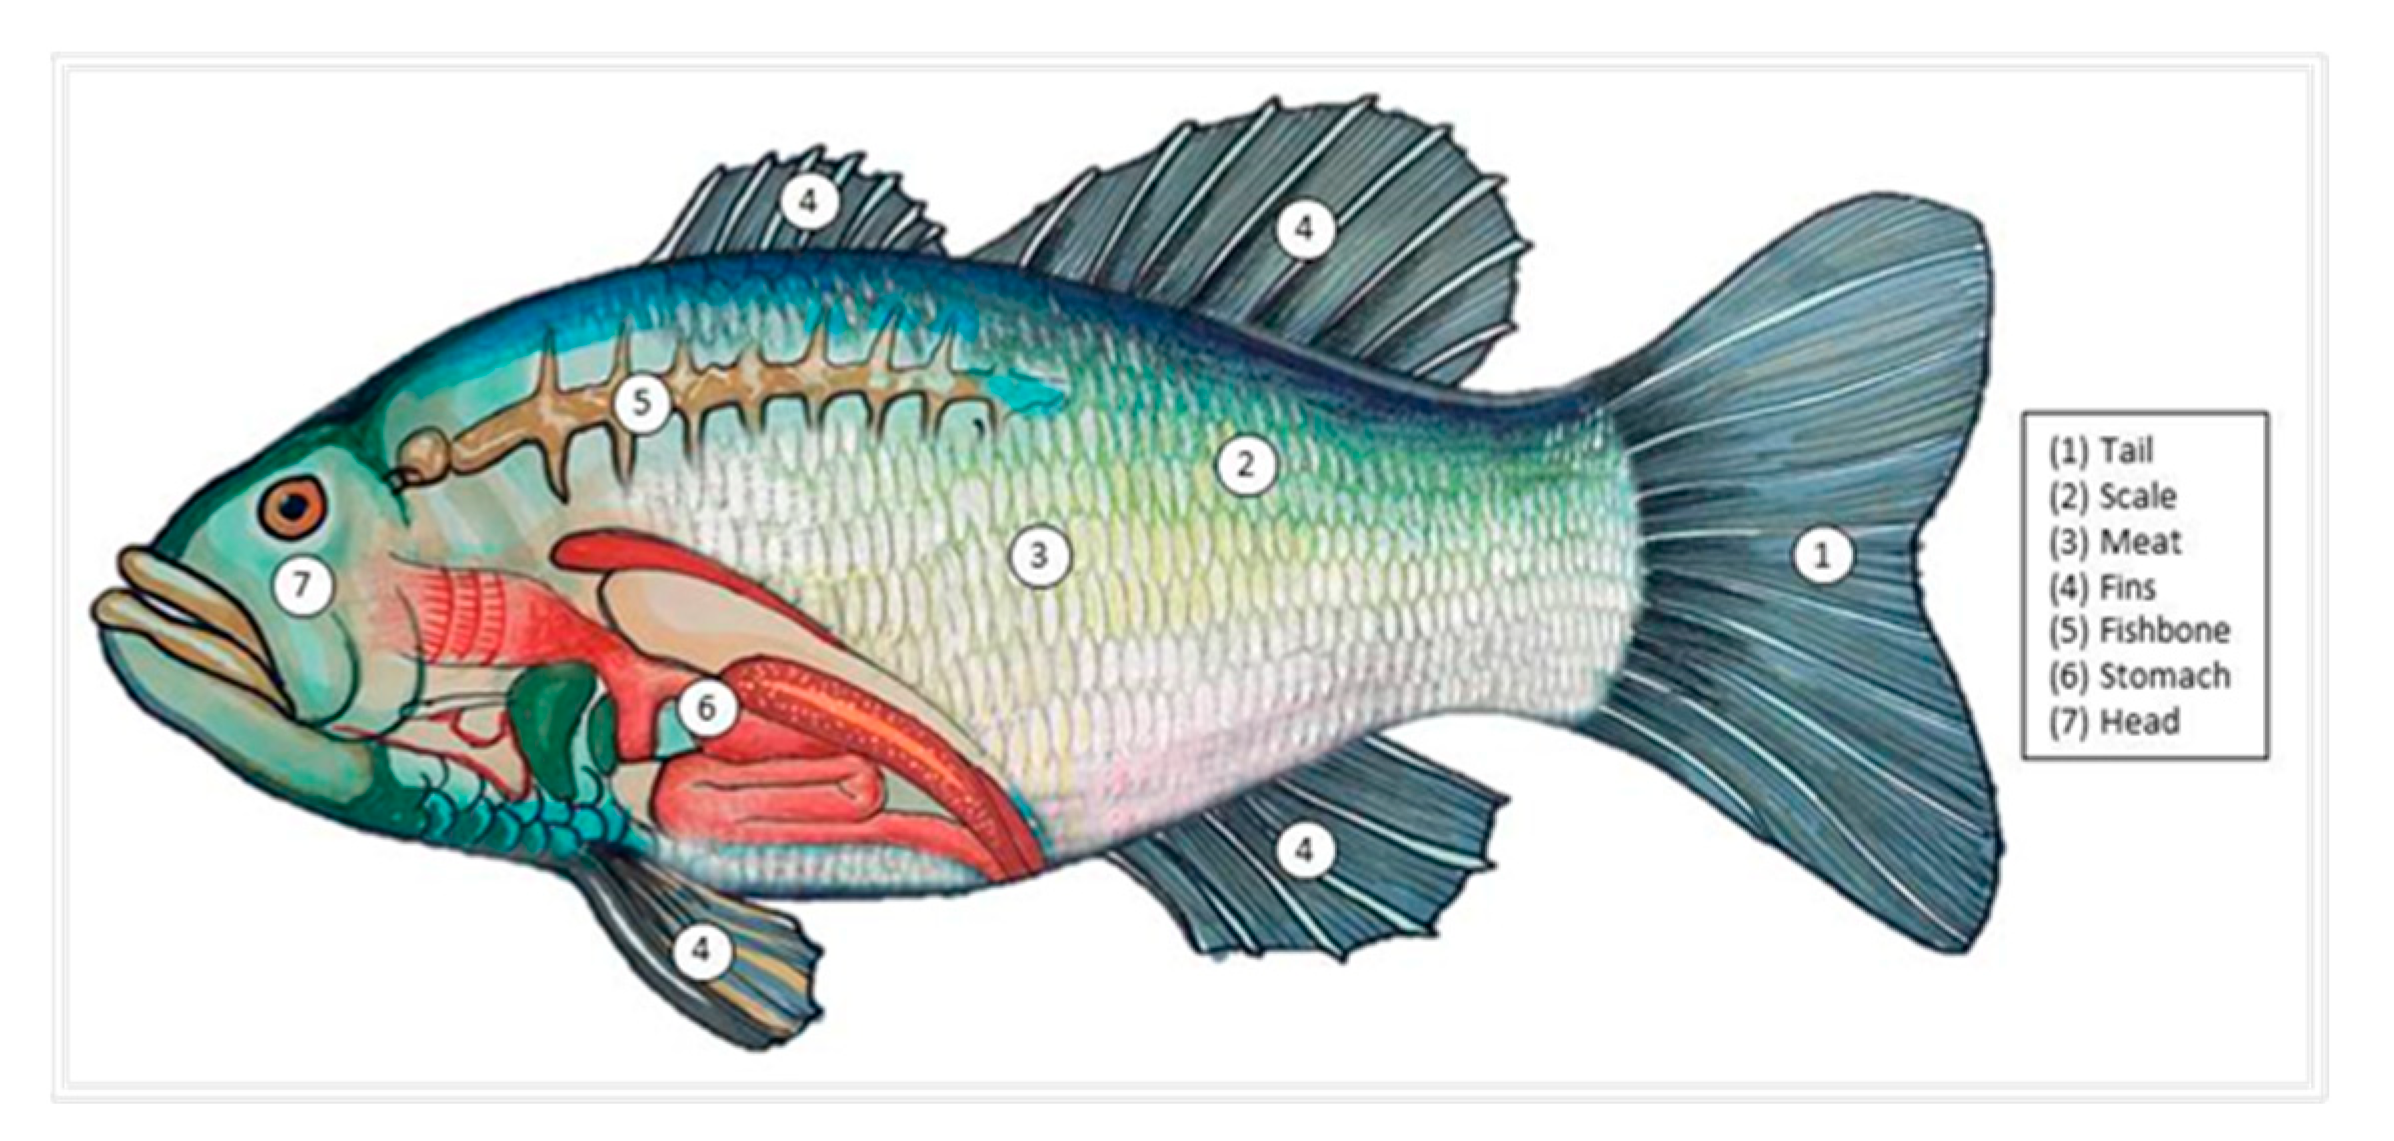
2.2. Sample Collection, Preparation and Analysis

Approximately one (1) kilogram of each Tilapia spp. of the same size (length of ±7”) from eleven (11) sampling sites were bought from local fish vendors. The collected samples were wrapped in a cleaned plastic container, sealed, labeled, and kept in an icebox cooler before transporting them to MIMAROPA Food Innovation Center. The fish samples, bought from 11 sites, were cut into seven parts, namely, the tail, scale/skin, meat, fins, bones, viscera/stomach, and head, and they were weighed, grouped, and labeled according to fish parts, such as bone, fins, head, meat, skin, tail, and stomach/viscera. The 11 Tilapia spp. fish samples became 77 samples for metal analysis. This is to identify which part of the Tilapia spp. contains the lowest and the highest metals concentration. Figure 2 illustrates the tilapia fish and its various parts. The 77 samples were then dried in the Electric Dehydrating Memmert UF750 oven with the aid of a tray. The oven was set at 65 °C, and the fish samples were dried for eight hours. After drying, the tilapia fish samples were powdered using the Dowell Portable Blender. Powdered samples were then placed in resealable plastic bag No. 2 (60 × 85 × 0.04 mm) and labeled accordingly. The 77 powdered samples, with mean dry weight shown in Table 1, were prepared following the USEPA 823-B-00-007 [27]. The typical minimum sample weight for Vanta XRF analysis is 5 g. The sample weight does not affect the elemental detection capability and sensitivity of XRF. The fish samples were analyzed for their metals concentrations using the portable Olympus Vanta X-ray Fluorescence (XRF) spectrometer, of the Yuchengco Innovation Center of Mapua University, at the Food Processing Technology Research and Development Center of Mindoro State University Calapan City Campus. The XRF, set to soil mode, was calibrated with the aid of the manufacturer using the Olympus Vanta XRF standard reference in a No. 2 resealable plastic bag, together with the ICP-OES results of comparable set of samples. ICP-OES has been internationally accepted as the primary instrument for elemental analysis. Hence, this study used ICP-OES as a calibration aid to ensure an accurate result of the XRF. The new model, as a result of calibration to adjust default calibration values and meet site specific factors, has been labelled as ‘soil ziploc mode’. After this, the portable XRF is ready for elemental analysis and becomes a reliable instrument for metal detection in this study for various media, and it has been used in various studies [28,29,30,31,32,33,34]. The 77 samples were analyzed for the presence of ten (10) metals, such as arsenic (As), barium (Ba), cadmium (Cd), copper (Cu), iron (Fe), lead (Pb), manganese (Mn), mercury (Hg), nickel (Ni), and zinc (Zn). The limit of detection (LOD) of XRF with respect to the identified HMs is shown in Table 2. All extracted data values showing “LOD” were represented by a number that is one step lower than the XRF LOD value shown in Table 2. This is to represent numeral values in calculating the quantitative health risks.

2.3. Health Risk Assessment

The health risk was assessed using the chronic daily intake (CDI), target hazard quotient (THQ), and cancer risk (CR). These were calculated to estimate the various health consequences associated with HM consumption of tilapia, particularly its meat.

2.3.1. Chronic Daily Intake (EDI)

The CDI of all HMs detected through ingestion of various parts of tilapia was determined following Equation (1) [28].
C D I = C m × I R × E F × E D B W × A T
where Cm is the concentration of HMs (mg/kg), IR is the ingestion rate of various parts (kg/person/day) (Table 3), EF is the exposure frequency (365 days/year) [28], ED is exposure duration (70 years) [28], BW is the average body weight of an adult Filipino (70 kg) [28], and AT is the averaging time (EF × ED).

2.3.2. Target Hazard Quotient (THQ)

The non-carcinogenic health risk (NCHR) posed by the consumption of the various parts of tilapia contaminated with HMs was defined by THQ and was estimated by following Equation (2) [28,38].
T H Q = C D I R f D
where RfD is the reference dose of metals that provides an estimate of the daily exposure of an individual to a particular contaminant such as HM with a potential non-carcinogenic health risk [39] The RfDs for As, Ba, Cd, Cu, Fe, Pb, Mn, Hg, Ni, and Zn are 0.0003, 0.2, 0.001, 0.04, 0.7, 0.0035, 0.14, 0.0001, 0.02, and 0.3 mg kg−1, respectively [40,41,42,43,44,45,46]. Generally, a THQ < 1 implies very little to no non-carcinogenic health effects. This means no adverse health effect is expected for the population. A THQ of ≥1 means that the population exposed to the metals hazards in fish is at risk.
To understand the overall non-carcinogenic health risks due to the intake of various parts of tilapia, the total target hazard quotient (TTHQ) was calculated following Equation (3) [21].
TTHQ = THQAs + THQBa + THQCd + THQCu + THQFe + THQPb + THQMn + THQHg + THQNi + THQZn
As with the THQ, a computed TTHQ of <1 implies no adverse health effect is expected. A TTHQ of ≥1 implies that the exposed population is at risk.

2.3.3. Cancer Risk (CR)

To assess the potential carcinogenic risk due to lifetime exposure to carcinogens, Equation (4) was followed [47].
C R = C D I × S F
where SF (mg kg−1 day−1) denotes the cancer slope factors set by the United States Environmental Protection Agency(USEPA) for a certain carcinogen. In this study, only As, Cd, Pb, and Ni were included in the calculation of CR, as they were identified as carcinogens by the USEPA [48]. The SF values for As, Cd, Pb, and Ni are 1.5, 6.3, 0.0085, and 0.84 mg kg−1 day−1, respectively [28,49,50]. CR values greater than 1 × 10⁻⁴ indicate that there is a high probability of the occurrence of cancer risk in the population [51].

2.4. Data Analysis

Descriptive statistics of the HM concentration in various parts of tilapia were provided using Microsoft Excel 2016. The concentrations of HMs in tilapia were Box-Cox transformed prior to multivariate analysis [52] using IBM SPSS Statistics 23 to ensure that the data were normally distributed [53]. One-way ANOVA was employed to indicate the significant differences in HMs in various parts of tilapia. To understand the relationships of HMs in various parts of tilapia, a correlation matrix (CM) in the form of a correlogram was performed using RStudio. Similarly, principal component analysis (PCA) was employed using PAST 4.03 to further support the result of the CM and evaluate the possible sources of HMs in the study area. The principal components (PC), which had eigenvalues greater than 1 and comprised >70% of the total variance, were retained after the PCA [53,54].

3. Results

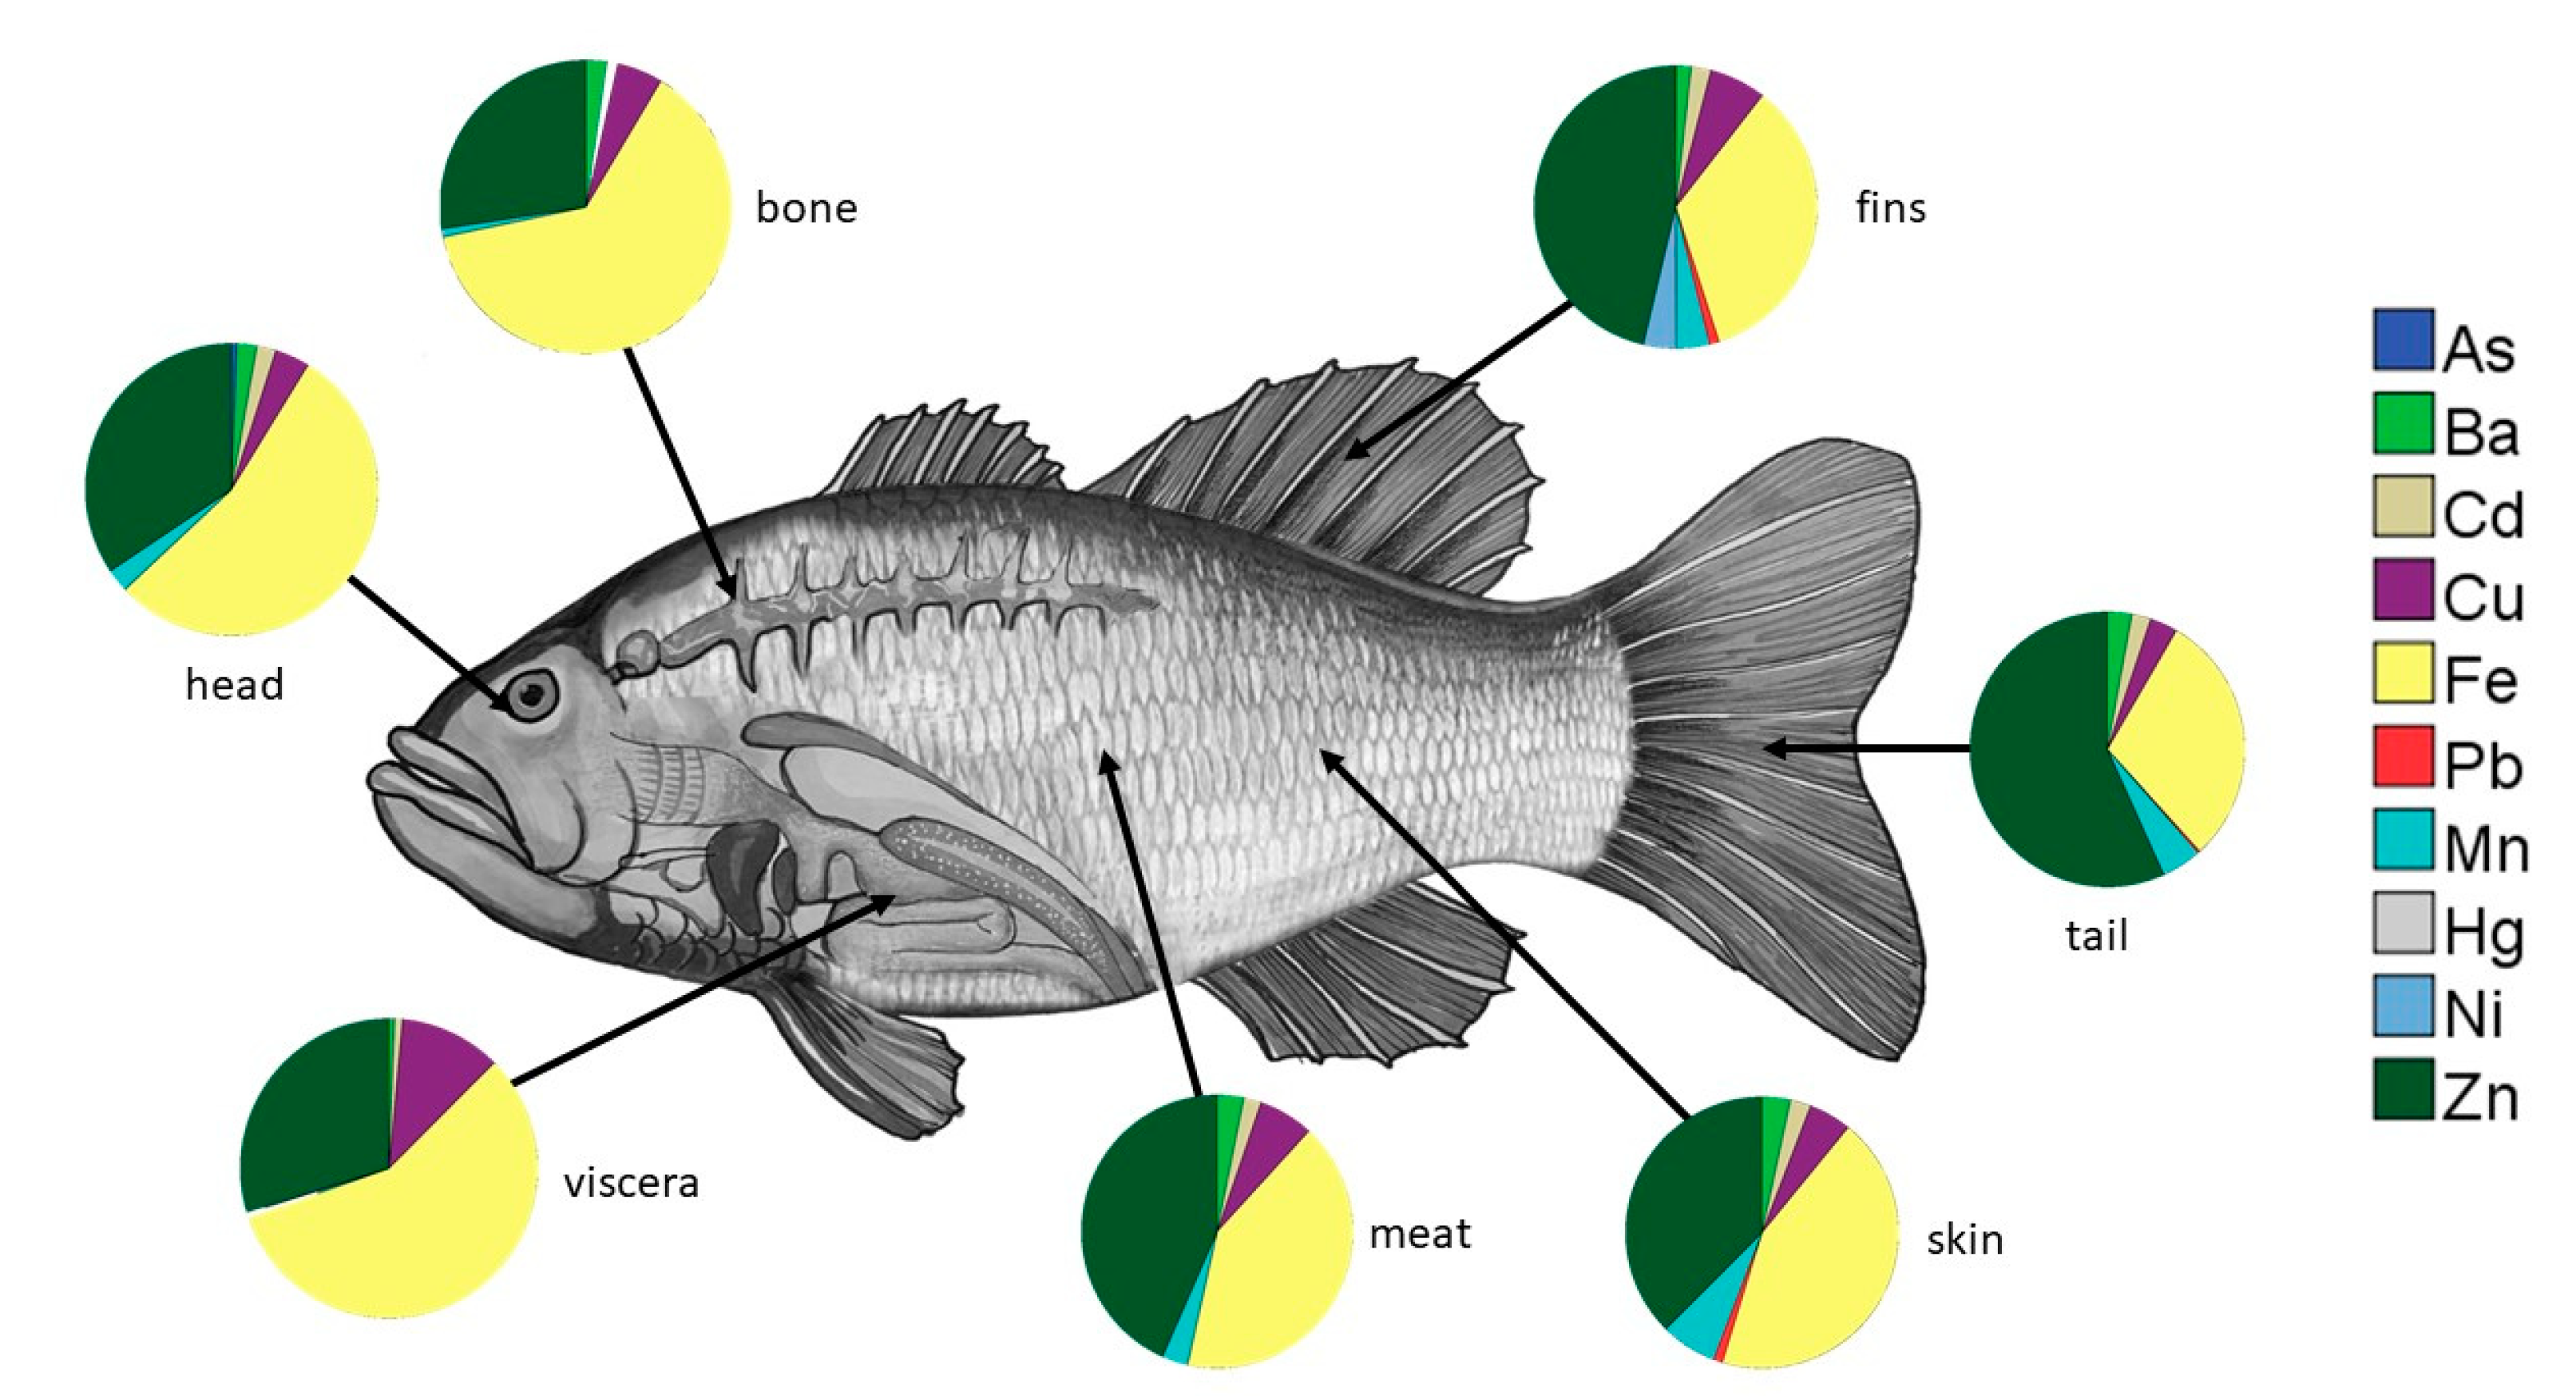
3.1. Concentration of HMs in Different Parts of the Fish

X-ray fluorescence (XRF) analysis was used to determine the levels of HMs (As, Ba, Cd, Cu, Fe, Pb, Mn, Hg, Ni, and Zn) in tilapia collected from eleven (11) barangays in Calapan City, Oriental Mindoro, Philippines. The mean concentrations of these HMs in the tail, skin, meat, fins, bone, stomach, and head of the tilapia are shown in Table 4.
The mean concentration of Cd in all parts of tilapia exceeded the FAO/WHO limit [55,56]. The highest concentration was recorded in the fins, which was sevenfold higher than the limit. The mean concentration of Cd in different parts of tilapia is in decreasing order of fins > viscera > skin > tail > head > meat > bone. For the Cu concentration, only the concentration in the viscera exceeded the FAO/WHO limit [55,56]. The mean concentration of Cu in several parts of tilapia is in the following order: viscera > fins > skin > meat > bone > tail > head. Similarly, the mean concentrations of Pb in the skin and fins of tilapia exceeded the FAO/WHO limit [55,56]. The mean concentrations of Mn in all parts of tilapia except for the bone exceeded the limit of 1. The Mn concentration in the parts of tilapia follows the order of skin > fins > tail > meat > head > viscera > bone. For the mean concentration of Hg, only the concentration in viscera exceeded the FAO/WHO limit [55,56]. On the other hand, only the mean concentration of Zn in the viscera of tilapia exceeded the allowable limit. Results of the one-way ANOVA (Table 5) show that the accumulation of Ba, Cu, Mn, and Zn in various parts of the tilapia was significantly different (p < 0.005). Figure 3 shows the concentration (%) of HMs in each part of the tilapia. Fe and Zn were recorded to have the highest concentration in each part.

3.2. Health Risk Assessment

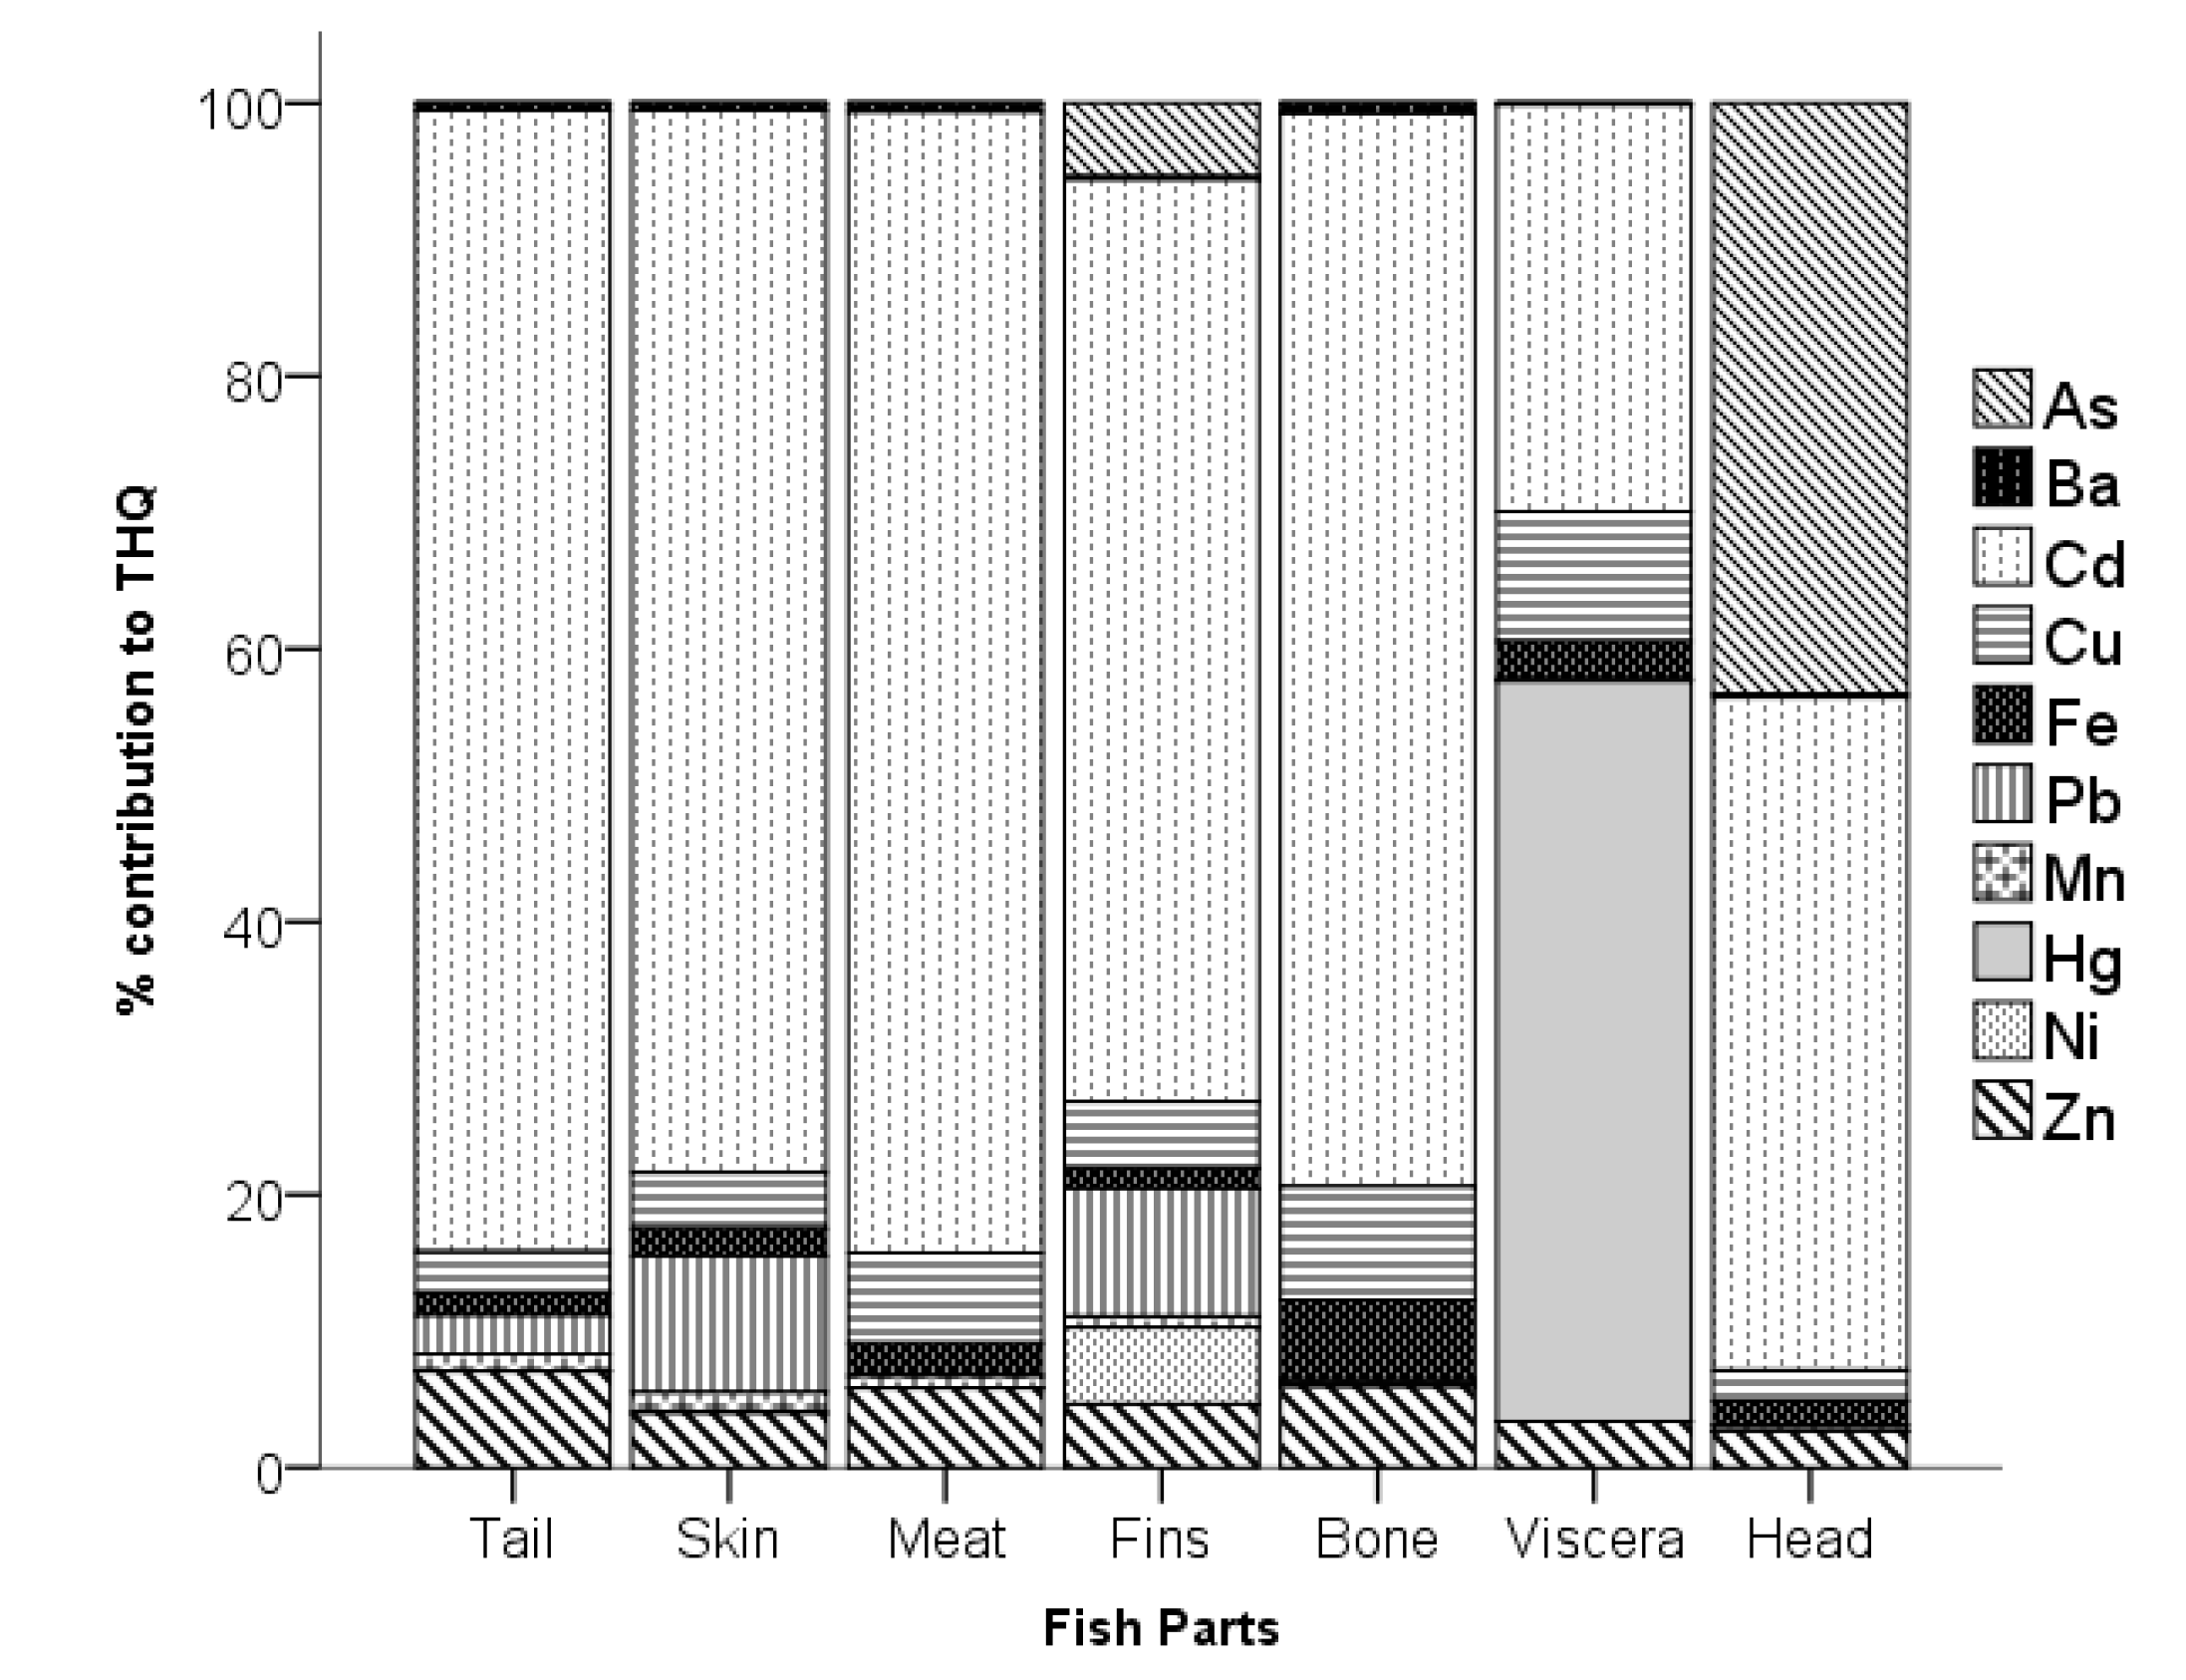
3.2.1. Non-Carcinogenic Health Risk (NCHR) Assessment

The NCHR of HMs to the locals of Calapan City is shown in Table 6. The NCHR of the HMs in the various parts of tilapia, as represented by the target hazard quotient (THQ), did not exceed 1. This means that the population exposed to the fish is not at risk [21] to non-carcinogens. The highest THQs were recorded for Hg in the viscera at 0.0822 and Cd in the meat at 0.0805. As shown in Figure 4, the highest percent (%) contribution to the THQ of the tail, skin, meat, fins, bone, and head was due to Cd, which ranged from 49.34–83.63%. On the other hand, Hg contributed much to the THQ of the viscera at 54.26%. Generally, the THQ of HMs in various parts of tilapia follows the decreasing order of Cd > Hg > As > Cu > Zn > Pb > Fe > Ni > Mn > Ba.

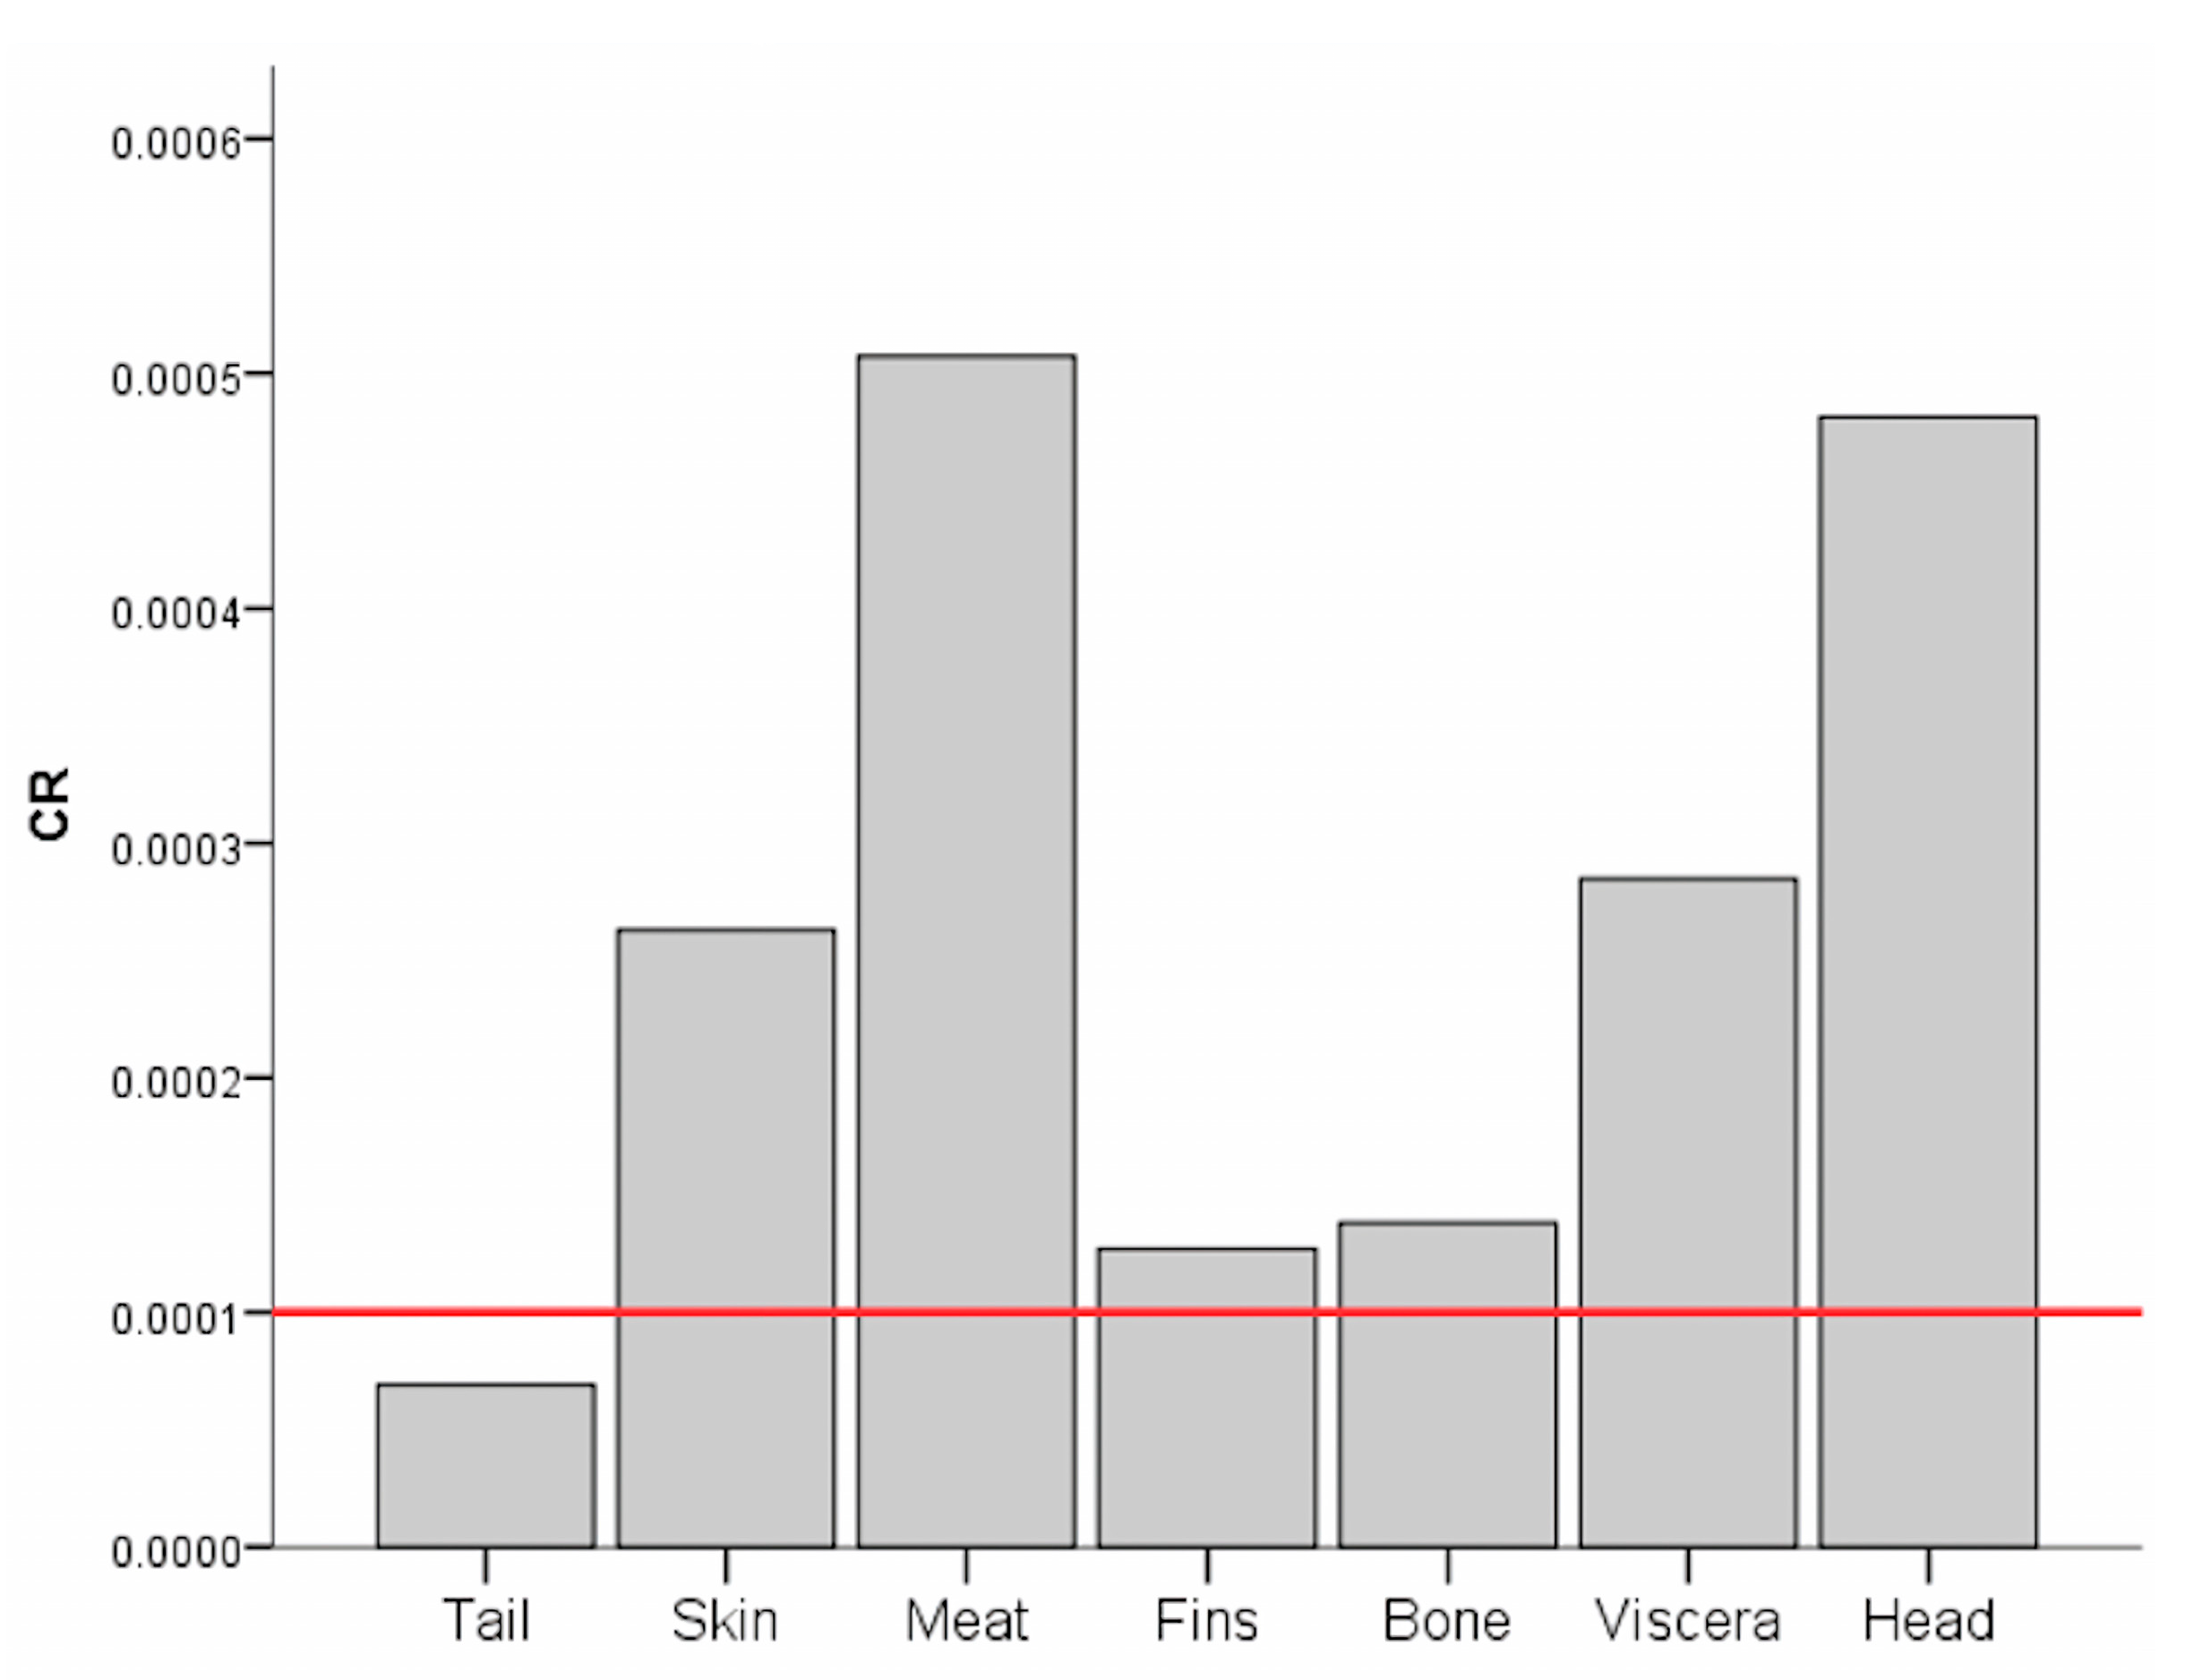
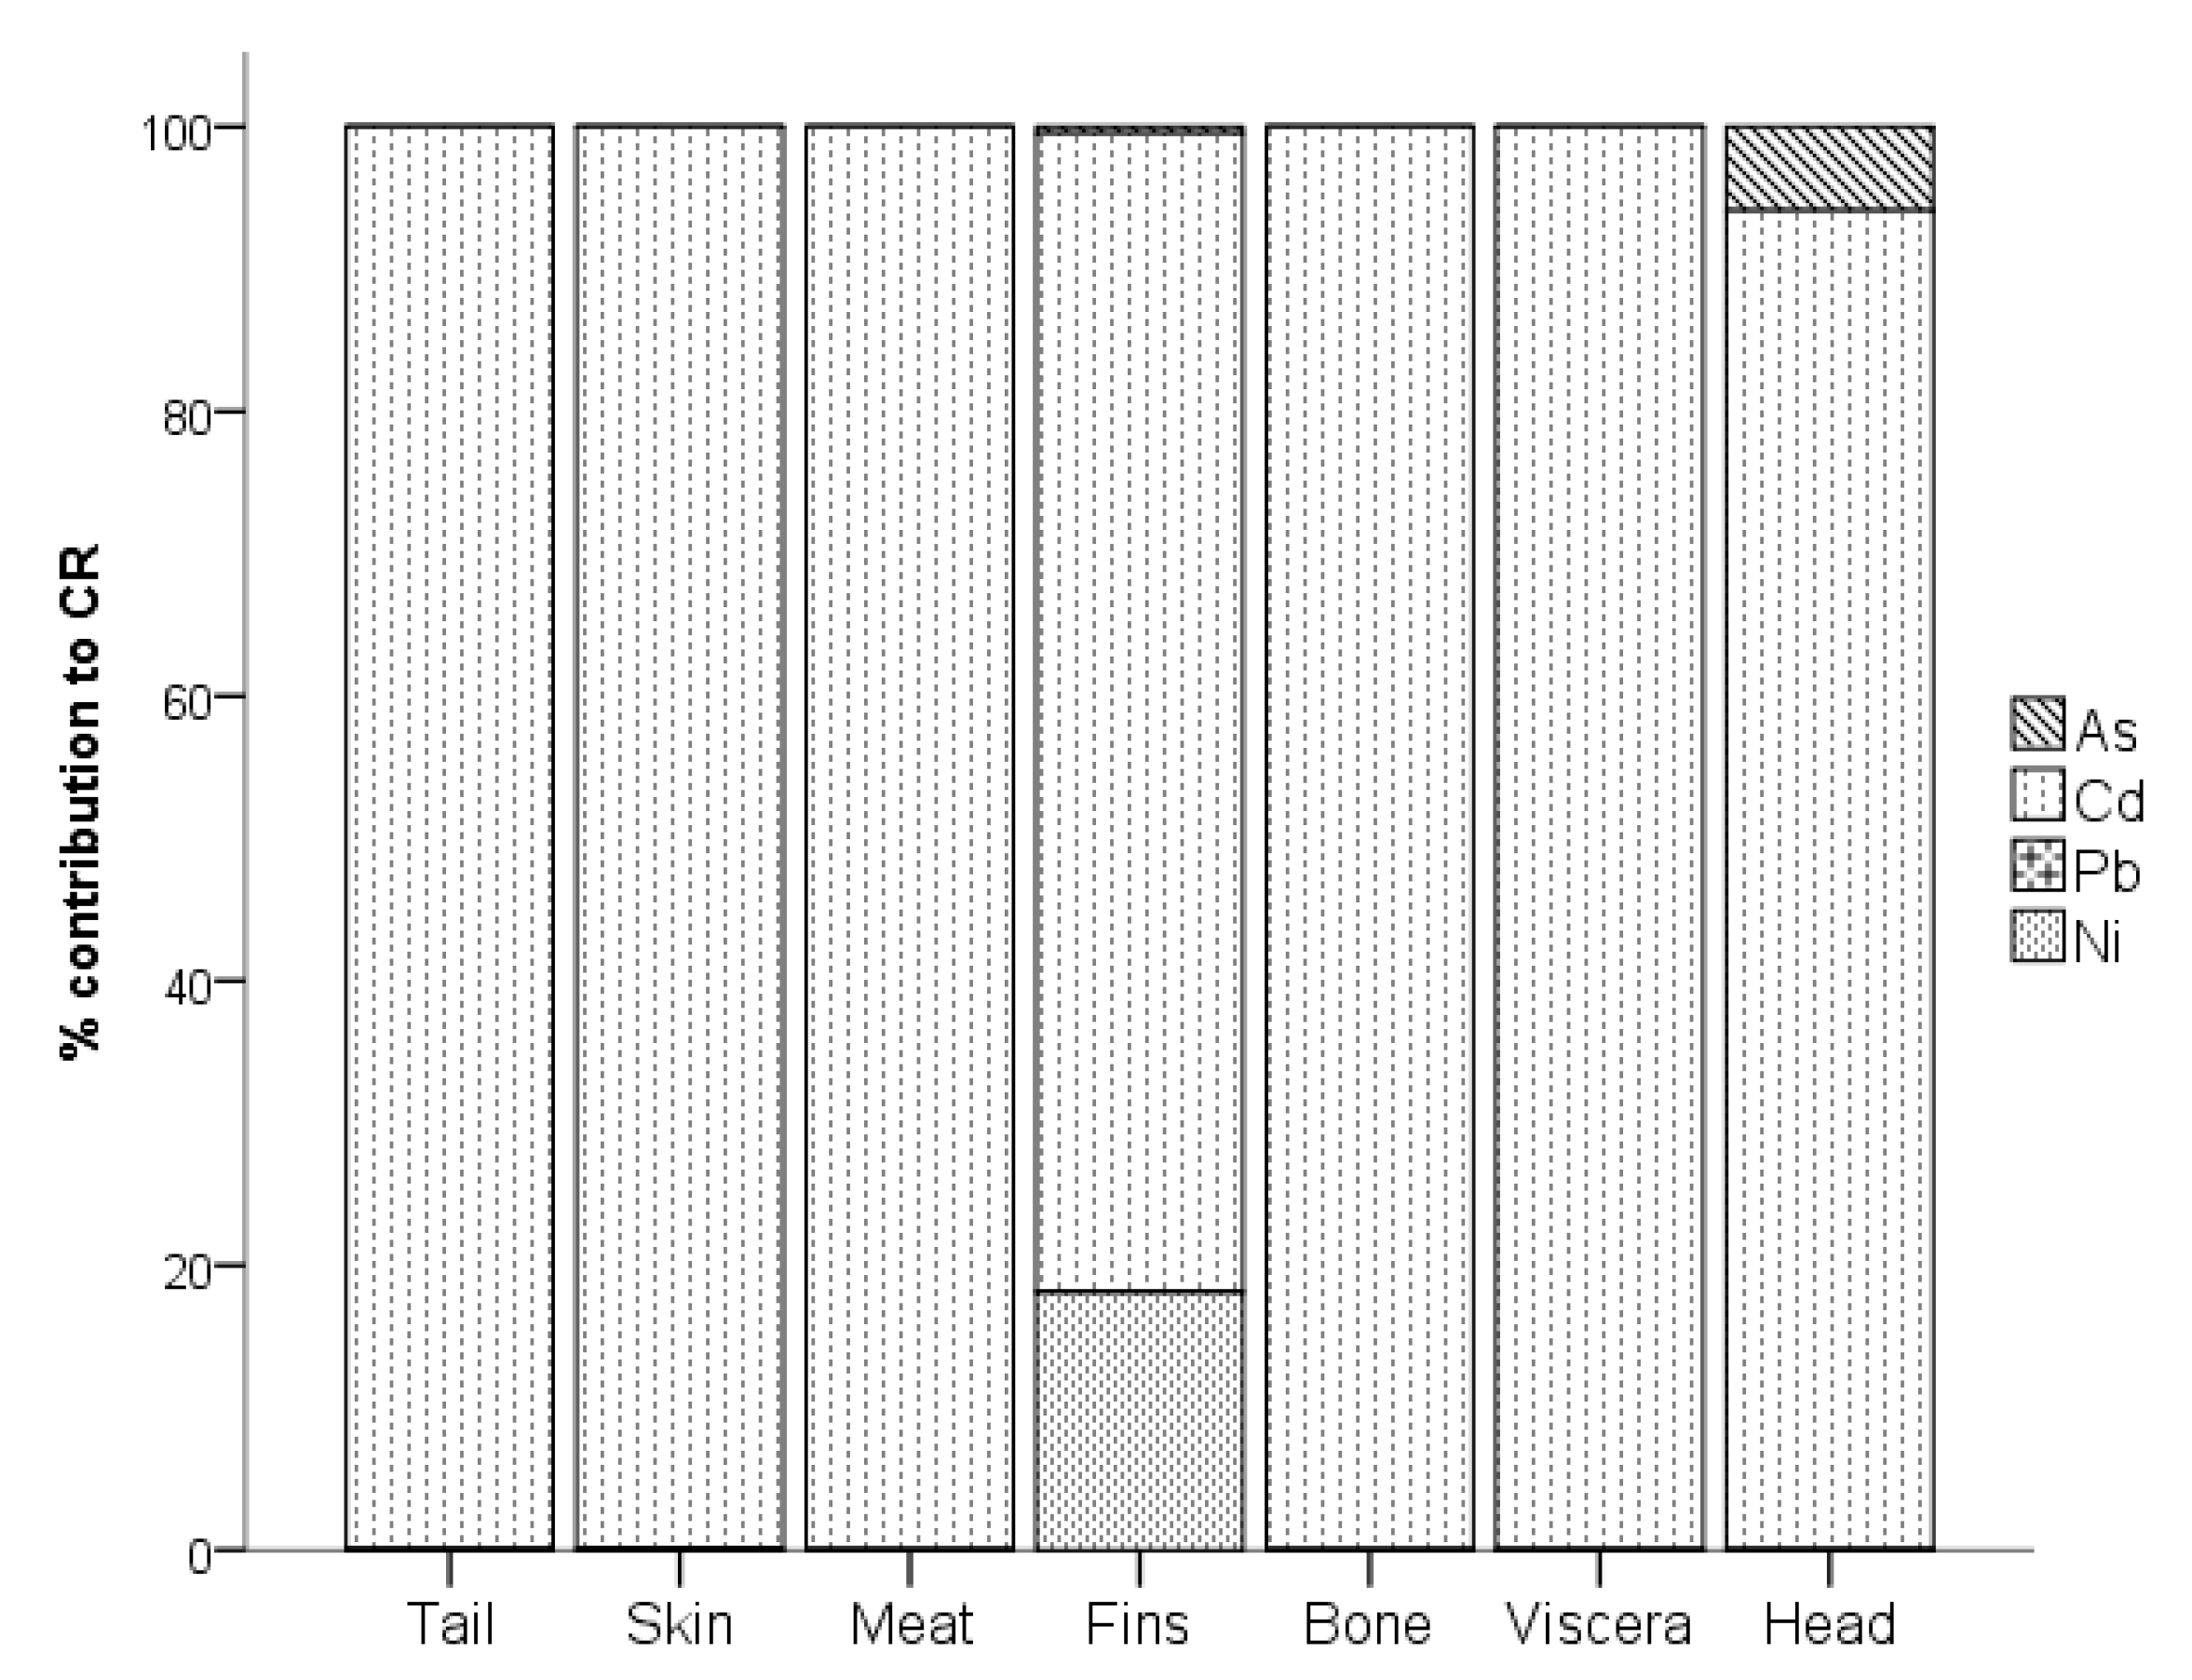
3.2.2. Carcinogenic Risk Assessment

The carcinogenic risk (CR) of consuming various parts of tilapia contaminated with As, Cd, Pb, and Ni was assessed. As shown in Figure 5, except for the tail, all of the CR through the consumption of several parts of tilapia exceeded the threshold value of 1 × 10⁻⁴, implying that cancer risk was highly probable [51]. The highest CR was recorded in the meat, which was approximately 0.00051. This was followed by the head at 0.00048. The sequence of CR in various parts of tilapia followed the order of meat > head > viscera > skin > bone > fins > tail.
Figure 6 shows the % contribution of each HM identified as a carcinogen to the CR. More than 99% of the CR in the tail was contributed by Cd. Similarly, the Cd contributed 99.94%, 100%, 81.40%, 100%, 100%, and 94.10% to the CR in the skin, meat, fins, bone, viscera, and head, respectively, of tilapia. It also contributed 5.90% to the CR in the head, while Ni contributed 18.09% to the CR in the fins.

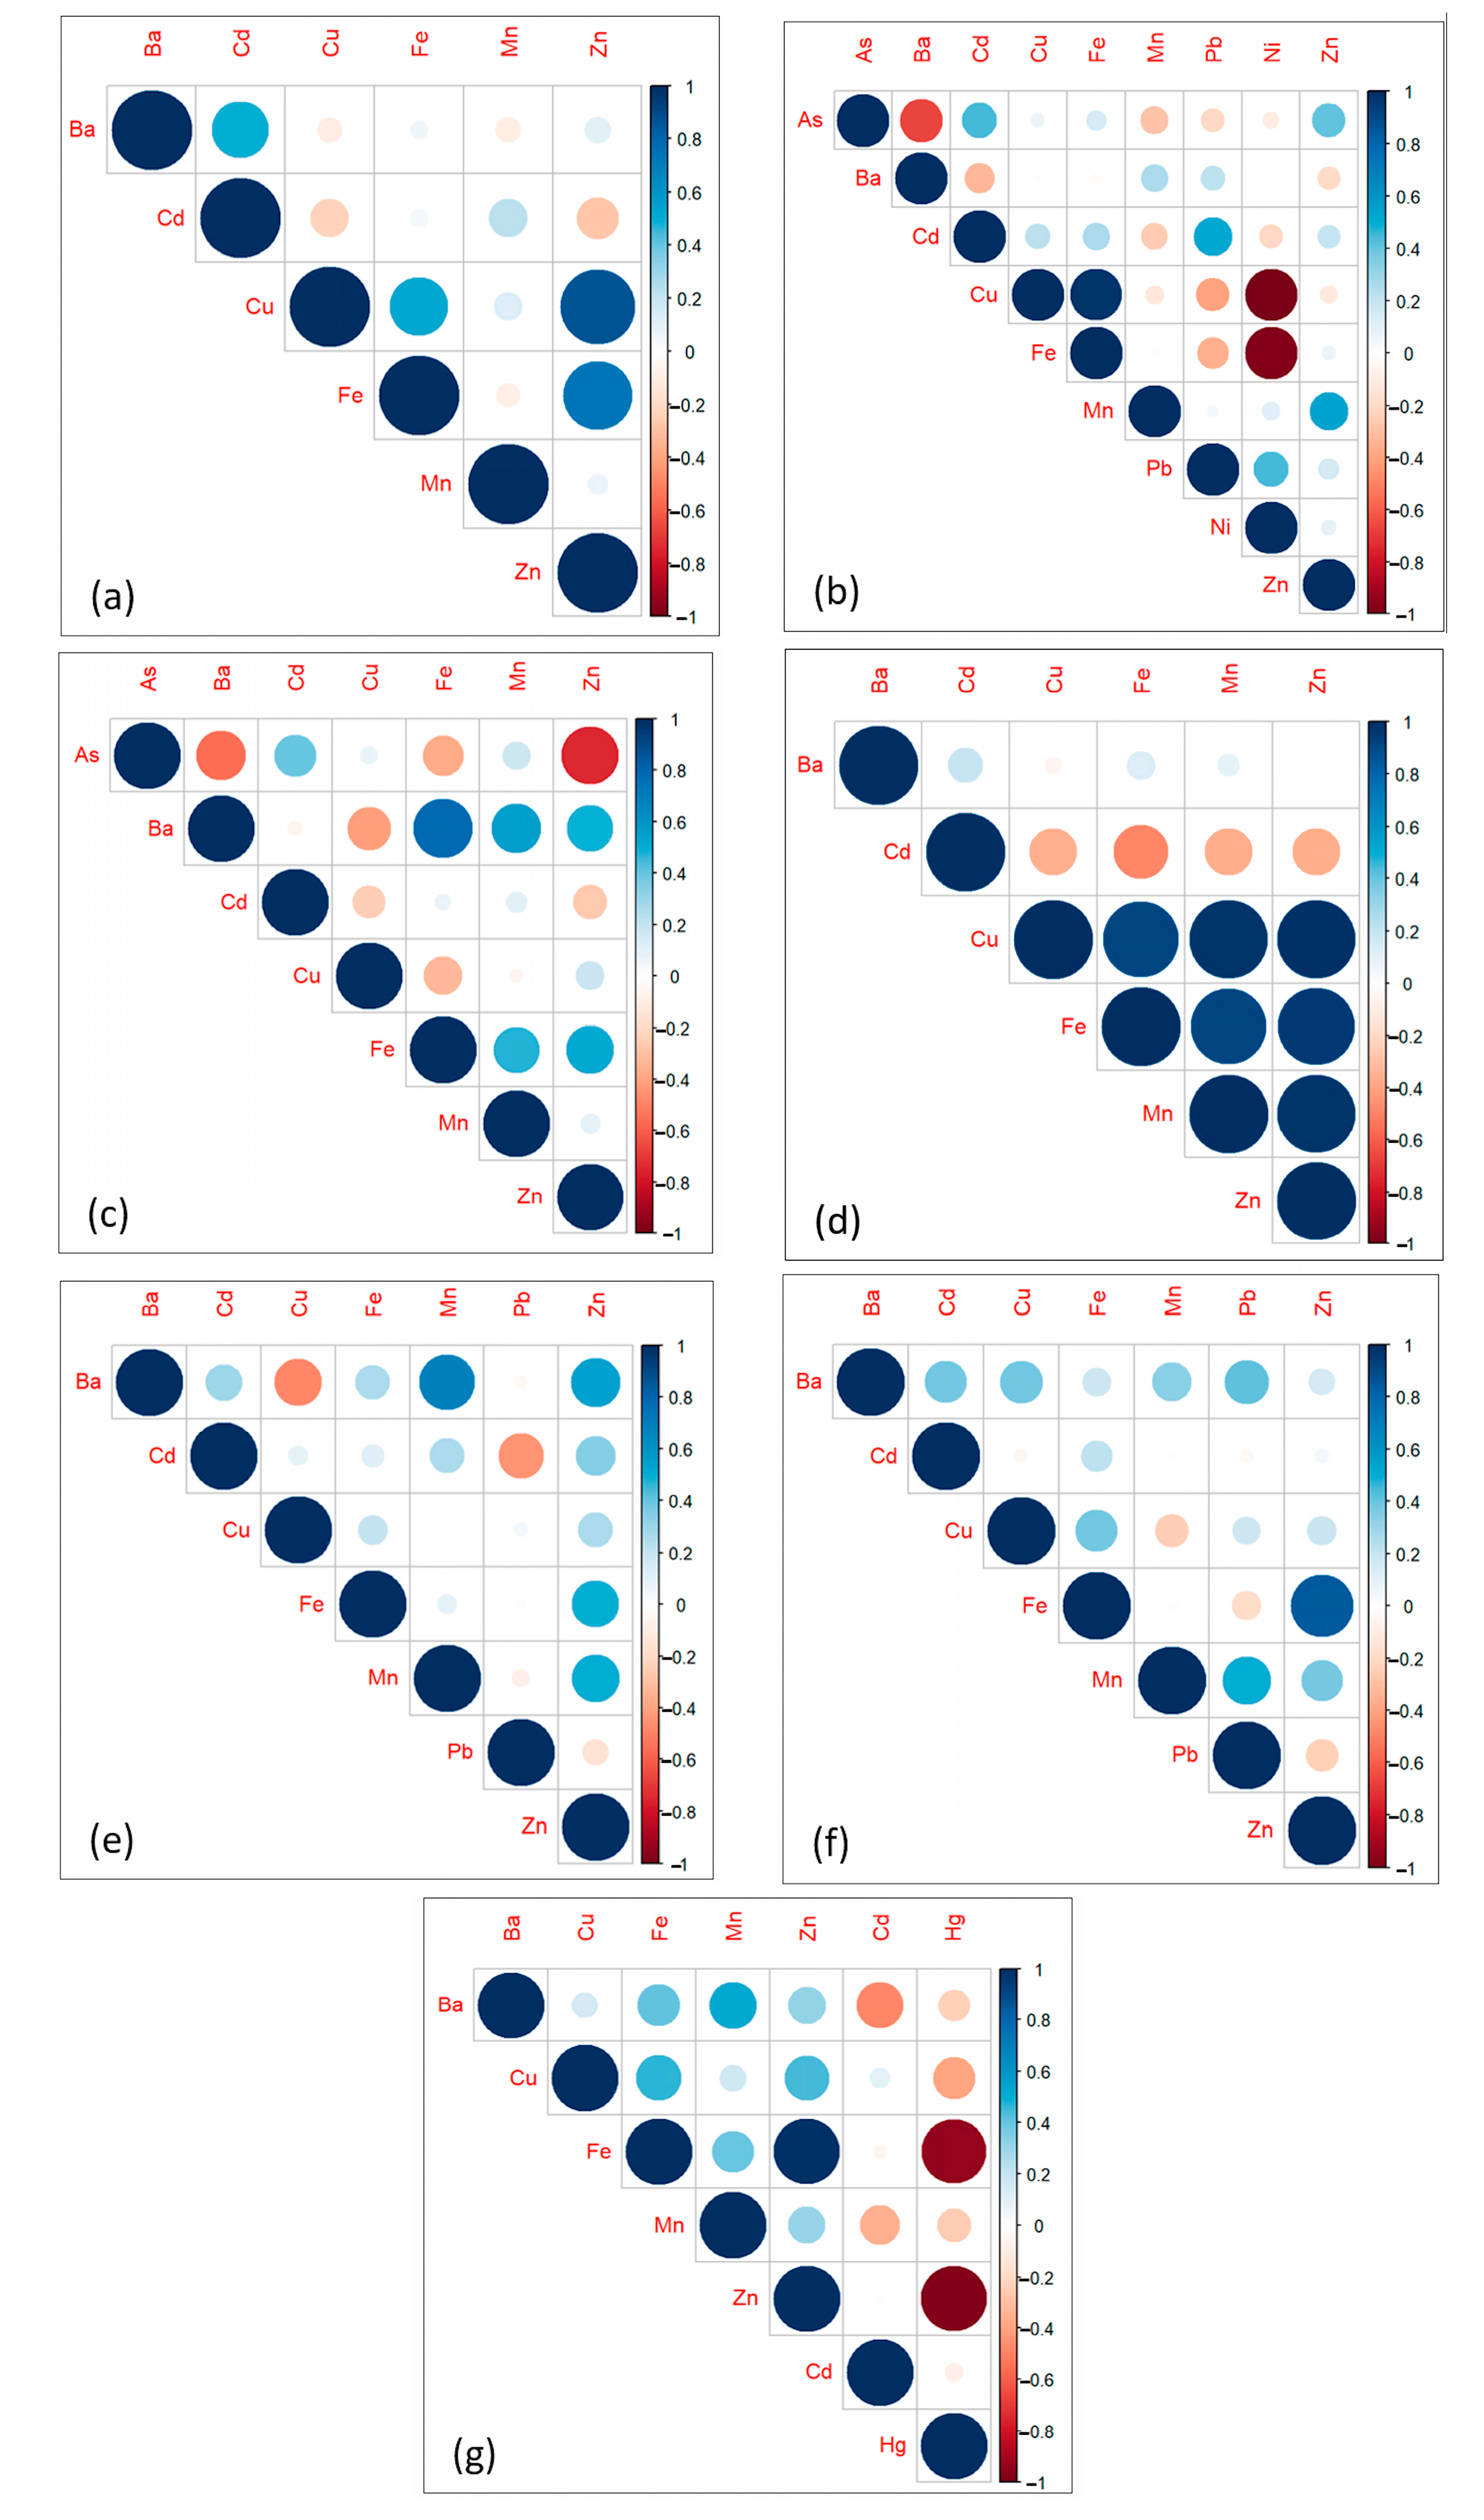
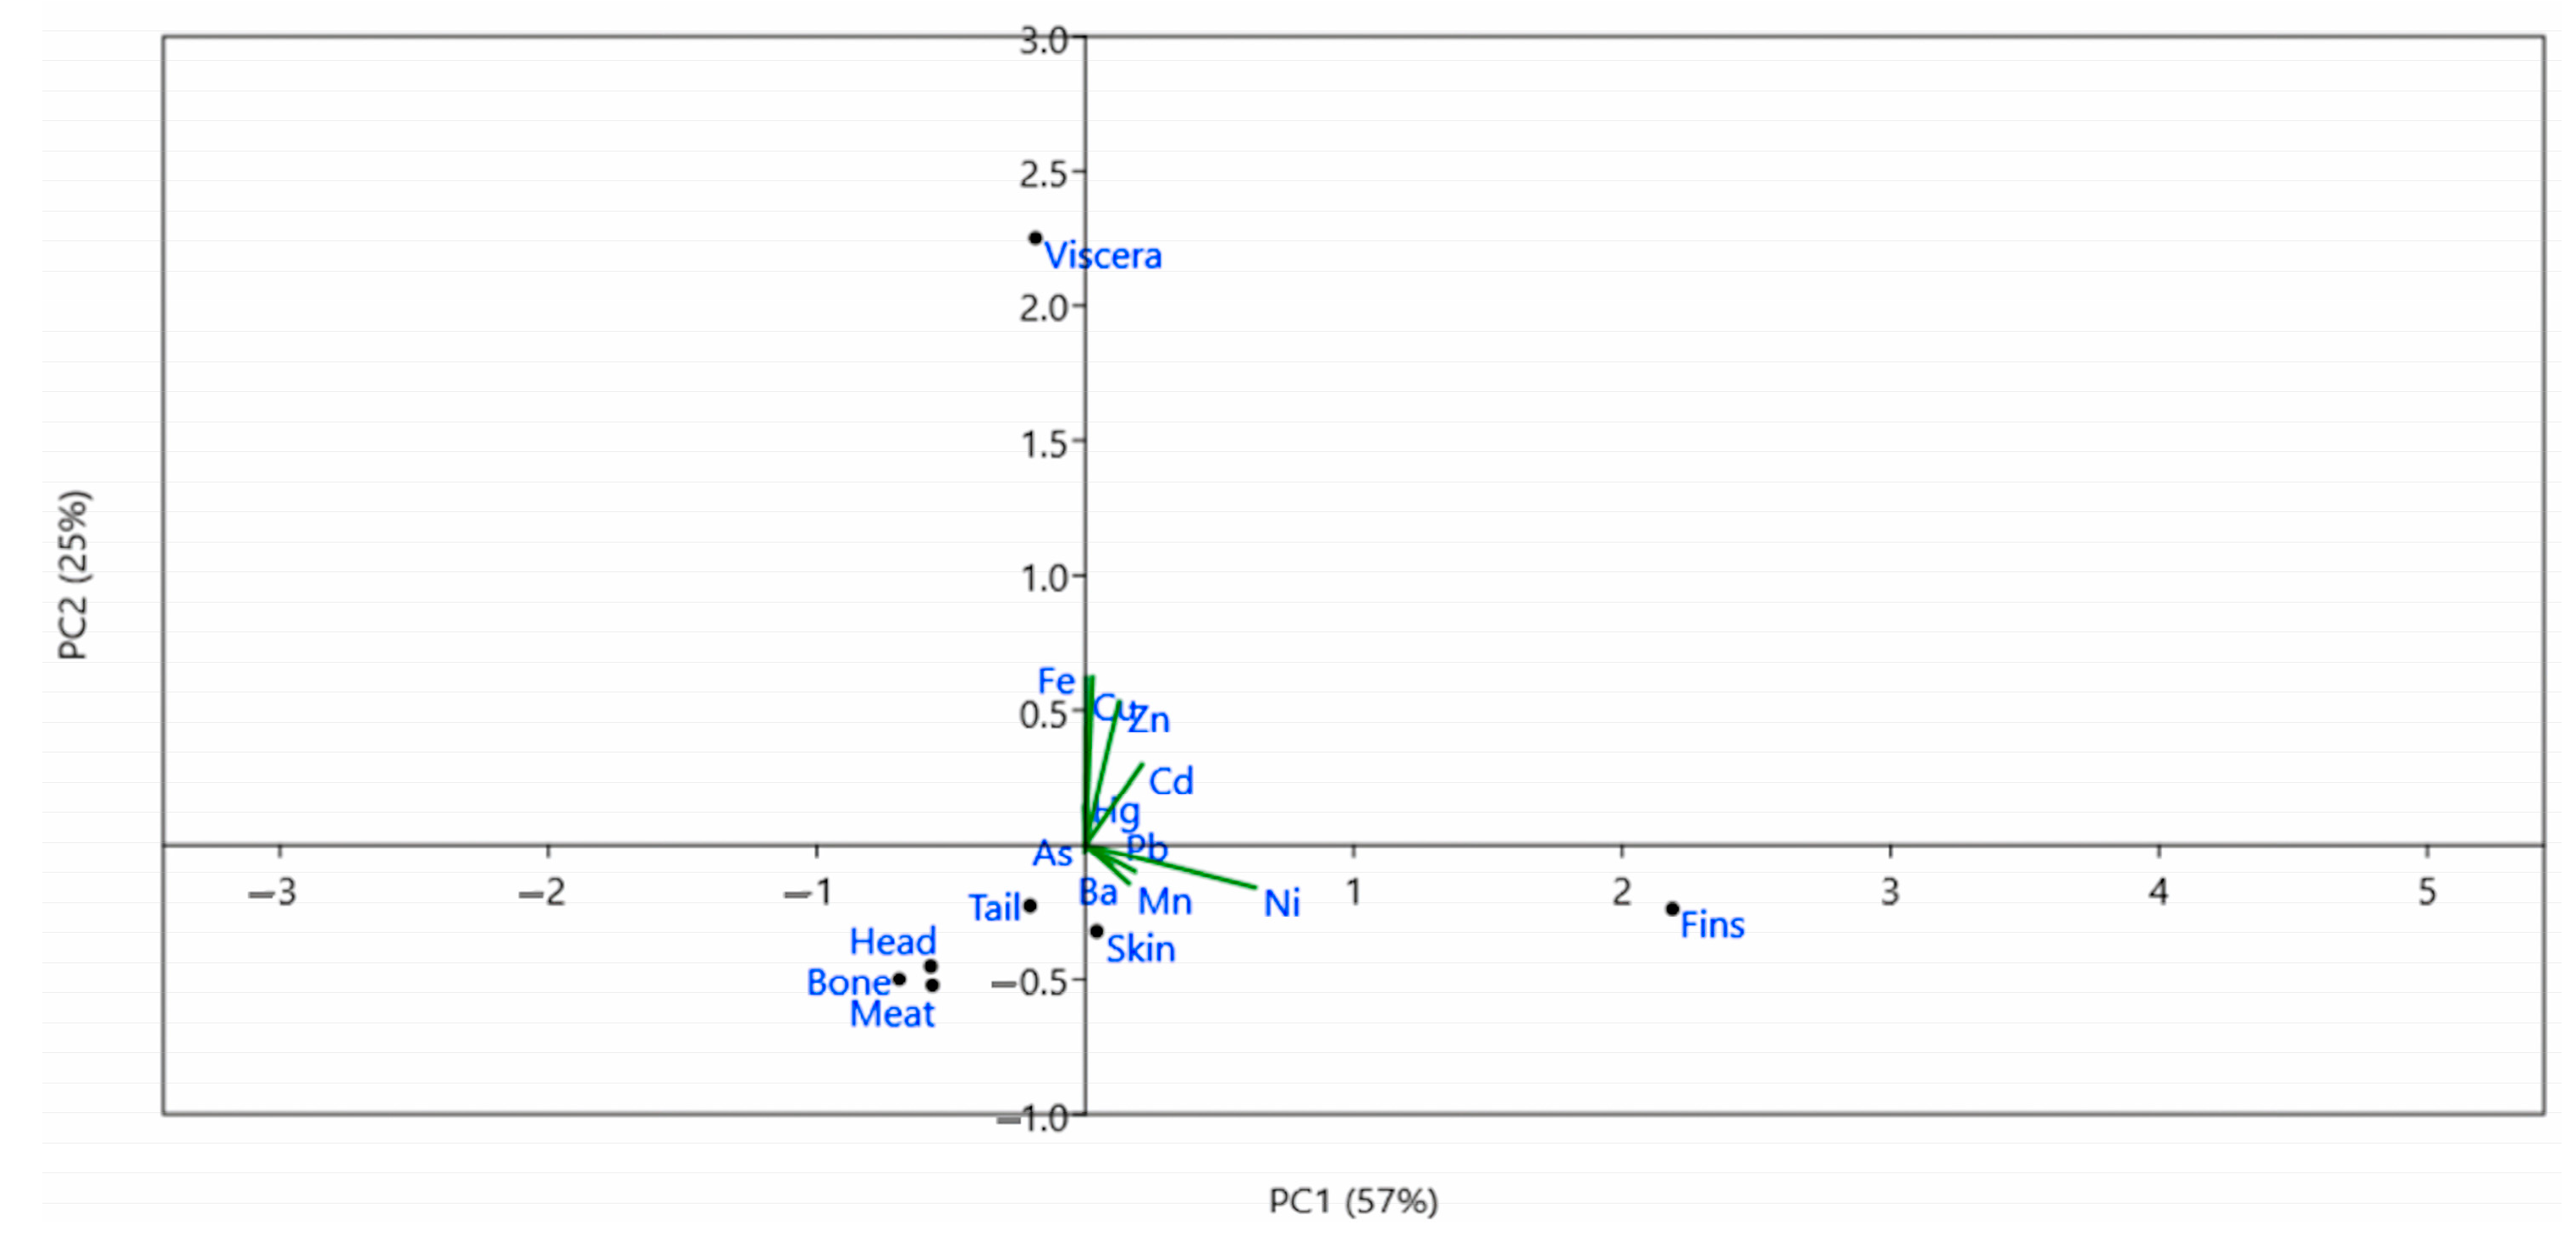
3.3. Relationship of HMs in Various Parts of Tilapia spp.

Figure 7 shows the correlation of HMs in different parts of tilapia. As shown in Figure 7a, a high positive correlation exists between Cu-Zn (0.865, 0.01 level) and Fe-Zn (0.732, 0.05 level) in the bone of tilapia. In the fins, a moderate negative correlation was observed between As-Ba (−0.663, 0.05 level), while a very high negative correlation was observed between Cu-Ni (−0.998, 0.01 level) and Fe-Ni (−0.976, 0.01 level). On the other hand, there is a very high positive correlation between Cu-Fe (0.972, 0.01 level) (Figure 7b). In Figure 7c, high positive correlation was observed between Ba-Fe (0.780, 0.01 level), while a high negative correlation was observed between As-Zn (−0.740, 0.01 level) in the head of the tilapia. Similarly, there are very high positive correlations between Cu-Fe (0.916), Cu-Mn (0.975), Fe-Mn (0.916) Fe-Zn (0.952), and Mn-Zn (0.979) in the meat of tilapia, which are significant at 0.01 level (Figure 7d). In Figure 7e, a moderate positive correlation was observed between Ba-Mn (0.680) in the skin, which is significant at the 0.05 level, while a high positive correlation was observed between Fe-Zn (0.842, 0.01 level) in the tail (Figure 7f). In Figure 7g, three (3) significant correlations were observed in the viscera of tilapia—a very high negative correlation between Fe-Hg (−0.939) and Hg-Zn (−0.976) and a very high positive correlation between Fe-Zn (0.987). All the observed correlations were significant at the 0.01 level.
Furthermore, PCA was carried out to evaluate if the sources of HM contamination in tilapia are either due to anthropogenic or natural causes [57]. Principal component (PC) 1 explained 57.23% of the total variance and exhibited an eigenvalue of 7.13 (Figure 8). Ni dominated PC1 with a loading of 0.8684. Similarly, PC2 explained 24.81% of the total variance with an eigenvalue of 3.09. Cu and Fe dominated PC2 with loadings of 0.56193 and 0.5651, respectively. PC3, on the other hand, has an eigenvalue of 2.05 and explained 16.46% of the total variance. PC3 was dominated by Ba and Mn with loadings of 0.6399 and 0.5392, respectively.

4. Discussion

Several parts of tilapia in Calapan City, Philippines were analyzed for the concentration of heavy metals (HMs). The Cd concentration in all parts of tilapia exceeded the FAO/WHO limit, indicating possible health risks to consumers. Cd is a highly toxic HM that can adversely affect organisms even at low concentrations [58]. Generally, Cd is ubiquitous in the environment, but its concentration increases due to anthropogenic causes, such as fertilizer application, sewage, batteries, and pigments [59,60]. Elevated concentrations of Cd in the meat and gills of Oreochromis niloticus were also observed in Southwestern Nigeria, attributed to the contaminated river where the fish was caught [61]. Some organ systems mainly targeted by Cd in humans are the urinary, skeletal, and respiratory systems, which may result in renal tubular dysfunction and osteomalacia when continuously exposed to high concentrations [62]. Moreover, a high concentration of Mn was also observed in all the parts of the tilapia except in the bone. Similar to Cd, Mn is also ubiquitous in the environment, and it originates from a variety of sources, including agricultural, industrial, and urban pollution [63]. The study area is mainly an agricultural land, and the high concentrations of Cd and Mn can be attributed to this condition. The highest concentrations of Cu, Hg, and Zn were found at the viscera of tilapia. Aquatic organisms such as fish are vulnerable to the bioaccumulation of metals present in the water. Hence, the elevated concentrations of metals in fish samples were attributable to the fish pond’s water quality. It is estimated that most of the total Hg in the meat and organs of fish such as tilapia is methylmercury (MeHg), which is the most toxic form of Hg. Th MeHg usually binds with the cysteine-rich tissues of the fish, particularly the meat and viscera [64], such as the recorded data of the fish samples in this study. However, a study focusing on speciation is helpful in identifying the species of metals found in tilapia species. Cu and Zn, on the other hand, are considered essential metals, but they can pose adverse health effects to humans in excessive amounts [65]. This is comparable to the results of other studies in an island province in the Philippines [21], Hong Kong [66], and Malaysia [67]. The common site of metal accumulation in fish is the viscera where food is stored and processed. Additionally, metal metabolism in the fish played a role in this condition [68]. Additionally, the HMs ingested by fish are stored in the kidney and liver, and some excessive metals remain in the fish’s viscera [66].
In addition, it was observed that external parts of the tilapia, such as the tail, scale, and fins, recorded as accumulated, and they had the highest mean concentration of all the detected HMs. This finding may be implied by the fact that these parts are in direct contact with water, from which the fish absorb HMs [69]. Meanwhile, on average, meat recorded minimal absorption of HMs compared to tail, scale, fins, and viscera. This is consistent with the findings of Ju et al. [70] and Abdel-Baki et al. [71]. This is because fish meat is considered a passive location of metal biotransformation and build-up [17,72].
Meanwhile, none of the HMs in the various parts of tilapia exceeded the THQ of 1 [21]. Ishak et al. (2020) [60] also determined the concentration of Pb and Cd in tilapia (Oreochromis niloticus) from Kuala Lumpur, Malaysia and found that the THQs for these HMs were less than 1. However, the highest THQs were recorded for Hg in the viscera and Cd in the meat. The high CDIs and low reference doses of Hg and Cd contributed to the high THQs [40]. A high concentration of Hg was also observed in the viscera of clupeid (Brevoortia tyrannus) caught in the northeast bay of the United States of America. Hence, evisceration of the fish prior to cooking or processing was recommended by the authors [73]. To prevent the possible non-carcinogenic health risk due to the intake of Cd in the meat of tilapia, the authors recommend that consumption of this part should not exceed 0.048 kg/person/day. Results of the CR, on the other hand, showed that there is potential cancer risk via ingestion of the fish’s skin, meat, fins, bone, viscera, and head. The high CR in these parts was primarily attributed to the high concentration and slope factor of Cd [50]. Chronic and acute exposures of humans to high concentration of Cd can potentially cause lung, kidney, and pancreatic cancers [74].
The result of the correlogram in each part of the tilapia showed that most of the HMs analyzed had a significant positive correlation. This implies that, when a particular HM tends to increase, the other correlated variable (i.e., HM) does the same. This is also an indication that the correlated HMs may have a similar source of contamination [75]. Similarly, the result of the PCA showed that there were three (3) major PCs observed. PC1 was dominated by Ni. Generally, food is the major source of human exposure to Ni. Common anthropogenic sources of Ni to the environment include dust or fumes from power plants, waste incinerators, welding industries, and pesticides [76,77]. Through deposition, this Ni may be transported to aquatic environments such as rivers and lakes, where fish and other aquatic organisms may be exposed. PC2, on the other hand, was dominated by Cu and Fe. These HMs are naturally abundant due to the weathering of rocks. However, Cu concentration in the environment, particularly in water systems, increases due to major anthropogenic sources such as mining, agriculture, waste treatment plants, and industrial and municipal solid waste [78]. Furthermore, the dominant HMs in PC3 were Ba and Mn. Both Ba and Mn are also naturally occurring in the environment from weathered rocks, primarily sedimentary rocks. However, their concentration in the environment increases due to various man-made sources such as paints, oils, pesticides/fertilizers, manufacturing, and mining [79,80]. Overall, the PCA revealed that HM contamination in the investigated tilapia samples can be attributed to anthropogenic causes, especially agricultural run-offs. To emphasize, the tilapia collected from Panggalaan and Bayanan II recorded the highest total HM content. These sampling sites are comprised of numerous agricultural fields, mills, resorts, and other industrial establishments. Elevated concentrations of HMs were also recorded in fish collected in rivers that receive run-off from agricultural fields, such as in Bangladesh [81], Iran [82], and Mozambique [83].
It is also important to note that tilapia is commonly cultured or farmed in fishponds. The source of the water and the feeds given to the fish probably contribute to the concentration of HMs in various parts of tilapia. Yilmaz et al. [84] and Al-Majed et al. [85] emphasized that fish habitat and feeding habits may influence these varying levels of HM concentration. Hence, it is highly recommended to regularly monitor the water quality of these fishponds to mitigate the bioaccumulation of HMs in tilapia and reduce or eliminate the possibility of human health risks. Additionally, physiological conditions, types of tissues analyzed, growing rate, age, gender, and size were also contributing factors for the varying HM concentrations in fish [65,86,87].

5. Conclusions

This study investigated the levels of heavy metals (HMs) in various parts of Tilapia spp. in Calapan City, Province of Oriental Mindoro, Philippines. The mean concentrations of Cd and Mn in all parts of the tilapia exceeded the FAO/WHO limits. Similarly, the mean concentrations of Cu, Fe, and Hg in the viscera exceeded the limits recommended by FAO and WHO. An elevated concentration of Pb was recorded in the skin and fins of tilapia. The result of the calculated CR recorded that consumption of tilapia, specific to the fish’s skin, meat, fins, bone, viscera, and head, may pose a potential cancer risk, as the CR of these fish parts exceeded the threshold value of 1 × 10⁻⁴ set by USEPA. The correlogram showed that most of the correlations between HMs in various parts of the tilapia had a positive (direct) relationship, which is attributed to the HMs toxicity target organ characteristic. Regular monitoring of HM concentration in tilapia, the inland fish habitat, and surface water quality shall be carried out.

Author Contributions

Conceptualization, D.B.S.; methodology L.C.M., R.C.N. and D.B.S.; software, E.M.D.A. and R.C.N.; validation, L.C.M., E.M.D.A. and D.B.S.; formal analysis, L.C.M. and E.M.D.A.; investigation, L.C.M., E.M.D.A. and D.B.S.; resources, D.B.S.; data curation, L.C.M. and E.M.D.A.; writing—original draft preparation, L.C.M., E.M.D.A., O.B.V. and R.C.N.; writing—review and editing, D.B.S., R.C.N., L.C.M., E.M.D.A. and O.B.V.; visualization, L.C.M. and E.M.D.A.; supervision, D.B.S.; project administration, D.B.S.; funding acquisition, D.B.S. All authors have read and agreed to the published version of the manuscript.

Funding

This research was funded by the Philippine Council for Health Research and Development of the Department of Science and Technology, Philippines, and the project name is D-HIVE 4B Capital.

Data Availability Statement

All data are contained in the manuscript.

Acknowledgments

This is to acknowledge the support “in kind” of Mapua University, Manila Philippines, the Mindoro State University, Oriental Mindoro, Philippines, and the local government unit of Calapan City, Oriental Mindoro for the cooperation.

Conflicts of Interest

The authors declare no conflict of interest.

References

  1. Guerrero, R.D. Farmed Tilapia Production in the Philippines Is Declining: What Has Happened and What Can Be Done. Philipp. J. Sci. 2019, 148, 11–15. [Google Scholar]
  2. Food and Agriculture Organization of the United Nations. Improving Productivity of Tilapia Farmers in the Philippines. Available online: https://www.fao.org/3/bt824e/bt824e.pdf (accessed on 11 January 2023).
  3. Asian Development Bank. Case Study 4: Overview of Freshwater Aquaculture of Tilapia in the Philippines. In An Evaluation of Small-Scale Freshwater Rural Aquaculture Development for Poverty Reduction; Asian Development Bank: Mandaluyong, Philippines, 2005; pp. 75–91. ISBN 971-561-550-3. [Google Scholar]
  4. Madrid, F.G.N.; Danting, M.J.C.; Juico, J.; Guerrero, R.D., III. The Philippine Tilapia Industry Roadmap (2022–2025); Bureau of Fisheries and Aquatic Resources, Department of Agriculture: Diliman, Quezon City, Philippines, 2022; p. 25. [Google Scholar]
  5. Bureau of Fisheries and Aquatic Resources. Philippine Fisheries Profile 2016; Bureau of Fisheries and Aquatic Resources, Department of Agriculture: Diliman, Quezon City, Philippines, 2016. [Google Scholar]
  6. Agutaya, C.A.C.; Zamora, J.T. Developmental Projects in Calapan City, Philippines: Localization Perspectives. Am. J. Educ. Res. 2018, 6, 133–136. [Google Scholar]
  7. Nkpaa, K.W.; Wegwu, M.O.; Essien, E.B. Heavy Metals Concentrations in Four Selected Seafood from Crude Oil Polluted Waters of Ogoniland, Rivers State, Nigeria. Arch. Appl. Sci. Res. 2013, 5, 97–104. [Google Scholar]
  8. Fallah, A.A.; Saei-Dehkordi, S.S.; Nematollahi, A.; Jafari, T. Comparative study of heavy metal and trace element accumulation in edible tissues of farmed and wild rainbow trout (Oncorhynchus mykiss) using ICP-OES technique. Microchem. J. 2011, 98, 275–279. [Google Scholar] [CrossRef]
  9. Gogus, U.; Smith, C. N-3 Omega fatty acids: A review of current knowledge. Int. J. Food Sci. Technol. 2010, 45, 417–436. [Google Scholar] [CrossRef]
  10. El-Kattan, Y.; Nahla, A. Levels of Some Heavy Metals in River Nile Water and Oreochromis Niloticus Fish at Menoufia Governorate. Egypt. J. Comp. Path. Clin. Path 2008, 21, 12. [Google Scholar]
  11. Darwish, A.M.; El-Mossalami, M.K.; El-Bassiony, R.A. Quality Assurance of Some Fatty Fishes. Assuit Vet. Med. J. 2003, 49, 79–96. [Google Scholar]
  12. Asgedom, A.G.; Desta, M.B.; Gebremedh, Y.W. Bioaccumulation of Heavy Metals in Fishes of Hashenge Lake, Tigray, Northern Highlands of Ethiopia. Am. J. Chem. 2012, 2, 326–334. [Google Scholar] [CrossRef]
  13. Zaidi, M.I. The Heavy Metal Concentration along Roadside Trees of Quetta and its Effects on Public Health. J. Appl. Sci. 2005, 5, 708–711. [Google Scholar] [CrossRef] [Green Version]
  14. Reilly, A.; Käferstein, F. Food safety and products from aquaculture. J. Appl. Microbiol. 1998, 85, 249S–257S. [Google Scholar] [CrossRef]
  15. Nolos, R.C.; Zamroni, A.; Evina, K.F.P. Drivers of Deforestation And Forest Degradation In Palawan, Philippines: An Analysis Using Social-Ecological Systems (SES) And Institutional Analysis And Development (IAD) Approaches. Geogr. Environ. Sustain. 2023, 15, 44–56. [Google Scholar] [CrossRef]
  16. Kindie, M.; Andargie, M.; Hilluf, W.; Amare, M. Assessment on level of selected heavy metals in Nile Tilapia and Barbus fish species and water samples from the Southern parts of Lake Tana, Ethiopia. Sci. Afr. 2020, 9, e00519. [Google Scholar] [CrossRef]
  17. Elnabris, K.J.; Muzyed, S.K.; El-Ashgar, N.M. Heavy metal concentrations in some commercially important fishes and their contribution to heavy metals exposure in Palestinian people of Gaza Strip (Palestine). J. Assoc. Arab. Univ. Basic Appl. Sci. 2013, 13, 44–51. [Google Scholar] [CrossRef] [Green Version]
  18. Agarwal, R.; Kumar, R.; Behari, J.R. Mercury and Lead Content in Fish Species from the River Gomti, Lucknow, India, as Biomarkers of Contamination. Bull. Environ. Contam. Toxicol. 2007, 78, 108–112. [Google Scholar] [CrossRef] [PubMed]
  19. Mahboob, S.; Al-Ghanim, K.A.; Al-Balawi, H.F.; Al-Misned, F.; Ahmed, Z. Toxicological effects of heavy metals on histological alterations in various organs in Nile tilapia (Oreochromis niloticus) from freshwater reservoir. J. King Saud Univ. Sci. 2020, 32, 970–973. [Google Scholar] [CrossRef]
  20. Ali, D.; Almarzoug, M.H.; Al Ali, H.; Samdani, M.S.; Hussain, S.A.; Alarifi, S. Fish as bio indicators to determine the effects of pollution in river by using the micronucleus and alkaline single cell gel electrophoresis assay. J. King Saud Univ. 2020, 32, 2880–2885. [Google Scholar] [CrossRef]
  21. Agarin, C.; Mascareñas, D.; Nolos, R.; Chan, E.; Senoro, D. Transition Metals in Freshwater Crustaceans, Tilapia, and Inland Water: Hazardous to the Population of the Small Island Province. Toxics 2021, 9, 71. [Google Scholar] [CrossRef]
  22. Mercado, C.J.G.; Atienza, L.M.; Juanico, C.B.; Depositario, D.P.T.; Hurtada, W.A. Bioaccumulation and Non-Carcinogenic Health Risk Assessment of Heavy Metals in Selected Fish Species from South Bay of Laguna Lake. Acta Medica Philipp. 2021, 55, 767–774. [Google Scholar] [CrossRef]
  23. Cambia, F.; Benitez, K.C.; Perelonia, K.B.; Montojo, U. Levels of Heavy Metals in Six Aquaculture Commodities Collected from Various Landing Sites of Manila Bay: Relationships with Size and Seasonal Variation. Philipp. J. Fish. 2019, 26, 26–34. [Google Scholar] [CrossRef]
  24. Guevarra, R.D.; Paraso, M.G.; Lola, M.S.E. Biomarker Evaluation in Nile Tilapia (Oreochromis niloticus) to Assess the Health Status of Aquaculture Areas in the Seven Lakes of San Pablo. Philipp. J. Sci. 2020, 149, 833–840. [Google Scholar] [CrossRef]
  25. Alam, Z.F.; Concepcion, C.K.V.; Abdulrahman, J.D.; Sanchez, M.A.S. Biomonitoring of Water Bodies in Metro Manila, Philippines Using Heavy Metal Analysis and Erythrocyte Micronucleus Assay in Nile Tilapia (Oreochromis Niloticus). Nat. Environ. Pollut. Technol. 2019, 685–696. [Google Scholar]
  26. Abdulrahman, J.D.; Concepcion, C.K.V.; Sanchez, M.A.S. Environmental Biomonitoring of Water Bodies (Estero de Vitas and Estero de Paco) in Metro Manila, Philippines Using Heavy Metal Analysis and Erythrocyte Micronucleus Assay in Nile Tilapia (Oreochromis Niloticus). Bachelor’s Thesis, De La Salle University, Manila, Philippines, 2018. [Google Scholar]
  27. USEPA. Guidance for Assessing Chemical Contaminant Data for Use in Fish Advisories Volume 1 Fish Sampling and Analysis, 3rd ed.; U.S. Environmental Protection Agency: Washington, DC, USA, 2000. [Google Scholar]
  28. Senoro, D.B.; de Jesus, K.L.M.; Nolos, R.C.; Lamac, M.R.L.; Deseo, K.M.; Tabelin, C.B. In Situ Measurements of Domestic Water Quality and Health Risks by Elevated Concentration of Heavy Metals and Metalloids Using Monte Carlo and MLGI Methods. Toxics 2022, 10, 342. [Google Scholar] [CrossRef] [PubMed]
  29. Monjardin, C.E.F.; Senoro, D.B.; Magbanlac, J.J.M.; de Jesus, K.L.M.; Tabelin, C.B.; Natal, P.M. Geo-Accumulation Index of Manganese in Soils Due to Flooding in Boac and Mogpog Rivers, Marinduque, Philippines with Mining Disaster Exposure. Appl. Sci. 2022, 12, 3527. [Google Scholar] [CrossRef]
  30. Senoro, D.B.; Monjardin, C.E.F.; Fetalvero, E.G.; Benjamin, Z.E.C.; Gorospe, A.F.B.; de Jesus, K.L.M.; Ical, M.L.G.; Wong, J.P. Quantitative Assessment and Spatial Analysis of Metals and Metalloids in Soil Using the Geo-Accumulation Index in the Capital Town of Romblon Province, Philippines. Toxics 2022, 10, 633. [Google Scholar] [CrossRef]
  31. Senoro, D.B.; De Jesus, K.L.M.; Monjardin, C.E.F. Pollution and Risk Evaluation of Toxic Metals and Metalloid in Water Resources of San Jose, Occidental Mindoro, Philippines. Sustainability 2023, 15, 3667. [Google Scholar] [CrossRef]
  32. Melquiades, F.L.; Appoloni, C. Application of XRF and field portable XRF for environmental analysis. J. Radioanal. Nucl. Chem. 2004, 262, 533–541. [Google Scholar] [CrossRef]
  33. Zhou, S.; Yuan, Z.; Cheng, Q.; Zhang, Z.; Yang, J. Rapid in situ determination of heavy metal concentrations in polluted water via portable XRF: Using Cu and Pb as example. Environ. Pollut. 2018, 243, 1325–1333. [Google Scholar] [CrossRef]
  34. Wu, C.-M.; Tsai, H.-T.; Yang, K.-H.; Wen, J.-C. How Reliable Is X-Ray Fluorescence (XRF) Measurement for Different Metals in Soil Contamination? Environ. Forensics 2012, 13, 110–121. [Google Scholar] [CrossRef]
  35. OLYMPUS. Olympus Corporations of the Americas. Olympus Vanta XRF; Olympus Corporation: Webster, TX, USA.
  36. Philippines Statistics Authority. Consumption of Selected Agricultural Commodities in the Philippines; Philippines Statistic Authority: Quezon City, Philippines, 2017; Volume 2, p. 30. ISSN -2094-6236. [Google Scholar]
  37. Skalecki, P.; Florek, M.; Staszowska, A.; Kaliniak, A. Wartość Użytkowa i Jakość Filetów Ryb Karpiowatych (Cyprinidae) Utrzymywanych w Polikulturze. Żywność Nauk. Technol. Jakość 2015, 22. [Google Scholar]
  38. Nolos, R.C.; Agarin, C.J.M.; Domino, M.Y.R.; Bonifacio, P.B.; Chan, E.B.; Mascareñas, D.R.; Senoro, D.B. Health Risks Due to Metal Concentrations in Soil and Vegetables from the Six Municipalities of the Island Province in the Philippines. Int. J. Environ. Res. Public Health 2022, 19, 1587. [Google Scholar] [CrossRef]
  39. Paul, A.K.; Iqbal, S.; Atique, U.; Alam, L. Muscular Tissue Bioaccumulation and Health Risk Assessment of Heavy Metals in Two Edible Fish Species (Gudusia chapra and Eutropiichthys vacha) in Padma River, Bangladesh. Punjab Univ. J. Zool. 2020, 35, 81–89. [Google Scholar] [CrossRef]
  40. Guadie, A.; Mohammed, I.; Beshaw, T.; Tefera, M. Analysis and health risk assessments of some trace metals in Ethiopian rice (white and red) and imported rice. Heliyon 2022, 8, e09374. [Google Scholar] [CrossRef]
  41. Lu, Q.; Xu, X.; Liang, L.; Xu, Z.; Shang, L.; Guo, J.; Xiao, D.; Qiu, G. Barium concentration, phytoavailability, and risk assessment in soil-rice systems from an active barium mining region. Appl. Geochem. 2019, 106, 142–148. [Google Scholar] [CrossRef]
  42. Dayananda, N.R.; Liyanage, J.A. Quest to Assess Potentially Nephrotoxic Heavy Metal Contaminants in Edible Wild and Commercial Inland Fish Species and Associated Reservoir Sediments; a Study in a CKDu Prevailed Area, Sri Lanka. Expo. Heal. 2021, 13, 567–581. [Google Scholar] [CrossRef]
  43. Sarkar, R.D.; Zhang, Z.; Warke, M.; Datta, R. Health Risk from Toxic Metals in Wild Rice Grown in Copper Mining-Impacted Sediments. Appl. Sci. 2022, 12, 2937. [Google Scholar] [CrossRef]
  44. Tyagi, N.; Raghuvanshi, R.; Upadhyay, M.K.; Srivastava, A.K.; Suprasanna, P.; Srivastava, S. Elemental (As, Zn, Fe and Cu) analysis and health risk assessment of rice grains and rice based food products collected from markets from different cities of Gangetic basin, India. J. Food Compos. Anal. 2020, 93, 103612. [Google Scholar] [CrossRef]
  45. Luo, X.; Ren, B.; Hursthouse, A.S.; Jiang, F.; Deng, R.-J. Potentially toxic elements (PTEs) in crops, soil, and water near Xiangtan manganese mine, China: Potential risk to health in the foodchain. Environ. Geochem. Health 2020, 42, 1965–1976. [Google Scholar] [CrossRef]
  46. Duan, Y.; Li, Q.; Zhang, L.; Huang, Z.; Zhao, Z.; Zhao, H.; Du, J.; Zhou, J. Toxic metals in rice-fish co-culture systems and human health. Ecotoxicol. Environ. Saf. 2022, 241, 113797. [Google Scholar] [CrossRef] [PubMed]
  47. Rahmani, J.; Fakhri, Y.; Shahsavani, A.; Bahmani, Z.; Urbina, M.A.; Chirumbolo, S.; Keramati, H.; Moradi, B.; Bay, A.; Bjørklund, G. A systematic review and meta-analysis of metal concentrations in canned tuna fish in Iran and human health risk assessment. Food Chem. Toxicol. 2018, 118, 753–765. [Google Scholar] [CrossRef]
  48. IRIS, U. Integrated Risk Information System. Environ. Prot. Agency Reg. I Washingt. DC 2011, 20460, 8–18. [Google Scholar]
  49. Li, P.; Hao, H.; Bai, Y.; Li, Y.; Mao, X.; Xu, J.; Liu, M.; Lv, Y.; Chen, W.; Ge, D. Convolutional neural networks-based health risk modelling of some heavy metals in a soil-rice system. Sci. Total. Environ. 2022, 838, 156466. [Google Scholar] [CrossRef] [PubMed]
  50. Mielcarek, K.; Nowakowski, P.; Puścion-Jakubik, A.; Gromkowska-Kępka, K.J.; Soroczyńska, J.; Markiewicz-Żukowska, R.; Naliwajko, S.K.; Grabia, M.; Bielecka, J.; Żmudzińska, A. Arsenic, Cadmium, Lead and Mercury Content and Health Risk Assessment of Consuming Freshwater Fish with Elements of Chemometric Analysis. Food Chem. 2022, 379, 132167. [Google Scholar] [CrossRef]
  51. Ali, M.M.; Ali, L.; Rakib, R.J.; Islam, S.; Bhuyan, S.; Senapathi, V.; Chung, S.Y.; Roy, P.D.; Sekar, S.; Islam, A.R.M.T.; et al. Seasonal behavior and accumulation of some toxic metals in commercial fishes from Kirtankhola tidal river of Bangladesh—A health risk taxation. Chemosphere 2022, 301, 134660. [Google Scholar] [CrossRef] [PubMed]
  52. Sevilla, J.B.; Lee, C.H.; Lee, B.Y. Assessment of Spatial Variations in Surface Water Quality of Kyeongan Stream, South Korea Using Multi-Variate Statistical Techniques. Sustain. Food Water Asian Perspect. 2010, 39–48. [Google Scholar] [CrossRef]
  53. Song, B.; Lei, M.; Cheng, T.; Zheng, Y.; Xie, Y.; Li, X.; Gao, D. Assessing the Health Risk of Heavy Metals in Vegetables to the General Population in Beijing, China. J. Environ. Sci. 2009, 21, 1702–1709. [Google Scholar] [CrossRef]
  54. Hossain, M.B.; Tanjin, F.; Rahman, M.S.; Yu, J.; Akhter, S.; Noman, A.; Sun, J. Metals Bioaccumulation in 15 Commonly Consumed Fishes from the Lower Meghna River and Adjacent Areas of Bangladesh and Associated Human Health Hazards. Toxics 2022, 10, 139. [Google Scholar] [CrossRef]
  55. Hosseini, M.; Nabavi, S.M.B.; Nabavi, S.N.; Pour, N.A. Heavy Metals (Cd, Co, Cu, Ni, Pb, Fe, and Hg) Content in Four Fish Commonly Consumed in Iran: Risk Assessment for the Consumers. Environ. Monit. Assess. 2015, 187, 237. [Google Scholar] [CrossRef]
  56. Oyelowo, O.T.; Awobajo, F.O.; Samuel, T.A.; Sogbesan, T.; Fayiga, A.; Mofolorunso, A. Condition Factor, Heavy Metals and Polychlorinated Biphenyls (PCBs) in the Muscle of Fishes in Lagos, Nigeria. Aceh J. Anim. Sci. 2020, 5, 38–46. [Google Scholar]
  57. Joseph, A.; Edet, U.; Etinosa-Okankan, O.; Ekanem, S. Health risk assessment of heavy metals and radionuclides in Cynoglossus senegalensis (Sole fish) from Qua Iboe River, South-South Nigeria. J. Food Compos. Anal. 2022, 114, 104854. [Google Scholar] [CrossRef]
  58. Almeida, J.; Novelli, E.; Silva, M.D.P.; Júnior, R.A. Environmental cadmium exposure and metabolic responses of the Nile tilapia, Oreochromis niloticus. Environ. Pollut. 2001, 114, 169–175. [Google Scholar] [CrossRef]
  59. ATSDR. Where Is Cadmium Found? Environmental Health and Medicine Education, Agency for Toxic Substances and Disease Registry. 2013. Available online: https://www.atsdr.cdc.gov/csem/cadmium/Where-Cadmium-Found.html (accessed on 10 December 2022).
  60. Ishak, A.R.; Zuhdi, M.S.M.; Aziz, M.Y. Determination of lead and cadmium in tilapia fish (Oreochromis niloticus) from selected areas in Kuala Lumpur. Egypt. J. Aquat. Res. 2020, 46, 221–225. [Google Scholar] [CrossRef]
  61. Oyeleke, P.O.; Okparaocha, F.J.; Abiodun, O.A. Human Health Risk Assessment of Heavy Metals (Lead, Cadmium and Copper) in Fresh Water Tilapia Fish (Oreochromis Niloticus) from Eleyele River, Ibadan, Southwestern Nigeria. Chem. Res. J. 2018, 3, 134–142. [Google Scholar]
  62. World Health Organization. Exposure to Cadmium: A Major Public Health Concern. World Health Organization, 2019. Available online: https://apps.who.int/iris/bitstream/handle/10665/329480/WHO-CED-PHE-EPE-19.4.3-eng.pdf (accessed on 10 December 2022).
  63. O'Mara, K.; Adams, M.; Burford, M.A.; Fry, B.; Cresswell, T. Uptake and accumulation of cadmium, manganese and zinc by fisheries species: Trophic differences in sensitivity to environmental metal accumulation. Sci. Total. Environ. 2019, 690, 867–877. [Google Scholar] [CrossRef] [PubMed]
  64. Da Silva, S.F.; de Oliveira Lima, M. Mercury in Fish Marketed in the Amazon Triple Frontier and Health Risk Assessment. Chemosphere 2020, 248, 125989. [Google Scholar] [CrossRef]
  65. Papagiannis, I.; Kagalou, I.; Leonardos, J.; Petridis, D.; Kalfakakou, V. Copper and zinc in four freshwater fish species from Lake Pamvotis (Greece). Environ. Int. 2004, 30, 357–362. [Google Scholar] [CrossRef] [PubMed]
  66. Zhou, H.; Cheung, R.; Chan, K.; Wong, M. Metal concentrations in sediments and tilapia collected from inland waters of Hong Kong. Water Res. 1998, 32, 3331–3340. [Google Scholar] [CrossRef]
  67. Taweel, A.; Shuhaimi-Othman, M.; Ahmad, A.K. Heavy Metals Concentration in Different Organs of Tilapia Fish (Oreochromis Niloticus) from Selected Areas of Bangi, Selangor, Malaysia. Afr. J. Biotechnol. 2011, 10, 11562–11566. [Google Scholar]
  68. Canli, M.; Atli, G. The relationships between heavy metal (Cd, Cr, Cu, Fe, Pb, Zn) levels and the size of six Mediterranean fish species. Environ. Pollut. 2003, 121, 129–136. [Google Scholar] [CrossRef]
  69. Ismaniza, I.; Idaliza, M.S. Analysis of Heavy Metals in Water and Fish (Tilapia Sp.) Samples from Tasik Mutiara, Puchong. Malays. J. Anal. Sci. 2012, 16, 346–352. [Google Scholar]
  70. Ju, Y.-R.; Chen, C.-W.; Chen, C.-F.; Chuang, X.-Y.; Dong, C.-D. Assessment of heavy metals in aquaculture fishes collected from southwest coast of Taiwan and human consumption risk. Int. Biodeterior. Biodegrad. 2017, 124, 314–325. [Google Scholar] [CrossRef]
  71. Abdel-Baki, A.S.; Dkhil, M.A.; Al-Quraishy, S. Bioaccumulation of Some Heavy Metals in Tilapia Fish Relevant to Their Concentration in Water and Sediment of Wadi Hanifah, Saudi Arabia. Afr. J. Biotechnol. 2011, 10, 2541–2547. [Google Scholar]
  72. Bahnasawy, M.; Khidr, A.A.; Dheina, N. Seasonal variations of heavy metals concentrations in mullet, Mugil cephalus and Liza ramada (Mugilidae) from Lake Manzala, Egypt. Egypt. J. Aquat. Biol. Fish. 2009, 13, 81–100. [Google Scholar] [CrossRef] [Green Version]
  73. Cocoros, G.; Cahn, P.H.; Siler, W. Mercury concentrations in fish, plankton and water from three Western Atlantic estuaries. J. Fish Biol. 1973, 5, 641–647. [Google Scholar] [CrossRef]
  74. National Cancer Institute. Cadmium. Available online: https://progressreport.cancer.gov/prevention/cadmium (accessed on 10 February 2023).
  75. Hossain, M.B.; Bhuiyan, N.Z.; Kasem, A.; Hossain, K.; Sultana, S.; Nur, A.-A.U.; Yu, J.; Albeshr, M.F.; Arai, T. Heavy Metals in Four Marine Fish and Shrimp Species from a Subtropical Coastal Area: Accumulation and Consumer Health Risk Assessment. Biology 2022, 11, 1780. [Google Scholar] [CrossRef]
  76. Fay, M.; Ingerman, L. Toxicological Profile for Nickel; Agency for Toxic Substances and Disease Registry (ATSDR): Atlanta, GA, USA, 2005. [Google Scholar]
  77. Defarge, N.; De Vendômois, J.S.; Séralini, G.E. Toxicity of Formulants and Heavy Metals in Glyphosate-Based Herbicides and Other Pesticides. Toxicol. Rep. 2018, 5, 156–163. [Google Scholar] [CrossRef]
  78. Alman, B.; Fay, M.; Antezana, A.; Derrick, H.; Chiger, A.; Hall, S.; Lynch, M.; Diskin, K. Toxicological Profile for Copper; Agency for Toxic Substances and Disease Registry (ATSDR): Atlanta, GA, USA, 2022. [Google Scholar]
  79. Williamns, M.; Todd, G.D.; Roney, N.; Crawford, J.; Coles, C.; McClure, P.R.; Garey, J.D.; Zaccaria, K.; Citra, M. Toxicological Profile for Manganese; Agency for Toxic Substances and Disease Registry (ATSDR): Atlanta, GA, USA, 2012. [Google Scholar]
  80. Moffett, D.; Smith, C.; Stevens, Y.M.; Ingerman, L.; Swarts, S.; Chappel, L. Toxicological Profile for Barium and Barium Compounds; Agency for Toxic Substances and Disease Registry (ATSDR): Atlanta, GA, USA, 2007. [Google Scholar]
  81. Rahman, M.S.; Molla, A.H.; Saha, N.; Rahman, A. Study on heavy metals levels and its risk assessment in some edible fishes from Bangshi River, Savar, Dhaka, Bangladesh. Food Chem. 2012, 134, 1847–1854. [Google Scholar] [CrossRef]
  82. Alipour, H.; Banagar, G. Health risk assessment of selected heavy metals in some edible fishes from Gorgan Bay, Iran. Iran. J. Fish. Sci. 2018, 17, 21–34. [Google Scholar] [CrossRef]
  83. Munyeshury, V.; Chaúque, E.F.C.; Gulamussen, N.J.; Mandlate, J.S.; Richards, H.; Adelodun, A.A. Potential health risks of trace metals in muscle tissue of tilapia and catfish from Mozambican markets. Arch. Agric. Environ. Sci. 2021, 6, 508–518. [Google Scholar] [CrossRef]
  84. Yilmaz, A.B. Comparison of Heavy Metal Levels of Grey Mullet (Mugil cephalus L.) and Sea Bream (Sparus aurata L.) Caught in Iskenderun Bay (Turkey). Turk. J. Vet. Anim. Sci. 2005, 29, 257–262. [Google Scholar]
  85. Al-Majed, N.B.; Prestonà, M.R. An Assessment of the Total and Methyl Mercury Content of Zooplankton and Fish Tissue Collected from Kuwait Territorial Waters. Mar. Pollut. Bull. 2000, 40, 298–307. [Google Scholar] [CrossRef]
  86. Raja, P.; Veerasingam, S.; Suresh, G.; Marichamy, G.; Venkatachalapathy, R. Heavy Metals Concentration in Four Commercially Valuable Marine Edible Fish Species from Parangipettai Coast, South East Coast of India. Int. J. Anim. Vet. Adv. 2009, 1, 10–14. [Google Scholar]
  87. Naeem, M.; Salam, A.; Tahir, S.S.; Rauf, N. The Effect of Fish Size and Condition on the Contents of Twelve Essential and Non Essential Elements in Aristichthys Nobilis. Pak. Vet. J. 2011, 31, 109–112. [Google Scholar]
Figure 1. Map of the study area and location of sampling sites.
Toxics 11 00286 g001
Figure 2. Different parts of Tilapia spp. Collected for HM analysis.
Toxics 11 00286 g002
Figure 3. The share of HM concentration in each part of Tilapia spp.
Toxics 11 00286 g003
Figure 4. Percent (%) contribution of HMs to the THQ per body part.
Toxics 11 00286 g004
Figure 5. CR of HMs in various parts of Tilapia spp.
Toxics 11 00286 g005
Figure 6. Percent (%) contribution of As, Cd, Pb, and Ni to CR.
Toxics 11 00286 g006
Figure 7. Correlogram of HMs in the (a) bone, (b) fins, (c) head, (d) meat, (e) skin, (f) tail, and (g) viscera of Tilapia spp.
Toxics 11 00286 g007
Figure 8. PCA biplot of HMs in various parts of Tilapia spp.
Toxics 11 00286 g008
Table 1. The mean dry weight of fish parts, n = 77.
Fish PartMean Dry Weight (g)
Bone74.73
Fin9.73
Head54.71
Meat40–92
Skin69.64
Tail6.27
Viscera5.00
Table 2. Limit of detection (LOD) of Olympus Vanta XRF [35].
Name of MetalsLOD (mg/kg)
As1
Ba15
Cd2
Cu1
Fe1
Hg1
Mn3
Ni3
Pb1
Zn1
Table 3. Estimated ingestion rate of various parts of Tilapia spp. [36,37].
PartIngestion Rate (kg Person−1 Day−1)
Bone1.53 × 10−3
Fin3.01 × 10−4
Head2.91 × 10−3
Meat3.88 × 10−3
Skin9.74 × 10−4
Tail3.01 × 10−4
Viscera9.59 × 10−3
Table 4. Mean concentration of HMs (mg kg−1) in various parts of Tilapia spp.
PartAsBaCdCuFePbMnHgNiZn
TailND3.27 ± 1.22.55 ± 2.03.73 ± 3.534.00 ± 29.10.30 ± 0.55.39 ± 9.5NDND64.56 ± 55.3
SkinND4.14 ± 0.83.00 ± 2.26.28 ± 5.454.04 ± 47.91.35 ± 1.08.22 ± 11.7NDND46.28 ± 32.3
MeatND2.23 ± 0.51.45 ± 0.94.61 ± 7.529.17 ± 30.1ND2.17 ± 4.82NDND30.38 ± 52.8
Fins0.09 ± 32.90 ± 0.73.82 ± 5.811.02 ± 38.258.67 ± 124.21.85 ± 5.46.43 ± 6.4ND6.36 ± 2.11 ND78.65 ± 57.7
BoneND1.91 ± 0.71.00 ± 1.34.22 ± 3.652.48 ± 41.9ND0.74 ± 0.14NDND22.73 ± 14.8
VisceraND2.25 ± 0.73.30 ± 1.941.95 ± 73.3216.50 ± 566.9ND1.77 ± 5.10.60 ± 1.9ND112.53 ± 332
Head0.45 ± 51.80 ± 0.61.73 ± 1.93.13 ± 3.144.00 ± 59.6ND2.09 ± 3.1NDND27.92 ± 18.8
FAO/WHO Limits [55,56] 1.4N/A0.530.0100.00.51.000.5030.0100.0
ND—Not Detected.
Table 5. One-way ANOVA of the HMs in various parts of Tilapia spp.
HMdfFp Value
Ba611.476.81 × 10−9
Cd61.4560.2062
Cu63.7810.0026
Fe61.8370.1043
Mn64.2340.0011
Zn65.1510.0002
Table 6. THQ of HMs in each part of Tilapia spp.
PartsAsBaCdCuFePbMnHgNiZn
Tail00.00010.01100.00040.00020.00040.0002000.0009
Skin00.00030.04170.00220.00110.00530.0008000.0021
Meat00.00060.08050.00640.00230.00000.0009000.0056
Fins0.00130.00010.01640.00120.00040.00230.000200.00140.0011
Bone00.00020.02190.00230.001600.0001000.0017
Viscera00.00020.04520.01440.004200.00020.082200.0051
Head0.06310.00040.07190.00330.002600.0006000.0039
Disclaimer/Publisher’s Note: The statements, opinions and data contained in all publications are solely those of the individual author(s) and contributor(s) and not of MDPI and/or the editor(s). MDPI and/or the editor(s) disclaim responsibility for any injury to people or property resulting from any ideas, methods, instructions or products referred to in the content.

