Article

A Multi-Objective Dynamic Resource Allocation Model for Search and Rescue and First Aid Tasks in Disaster Response by Employing Volunteers

by
Emine Nisa Kapukaya
and
Sule Itir Satoglu
*
Industrial Engineering Department, Istanbul Technical University, Istanbul 34367, Turkey
*
Author to whom correspondence should be addressed.
Logistics 2025, 9(1), 41; https://doi.org/10.3390/logistics9010041
Submission received: 20 November 2024 / Revised: 27 February 2025 / Accepted: 12 March 2025 / Published: 14 March 2025
(This article belongs to the Section Humanitarian and Healthcare Logistics)

Abstract

Background: Each disaster has its specific resource requirements, varying based on its size, location, and the affected region’s socio-economic level. Pre-disaster planning and post-disaster dynamic resource allocation including material and human resources is essential. Methods: To address the resource allocation challenges in disaster response, a multi-objective two-stage stochastic programming model is developed for search and rescue and first aid activities. The model aims to minimize the total unmet human demand, the number of resources transferred between regions, and the total unmet material demand. The proposed model was solved for a real case of an expected earthquake in Istanbul’s Kartal district. The augmented epsilon constraint 2 algorithm was employed using the CPLEX solver. A sensitivity analysis was made. Results: Most of the unmet demand occurs in the first period. After that period, the unmet demand decreases with interregional transfers and additional resources. The model is robust to scenario probability and penalty value changes in the objectives. Conclusions: This is the first study that simultaneously and dynamically allocates renewable and non-renewable material resources and human resources, including the official rescue units and volunteers, for disaster response. Volunteers’ inclusion in teams considering their training and quitting behavior are unique aspects of the study.

1. Introduction

A disaster is defined as “a sudden, calamitous event that seriously disrupts the functioning of a community or society and causes human, material, and economic or environmental losses that exceed the community’s or society’s ability to cope using its resources”. by the International Federation of Red Cross and Red Crescent Societies (IFRC). Hazards are natural and inevitable, but they escalate into disasters only when a community lacks the necessary resources or organizational capacity to withstand the impact or when its population is vulnerable due to poverty or social disadvantages, as stated in the World Disasters Report 2020 [1]. Communities must reduce risks and become more resilient, preventing natural events from causing disasters by being prepared. The recent epidemics and pandemics crises experienced between 2020 and 2022 once again reveal the importance of resource planning in disaster management.
The Marmara earthquake, which occurred on 17 August 1999 (Mw = 7.6), resulted in the unfortunate loss of approximately 17,000 people and injured 50,000 people; there had never been such a devastating earthquake in Turkey or the world until 2023. On 6 February 2023, Turkey again faced the harsh reality of an earthquake. The first earthquake struck Kahramanmaraş with a magnitude of 7.7, and approximately nine hours following the initial earthquake, a second earthquake with a 7.5 magnitude occurred in the region. This caused widespread destruction not only in Kahramanmaraş but also in at least ten other provinces along the fault line, extending to Syria. The Turkish Disaster and Emergency Management Presidency (AFAD) reported approximately 45,000 fatalities and 110,000 injuries [2]. Roads were destroyed by the earthquake’s effects or closed due to heavy snowfall, making it impossible to reach the disaster area. Since the earthquake affected a considerable region, the provinces in the nearby areas could not help each other.
Turkey is in a seismic belt, and a 7.5 magnitude earthquake is expected to occur in the Marmara region, which encompasses Istanbul. This earthquake can devastate more than 60 percent of the region’s production, industry, and trade, making it crucial to develop a humanitarian logistics network to mitigate the consequences [3]. However, designing such a network is challenging, as humanitarian supply chains are more complex and unpredictable than traditional ones and are affected by unreliable and incomplete information about delivery times, demand levels, and locations [4]. Therefore, resource planning in disaster areas must be focused on optimizing the region’s resources and minimizing the need for external assistance.
The resource allocation problem is the problem of prioritizing and allocating a set of resources to a set of tasks. In a disaster, where many stakeholders will perform pre-determined tasks, the resource allocation objectives should be based on three pillars, according to Beamon and Balçık [5]. Both human resources and material supplies must be delivered to the affected individuals as soon as possible (effectiveness) by using optimum resources (efficiency) and without forgetting to consider fairness (equity). This is only possible if pre-disaster preparedness planning and response planning are carefully integrated [6]. Preparedness planning includes pre-locating resources, establishing a distribution network structure, and securing supplies. Response planning consists of delivering resources to the demand points, procuring extra supplies in case of unmet demands and outlining the strategies for procuring these resources. Coordinating disaster relief poses various challenges, including the chaotic post-disaster environment, involvement of numerous actors, and limited resources [5]. These resources can be classified as human resources (including rescue or aid teams and volunteers), renewable (such as equipment), and non-renewable (consumable) material resources. The FEMA (Federal Emergency Management Agency) aims to coordinate search and rescue teams and essential material resources during disasters and identify and provide any additional resources needed. This enables a quick response to disasters, the efficient use of resources, and enhanced community safety [7].
Human resources can be classified as professional paid aid workers and volunteers. Aid workers (also known as development workers or humanitarian aid workers) are professionals who help people affected by disasters. An aid worker is mainly responsible for assessing emergencies, distributing supplies, building relationships with local communities and staff, and coordinating volunteers.
Shin and Kleiner define a volunteer as “an individual who offers him/herself to a service without an expectation of monetary compensation” [8]. In the aftermath of a disaster, even if the system is appropriately planned, volunteers reach the disaster area first. Moreover, survivors usually become volunteers and become more active and cooperative than outsiders [9]. Between September 2020 and 2021, approximately 23.2% of Americans, or 60.7 million people, formally volunteered for organizations. These volunteers contributed approximately 4.1 billion hours, representing an economic value of USD 122.9 billion [10]. Likewise, according to Garcia et al., volunteers carry out 90 percent of the humanitarian work, and 95 percent of disaster relief workers are volunteers [11].
The coordination of volunteers differs from that of professional and paid relief workers [12]. In emergencies, teams must quickly assess the situation and provide necessary interventions. Volunteers may have received specific training or be spontaneous individuals who live in or near the affected areas, including disaster survivors, and sometimes need to be educated. Spontaneous volunteers account for 75% of search and rescue efforts [13]. Despite the invaluable contributions of volunteers in all aspects of post-disaster relief and recovery efforts, one of the biggest problems that still needs to be considered is the mismanagement of volunteers. Sometimes, the unconscious and uncoordinated crowd may hinder the rescue units and volunteers from completing their tasks.
The most crucial point in volunteer management is assigning volunteers to tasks appropriate to their preferences and skill levels. One of the irreversible consequences of bad management is serious problems, such as the appointment of fewer volunteers than necessary for specific tasks and a workforce surplus in some regions [14]. To mitigate these issues, procedures should be developed to systematically allocate these volunteers to the tasks after a disaster.
In post-disaster humanitarian logistics, various resource types must be effectively managed for efficient logistics operations, including goods delivery, casualty evacuation, and labor transfer [15]. During the preparedness phase, various emergency supplies are pre-located in humanitarian supply chains, including renewable resources (RRs) and non-renewable resources (NRRs) like medical supplies [16]. In disaster management, RRs, such as human resources and equipment, can be used repeatedly, while NRRs cannot be reused.
This study focuses on developing a multi-objective stochastic programming model for humanitarian disaster relief chain coordination integrated with official rescue units and volunteers considering multiple regions, RRs, and NRRs. It aims to ensure optimum human and material usage. For this purpose, we proposed a multi-objective stochastic model for the dynamic resource allocation planning for disaster response. The objective functions of the model are as follows:
  • Minimizing the total expected unmet human resource demand.
  • Minimizing the total number of resources expected to be transferred between regions.
  • Minimizing the expected unmet RRs and unmet NRRs in all disaster regions.
The scope of this work includes the immediate delivery of resources to the disaster area, conducting search and rescue operations, and providing first aid to disaster victims. These activities were chosen because they are essential and time-sensitive tasks crucial in a disaster’s immediate aftermath.
This study considers disaster scenarios involving different numbers of victims used to estimate the resources needed during rescue from debris, the transfer of the victims to a safe area, first aid treatments according to triage, and their transfer. Hence, the requirement for rescue units and volunteers in different disaster scenarios and interregional labor and resource transfer planning is performed under uncertainty in this study. Moreover, the model was applied to a sub-district of Istanbul. In the model, RRs and NRRs were pre-positioned before the earthquake, and it was decided that volunteers were to be trained in advance. After the earthquake, volunteers, rescue units, RRs, and NRRS were dynamically assigned to respond to a significant earthquake.
An important aspect of this study is allocating human resources based on the skills of different professions. In particular, volunteers’ employment in disasters is a unique aspect of this study since volunteers are usually a significant resource. As the model established in this study addresses human needs with different skills and capabilities, it is flexible enough to be used in other post-earthquake activities. In addition, the proposed stochastic programming model is novel since human resources, including volunteers and official rescue teams for first aid and search and rescue tasks, as well as the equipment and consumable materials required for these tasks, are planned in an integrated way for pre-disaster and post-disaster stages simultaneously for the first time in the literature. The training of the volunteers and pre-positioning of the material resources are decided before the disaster, and dynamic resource assignments and transfers are decided post-disaster, which reveals the strength of our model in pre-disaster and post-disaster resource allocation. In addition, volunteers’ training before disasters and the consideration of their quitting behavior are unique aspects of our study.
For effective disaster management, it is necessary to plan the pre-disaster (risk mitigation) and post-disaster (response) events together because these are interrelated problems that mutually affect each other. In our study, we discussed the decisions to be taken before the disaster and the decisions to be taken after the disaster using our two-stage stochastic programming model. The model will be valid for any situation where the scenarios cover the disaster situation that will occur. Regional disaster management centers can implement the decisions taken in constant information exchanges with other management centers.
This paper is organized as follows: The literature is comprehensively reviewed in the next section. In Section 3, model assumptions, multi-objective mathematical models, and the solution methodology are proposed. Section 4 explains the computational study of a real case in Istanbul. Later, in Section 5, the results of the case study are discussed in detail, and the managerial implications are explained. Finally, the conclusion and future studies are presented in Section 6.

2. Literature Review

Humanitarian aid logistics has garnered significant interest, particularly in recent years. Although the terms humanitarian logistics and disaster management are often used interchangeably in the literature, there are slight differences. In contrast, humanitarian logistics covers all activities. A disaster is a situation where local resources are insufficient to cope. The main areas of work in humanitarian logistics are facility location, network flow, and inventory management, and the reader may refer to detailed studies from the literature [17,18,19,20]. This section will discuss the studies associated with the resource allocation problem in disasters, including material, equipment, and human resources. Studies dealing with the volunteers are especially examined as well.
By the end of October 2024, we found 53 studies in Scopus that included the keywords “Resource Allocation” and “Humanitarian Logistics” and 24 studies that included the keywords “Volunteer” and “Humanitarian Logistics”. There were only two studies that included all three keywords (resource allocation, humanitarian logistics, and volunteer) at the same time [11,21]. We analyze the mentioned resource allocation literature in the Human Resource Allocation and Material Resource Allocation Subsections.

2.1. Human Resource Allocation

One humanitarian logistic challenge that needs more attention is the difficulty of coordinating numerous human resources effectively. Only 6% of previous studies are allocation problems, while other humanitarian logistics studies are location and routing problems [11]. Although studies on resource allocation exist, their scope is primarily related to equipment and tools, and, except for a few articles, the issue of human resource allocation is rarely touched upon.
Falasca et al.’s study was one of the first multi-objective models of volunteer management in humanitarian aid [4]. They developed a multi-criteria optimization model to assign volunteers to tasks. Falasca and Zobel [22] provided a new approach to voluntary management, using decision-maker preferences and information in the voluntary assignment process to examine tradeoffs between conflicting objectives.
Lassiter et al.’s study [14] minimized the total unfulfilled task demands for different task groups, considering the uncertainty of the demand and voluntary task matching, which aligns the skill levels of tasks and the volunteers. In Mayorga et al.’s [23] study, human resource planning was addressed, considering the uncertainty in voluntary arrivals and departures to represent voluntary behaviors.
Garcia et al.’s MIP model addressed the problem of distributing tasks to volunteers and other RRs and NRRs, especially in severe situations [11]. The research highlights notable distinctions between available voluntary resources and requests due to frequent fluctuations in requirements. Abualkhair et al. [1] optimized help center performance based on beneficiary, donor, and voluntary idle times measurements. The system is analyzed in an agent-based simulation environment to evaluate the effectiveness of spontaneous volunteers in the queues of various volunteer policies.
Chen et al. [24] suggested a new perspective on human resource allocation problems by introducing two-sided decision-making models considering rescue tasks and volunteers’ individual choices. Before dispatching, volunteers were grouped based on gender, professional skills, physical ability, and practical experience to form different volunteer teams in the study.
While relatively few studies explicitly focus on aid workers, some address rescue units and urban search and rescue (USAR) teams. Chen and Miller-Hooks [25] proposed a multi-stage stochastic programming model to maximize the number of people rescued while dynamically deploying USAR teams to disaster areas partially or wholly due to need and shortage. Zhang et al. [26] developed a multi-stage dynamic allocation model for organizing rescue teams and suggested specific disaster scheduling strategies. Similarly, the algorithm for the scheduling of relief teams (ASRT) has been approached as a routing and scheduling problem by Wex et al. [27] and Nayeri et al. [28]. Nayeri et al. [29] built a decision support model for USAR teams to allocate and schedule the rescue units as an unrelated parallel machine scheduling problem considering time windows for incidents. Rodríguez-Espíndola [30] developed systems for emergency preparedness with the involvement of multiple organizations, which shows how a lack of collaboration causes a significant performance decrease in the system. Shin et al. [31] proposed a repair crew problem that minimizes the last transportation time of the entire demand nodes. In Sarma et al.’s [32] study, the model aimed to minimize the total cost and time of the relief logistics operation with the collaboration of resource collection by the NGOs. In their proposed model, Li et al. [33] considered multiple disaster areas and departure places to reflect the best rescuers’ effects, preferences, and competence degrees. Satisfaction degrees are calculated depending on the intention (preference list), competence degrees, professional skills of rescuers, and requirements of tasks. Rauchecker and Schryen [34] proposed a model for scheduling rescue units for disaster incidents, minimizing the (weighted) sum of completion times. An exact branch-and-price algorithm was used to solve the NP-hard problem. Çağlayan and Satoğlu [35] proposed a multi-objective, two-stage stochastic programming model for casualty transportation systems in large-scale disasters, considering the deterioration of the casualties’ condition. They developed a data-driven decision support tool for managing ambulances and hospitals. Öksüz and Satoğlu [36] proposed a post-disaster emergency medical response system that addresses the deterioration of the conditions of disaster victims. This multi-objective stochastic model includes the location planning of medical centers, casualty allocation, and medical staff assignment.

2.2. Material Resource Allocation

The most suitable inventory and management strategies for relief commodities differ based on the commodities’ specific attributes [16]. Sometimes, several emergency supplies (such as tents, blankets, and kitchenware) are packaged in standard kits/pallets and considered a single item [37]. These kits are prepositioned in critical locations for quick mobilization during emergencies.
The prepositioned resources for Hurricane Rita in 2005 were insufficient or conveniently located, leading to a shortage of supplies in the affected areas. With the lesson learned, it has been noted that appropriate prepositioning for various disasters helps significantly improve disaster response [6]. On the other hand, even if medical kits are delivered on time, patients may not be treated appropriately because no first aid teams are available to use these kits to treat the affected people. Learning from past experiences and focusing on synchronizing RRs and NRRs for effective disaster management is essential to address these challenges.
Scholars have suggested different models and approaches to efficiently organize and distribute crucial relief supplies during emergencies. Tzeng et al. [38] developed a fuzzy multi-objective programming model for emergency relief distribution to decrease expenses, minimize travel duration, and maximize satisfaction to improve the effectiveness and fairness of delivering relief supplies to needy areas. Rawls and Turnquist [39] built a model for planning shelters after a disaster. The study highlights the complexity of decision-making in preparing for natural disasters, including determining the locations and capacities of emergency distribution centers and allocating inventories of relief supplies. Rezaei-Malek et al. [40] proposed a model that combines location–allocation and distribution planning by identifying the most suitable location for storing and distributing perishable commodities in the pre-disaster phase. Pradhananga et al. [6] proposed scenario-based, two-stage stochastic programming to deliver supplies to disaster victims in a timely and cost-effective manner while minimizing social costs. Yu et al. [41] aimed to simultaneously improve resource allocation efficiency, effectiveness, and equity by considering the human suffering caused by delivery delays in the proposed model.
Rodríguez-Espíndola et al. [42] suggested a bi-objective dynamic model to support disaster responses involving using human and material resources for multiple organizations, aiming to investigate the tradeoff between resource usage and service levels. Sabouhi et al. [43] propose a mixed-integer linear programming model for the evacuation and distribution process during emergencies by simultaneously planning vehicle routes and schedules to minimize the total arrival time of vehicles at affected areas, shelters, and distribution centers. Ghasemi et al. [44] developed a mathematical framework incorporating various factors, including resources, periods, and uncertainties, to minimize costs associated with facility selection, distribution, and inadequate relief materials in earthquake response. Shao et al. [45] analyzed the supply and demand of relief materials for various types and severities of disasters, offering detailed lists of comprehensive relief requirements. Shaw et al. [46] proposed a multi-objective optimization model for optimal distribution center placement, aiming to maximize service coverage while minimizing cost and time, incorporating triangular type-2 fuzzy numbers to handle uncertainty. Das et al. [47] developed a multi-objective location–allocation model employing fuzzy logic for the uncertain parameters.
In addition, some studies recommend pre-positioning inventory, service outsourcing, and delivery option contracting in relief material supply chain management to ensure the availability and flexibility of the optimal quantity of relief commodities to be ordered before and after a disaster [48,49]. This is the first study in which volunteers, official rescue units, and renewable and non-renewable material resources are planned and dynamically assigned, and resource transfers between regions are made. Another contribution of this study to the literature is that it dynamically assigns all these resources synchronously, addressing both pre-disaster and post-disaster, different regions and periods, through our two-stage stochastic programming model considering uncertainty in many parameters such as demand, resources, and transport durations.
Our study significantly contributes to volunteer human resources planning for disaster response. We have proposed a hybrid structure that includes volunteers in the search and rescue and medical teams for disaster response and training the volunteers in advance before the disaster. In addition, the prepositioning of all renewable and non-renewable resources before the disaster and the allocation and transfer decisions of these material resources after the catastrophe are carried out, and the human resource (teams) allocations are made. This novel approach has never been studied before. In addition, we conducted a comprehensive study on search and rescue and first aid tasks, including the sub-tasks these activities consist of, the workforce requirements, and the expected duration. This application adds to the literature and provides a comprehensive guide for practitioners in dynamic resource management in major disasters.

3. Methodology

This section defines the problem and proposes a dynamic resource allocation system. Then, the assumptions, the multi-objective stochastic programming model, and the solution methodology are proposed and explained in the following subsections.

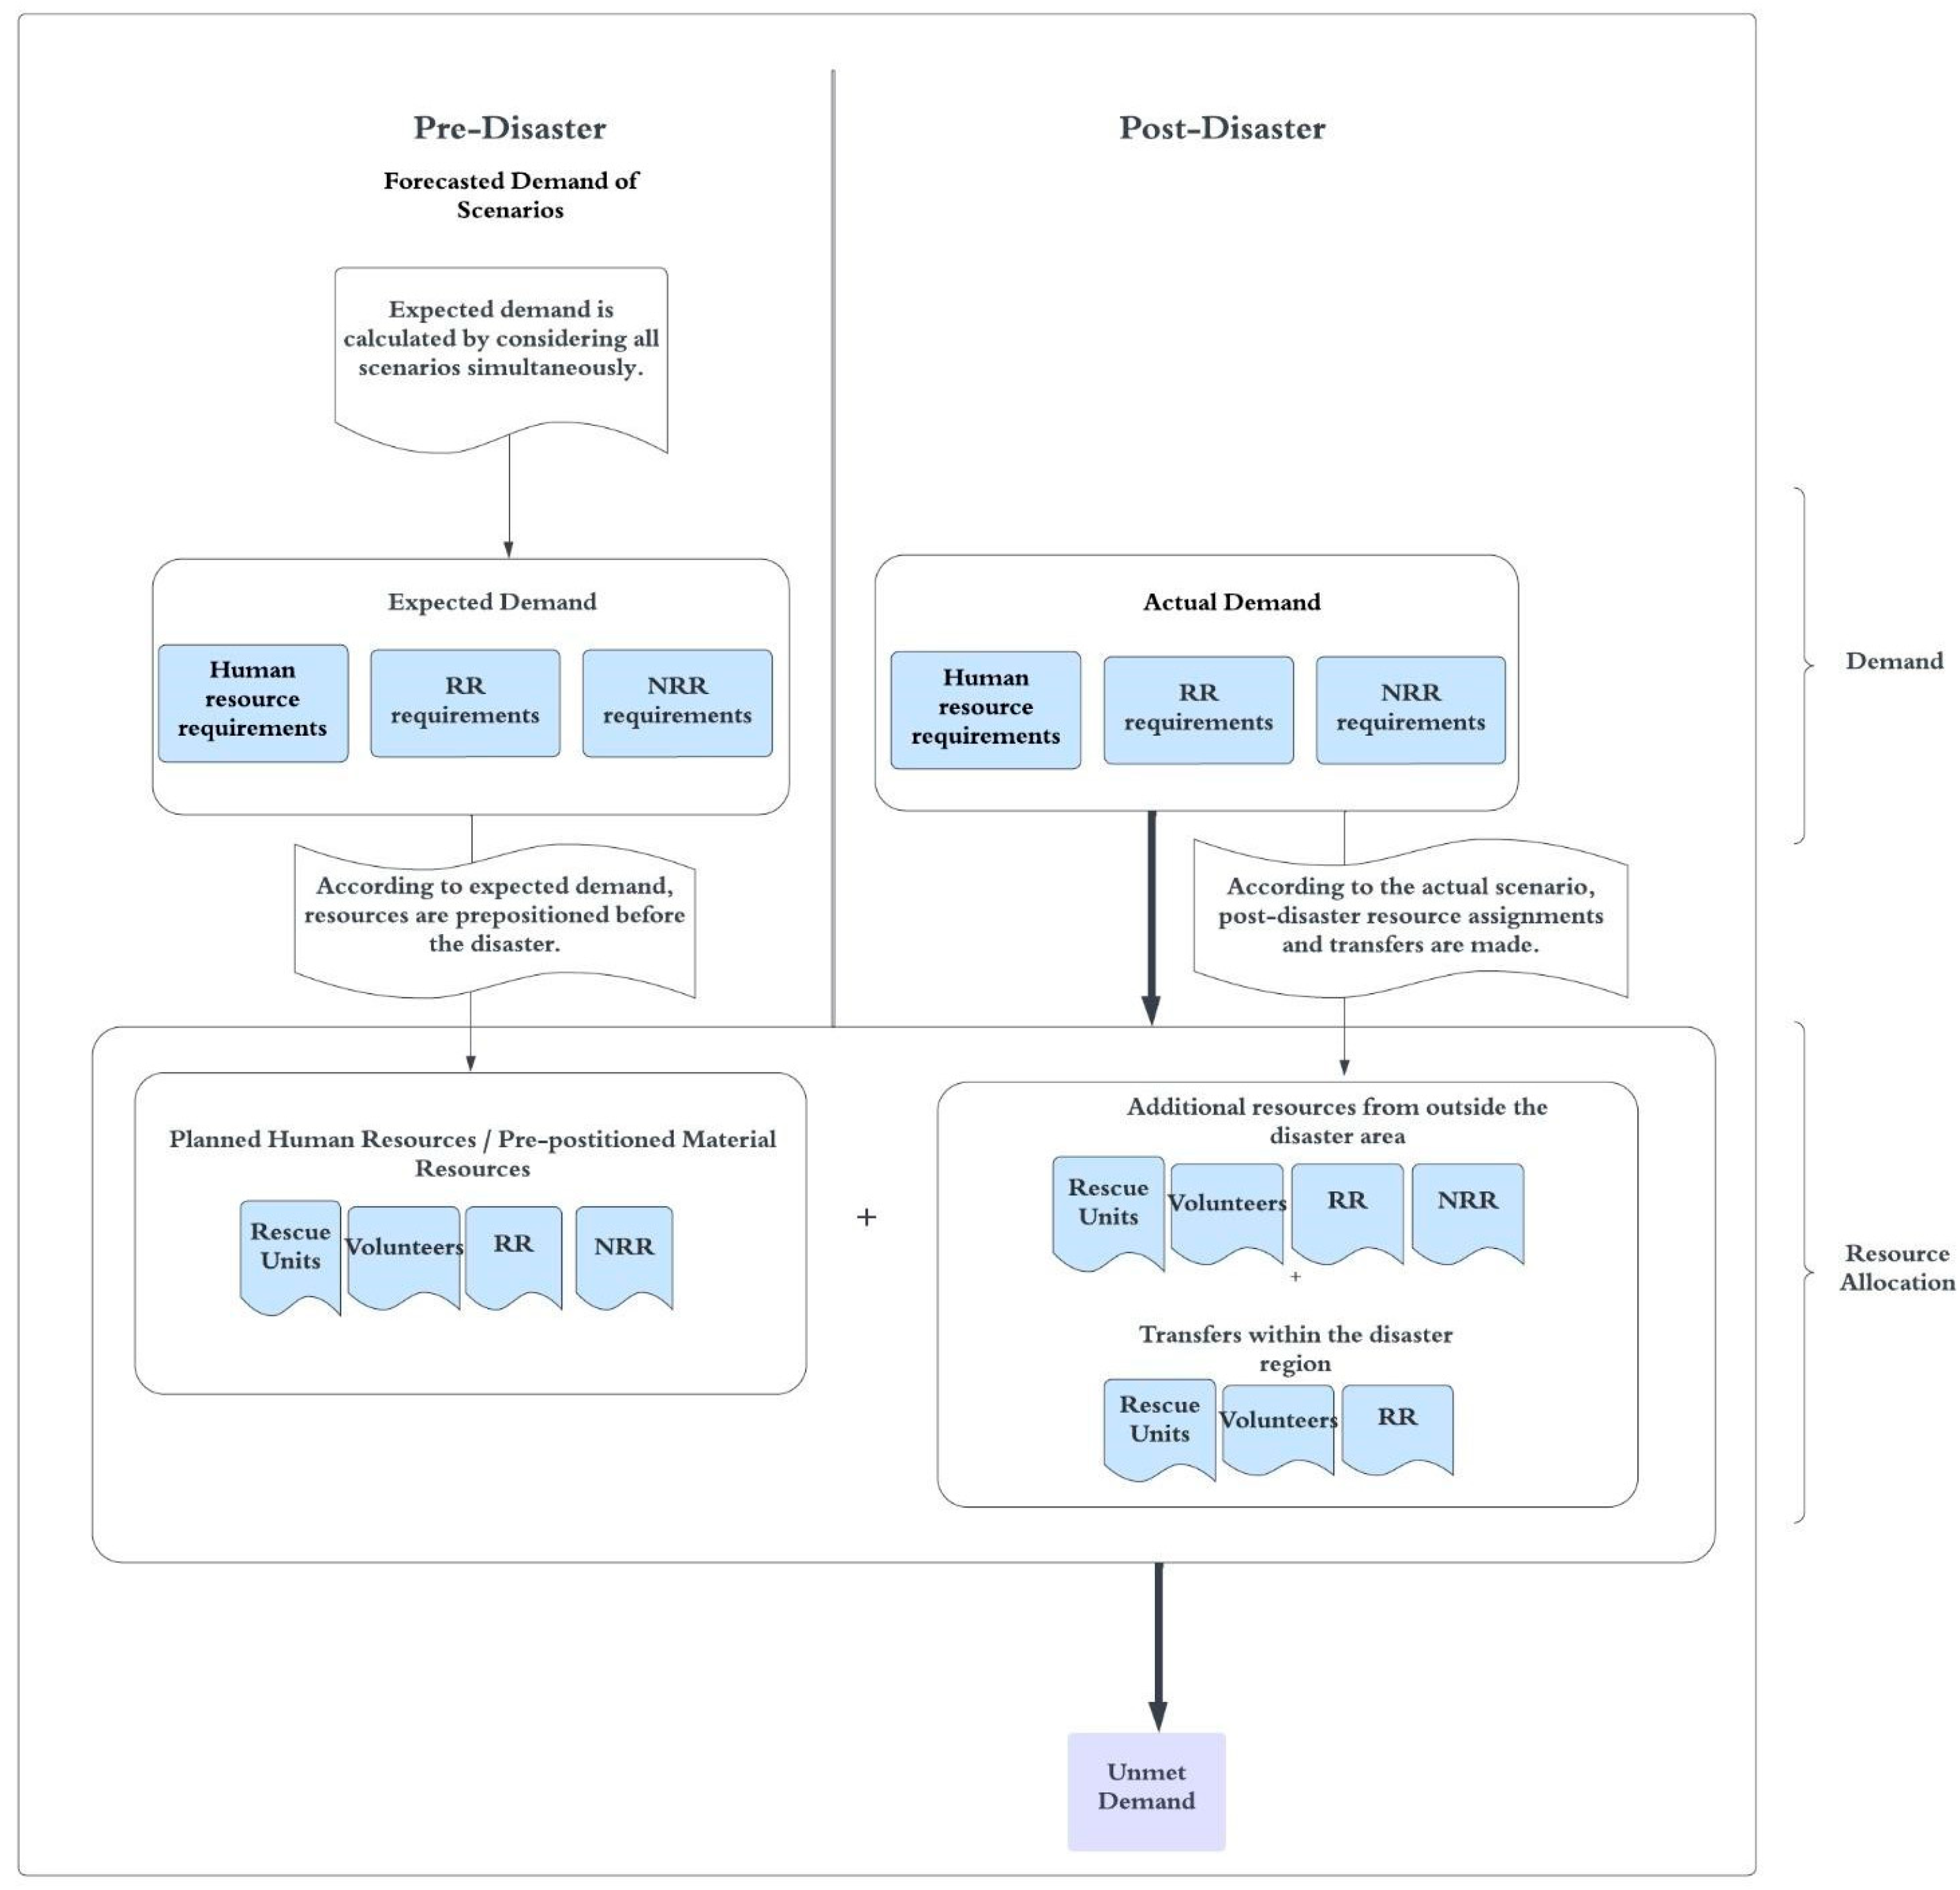
3.1. Problem Definition

Following large-scale earthquakes, existing resources are not capable of meeting the needs. Therefore, additional resources are required. The selection of these resources and how they are delivered are also important.
Before the disaster, resources are planned according to the expected value estimated based on the scenarios. After the disaster, according to the actual scenario, the demands in the disaster zones are realized, and additional resources and transfers are decided. The determination of demands for the pre-disaster and post-disaster resource assignments made accordingly is explained in the flow chart in Figure 1. As Figure 1 implies, in the pre-disaster stage, the expected demand for human resources (including rescue and first aid teams and volunteers) and renewable and non-renewable resources is estimated based on all scenarios. According to these, the materials are pre-positioned, and the volunteers’ training plans are made. In the post-disaster stage, according to the actual demand, dynamic assignments and transfers of human and material resources and additional resource allocations from outside the disaster zones are made periodically. Regional disaster management centers responsible for disaster preparedness and responses make these decisions. The bold arcs represent the actual or realized demand.
A dynamic resource planning study is carried out for search and rescue and first aid activities, focusing on saving human life in order of importance. Each activity is divided into tasks to define workforce requirements, and the required task after an earthquake is presented in detail in Figure 2. There are eight tasks that need to be completed after an earthquake for search and rescue and first aid purposes, as shown in the figure. Those pertaining to the search and rescue group are rescuing from the surface (S1), rescuing from debris (S2), dispatching to a safe zone (S3), dead victim removal (S4), and triage of the victims (S5). In addition, first aid tasks for minimal casualties (T1), delayed casualties (T2), and immediate casualties (T3) must be provided. These tasks are also shown in Figure 2. All these tasks need different amounts of human and material resources that vary according to the nature of the task.
Renewable, non-renewable, and human resources must be simultaneously planned during the pre-disaster prepositioning, post-disaster assignment, and transfer decisions in the model because the considered tasks require all of them simultaneously. Without any of these, the tasks cannot be performed. This requirement is reflected in the proposed mathematical model. Figure 1 and Figure 2 also imply that these resources are required for the tasks simultaneously.
Just as search and rescue missions are prioritized over food distribution in the immediate aftermath of a disaster, missions can also be prioritized based on their importance [14]. In this regard, it can be concluded that the value of the loss that will occur if a task is not completed will vary depending on its vitality. The model reflected this situation as the penalty cost of unmet demands. Casualties are classified based on NATO’s triage rule into minimal (requiring outpatient treatment), delayed (requiring short-term hospital treatment), and immediate (requiring long-term hospital treatment). This classification affects the necessary number of human resources for medical treatment.
The first 72 h after the earthquake are critical in saving the injured before their conditions deteriorate further. Therefore, the study was conducted considering this time window for disaster response. This time window was split into four parts, namely 0–12, 12–24, 24–48, and 48–72 h, and was considered in this way throughout this study.
Rescue units consist of government-appointed employees with a variety of roles and professions. On the other hand, volunteers can either spontaneously come forward or have acquired specific skills through training. Rescue units come together at the disaster management center (DMC) immediately after the disaster and are transferred to the required region in line with the needs. Additional human resources are also sent to disaster areas through DMCs in the following periods. In the first period, volunteers start working in the predetermined disaster areas. Then, they are transferred to the required areas in subsequent periods, just like rescue units.
The possibility of road failure is also considered during these transfers. The model was established so that additional rescue units and volunteers could reach the disaster area from outside and start working from the second period. In disaster management activities, rescue units and volunteers working in disaster areas may leave their jobs due to various problems. In our study, different rates of quitting behaviors of volunteers and rescue units were determined in their transition to the next period. Regarding material resources, the aim is to classify resources as renewable (RR) and non-renewable (NRR) and plan them accordingly so they can be assigned synchronously with human resources according to task type and requirement. While interregional transfers can be made for renewable resources and rescue teams starting from the second period, transfers for NRRs are not allowed.
The following assumptions are made in the model:
  • Each region’s resource requirements are in the center of the neighborhood, and resources are transferred to these locations.
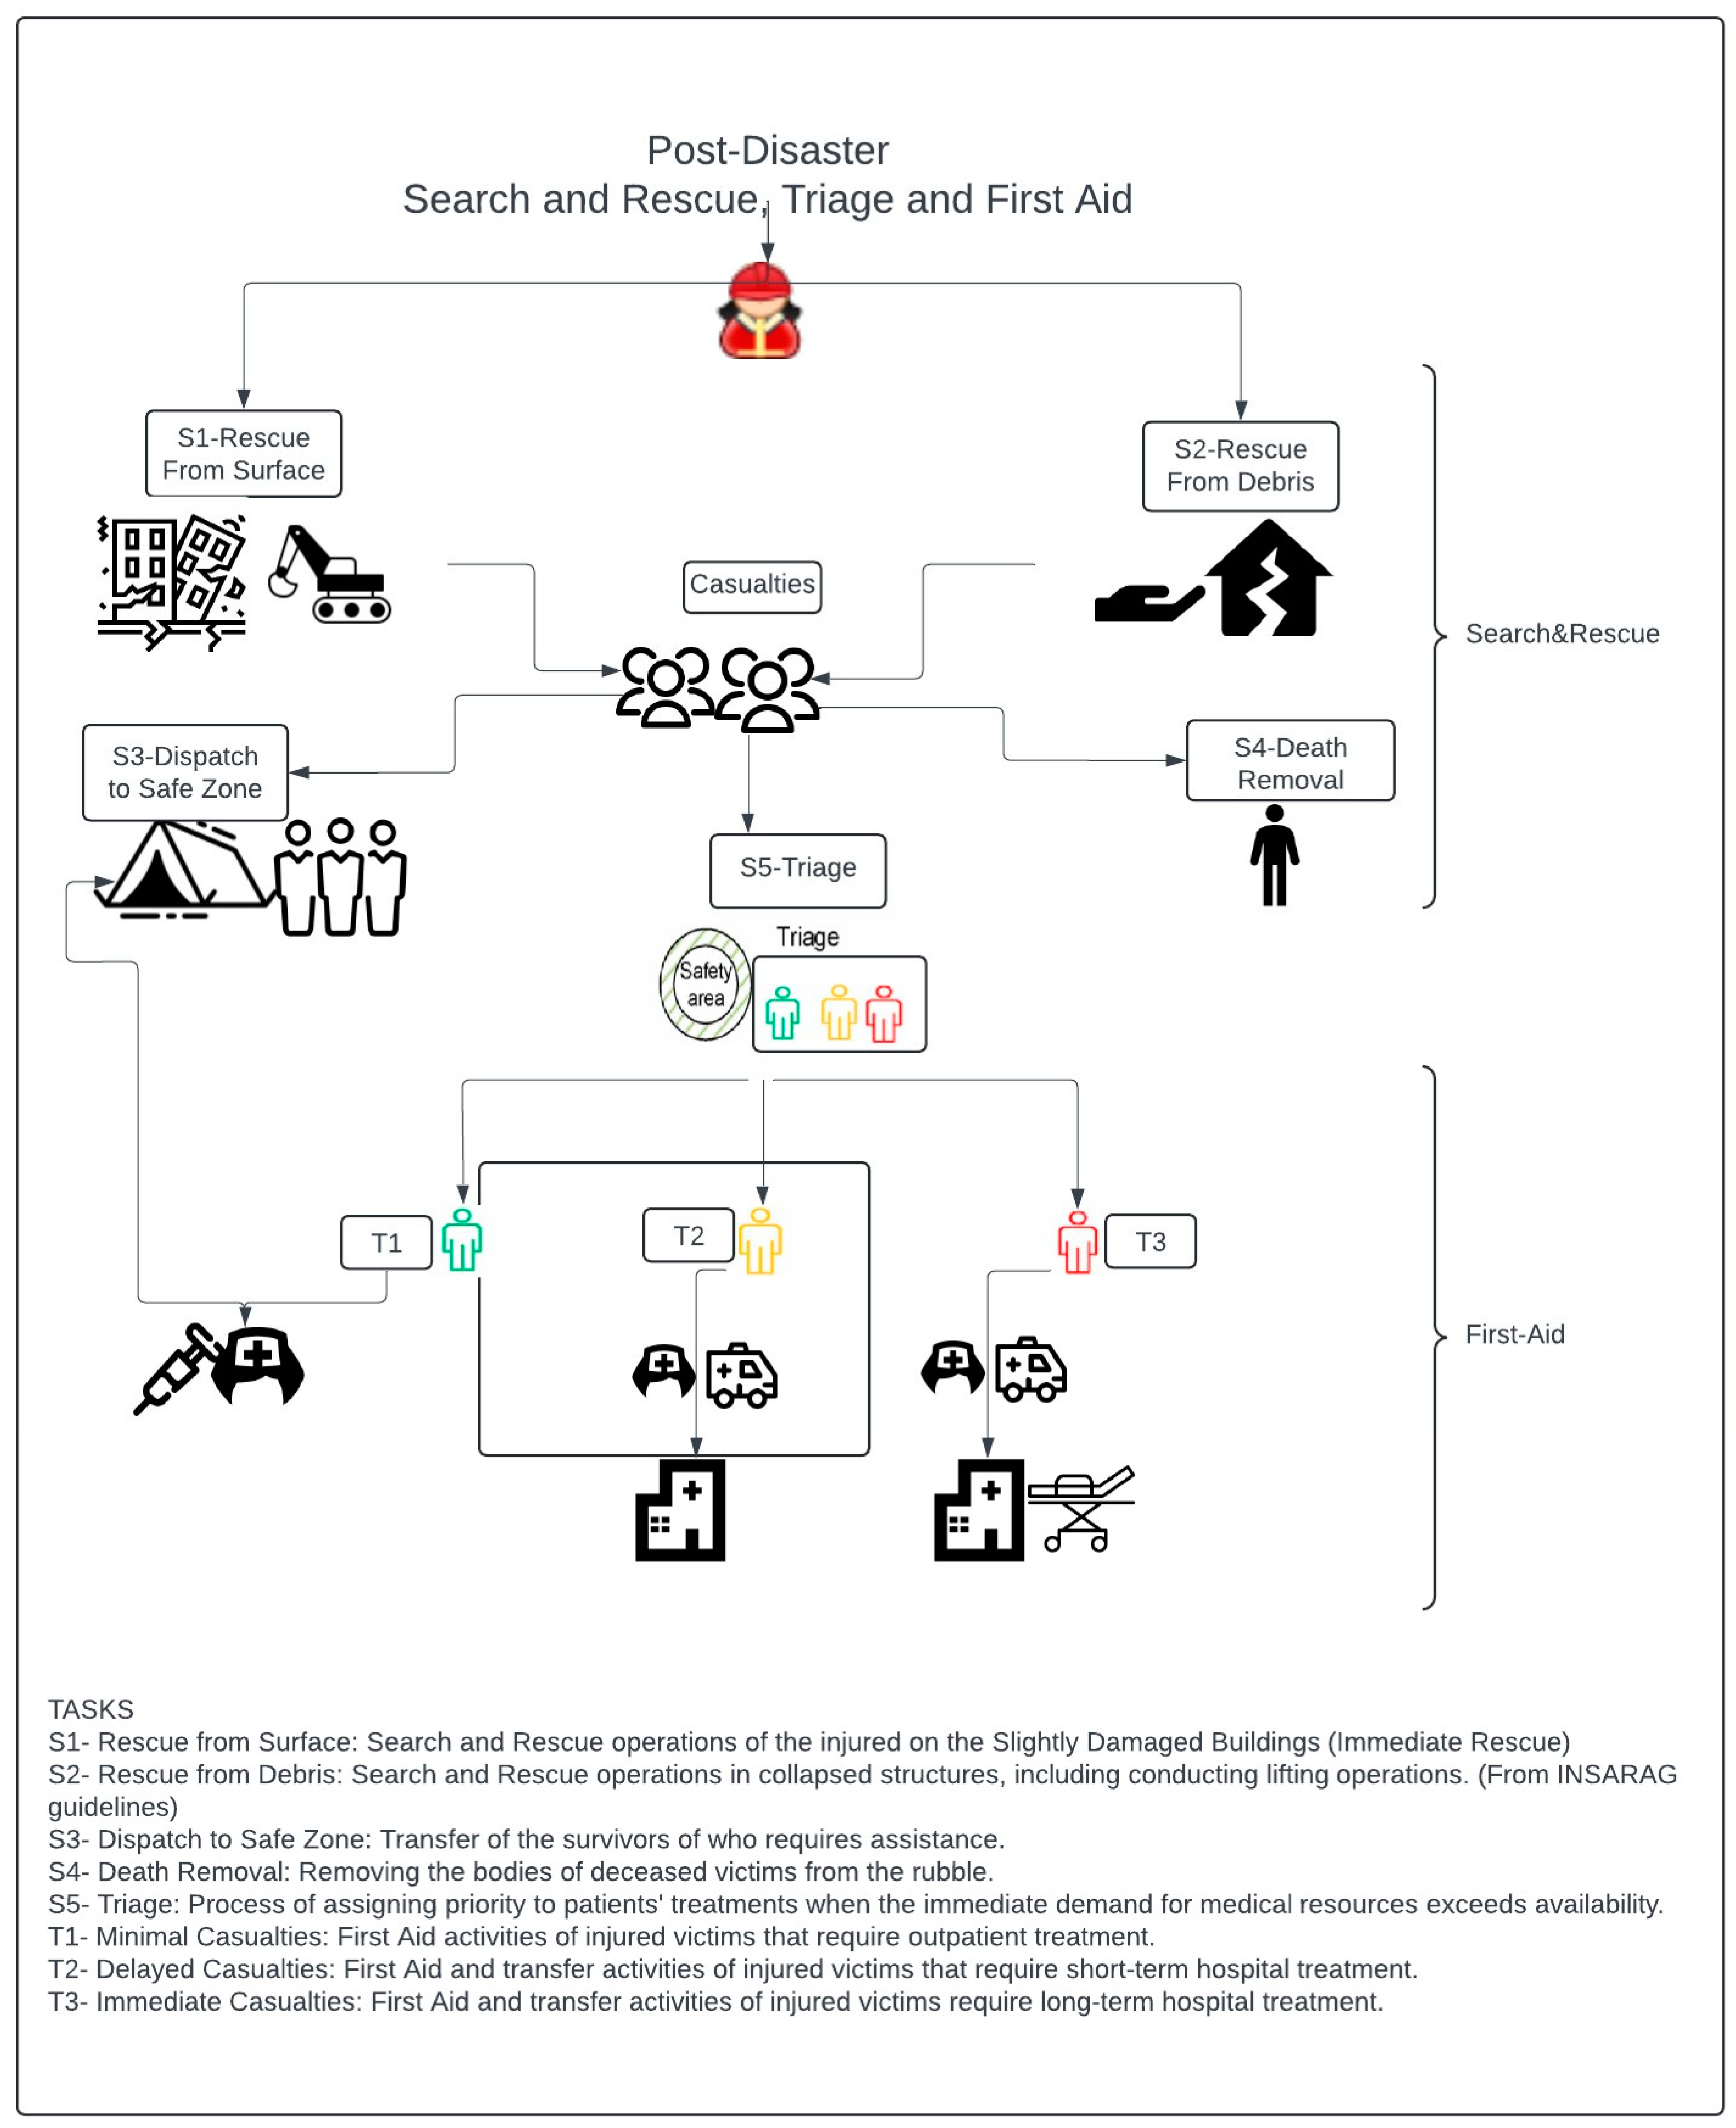
  • For each region, casualties rescued from the surface in that area originate from slightly and moderately damaged buildings, and the casualties that need to be rescued from the debris are from heavily damaged buildings.
  • A health worker treats patients whose condition is minimal and who can be treated on an outpatient basis in a place close to the triage area without transferring them to the hospital. Other injured people are transferred to the hospitals.
  • Volunteers can work on predetermined tasks.
  • Skilled volunteers who received volunteer training from certain occupational groups can immediately start working at the scene in case of disaster and fulfill some tasks. However, the DMC sends rescue units to disaster areas.
  • A team, which consists of the people required for a task, will not disperse until the task is completed.
  • It is assumed that there is no vehicle resource constraint for the transfer between regions.

3.2. Proposed Multi-Objective Stochastic Programming Model

A multi-objective, two-stage stochastic programming model was developed for resource allocation in humanitarian relief chain coordination. The model is integrated with volunteers and official rescue units and considers multiple regions, RRs, and NRRs.
Index and sets:
tTasks (t∈T)
wProfessions (w∈W)
sPossible scenarios (s∈S)
pPeriods (p∈P)
bRegions/disaster areas (b∈B)
rRenewable resource types (r∈R)
nNon-renewable resource types (n∈N)
TSet of tasks
W1Set of professions that only volunteers operate (W1∈W)
W2Set of professions that only rescue units operate (W2∈W)
WSet of professions
SSet of scenarios
PSet of periods
RSet of resources
NSet of non-renewable resources
Deterministic Parameters:
V p w p b : Volunteer with profession (w) number already trained to perform to be deployed in disaster region (b) in period (p).
R U w p : Rescue unit with profession (w) number to be deployed in period (p).
T C w : Training cost of volunteers to perform profession (w).
P e n t p : Penalty cost for unmet demand of task (t) in period (p).
t t i m e b b : Traveling time from region (b) to region (b′).
R e q t w : Human resource requirement from profession (w) to accomplish task (t).
R R e q t r : The number of renewable resources (r) required to accomplish task (t).
N R R e q t n : The number of non-renewable resources (n) required to accomplish task (t).
d f r e q p : The frequency of distribution for non-renewable resources in period (p).
P L p : Length (duration) of period (p).
V m a x p : Allowed working hours for volunteers in period (p).
R U m a x p : Allowed working hours for rescue units in period (p).
N r r : The existing total number of renewable resource (r) in the disaster area at the beginning.
N n r n : The existing total number of non-renewable resource (n) in the disaster area at the beginning.
u s g n : The ratio of the usage time of non-renewable resource (n) to the total duration of the task in which it is used.
Uncertain Parameters:
P r s : Occurrence probability of scenario (s).
C a s t p b s : Casualty number, requiring task (t) in disaster region (b) in period (p) according to scenario (s).
d u r a t s : Duration of task-t according to scenario (s).
l f b b s : Traveling time increase ratio of the road (b to b′) according to scenario (s) due to road failures.
D w p b s : Demand for profession (w) in the disaster region (b) in period (p) according to scenario (s) (man × hours).
D w p b s = t T C a s t p b s × R e q t w × d u r a t s ; ( w W ) , p P , b B , s S
R D r p b s : Demand of renewable resource (r) in period (p) in region (b) according to scenario (s).
R D r p b s = t T C a s t p b s × R R e q t r × d u r a t s P L p ; r R , p P , b B , ( s S )
N R D n p b s : Demand of non-renewable resource (n) in period (p) in region (b) according to scenario (s).
N R D n p b s = t T C a s t p b s × N R R e q t n × d f r e q p ; n N R p P ( b B ) ( s S )
Scalars:
Pc3: The penalty–cost ratio for the unmet demand for renewable resources relative to the unmet demand for non-renewable resources.
Vq: Volunteer quitting rate.
RUq: Rescue unit quitting rate.
Ratv: Ratio of the number of additional volunteers to be accepted to the disaster area to the current number of volunteers.
Ratr: Ratio of the number of additional rescue units to be accepted to the disaster area to the current number of rescue units.
Decision variables:
First-Stage Decision Variables:
V E x p w b : Additional volunteer number to be trained before the disaster to meet the demand in profession (w) to be deployed in the disaster region (b).
M R r b : Amount of renewable resource (r) prepositioned to meet the demand in disaster region (b).
M N R n b : Amount of non-renewable resource (n) prepositioned to meet the demand in disaster region (b).
Second-Stage Decision Variables:
U D w p b s : Unmet demand of human workforce with profession (w) in region (b) in period (p) according to scenario (s) (man-hour).
V A w p b s : Volunteer with profession (w) that is assigned to region (b) in period (p) according to scenario (s) (man-hour).
R U A w p b s : Rescue unit with profession (w) that is assigned to region (b) in period (p) according to scenario (s) (man-hour).
V a d d w p b s : Additional volunteer number with profession (w) to region (b) from outside of the disaster area in period (p) according to scenario (s) (man).
R U a d d w p b s : Additional rescue unit number with profession (w) to region (b) from outside of the disaster area in period (p) according to scenario (s) (man).
V T r w p b b s : Transferred volunteer number with profession (w) in period (p) from region (b) to region (b′) according to scenario (s) (man).
R U T r w p b b s : Transferred rescue unit number with profession (w) in period (p) from region (b) to region (b′) according to scenario (s) (man).
A R R r p b s : Additional renewable resource (r) number required to meet the demand in disaster region (b) in period (p) according to scenario (s) (unit).
A N R R n p b s : Additional non-renewable resource (n) number required to meet the demand in disaster region (b) in period (p) according to scenario (s) (unit).
R T r r p b b s : Transferred renewable resource (r) number in period (p) from region (b) to region (b′) according to scenario (s) (unit).
R U D r p b s : Unmet demand of renewable resource (r) in period (p) of region (b) according to scenario (s) (unit).
R A r p b s : Assigned renewable resource (r) number in period (p) to region (b) according to scenario (s) (unit).
N R U D n p b s : Unmet demand of non-renewable resource (n) in period (p) of region (b) according to scenario (s) (unit).
N R A v a n p b s : Available non-renewable resource (n) in period (p) in region (b) according to scenario (s) (unit).
N R A s n p b s : Assigned non-renewable resource (n) number in period (p) to region (b) according to scenario (s) (unit).
Objective 1 (Z1) (minimize total unmet human resource demand (man × hour))
M i n i m i z e   s S P r s [ w W t T b B p = 1 ( D w p b s V E x p w b + V p w p b V m a x p R U w p R U m a x p ) P e n t p + w W t T b B p 2 . . P U D w p b s P e n t p ]
Objective 2 (Z2) (minimize the number of transfers between regions (unit))
M i n i m i z e s S P r s w W p P b B b B V T r w p b b s + R U T r w p b b s + r R p P b b b B R T r r p b b s
Objective 3 (Z3) (minimize total unmet material resource demand (unit))
M i n i m i z e s S P r s [ r R p = 1 b B ( R D r p b s M R r b ) P c 3 + n N p = 1 b B N R D n p b s ( M N R n b N R A v a n p b s ) + r R p P b B R U D r p b s P c 3 + n N p P b B N R U D n p b s ]
Subject to
Demand Constraints:
U D w p b s = D w p b s V E x p w b + V p w p b × V m a x p R U w p × R U m a x p ; w W , p = 1 , b B , s S
U D w p b s = D w p b s + U D w p 1 b s V A w p b s R U A w p b s ;   w W , p = 2 . . . P , b B , s S
V E x p w b + V p w p b × V m a x p = V A w p b s ;   w W , p = 1 , b B , s S
R U w p × R U m a x p = R U A w p b s ; w W , p = 1 , b B , s S
V A w p b s = V A w p 1 b s × 1 V q + V a d d w p b s + V p w p b + b B V T r w p b b s b B V T r w p b b s × V m a x p b B V T r w p b b s × t t i m e b b ( 1 + f b b s ) w W 1 , p = 2 . . . P , ( t T ) , ( b B ) , s S
R U A w p b s = R U A w p 1 b s × 1 R U q + R U w p + R a d d w p b s + b B R U T r w p b b s b B R U T r w p b b s × R U m a x p b B R U T r w p b b s × t t i m e b b ( 1 + f b b s ) w W 2 , p = 2 . . . P , t T , b B , s S
Renewable Resource Constraint:
b B M R r b N r r ;   ( r R )
R A r p b s M R r b ; ( r R ) p = 1 ( b B ) ( s S )
R A r p b s   R A r ( p 1 ) b s + A R R r p b s + b B R T r r p b b s b B R T r r p b b s ; ( r R ) p = 2   P ( b B ) ( s S )
R U A w p b s + V A w p b s t T R R e q t r × R e q t w × d u r a t s × R A r p b s ; w W   r R   p P ( b B ) ( s S )
R U D r p b s = R D r p b s R A r p b s ;   r R p P ( b B ) ( s S )
Non-Renewable Resource Constraint:
b B M N R n b N n r n ;           ( n N R )
N R A v a n p b s = M N R n b N R A s n p b s ;   n N R p = 1 ( b B ) ( s S )
N R A v a n p b s = N R A v a n ( p 1 ) b s N R A s n p b s + A N R R n p b s ;   n N R p > 14 ( b B ) ( s S )
N R U D n p b s = N R D n p b s N R A s n p b s ;   n N R p P ( b B ) ( s S )
R U A w p b s + V A w p b s t T N R R e q t n × R e q t w × d u r a t s × N R A s n p b s × u s g n ;   w W n N R p P ( b B ) ( s S )
Other Constraints:
R a t v × V a d d w p b s × V m a x p V A w p 1 b s ;   w o v p > 1 ( b B ) ( s S )
R a t r × R a d d w p b s × V m a x p R U A w ( p 1 ) b s ;   w o r p > 1 ( b B ) ( s S )
w W b B V E x p w b T C w B u d g e t
V T r w p b b s = 0         w W , p P , b B , s S
R U T r w p b b s = 0       w W p P , b B , s S
V T r w p b b s = 0     w W ,   p = 1 , b , b B s S
Binary and positive variables:
V E x p w b , R U T r w p b b s , V a d d w p b s , R a d d w p b s , M R r b , M N R n b , R A r p b s , A R R r p b s , A N R R n p b s , N R A s n p b s , N R A v n p b s , R U D r p b s , N R U D n p b s 0   a n d   i n t e g e r
U D w p b s , R U A w p b s , V A w p b s , V T r w p b b , R T r r p b b s 0
As a first-stage decision, regardless of the scenarios, the number of expected volunteers that need training and the number of resources that should be pre-positioned in the regions to meet the RR and NRR demand for the first period of the disaster are decided. As a second-stage decision, after the disaster occurs, the levels of interregional resource transfer and additional resource allocation to the regions are chosen according to the needs of the regions. The first objective function (1a) aims to minimize the unmet demand (man-hour), which is a non-negative variable that describes the demand that cannot be met by the total working hours of volunteers (volunteer pool and additional required volunteers) and rescue units. For a better understanding of the equation, the unmet demand calculation for the first period and the following periods are expressed separately.
In Equation (1a), the V p w p b parameter represents the number of volunteers already trained in profession (w) to be deployed in disaster region (b) in period (p), and VExpwb is the decision variable for the number of volunteers to be trained before the disaster. So, the total number of available and to be trained volunteers is multiplied with the maximum number of work hours of a volunteer in period (p) (Vmaxp) to find the total volunteer workforce capacity. In addition, R U m a x p , representing the allowed working hours for rescue units in period (p), is multiplied with the R U w p , namely the rescue unit (people) with profession (w) to be deployed in period (p), which yields the total available official rescue units’ hourly capacity. The total volunteer and rescue units’ available capacity is subtracted from the total workforce demand (Dwpbs) to find the unmet workforce demand (in hours) in the first period, according to the scenario (s), in the first term. The second term in this objective is the unmet demand in the following periods according to each scenario, which is computed in constraint 2. Both terms are multiplied with a penalty value for each period.
Since the urgency level of the tasks are different, penalty costs are applied such that the unmet demand coming from more important tasks in different periods are assigned higher penalty values. The second objective function (1b) minimizes the number of human resources and RR transfers between regions. As for the third objective function (1c), the total unmet demand for material resources (RRs and NRRs) is minimized.
Constraint 2 demonstrates that the total unmet demand equals the required demand minus the volunteer and rescue units assigned for the first period. Constraint 3 states that the total unmet demand after the first period can be determined by subtracting the human resource assigned in that period from the sum of the total demand for that period and the unmet demand from the previous period. Constraint 4 demonstrates that the total assignable workforce for volunteers in the first period is equal to the total volunteer number in the volunteer pool (volunteers that are already trained) and expected volunteers (first-stage decision variable), multiplied by the time allowed for volunteers to work in the first period. Constraint 5, likewise, shows an assignable workforce for rescue units for the first period. Here, only the rescue units available before the disaster can be assigned.
Constraint 6 states that, starting from the second period, the total assignable workforce (in hours) for volunteers is determined by computing the workforce assigned to that region in the previous period multiplied by one minus the quitting ratio, plus the additional volunteers assigned to the region, plus the workforce transferred to that region from other regions, and minus the workforce transferred from that region. The time spent on the road from that region to other regions is also considered. This constraint also considers volunteers’ quitting behavior and maximum working hours. Similarly, constraint 7 shows the total assignable workforce provided for rescue units, following a similar calculation approach as constraint 6.
Constraint 8 ensures that the total number of RRs prepositioned to the regions is less than the initial number of RRs. Assigned RR numbers for the first period are calculated in constraint 9, while those from the second period are shown in constraint 10. Constraint 10 ensures that the RR number assigned in any period in a region (b) is smaller than the resources allocated in the previous period, plus any additional resources transferred to the region minus the resources transferred from that region.
Constraint 11 stipulates that the rescue teams and volunteers assigned to a disaster region must be at least as much as that needed by the renewable resources allocated to a region in a certain period. In other words, renewable resources are not assigned if no human workforce, including rescue units and volunteers, is assigned to a region in a period. Hence, simultaneous human and renewable resource (RR) assignment is attained. The utility of simultaneous assignment is that valuable human resources can exploit renewable resources (equipment, vehicles, etc.) to perform the tasks. The unmet RRs are calculated by subtracting the assigned number from the demand of the RRs in constraint 12.
The constraints used for NRRs are constraints 13–17. Constraint 13 ensures that the total number of NRRs prepositioned to the regions is less than the initial available number. Constraint 14 calculates the remaining available NRRs from the first period by subtracting the assigned ones from the total. In contrast, in constraint 15, the available number of NRRs after the first period is calculated by including additional assignments. The level of unmet NRR demand is shown in constraint 16, such that the assigned NRR number in each region is subtracted from that region’s demand.
By constraint 17, no more NRRs than the assigned human workforce can use for each period can be assigned because NRRs are used by human resources during tasks. In other words, if no human resource is assigned to a disaster region in a period, no NRRs are assigned there. Hence, the simultaneous NRR and human resource assignments are attained. The reason for simultaneous assignment is that valuable human resources can only exploit non-renewable resources, and the associated tasks can be performed. Therefore, this constraint stipulates the simultaneous assignment of human and NRR resources. For volunteers in constraint 18 and rescue units in constraint 19, the additional human workforce from outside the disaster area was ensured to be no more than the predetermined percentage of the workforce assigned in the previous period. This is due to security reasons and the intension to prevent the crowd in the disaster regions.
Constraint 20 aims to allow for the training of volunteers as much as the budget allows. It was stated that, in constraint 21 for volunteers and constraint 22 for rescue units, there was no labor transfer within the district in all periods. Constraint 23 prevents volunteer transfers in the first period since this resource is already assigned to that district. Constraints 24 and 25 are non-negativity and integer constraints.
To solve the multi-objective models, the ε-constraint method was developed that iteratively increases constraint bounds [50,51,52]. Later, Mavrotas [53] enhanced this using slack variables, and called it AUGMECON Algorithm. Mavrotas and Florios [54] further improved it to AUGMECON2 with small changes in the objective, which was employed in this study.

4. Case Study

We proposed a stochastic model and conducted a case study for the Kartal district of Istanbul. This is one of the most crowded districts of Istanbul, with nearly 470,000 inhabitants, 20 sub-districts (demand points), and 1 Disaster Management Center. Another reason for choosing the Kartal district is data availability. There are detailed studies dealing with the expected casualties and disaster scenarios in this district in case of a major Istanbul earthquake. The Earthquake Hazard and Risk Analysis report in Istanbul was created based on the Japan International Cooperation Agency (JICA) report [55] and the Possible Earthquake Loss Estimates Booklet prepared by Istanbul Metropolitan Municipality and Kandilli Observatory [56] for district-specific analyses and mappings. We utilized these reports to estimate the expected casualty numbers in different scenarios.

4.1. Data Collection for Expected Casualty Numbers and Scenarios

Multiple scenarios representing different disaster severity levels are considered in the model. The JICA [55] proposed four possible earthquake scenarios for Istanbul (Model A, B, C, and D). Five scenarios were generated from each of the main scenarios of JICA and twenty scenarios were obtained [57]. These are presented in Table 1.
The occurrence probabilities of the scenarios are assumed to change between 0.01 and 0.1, and scenarios that are most likely to occur in the main scenarios of JICA. While creating the scenarios, it was assumed that the situation worsened by 10% in each scenario starting from S1; that is, the expected number of casualties increased by 10%. In this study, we used the probabilistic link failure approach, considering the distance increase according to the damage rates of the roads. Table 1 provides the uniformly distributed travel time increase ratios for each scenario.
The distance between disaster regions was found using Google Maps by taking the shortest path. The traveling time model is formed based on Ambulance Travel Times [58]. For routes shorter than 4.13 km, the travel time duration is calculated by multiplying 2.42 ∗ d1/2, where d is the distance and m (d) is the ambulance’s traveling time. Interregional transfers (for volunteers and rescue units) are made at the beginning of each period. When the distance is greater than 4.13 km, it is equal to 2.46 + 0.596 ∗ d.
m d = 2.42 d   i f   d 4.13   k m ;     2.46 + 0.596 d   i f   d > 4.13   k m
The Turkish Statistical Institute provides the population in demand points. The JICA [55] and DEZIM [56] reports provide the casualty numbers. The casualty numbers are distributed across periods based on the rates provided in the study by Rawls and Turnquist [39], which outlines the demand occurrence rates for the first 72 h. The casualty emergence rates for 0–12 h, 12–24 h, 24–48 h, and 48–72 h are 0.6, 0.25, 0.10, and 0.05, respectively. This means that 60% of this region’s disaster victims can be reached in the first 12 h. This is presented in Table 2.

4.2. Data Collection for the Profession Requirements of the Tasks

Table 3 provides the requirements for volunteers, rescue units, and RRs and NRRs based on the task types. The table shows that some professions planned to be included in the study can only be operated by volunteers or rescue units, and both workforce types can operate some. For the people planning to participate in the teams formed for the model, the task profession requirement table was created based on the USAR medium and hard-level rescue teams from the INSARAG Guidelines [59]. To complete these tasks, a specified number of people from each profession must be present in the disaster area to form a team. Volunteers and rescue teams must work actively for several hours each period. Since the period lengths differ, the active working times allowed for the human resources also differ.
In the study, volunteers are assumed only to work as a team member in certain tasks and under the supervision of rescue units. While trained volunteers are already expected to receive pre-disaster security training, spontaneous volunteers are aimed to be assigned to lower-risk tasks. In addition, the number of volunteers assigned is limited, considering the safety of volunteers.
Volunteer levels are taken from the AFAD volunteer training program. In addition to the three-level training defined in the AFAD training program, the spontaneous volunteer level was added to the model. It is known that there are pre-determined volunteers in the disaster areas who have been planned to work in a certain period and region at the time of the disaster. Since the training time required for each volunteer level is different, the training costs of volunteers also vary according to their level of expertise. It is planned that these volunteers are transferred between regions if necessary or to accept additional volunteer support from outside of the disaster area.
Similar task assignment planning is adopted for rescue units. Unlike volunteers, the region to which rescue teams will be assigned is not determined in advance and will be assigned to the regions upon request. In the same way as volunteers, it is agreed that the optimal numbers of interregional transfers and additional rescue unit support will be assigned. Within the available budget, the aim is to increase the number of volunteers (expected volunteers) by providing pre-disaster training at the expense of a cost. The arrival times of rescue units and volunteers may vary for various reasons (such as road failures and psychological and physical problems). At the end of each period, quitting behavior may occur due to various reasons for both the volunteer and rescue units considered. This quitting rate is expected to be higher for volunteers as they work voluntarily. In line with the needs, interregional transfers are planned to start from the beginning of the second period.

5. Results and Discussion

In the following subsections, we present the results of the case study, perform a sensitivity analysis, and propose some managerial insights.

5.1. Results for the Case Study

The model has been solved in IBM CPLEX Optimization Studio 22.1.0. All computational work was performed on a 64-bit operating system, Intel Core™ i7-6500U 2.50 GHz CPU, and 8.00 GB RAM personal computer. Pareto optimal solutions of the proposed multi-objective model were obtained for the case study. CPU times for solutions range from 330 s to 1510 s. First, the model was solved for all three objectives separately, and the payoff table was constructed as shown in Table 4. Table 4 shows that if the unmet demand (z1) is minimized, its value will be 65,767.7. It indicates that 65,767.7 man*hour of unmet demand will arise even if minimized. The resource transfer (z2) will be 1165.7, and the unmet material resources (z3) will be 24,181.
On the other hand, if the z2 is minimized, z1 will be 2,058,460.3, z2 will be 0, and z3 will be 24,181. If the z3 is minimized, z1 will be 1,825,928.6, z2 will be 13,650, and z3 will be 14,654.5. Based on the payoff table, the ranges of the second and third objective functions are R2 = 17,128.2 and R3 = 14,654.5, respectively. Ranges are divided into 100 equal intervals (q). The AUGMECON2 process for all grid points is as follows [53,54]:
For i = 0–100;
E3 = 9526.5 + i × 146.5;
For j = 0–100;
E2 = 0 + j × 171.3;
Solve model;
Next j;
Next i.
Subsequently, constraints for the second and third objectives were added to the model, with the right-hand sides of these constraints (e2, e3) changing at each iteration. This approach yielded pareto optimal solutions across 100 grid points. The decision maker selects one of these solutions (trade-offs) based on priorities and makes decisions accordingly. In our pareto optimal solutions, after a point, any worsening of other objective functions will not improve objective 1. We evaluated the pareto optimal solutions and choose Experiment 3 where z1 = 114,842.5, z2 = 514, and z3 = 9966, since the primary purpose of disaster management is to save as many people as possible and respond to the victims’ needs as quickly as possible. Since it was observed that the objective function did not change with the improvements made in (z2), the model was run again assuming z2 = 100, z1 = 114,840.7, and z3 = 9966. According to the results obtained for Experiment 3, the number of transferred resources (z2) slightly affects the number of unmet material resources (z3). The unmet demand in each region is very high, and resource transfers (z2) have little effect on the total unmet human (z1) and material resources (z3) demand. According to the findings, most unmet demand occurs in the first period. While unmet human demand originates mainly from the first, second, and fourth professions, namely team commander, search and rescue officer, and equipment manager, it is naturally high in all resources in the worst-case scenarios S20 and S19. Although resources are abundant in some occupations, task groups still need to be completed, and demand needs to be met due to these deficiencies. After the first period, unmet demand decreases with interregional transfers and additional resources. Table 5 shows the results of unmet demands for the 1st period, which constitutes most of the unmet demands, and for the 20th and 19th scenarios, which represent the most pessimistic values, on a regional basis.
The results reveal that, despite minor variations, unmet demands exhibit significant parallels across regions. This highlights the necessity for synchronized resource utilization and indicates that, in some instances, an abundance of specific resources may still be ineffective if there are shortages in others. For example, in region 1, in the first period, the human resources with professions 1, 2, and 4, renewable resources (ambulances), and non-renewable resources are insufficient in both scenarios. In region 2, human resources for professions 1, 2, 3, and 4 are inadequate and renewable and non-renewable resources are lacking. The similar situation is also valid for the regions 11, 14, 15, 17, and 19. Human resources with the required professions are available in the rest of the regions in the first period, but renewable or non-renewable resources are lacking. However, after the first period, unmet demand decreases with interregional transfers and additional resources
Table 6 shows how resource assignments for RRs and NRRs will be pre-positioned in each region at the beginning of the first period. It has been observed that there is no direct relationship between material resource distribution and neighborhood population, but there is a relationship with the casualty numbers. Moreover, it can be deduced that assignments are parallel with allocating the human resources needed to utilize them.
Table 7 shows the number of volunteers expected to be trained from each profession before the earthquake, in addition to the existing volunteers, based on the budget allocated for volunteer training. Volunteers are expected to be trained in various numbers in different regions, mainly from the second (search rescue officer) and eighth (support staff) profession. Red Cross and Red Crescent societies also suggested that public media campaigns must be held before the disasters [60] to encourage people to become volunteers and to train them in advance. The guideline of the organizations [60] stipulate that a limit must be set for the volunteering hours considering the disaster conditions and legislations, psychosocial support must be provided to the volunteers in emergencies, spontaneous volunteers must be applied orientation and training, and these must be registered and screened. These measures must be taken to better manage the volunteers in disaster environments.
The most significant additional resource requirements for the scenarios are reported in Table 8. As seen in Table 8, additional supports are spread over different regions and periods for each resource type. For example, the extra human resources for the search and rescue officer, profession 2, equals 22 people for the second region in the second period. In addition, 55 additional search and rescue volunteers are required for the second period of the 19th region. Additional ambulance and medical kits required are also denoted in this table. According to this table, the command center may request additional resources from governmental or non-governmental organizations.
Table A1 in the Appendix A presents the transfers of the volunteers, rescue units, and renewable resources starting from the second period. At each row, the number of resources transferred from a region to another region according to each scenario in a certain period is reported. For instance, 94 working hours of spontaneous volunteers (profession 8) should be transferred from region 1 to 16 in the second period, according to scenario 16.
Considering the concentrated demand in the first period, the model is sensitive to the emerging casualty number parameter. The model is also susceptible to task requirements and working time parameters, which impact the determination of human and other resource demands. The penalty cost for not meeting the RR was chosen considering that the ambulance in our case study has priority over the NRR medical kit. In our case, since an ambulance is required to use the medical kit, the penalty cost was decided to give priority to meeting the ambulance needs first. With the changes that can be made to the parameter, the priorities of the resources relative to each other can be determined.
Since our model covers only one district of Istanbul and the routes to be traveled are short, it has been observed that the time spent on the road during transfers and the damages that may occur do not significantly impact the model regarding assignable resources. However, as the transportation times will be stochastic in a disaster environment, variability in this parameter may significantly affect the results in different disaster settings.
Although the Kartal district was selected as the region in this study, the proposed model is applicable for other crowded districts and even all of Istanbul. Therefore, it is scalable. However, when large data sets such as all districts of Istanbul are considered, the mathematical model may not be solved by using a standard solver in a reasonable computational time, as it is a mixed-integer stochastic programming model. In larger cases, multi-objective meta-heuristic algorithms, such as the Non-Deterministic Sorting Genetic Algorithm (NSGA-II) [61] or a Reference Vector Guided Multi-Objective Evolutionary Algorithm [62], should be employed.
In addition, when the type of disaster changes, the tasks may also change and the types and amount of resources needed may change accordingly. For example, search and rescue tasks in the case of a flood and an earthquake probably require different resources, but even if the type and amounts of the required resources change, our mathematical model is still applicable, as it is flexible to be adapted to different disasters and associated tasks.

5.2. Sensitivity Analysis

As the model results may change according to the parameters, a sensitivity analysis based on the scenario probabilities and the penalty values in the first objective function are made separately. In the sensitivity analysis, the penalty values in the first objective function were all assumed to be equal to one. Hence, differences among the weights of different decision variables are neutralized. In addition, to understand the impact of the scenario probabilities, by retaining the original penalty values, the probabilities of the scenarios were changed as shown in Table 9. Here, the bad scenarios were given higher probabilities to see the impact of this parameter on the results.
The objective function results obtained for the two cases of sensitivity analyses are presented in Table 10. The results imply that changes in the penalty values affected the values of the first objective, as these parameters are the multipliers in the objective. For the sensitivity analysis based on the scenario probabilities, we may conclude that the total expected unmet human resource demand increased. However, as the scenario probabilities are the multipliers of objective function 1, to better understand this change, the decision variables of unmet human resource demand should be further analyzed.
The results of the decision variable of the unmet human resources demand in the original model and those results obtained by equalizing all penalties into one are presented in Table 11 below. Here, the highest 16 values among all results of the unmet human resource demand for all regions, scenarios, and periods are reported, and the rest of the less significant values were not presented. When the values in the columns named “Original” and “Penalty Sensitivity” are compared, out of the sixteen values, seven values did not change, six of them decreased, and five of them slightly increased. The unmet demand values that did not change or slightly increased (12 values out of 16) after the penalty values changed belong to scenarios 19 and 20, which are the worst scenarios. This was because the human resources were insufficient and better results could not be achieved. In addition, some of the variable values decreased only around 20%. In terms of the second and third objectives, penalty values did not cause any change, as seen in Table 10. Consequently, the model is not sensitive to penalty value changes.
In addition, as seen in Table 9, the probabilities of the relatively bad scenarios, numbered 14–20, increased from 24% to 53%, respectively, and this caused the total unmet human resource demand (Objective 1) to increase, as shown in Table 10. When we analyze the impact of changes in the scenario probabilities on the unmet human resource demand, in Table 11, it may be concluded that the increase in the scenario probabilities of the bad scenarios resulted in no change or very little increases in the decision variables. However, due to the scenario probabilities’ increase, the first objective function value increased from 114,840 to 279,913. In terms of the second objective, the penalty value change had no impact. However, the third objective (expected material resource unmet demand) doubled. This is because of the increase in the bad scenarios’ probability increases, as explained above. Since in bad scenarios, the unmet material demand is higher than the other scenarios values, giving higher probability to them caused a higher expected total unmet material demand. The non-renewable resource demand did not change at all, but the renewable resources demand changed slightly. The highest renewable resource unmet demand values in all regions, scenarios, and periods for the sensitivity analysis are presented in the Appendix A in Table A2. One can see that the unmet demand values did not experience any significant change in cases of penalty value changes or scenario probability changes. Consequently, the model is also robust the changes in the scenario probabilities.

5.3. Managerial Implications and Insights

The findings provide valuable information to the Disaster and Emergency Management Presidencies responsible for human resource planning and coordination in disasters. These will also give regional authorities ideas about storing the necessary resources in advance and delivering them to the regions in need after the disaster.
This study can help organizations better allocate resources and plan volunteer recruitment efforts to address service gaps. By identifying trends in volunteer qualification requirements, NGOs can ensure they have the right skills and expertise to meet post-disaster needs. Some academic and managerial implications arising from this study are as follows:
  • Integrated decisions for pre- and post-disaster stages are crucial for potential disaster scenarios, as they help determine the expected resource requirements. Improper pre-disaster decision-making will affect post-earthquake decisions, leading to a shortfall in meeting demand.
  • Developing a dynamic resource allocation software that uses our model would be beneficial to disaster management agencies and policymakers. The proposed mathematical model can be embedded into an API (Application Programming Interface), which is a software intermediary that allows us to extract and share data within and across organizations.
  • Volunteers are a crucial part of the workforce in disaster response. Therefore, governmental and non-governmental organizations must encourage and support volunteer training.
  • While the first 72 h are critical in disaster response, our model results show that most unmet demands occur in the first 12 h. Given the high rate of deterioration in the injured condition during this time, more preliminary preparation is needed for effective pre-disaster resource planning.
  • As the model’s results show, the lack of even one resource will prevent the completion of a task. Therefore, an information system that dynamically transmits the number of available resources in the regions to the command center will be highly beneficial for facilitating the management of the process with optimum resources by preventing excess resources from coming into the disaster regions. This requires pre-disaster planning for accurate data flow from disaster areas to the command center to convey information about the current situation.
  • To ensure coordination, especially regarding material resources, their distribution should be planned regionally, and local authorities should be informed in advance.

6. Conclusions

Each disaster situation has its specific resource requirements and structure. The number of casualties, injuries, financial needs, and aid requirements vary depending on the magnitude and type of disaster. In all disasters, pre-disaster resource planning, including material resource prepositioning, volunteer people’s training, and post-disaster resource assignment and transfers, are vital coordination activities for disaster preparedness. Without any of the required resources, the tasks cannot be fulfilled. Volunteers are usually the initial responders to disasters; their contribution is imperative.
This study proposed a multi-objective, two-stage stochastic programming model for dynamic resource planning and allocation, including volunteers, rescue units, and renewable and non-renewable resource requirements, especially for the search and rescue and first aid activities. Its first objective aims to minimize the unmet human resource demand using existing government rescue units, volunteers, and additional human resources. As a second objective, the resources were intended to be utilized efficiently by considering trade-offs between transferring the resources between regions and employing an additional human workforce. In addition, as the third objective, the total unmet demand for renewable and non-renewable resources is minimized. The decisions pertain to pre-disaster volunteer training, prepositioned renewable and non-renewable resources, disaster response, the assignment of the volunteers, rescue units, renewable and non-renewable resources, and their transfers between the regions. Here, the assignment of all human and material resources is simultaneously planned, as a lack of any resources disrupts the tasks.
To reveal the utility of the proposed model, a real case study was conducted to decide and assess resource allocation after the expected significant earthquake in the Kartal district of Istanbul. Demand assessments were made based on the official reports, considering the number of buildings expected to be damaged or destroyed and the number of victims expected to suffer minor or severe injuries. The multi-objective model was solved for the case study with the AUGMECON2 algorithm, the pareto optimal solutions were obtained, and the results were analyzed. As a result, some managerial insights for the resource allocation planning of human and material resources are presented.
This study is the first in the literature to consider volunteers’ training and assignment in disaster response teams besides the official rescue staff. It plans all required renewable, non-renewable, and human resource pre- and post-disaster allocation and transfers. The real case study also revealed its rigor. Our model helps address the issue of people struggling to find the right teams, necessary materials, and vehicles for help after a disaster, ultimately reducing the delay in providing aid. Therefore, our methodology can be utilized by disaster coordination agencies to effectively coordinate and manage resources, including mobilizing volunteers, in the crucial early hours.
This study focused on earthquake disasters. Future studies can focus on resource allocation for other disasters that affect societies. In addition, tasks other than search and rescue and first aid for the victims can be concentrated in the future. Although we have applied the model for the first 72 h, periods covering a more extended time interval can be considered to manage the resource allocation problem for the recovery period.
Moreover, the proposed mathematical model can be embedded into an API (Application Programming Interface), which is a software intermediary that allows us to extract and share data within and across organizations. As the disaster management requires multiple parties to collaborate, including governmental and non-governmental organizations, input data collection, decision-making, and output data transmission related to the decisions by means of this API will be beneficial for resource allocation in future disasters.

Author Contributions

Conceptualization, S.I.S. and E.N.K.; methodology, S.I.S. and E.N.K.; software, E.N.K.; validation, E.N.K. and S.I.S.; formal analysis, E.N.K. and S.I.S.; investigation, E.N.K. and S.I.S.; resources, S.I.S.; data curation, E.N.K.; writing—original draft preparation, E.N.K.; writing—review and editing, E.N.K. and S.I.S.; visualization, E.N.K.; supervision, S.I.S.; project administration, S.I.S. All authors have read and agreed to the published version of the manuscript.

Funding

This research received no external funding.

Data Availability Statement

The original data presented in this study are openly available in [57].

Conflicts of Interest

The authors declare no conflict of interest.

Appendix A

Table A1. Volunteers, rescue units, and renewable resource transfers.
Volunteer TransferRescue Unit TransferRenewable Resource Transfer
ProfessionPeriodScenarioRegionRegionValueProfessionPeriodScenarioRegionRegionValuePeriodScenarioRegionRegionValue
8220116944220487100000
8220121678.4232020131900000
8220517822202151500000
23203157.622192151500000
232051436.4621921151500000
63204218.162202151400000
231432027.5232010141300000
2420187142201531100000
Table A2. Unmet renewable resource demand values in the sensitivity analysis.
Period Scenario Region OriginalPenalty Values SensitivityScenario Probability Sensitivity
12019303032
12014293029
11919262628
12017252525
11914242524
11917222222
11819222224
1202212120
11814212221
12015191919
11817191919

References

  1. IFRC. Hazards Everywhere. Available online: https://www.ifrc.org/sites/default/files/2021-09/20201113_WorldDisasters_2.pdf (accessed on 10 December 2022).
  2. AFAD. Available online: https://www.afad.gov.tr/duyurular (accessed on 14 April 2023).
  3. IBB-KRDAE. Possible Earthquake Loss Estimate Booklets. 2020. Available online: https://depremzemin.ibb.istanbul/en/istanbul-earthquake-workshop-december-2019/ (accessed on 13 June 2023).
  4. Falasca, M.; Zobel, C.W.; Fetter, G.M. An optimization model for humanitarian relief volunteer management. In Proceedings of the 6th International ISCRAM Conference, Gothenburg, Sweden, 10–13 May 2009. [Google Scholar]
  5. Beamon, B.M.; Balcik, B. Performance measurement in humanitarian relief chains. Int. J. Public Sect. Manag. 2008, 21, 4–25. [Google Scholar] [CrossRef]
  6. Pradhananga, R.; Mutlu, F.; Pokharel, S.; Holguín-Veras, J.; Seth, D. An integrated resource allocation and distribution model for pre-disaster planning. Comput. Ind. Eng. 2016, 91, 229–238. [Google Scholar] [CrossRef]
  7. FEMA. Available online: https://www.fema.gov/sites/default/files/2020-07/fema_ESF_9_Search-Rescue.pdf (accessed on 11 October 2024).
  8. Shin, S.; Kleiner, B.H. How to manage unpaid volunteers in organisations. Manag. Res. News 2003, 26, 63–71. [Google Scholar] [CrossRef]
  9. Dubey, R.; Altay, N.; Blome, C. Swift trust and commitment: The missing links for humanitarian supply chain coordination. Ann. Oper. Res. 2019, 283, 159–177. [Google Scholar] [CrossRef]
  10. AmeriCorps. Volunteering and Civic Life in America Research Summary. Available online: https://americorps.gov/sites/default/files/document/volunteering-civic-life-america-research-summary.pdf (accessed on 11 October 2024).
  11. Garcia, C.; Rabadi, G.; Handy, F. Dynamic resource allocation and coordination for high-load crisis volunteer management. J. Humanit. Logist. Supply Chain Manag. 2018, 8, 533–556. [Google Scholar] [CrossRef]
  12. Sperling, M.; Schryen, G. Decision support for disaster relief: Coordinating spontaneous volunteers. Eur. J. Oper. Res. 2022, 299, 690–705. [Google Scholar] [CrossRef]
  13. Abualkhair, H.; Lodree, E.J.; Davis, L.B. Managing volunteer convergence at disaster relief centers. Int. J. Prod. Econ. 2019, 220, 107399. [Google Scholar] [CrossRef]
  14. Lassiter, K.; Khademi, A.; Taaffe, K.M. A robust optimization approach to volunteer management in humanitarian crises. Int. J. Prod. Econ. 2015, 163, 97–111. [Google Scholar] [CrossRef]
  15. Al Theeb, N.; Murray, C. Vehicle routing and resource distribution in postdisaster humanitarian relief operations. Int. Trans. Oper. Res. 2017, 24, 1253–1284. [Google Scholar] [CrossRef]
  16. Ghaffari, Z.; Nasiri, M.M.; Bozorgi-Amiri, A.; Rahbari, A. Emergency supply chain scheduling problem with multiple resources in disaster relief operations. Transp. A Transp. Sci. 2020, 16, 930–956. [Google Scholar] [CrossRef]
  17. Altay, N.; Green, W.G., III. OR/MS research in disaster operations management. Eur. J. Oper. Res. 2006, 175, 475–493. [Google Scholar] [CrossRef]
  18. Galindo, G.; Batta, R. Review of recent developments in OR/MS research in disaster operations management. Eur. J. Oper. Res. 2013, 230, 201–211. [Google Scholar] [CrossRef]
  19. Behl, A.; Dutta, P. Humanitarian supply chain management: A thematic literature review and future research directions. Ann. Oper. Res. 2019, 283, 1001–1044. [Google Scholar] [CrossRef]
  20. Jabbour, C.J.; Sobreiro, V.A.; Lopes de Sousa Jabbour, A.B.; de Souza Campos, L.M.; Mariano, E.B.; Renwick, D.W.S. An analysis of the literature on humanitarian logistics and supply chain management: Paving the way for future studies. Ann. Oper. Res 2019, 283, 289–307. [Google Scholar] [CrossRef]
  21. Diaz, R.; Behr, J.G.; Acero, B. Coastal housing recovery in a postdisaster environment: A supply chain perspective. Int. J. Prod. Econ. 2022, 247, 108463. [Google Scholar] [CrossRef]
  22. Falasca, M.; Zobel, C. An optimization model for volunteer assignments in humanitarian organizations. Socio-Econ. Plan. Sci. 2012, 46, 250–260. [Google Scholar] [CrossRef]
  23. Mayorga, M.E.; Lodree, E.J.; Wolczynski, J. The optimal assignment of spontaneous volunteers. J. Oper. Res. Soc. 2017, 68, 1106–1116. [Google Scholar] [CrossRef]
  24. Chen, S.Q.; Wang, Y.M.; Shi, H.L.; Zhang, X.X. A decision-making method for uncertain matching between volunteer teams and rescue tasks. Int. J. Disaster Risk Sci. 2021, 58, 102138. [Google Scholar] [CrossRef]
  25. Chen, L.; Miller-Hooks, E. Optimal team deployment in urban search and rescue. Transp. Res. B Methodol. 2012, 46, 984–999. [Google Scholar] [CrossRef]
  26. Zhang, S.; Guo, H.; Zhu, K.; Yu, S.; Li, J. Multistage assignment optimization for emergency rescue teams in the disaster chain. Knowl.-Based Syst. 2017, 137, 123–137. [Google Scholar] [CrossRef]
  27. Wex, F.; Schryen, G.; Feuerriegel, S.; Neumann, D. Emergency response in natural disaster management: Allocation and scheduling of rescue units. Eur. J. Oper. Res. 2014, 235, 697–708. [Google Scholar] [CrossRef]
  28. Nayeri, S.; Sazvar, Z.; Heydari, J. A fuzzy robust planning model in the disaster management response phase under precedence constraints. Oper. Res. 2022, 22, 3571–3605. [Google Scholar] [CrossRef]
  29. Nayeri, S.; Asadi-Gangraj, E.; Emami, S. Goal programming-based post-disaster decision making for allocation and scheduling the rescue units in natural disasters with time-window. Int. J. Ind. Eng. Prod. Res. 2018, 29, 65–78. [Google Scholar]
  30. Rodríguez-Espíndola, O.; Albores, P.; Brewster, C. Disaster preparedness in humanitarian logistics: A collaborative approach for resource management in floods. Eur. J. Oper. Res. 2018, 264, 978–993. [Google Scholar] [CrossRef]
  31. Shin, Y.; Kim, S.; Moon, I. Integrated optimal scheduling of repair crew and relief vehicle after disaster. Comput. Oper. Res. 2019, 105, 237–247. [Google Scholar] [CrossRef]
  32. Sarma, D.; Bera, U.K.; Das, A. A mathematical model for resource allocation in emergency situations with the co-operation of NGOs under uncertainty. Comput. Ind. Eng. 2019, 137, 106000. [Google Scholar] [CrossRef]
  33. Li, M.Y.; Zhao, X.J.; Fan, Z.P.; Cao, P.P.; Qu, X.N. A model for assignment of rescuers considering multiple disaster areas. Int. J. Disaster Risk Reduct. 2019, 38, 101201. [Google Scholar] [CrossRef]
  34. Rauchecker, G.; Schryen, G. An exact branch-and-price algorithm for scheduling rescue units during disaster response. Eur. J. Oper. Res. 2019, 272, 352–363. [Google Scholar] [CrossRef]
  35. Caglayan, N.; Satoglu, S.I. Multi-Objective Two-Stage Stochastic Programming Model for a Proposed Casualty Transportation System in Large-Scale Disasters: A Case Study. Mathematics 2021, 9, 316. [Google Scholar] [CrossRef]
  36. Oksuz, M.K.; Satoglu, S.I. Integrated optimization of facility location, casualty allocation and medical staff planning for post-disaster emergency response. J. Humanit. Logist. Supply Chain Manag. 2023, 14, 285–303. [Google Scholar] [CrossRef]
  37. Balcik, B.; Bozkir, C.D.C.; Kundakcioglu, O.E. A literature review on inventory management in humanitarian supply chains. Surv. Oper. Res. Manag. Sci. 2016, 21, 101–116. [Google Scholar] [CrossRef]
  38. Tzeng, G.H.; Cheng, H.J.; Huang, T.D. Multi-objective optimal planning for designing relief delivery systems. Transp. Res. E Logist. Transp. Rev. 2007, 43, 673–686. [Google Scholar] [CrossRef]
  39. Rawls, C.G.; Turnquist, M.A. Pre-positioning planning for emergency response with service quality constraints. OR Spectr. 2011, 33, 481–498. [Google Scholar] [CrossRef]
  40. Rezaei-Malek, M.; Tavakkoli-Moghaddam, R.; Zahiri, B.; Bozorgi-Amiri, A. An interactive approach for designing a robust disaster relief logistics network with perishable commodities. Comput. Ind. Eng. 2016, 94, 201–215. [Google Scholar] [CrossRef]
  41. Yu, L.; Zhang, C.; Yang, H.; Miao, L. Novel methods for resource allocation in humanitarian logistics considering human suffering. Comput. Ind. Eng. 2018, 119, 1–20. [Google Scholar] [CrossRef]
  42. Rodríguez-Espíndola, O.; Albores, P.; Brewster, C. Dynamic formulation for humanitarian response operations incorporating multiple organisations. Int. J. Prod. Econ 2018, 204, 83–98. [Google Scholar] [CrossRef]
  43. Sabouhi, F.; Bozorgi-Amiri, A.; Moshref-Javadi, M.; Heydari, M. An integrated routing and scheduling model for evacuation and commodity distribution in large-scale disaster relief operations: A case study. Ann. Oper. Res. 2019, 283, 643–677. [Google Scholar] [CrossRef]
  44. Ghasemi, P.; Khalili-Damghani, K.; Hafezalkotob, A.; Raissi, S. Uncertain multi-objective multi-commodity multi-period multi-vehicle location-allocation model for earthquake evacuation planning. Appl. Math. Comput. 2019, 350, 105–132. [Google Scholar] [CrossRef]
  45. Shao, J.; Liang, C.; Wang, X.; Wang, X.; Liang, L. Relief demand calculation in humanitarian logistics using material classification. Int. J. Environ. Res. Public Health 2020, 17, 582. [Google Scholar] [CrossRef]
  46. Shaw, L.; Das, S.K.; Roy, S.K. Location-allocation problem for resource distribution under uncertainty in disaster relief operations. Socio-Econ. Plan. Sci. 2022, 82, 101232. [Google Scholar] [CrossRef]
  47. Das, S.K.; Vincent, F.Y.; Roy, S.K.; Weber, G.W. Location–allocation problem for green efficient two-stage vehicle-based logistics system: A type-2 neutrosophic multi-objective modeling approach. Expert Syst. Appl. 2024, 238, 122174. [Google Scholar] [CrossRef]
  48. Liang, L.; Wang, X.; Gao, J. An option contract pricing model of relief material supply chain. Omega 2012, 40, 594–600. [Google Scholar] [CrossRef]
  49. Yao, X.; Huang, R.; Song, M.; Mishra, N. Pre-positioning inventory and service outsourcing of relief material supply chain. Int. J. Prod. Res. 2018, 56, 6859–6871. [Google Scholar] [CrossRef]
  50. Torabi, S.A.; Hamedi, M.; Ashayeri, J. A Multi-Objective Optimization Approach for Multi-Head Beam-Type Placement Machines; CentER Discussion Paper; Tilburg Operations Research: Tilburg, The Netherlands, 2010; Volume 2010-128. [Google Scholar]
  51. Zhang, W.; Reimann, M. A simple augmented ε-constraint method for multi-objective mathematical integer programming problems. Eur. J. Oper. Res. 2014, 234, 15–24. [Google Scholar] [CrossRef]
  52. Laumanns, M.; Thiele, L.; Zitzler, E. An efficient, adaptive parameter variation scheme for metaheuristics based on the epsilon-constraint method. Eur. J. Oper. Res. 2006, 169, 932–942. [Google Scholar] [CrossRef]
  53. Mavrotas, G. Effective implementation of the ε-constraint method in multi-objective mathematical programming problems. Appl. Math. Comput. 2009, 213, 455–465. [Google Scholar] [CrossRef]
  54. Mavrotas, G.; Florios, K. An improved version of the augmented s-constraint method (AUGMECON2) for finding the exact Pareto set in multi-objective integer programming problems. Appl. Math. Comput. 2013, 219, 9652–9669. [Google Scholar] [CrossRef]
  55. JICA. The Study on a Disaster Prevention/Mitigation Basic Plan in Istanbul Including Seismic Microzonation in the Republic of Turkey; Final Report; Japan International Cooperation Agency: Tokyo, Japan, 2002; Volume II.
  56. Possible Earthquake Loss Estimates Booklet. Available online: https://depremzemin.ibb.istanbul/uploads/prefix-kartal-666ad5f5b8329.pdf (accessed on 3 September 2023).
  57. Oksuz, M.K.; Satoglu, S.I. A two-stage stochastic model for location planning of temporary medical centers for disaster response. Int. J. Disaster Risk Reduct. 2020, 44, 101426. [Google Scholar] [CrossRef]
  58. Budge, S.; Armann, I.; Dawit, Z. Empirical analysis of ambulance travel times: The case of Calgary emergency medical services. Manag. Sci. 2010, 56, 716–723. [Google Scholar] [CrossRef]
  59. INSARAG Guidelines. Available online: https://www.insarag.org/methodology/insarag-guidelines/ (accessed on 10 September 2022).
  60. International Federation of Red Cross and Red Crescent Societies, 2012. Volunteering in Emergencies: Practical Guidelines for Red Cross and Red Crescent Societies Managing Volunteers in Emergency Situations. Available online: https://volunteeringredcross.org/wp-content/uploads/2019/02/Volunteering-in-emergencies-LR.pdf (accessed on 20 February 2025).
  61. Deb, K.; Pratap, A.; Agarwal, S.; Meyarivan, T.A.M.T. A fast and elitist multiobjective genetic algorithm: NSGA-II. IEEE Trans. Evol. Comput. 2002, 6, 182–197. [Google Scholar] [CrossRef]
  62. Cheng, R.; Jin, Y.; Olhofer, M.; Sendhoff, B. A reference vector guided evolutionary algorithm for many-objective optimization. IEEE Trans. Evol. Comput. 2016, 20, 773–791. [Google Scholar] [CrossRef]
Figure 1. Pre-disaster and Post-disaster demands and resource requirements.
Logistics 09 00041 g001
Figure 2. Search and rescue and first aid tasks required after an earthquake.
Logistics 09 00041 g002
Table 1. The magnitudes, probabilities, damage/casualties’ multiplier ratios, and travel time increase ratios associated with each disaster scenario.
ScenariosMagnitude of
Earthquake
Occurrence
Probability
Casualties Multiplier
Ratio
Travel Time Increase
Ratio
S16.90.110.27
S26.90.081.10.18
S36.90.071.20.25
S46.90.091.30.2
S56.90.051.50.09
S67.40.071.60.21
S77.40.041.80.21
S87.40.061.90.21
S97.40.032.10.24
S107.40.022.40.14
S117.50.052.60.19
S127.50.042.90.1
S137.50.063.10.3
S147.50.033.50.11
S157.50.043.80.16
S167.90.054.20.13
S177.90.064.60.26
S187.90.025.10.11
S197.90.035.60.23
S207.90.016.10.13
Table 2. Expected casualty number for base case scenario (Scenario-1).
Period1Period2Period3Period4Total
Tasks0–12 h12–24 h24–48 h48–72 h72 h
Casualty Emergence Rate
60%25%10%5%100%
Expected Casualty Number
S1—Casualties rescued from surface605252101501008
S2—Casualties rescued from debris4681957839780
S3—Casualties dispatched to safe zone15006252501252500
S4—Death casualties10644189176
S5—Triaged casualties1073447179891788
T1—Minimal casualties first aid689287115571148
T2—Delayed casualties first aid3321385528553
T3—Immediate casualties first aid52229487
Table 3. Task/profession requirement table.
Human Resource Requirements of TasksMaterial Resource
Requirements of Tasks
Profession12345678Renewable ResourcesNon-Renewable Resources
Rescue UnitTeam CommanderSearch and Rescue OfficerCommunication OfficerEquipment ManagerDoctorParamedicsAmbulance Driver
Volunteer Search and Rescue Volunteer Professional Healthcare VolunteerFirst Aid Volunteer Spontaneous Volunteer (Support staff)
S1—Rescue from Surface1211000100
S2—Rescue from Debris1311000100
S3—Dispatch to Safe Zone0000000100
S4—Death Removal1201000100
S5—Triage0000010000
T1—Minimal Casualties First Aid0000010101
T2—Delayed Casualties First Aid0000111111
T3—Immediate Casualties First Aid0000111011
Table 4. Payoff table.
Minimized Objective Functionz1z2z3
Min Z1 (Unmet human resource, man-hour)114,367.017,128.224,181.0
Min Z2 (Resource transfer, unit)2,058,460.30.024,181.0
Min Z3 (Unmet material resource, unit)1,825,928.613,650.09526.5
Range (Max–Min) 17,128.214,654.5
Table 5. Unmet demand in the first period for scenario 20 (a) and scenario 19 (b).
20 19
RegionProfessionHuman Resource Unmet Demand (man-hour)NRR Unmet Demand (unit)RR Unmet Demand (unit)ProfessionHuman Resource Unmet Demand (man-hour)NRR Unmet Demand (unit)RRU Unmet Demand (unit)
12583269154477
1477
2271636721461237518
4716 1612
1716 2564
3500
3461535417453228815
1615 1532
4 25714 23112
5 23213 20511
6 14710 1308
7 25515 22813
81650366 456134616
1561
3448
2489
9 1547 1386
10 22113 19611
1146873261745913351
1687 1591
2562 2610
3464
12 23913 21311
13
 
14
2702249144443722312
493551329443045824
1935 1430
3775
2719
8601
15294635319460631318
4706 1606
358 2542
3481
16454734717447231516
1547 1472
17171546625254149924
4886 3606
2828
3709
18 18710 1678
192115756130495050026
41098 1950
11098 3798
3921 2699
20 330217 27015
Table 6. Prepositioned renewable and non-renewable resources before disaster.
Region1234567891011121314151617181920
Prepositioned Renewable Resource Amount
(Ambulances)
33332233223235335253
Prepositioned Non-Renewable Resource Amount
(Medical kits)
19321319616715710716421490143214172162341209194338119410197
Table 7. Required number of trained volunteers before the disaster.
Regions
Professions1234567891011121314151617181920
Search and Rescue Officer (Search and Rescue Volunteer)4766542526103558218562896423427909012
Doctor (Professional Healthcare Volunteer)00000000000000000000
Paramedics (First Aid Volunteer)702600580280312963000
Support Staff (Spontaneous Volunteer)42665133335345832261333685653295312741
Table 8. Additional resources needed out of the disaster regions.
Additional Rescue UnitsAdditional VolunteersAdditional RR (Ambulance)Additional NRR (Medical Kit)
ProfessionPeriodScenarioRegionValueProfessionPeriodScenarioRegionValuePeriodScenarioRegionValuePeriodScenarioRegionValue
42204182220194232072522019410
3220171622191942319142521919410
222017142218194241962521819410
221815132320330417202521719410
2217151322201430416102521619410
3218171222191430213142121914341
232015122218143021471621814341
221915112217143022019921714341
62201992220112721514821614341
2219179222022721919721514341
Table 9. Scenario probabilities in the original model and sensitivity analysis model.
Scenario1234567891011121314151617181920
Original0.10.080.070.090.050.070.040.060.030.020.050.040.060.030.040.050.060.020.030.01
Sensitivity analysis00.020.020.030.030.030.040.040.040.050.050.050.060.060.060.070.070.080.090.1
Table 10. Objective functions of the original model, penalty values, and scenario probability sensitivity analysis models.
Objective 1Objective 2Objective 3
Original Model114,840.71009966
Penalty Values Sensitivity Model 65,512.71009966
Scenario Probability Sensitivity Model279,913.110018,813.1
Table 11. Sensitivity analysis results for the unmet human resource demand variable.
ProfessionPeriod ScenarioRegion Unmet Human Resource Demand (Man-Hours)
OriginalPenalty SensitivityScenario Probability Sensitivity
2120191157786947
412019109810981098
112019109810981098
411919950735950
111919950950950
212015946556796
412014935935936
112014935935936
312019921921922
412017886740886
212017828665882
212014719983917
112017715883886
212014719983917
212011562778574
312014775775775
Disclaimer/Publisher’s Note: The statements, opinions and data contained in all publications are solely those of the individual author(s) and contributor(s) and not of MDPI and/or the editor(s). MDPI and/or the editor(s) disclaim responsibility for any injury to people or property resulting from any ideas, methods, instructions or products referred to in the content.

