Article

Mesoscopic States of Light for the Detection of Weakly Absorbing Objects

Department of Science and High Technology, University of Insubria, Via Valleggio 11, I-22100 Como, Italy
Photonics 2022, 9(11), 819; https://doi.org/10.3390/photonics9110819
Submission received: 18 August 2022 / Revised: 19 October 2022 / Accepted: 27 October 2022 / Published: 30 October 2022
(This article belongs to the Section Quantum Photonics and Technologies)

Abstract

:
Over the past twenty years, different imaging techniques have been proposed and implemented in order to reconstruct the images of different kinds of objects, including faint ones. In this work, we exploit the mesoscopic intensity domain to prove that the determination of the transmittance efficiency of an object can be obtained by considering the calculation of the noise reduction factor in the case of a multi-mode pseudothermal state divided at a balanced beam splitter and detected by photon-number-resolving detectors. The good quality of the experimental results suggests that this strategy can be extended to the determination of a matrix of different transmittance values by means of arrays of photon-number-resolving detectors.

1. Introduction

The imaging of different kinds of objects, as well as the location and sizing of obstacles in a large beam represent crucial issues in many practical contexts, such as for medical and biological applications [1,2,3]. In the past two decades, many imaging techniques have been proposed in order to achieve such goals. Among them, ghost imaging (GI) is probably the most popular [4,5]. According to the conventional scheme, the object image is retrieved by using two spatially correlated light beams. The reference beam never interacts with the object and is measured by a detector with spatial resolution, while the object beam, after illuminating the object, is collected with a bucket detector, without any spatial resolution. By correlating the reference beam with the bucket signal, the “ghost” image is retrieved [6].
In the past, such a technique has been applied in different intensity regimes, ranging from the single-photon level [7,8,9,10] up to the macroscopic domain [11,12,13], by employing both classically and quantum-correlated states of light. The experimental results have substantially shown the equivalence between the classical and quantum approaches with some distinguishing features arising, e.g., in the signal-to-noise ratio, according to which the quantum sources, although more fragile, beat the classical ones [14,15,16,17,18]. Beyond the advantages of GI, it has been shown that the standard scheme is not very efficient for the imaging of low-contrast objects, for which very long measurements would be necessary. To this aim, a different imaging scheme, known as differential GI, and exploiting macroscopic pseudothermal light has been proposed and tested on totally absorbing particles glued on a microscope slide [19].
In order to retrieve information about weakly absorbing photolabile objects, in which conventional absorption measurements and macroscopic light levels cannot be applied, here, we propose and investigate a novel method developed in the almost-unexplored mesoscopic intensity regime. In such a domain, the optical states contain sizeable numbers of photons and are detected by photon-number-resolving (PNR) detectors. In this regime, we have recently demonstrated that multi-mode twin-beam states are robust against losses and noise sources [20]. In particular, we have shown that it is possible to characterize their nonclassicality level through the criterion based on the noise reduction factor. Its expression remains analytic even in the presence of imperfections, such as the possible imbalance between the two parties of the correlated states, which explicitly appears as a parameter [21,22] or a noise source superimposed on the correlated light. Since the noise reduction factor completely describes the system under investigation, its evaluation is more effective than the calculation of other quantities, such as the mean value, where the contributions of correlated light and noise cannot be distinguished.
In this work, we exploit the noise reduction factor to obtain information about the imbalance between correlated states of light. In particular, we discuss which state can be considered optimal to this aim and what is the most critical parameter. The good quality of the results suggests, on the one hand, further experimental improvements in order to enhance the precision of the method and, on the other, the possible exploitation of this strategy to determine a matrix of different transmittance values. In this case, the detection of the mesoscopic states of light would be obtained by employing arrays of PNR detectors, such as matrices of silicon photomultipliers [23,24] or complementary metal–oxide–semiconductor (CMOS) cameras in which each pixel is endowed with PNR capability [25].

2. The Theoretical Model

Given a bipartite state, either classical or quantum, endowed with photon-number correlations, the noise reduction factor is defined as the ratio of the variance σ 2 ( n 1 n 2 ) of the photon-number difference between the two parties of the state to the shot-noise level ( n 1 + n 2 ) [26]:
R = σ 2 ( n 1 n 2 ) n 1 + n 2 ,
where n 1 ( n 2 ) is the number of photons in Arm 1 (Arm 2). Usually, this quantity is used to assess the nonclassicality level of entangled states. In fact, R < 1 is a sufficient condition for entanglement [27].
In past works, we have shown that this quantity can be also expressed in terms of measurable quantities, such as detected photons [28]:
R = σ 2 ( m 1 m 2 ) m 1 + m 2 = ( m 1 m 2 ) 2 ( m 1 m 2 ) 2 m 1 + m 2 ,
in which m 1 ( m 2 ) is the number of detected photons in Arm 1 (Arm 2). Even in this case, values of R less than 1 mean that correlations between Arm 1 and Arm 2 are nonclassical. According to the considered bipartite state, it is in general possible to find an analytic expression, or at least a closed formula, for the noise reduction factor. For instance, in the case of a multi-mode twin-beam state with μ equally populated modes, Equation (2) reads as [29]
R = 1 2 η 1 η 2 m 1 m 2 m 1 + m 2 + ( m 1 m 2 ) 2 μ ( m 1 + m 2 ) ,
in which η 1 and η 2 are the quantum efficiencies in the two arms. At variance with this expression, in the case of a multi-mode pseudothermal state divided at a beam splitter (BS), R reads as
R = 1 + ( m 1 m 2 ) 2 μ ( m 1 + m 2 ) .
By comparing Equations (3) and (4), it is clearly evident that they differ for the negative term, which makes possible the observation of sub-shot-noise correlations. On the contrary, in the case of a multi-mode pseudothermal state divided at the BS, only values of 
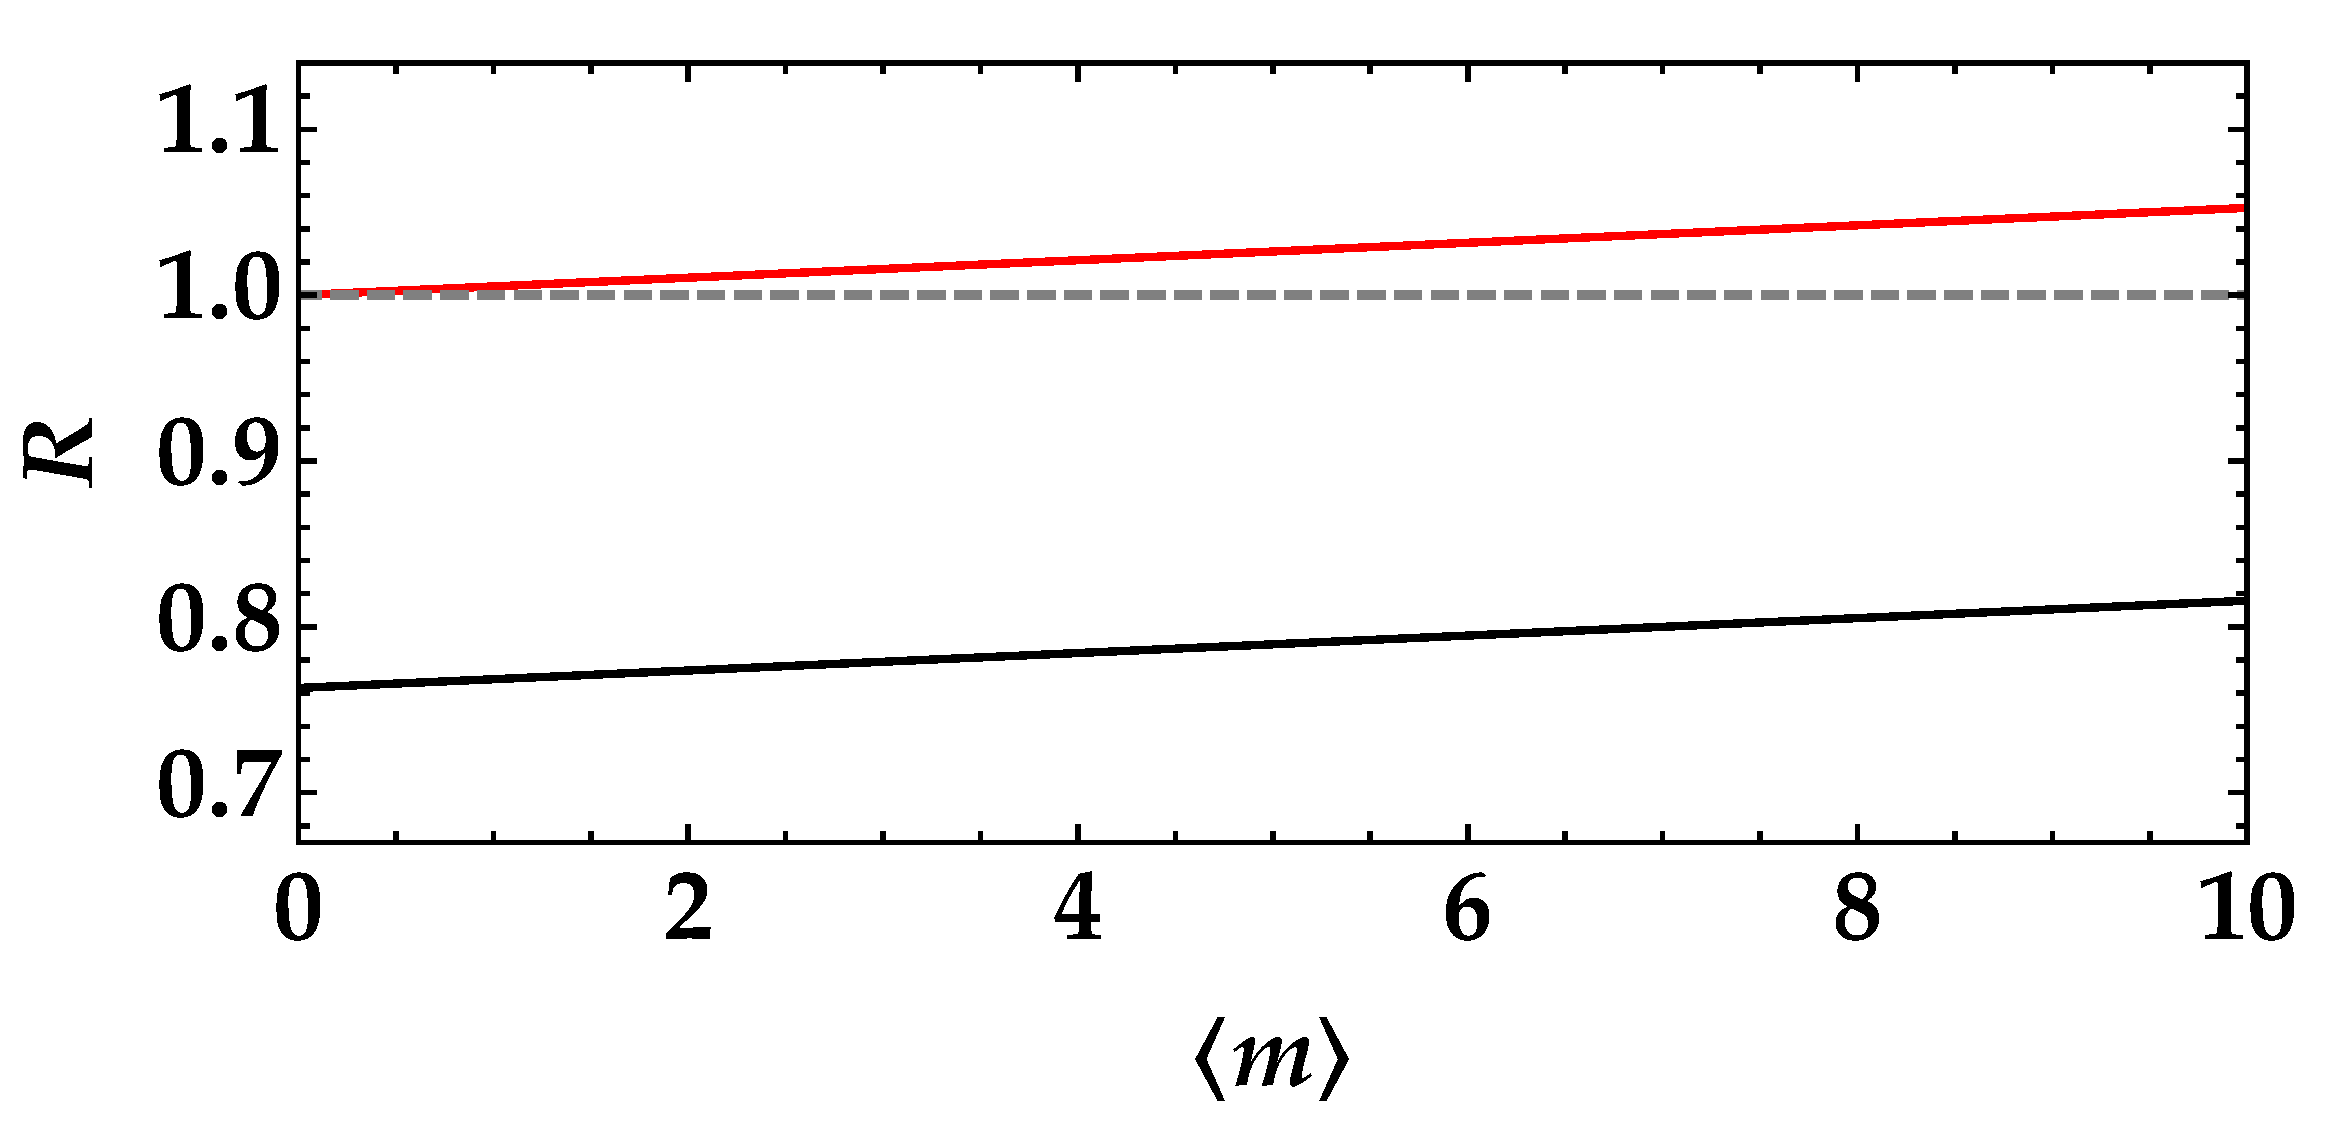
R larger than (or at least equal to) 1 are possible, depending on the level of imbalance between the two BS outputs. In order to better emphasize the role of imbalance, we operate the following substitutions: m 1 = m and m 2 = t m , t being the transmission efficiency in the interval [ 0 , 1 ] . Moreover, assuming that, in Equation (3), η 1 = η 2 = η , Equations (3) and (4) can be re-written as:
R = 1 2 η t ( 1 + t ) + m μ ( 1 t ) 2 ( 1 + t ) ,
and
R = 1 + m μ ( 1 t ) 2 ( 1 + t ) ,
respectively. A direct comparison between the two expressions is shown in Figure 1 for t = 0.9 and μ = 1 . Moreover, as discussed in [20], the expression of the noise reduction factor can also include the contribution of a noise source superimposed on the correlated light, due to either spurious light or to dark counts [30,31].
If the two arms of the bipartite states, both classical and quantum, are characterized by the presence of an imbalance, for instance due to the presence only in one arm of an object with transmittance efficiency equal to t, the calculation of the noise reduction factor as a function of the mean value of light is useful to extract information about the value of t by fitting the relation R ( m ) with Equation (5) or Equation (6). It is important to observe that, in general, also the number of modes and the quantum efficiency could be unknown parameters. Since such quantities are multiplied by t in Equations (5) and (6), it makes no sense to obtain them from the fitting procedure applied to R. Thus, it is important to understand if they can be independently determined [32]. This is easy in the case of μ , which can be obtained as a fitting parameter from the reconstruction of the photon-number statistics, which is multi-mode thermal in both cases under investigation. On the contrary, obtaining η is much more critical because it requires a nonclassicality measurement. Moreover, the higher the number of parameters to be evaluated, the more critical the exact determination of t. There is also a practical consideration. In fact, the typical quantum efficiency values of commercial PNR detectors are not so large [29].
In addition, tailoring a single-mode twin-beam state without loosing quantum efficiency is not trivial [33,34].
For all these reasons, in the following, we deal with multi-mode pseudothermal light. Furthermore, this choice allows us to investigate the role of the number of modes, which can be easily changed. From Equation (6), it is clear that the smaller the value of μ , the larger the dynamics of R and, thus, the easier the determination of t from the fitting procedure is. However, it is also important to point out that determining the value of t is more and more critical when it tends to 1. In particular, by setting μ = 1 , the higher the value of t, the larger the dynamic range of m should be in order to distinguish the curve of R from the horizontal line at R = 1 . To this aim, the use of PNR detectors endowed with a large dynamic range could be advisable. For instance, silicon photomultipliers could be used for this purpose.

3. Materials and Methods

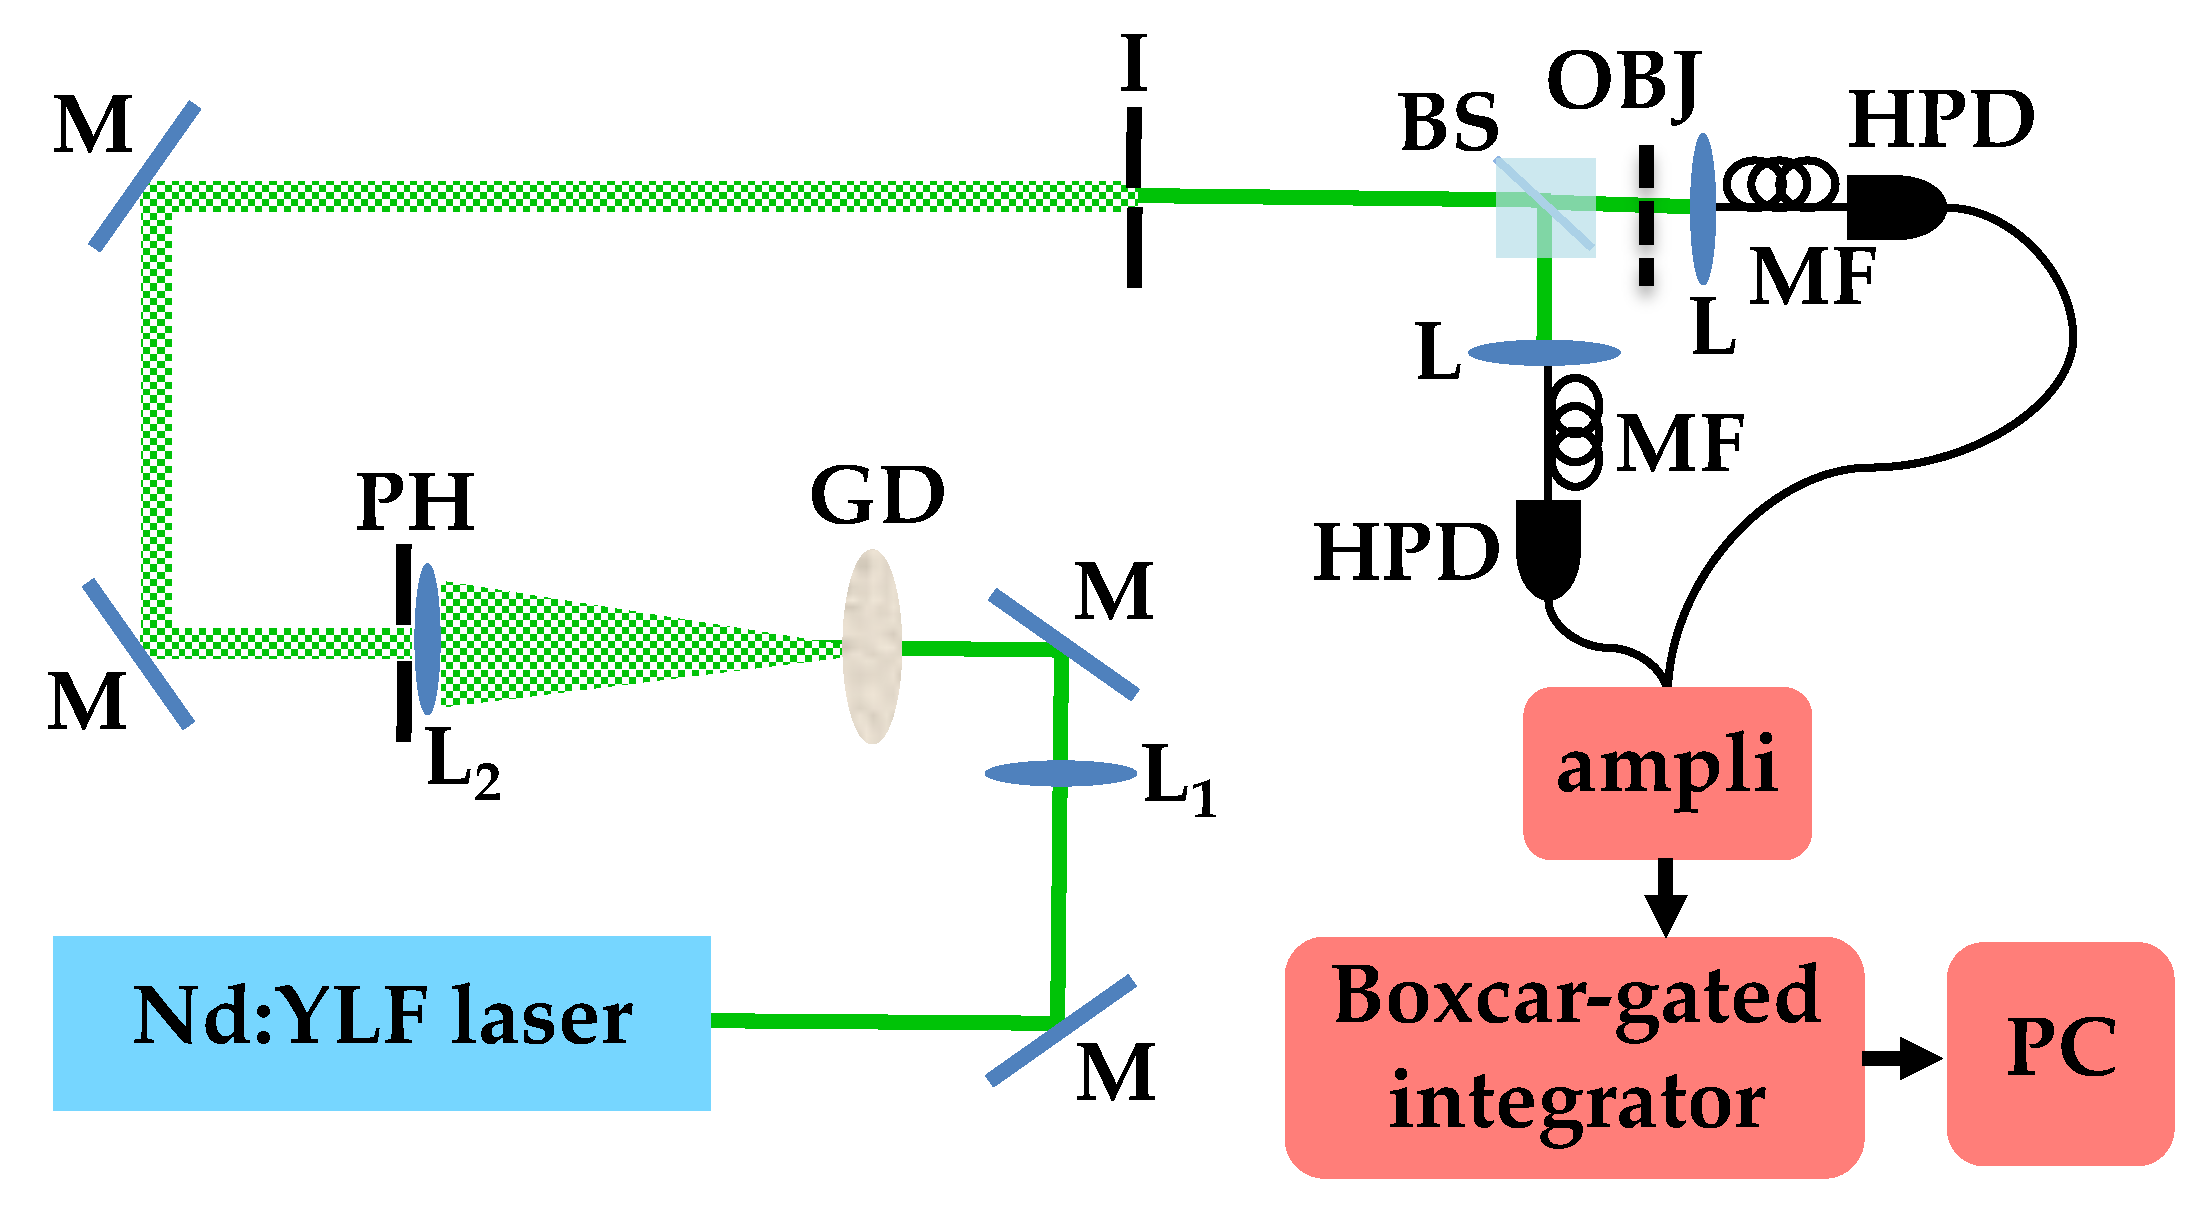
In order to test the reliability of the method, that is the determination of the value of t by the calculation of the noise reduction factor in the case of multi-mode pseudothermal states, we realized the setup shown in Figure 2.
The second harmonics at 523 nm of a Nd:YLF laser regeneratively amplified at 500 Hz was focused by a 200 mm-focal-length lens (L 1 ) on the surface of a rotating ground-glass disk (GD). A portion of the generated speckle field was then collimated and further selected by an iris with a variable aperture (I) before being divided at a balanced BS. Each BS output was then focused by an achromatic doublet (L) into a multi-mode optical fiber (MF, 600-µm core diameter) and delivered to a hybrid photodetector (HPD, mod. R10467U-40, Hamamatsu Photonics), which is a commercial PNR detector operated at room temperature. Each detector output was then amplified, synchronously integrated by a boxcar-gated integrator, and acquired. For each mean value, which was changed by means of a variable neutral-density filter, we saved 100,000 laser pulses. To simulate the presence of an object with a given transmittance efficiency, we inserted a neutral-density filter in the transmitted arm, between the BS and the achromatic doublet.
In past works, we have demonstrated that, by applying a self-consistent method to the data, it is possible to convert the output voltages in the number of detected photons [35]. Thus, we can calculate all the relevant quantities in terms of detected photons.

4. Results

As a first validation test, we considered the case in which the neutral-density filter has a transmittance coefficient equal to t = 0.550 ± 0.001 , whose value was independently determined through absorption measurements. In order to determine this value from the noise reduction factor, we first observed that it is convenient to consider R as a function of m / μ , so that, in the fitting function, the only fitting parameter is t. In order to independently determine the number of modes for each mean value, we considered the reconstruction of the photon-number statistics in which μ 
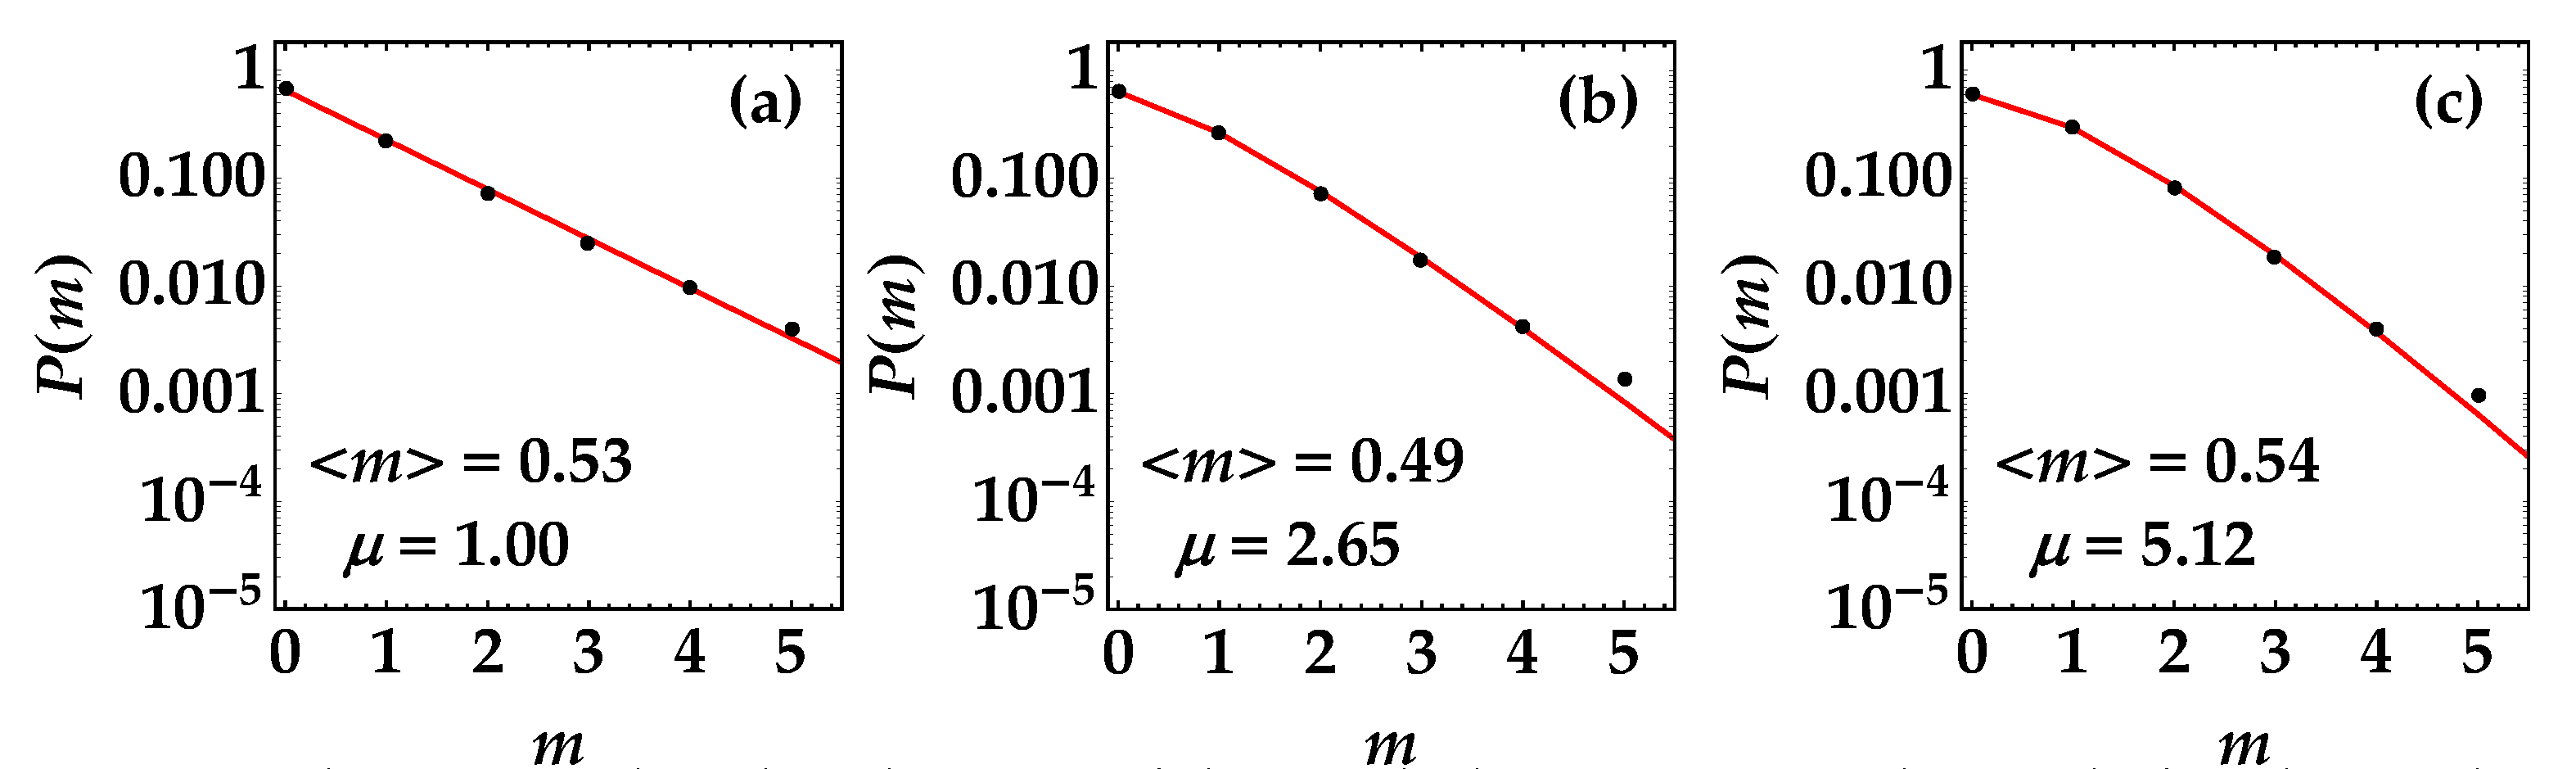
represents the only free parameter. If we assume that all the modes of the pseudothermal light are equally populated, the expected photon-number statistics is described by the negative binomial distribution [36]:
P μ ( m ) = ( m + μ 1 ) ! m ! ( μ 1 ) ! m / μ + 1 μ μ / m + 1 m .
For the sake of clarity, in Figure 3, we plot three photon-number distributions having the same mean value and three different numbers of modes.
The value of μ 
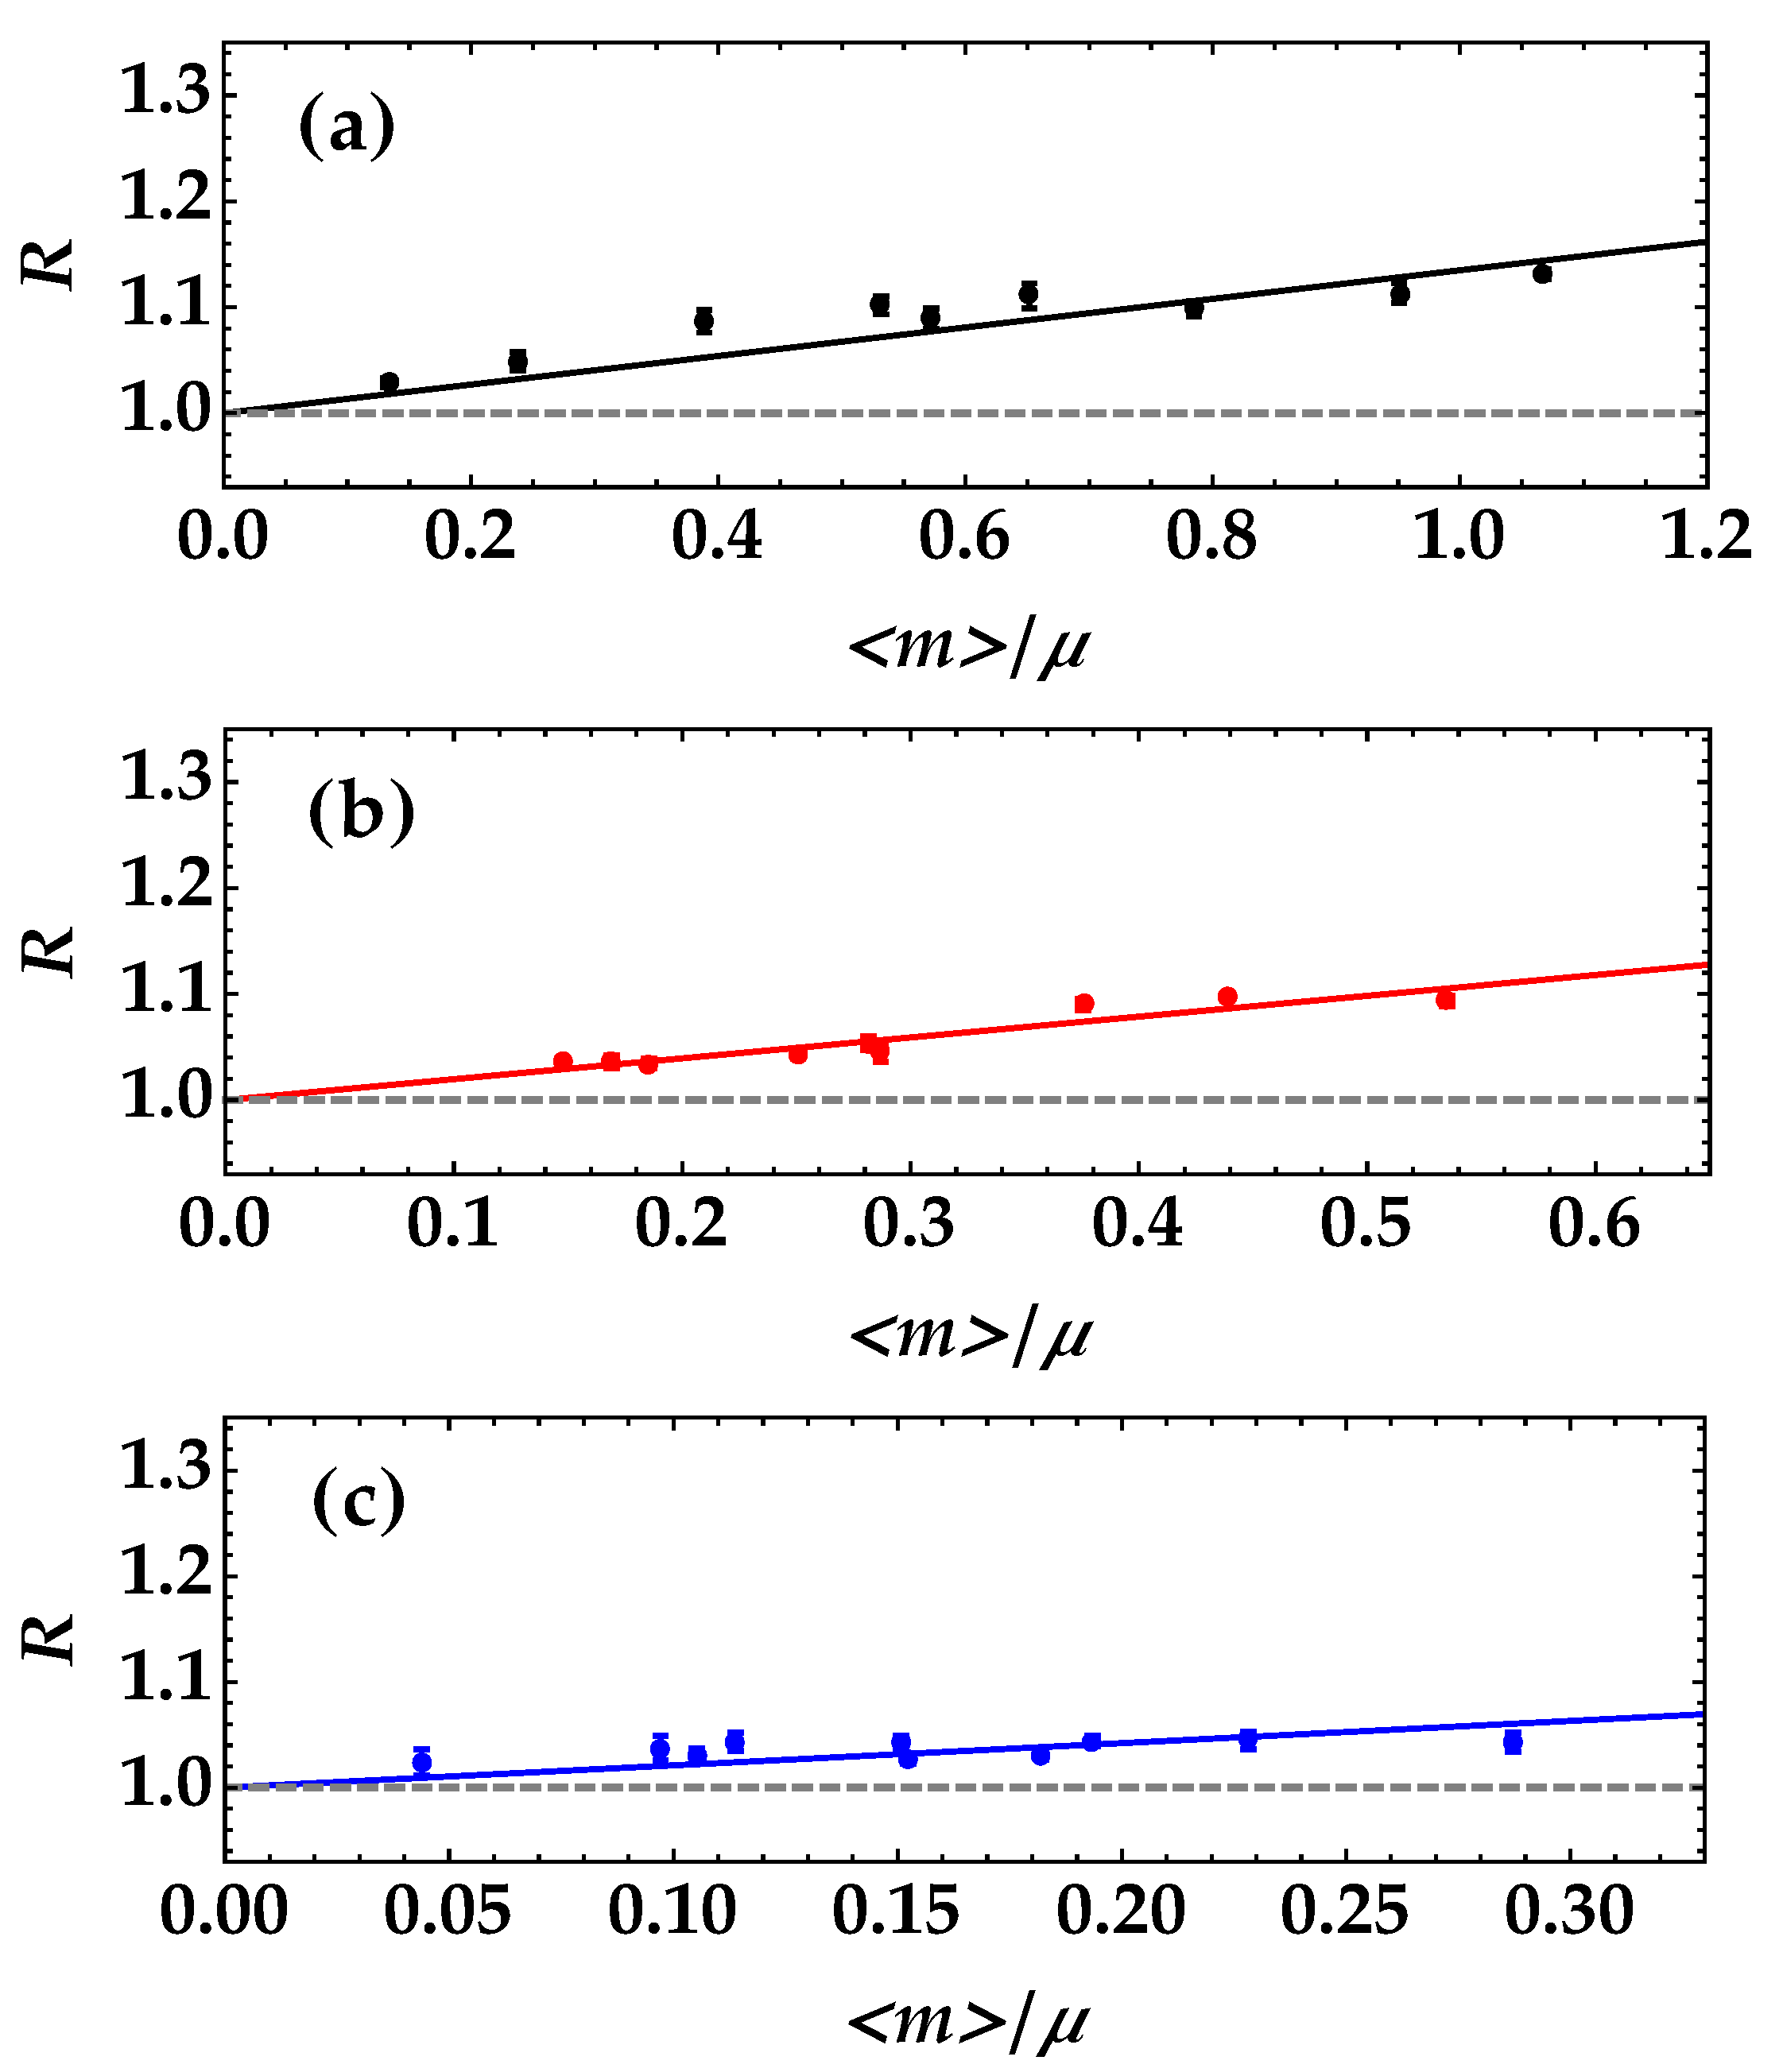
was changed by choosing different apertures of the iris. In Figure 4, we plot the noise reduction factor R as a function of m / μ for the three different values of μ in Figure 3, and in each case, we determined the value of t.
We noticed that the mean value of t that better resembles the expected one is the case in which the employed state is single-mode thermal, while increasing the number of modes seems to worsen the proper determination of the transmittance efficiency. The case μ = 1 gives a value corresponding to the expected one, shown as the gray dashed line, with a relative error of 1.8%. On the contrary, the cases μ = 2.8 and μ = 6.2 have a larger relative discrepancy, namely 16% and 18%, respectively. This behavior could be ascribed to the difference in the explored dynamic range, which is definitely smaller in the case μ > 1 than in the case μ 1 .
Moreover, the higher the number of modes, the more critical the proper collection of such modes at the two BS outputs is. Indeed, a non-perfect selection of the correlated modes can cause higher values of R since it introduces noise contributions [20]. As anticipated in the Introduction, we showed that the noise reduction factor can include the effect of these noise sources, still attaining an analytic formula:
R = 1 + ( 1 t ) 2 m 2 μ ( 1 + t ) m + m N + σ 2 ( m N ) m N ( 1 + t ) m + m N ,
in which m N and σ N 2 are the mean value and the variance of the noise source, respectively. This expression can be used to better fit the data shown in Panels (b) and (c) of Figure 4. Indeed, by assuming that, superimposed on the correlated light, there is an uncorrelated multi-mode pseudothermal noise (in this case, σ N 2 = m N ( m N / μ N + 1 ) , μ N being the number of modes of the thermal noise), we obtained the behavior of R as a function of m shown in the Panels (a) and (b) Figure 5. By fitting the data with the complete model in Equation (8), we obtained values of the parameter t that are in agreement with the expected one, that is t = 0.55 ± 0.02 in Case (a) and t = 0.56 ± 0.03 in Case (b). In order to better emphasize the need to introduce a more complete description model for R to explain the discrepancies, in Figure 6, we plot the values of t obtained by fitting the data shown in the three panels of Figure 4 and Figure 5 as a function of the number of modes. The red dots correspond to the model in Equation (6), while the blue dots to the complete one in Equation (8).
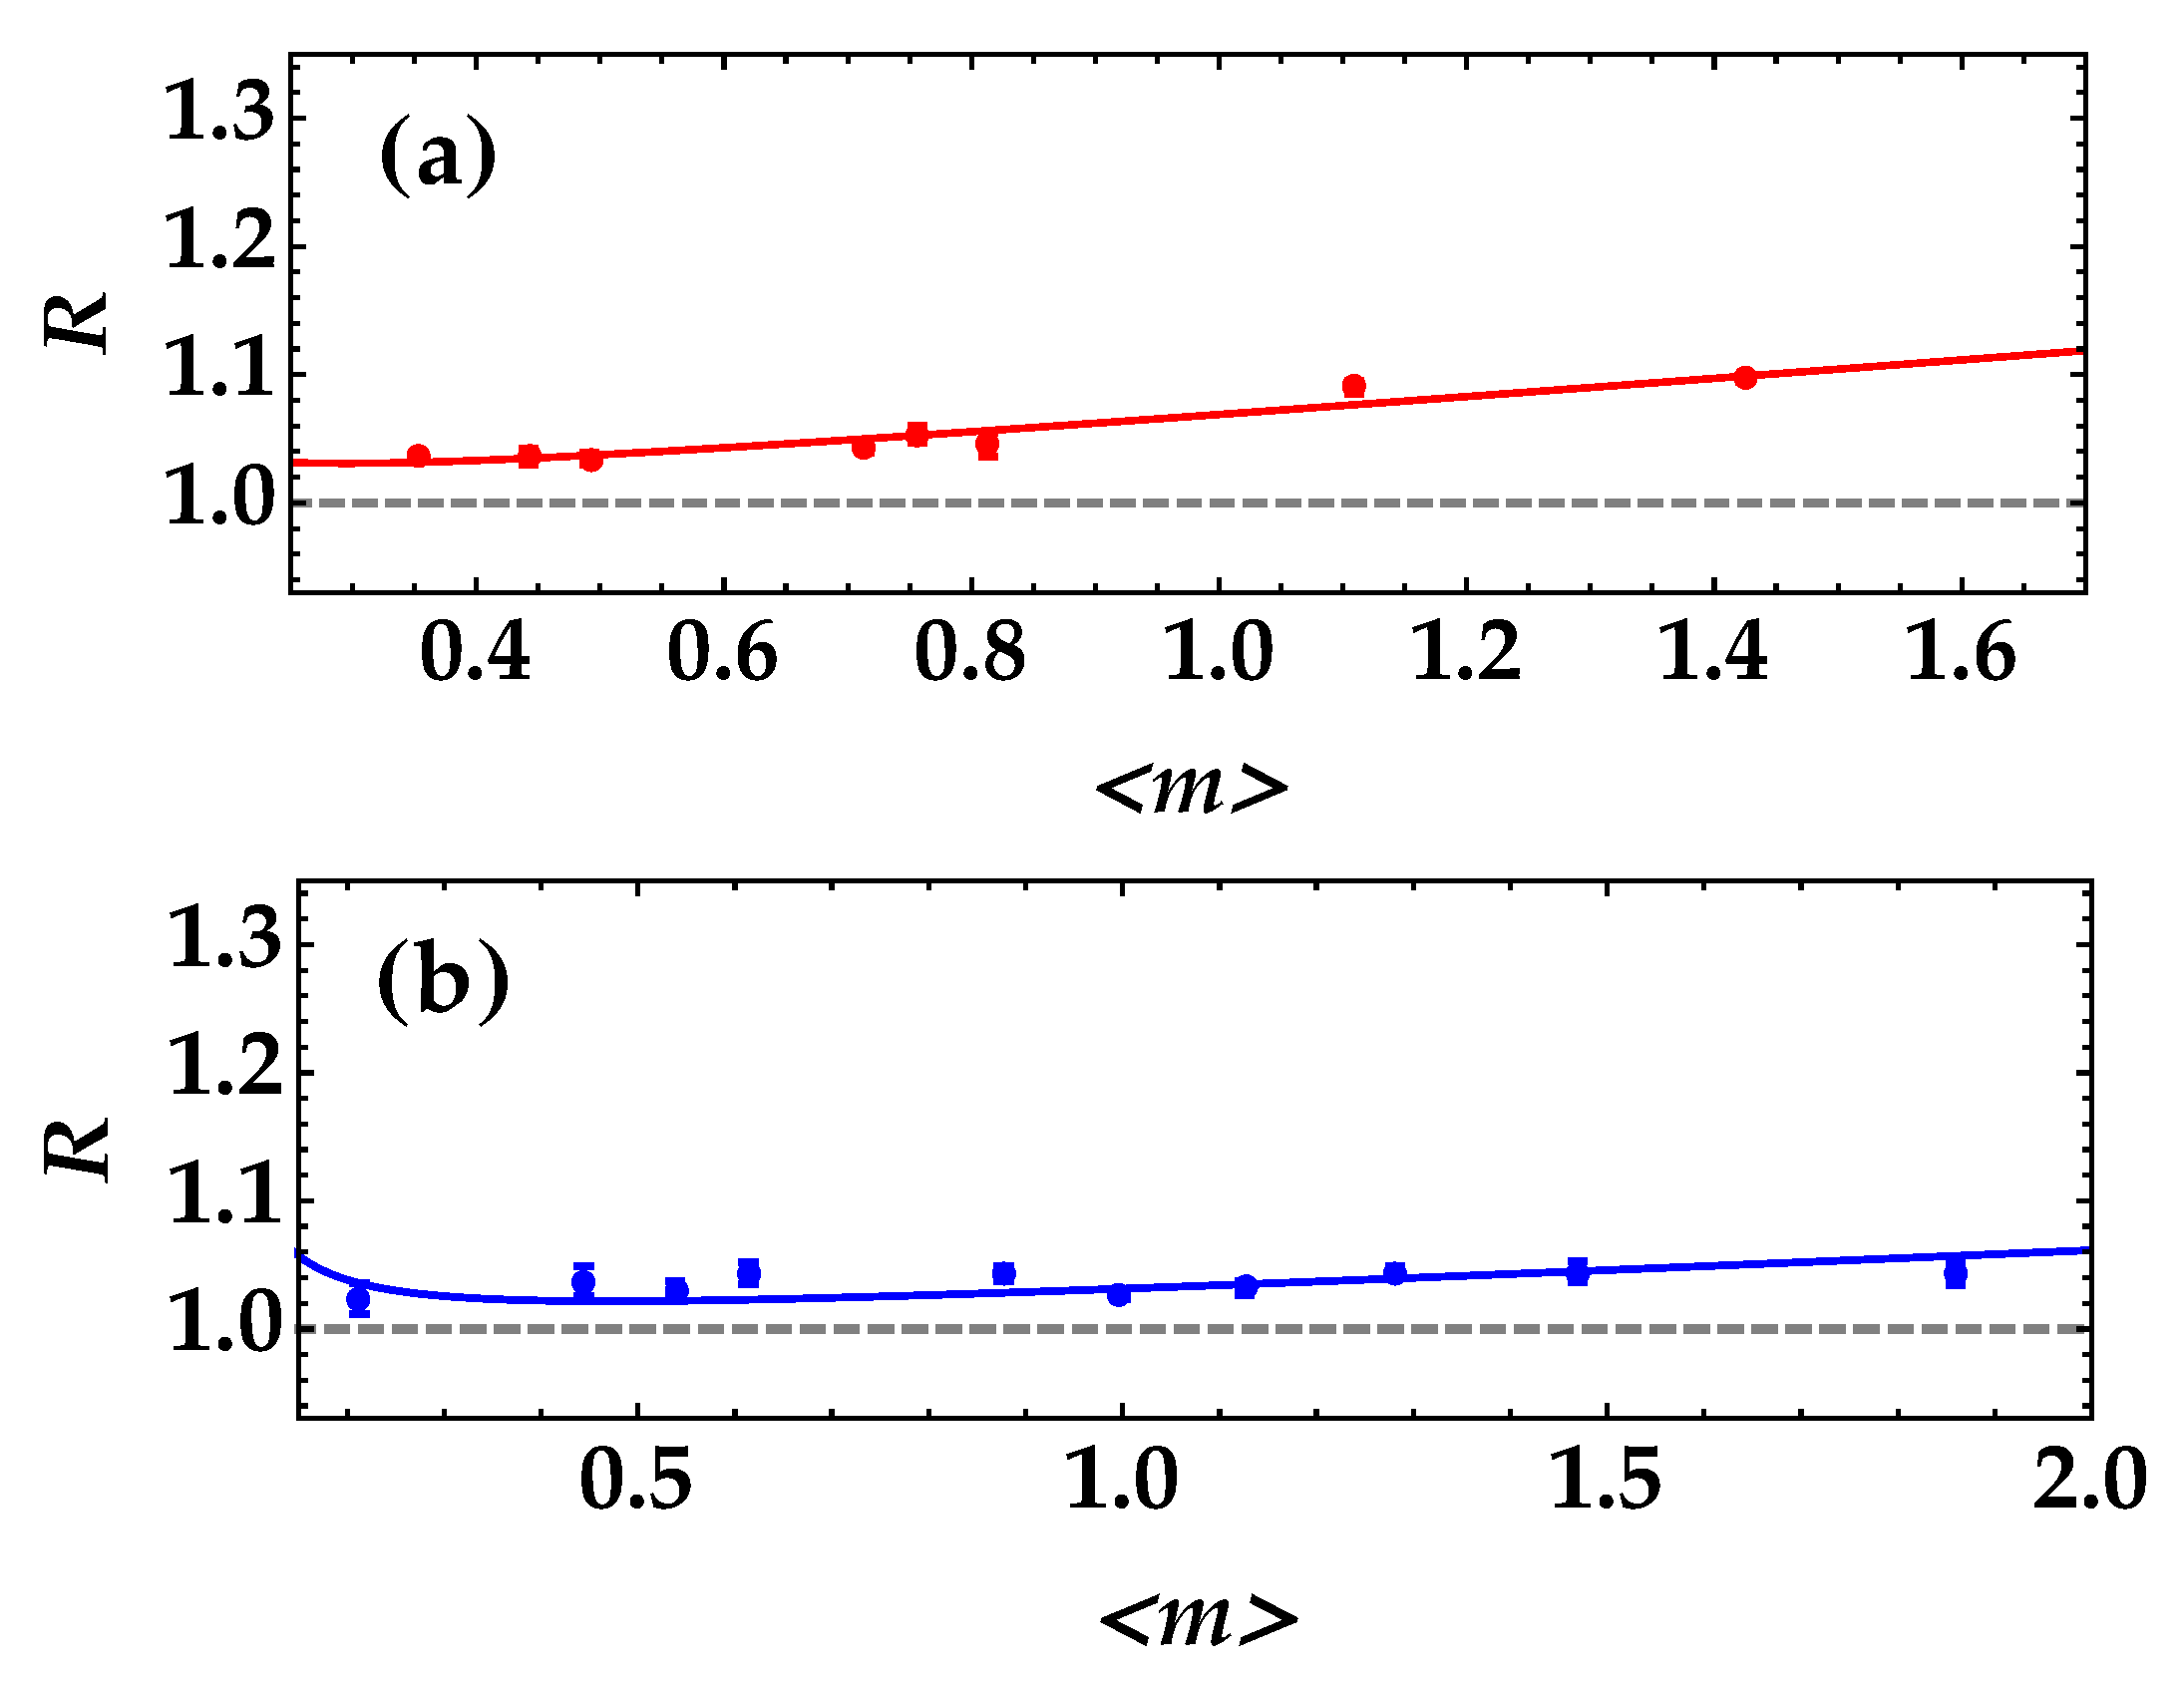
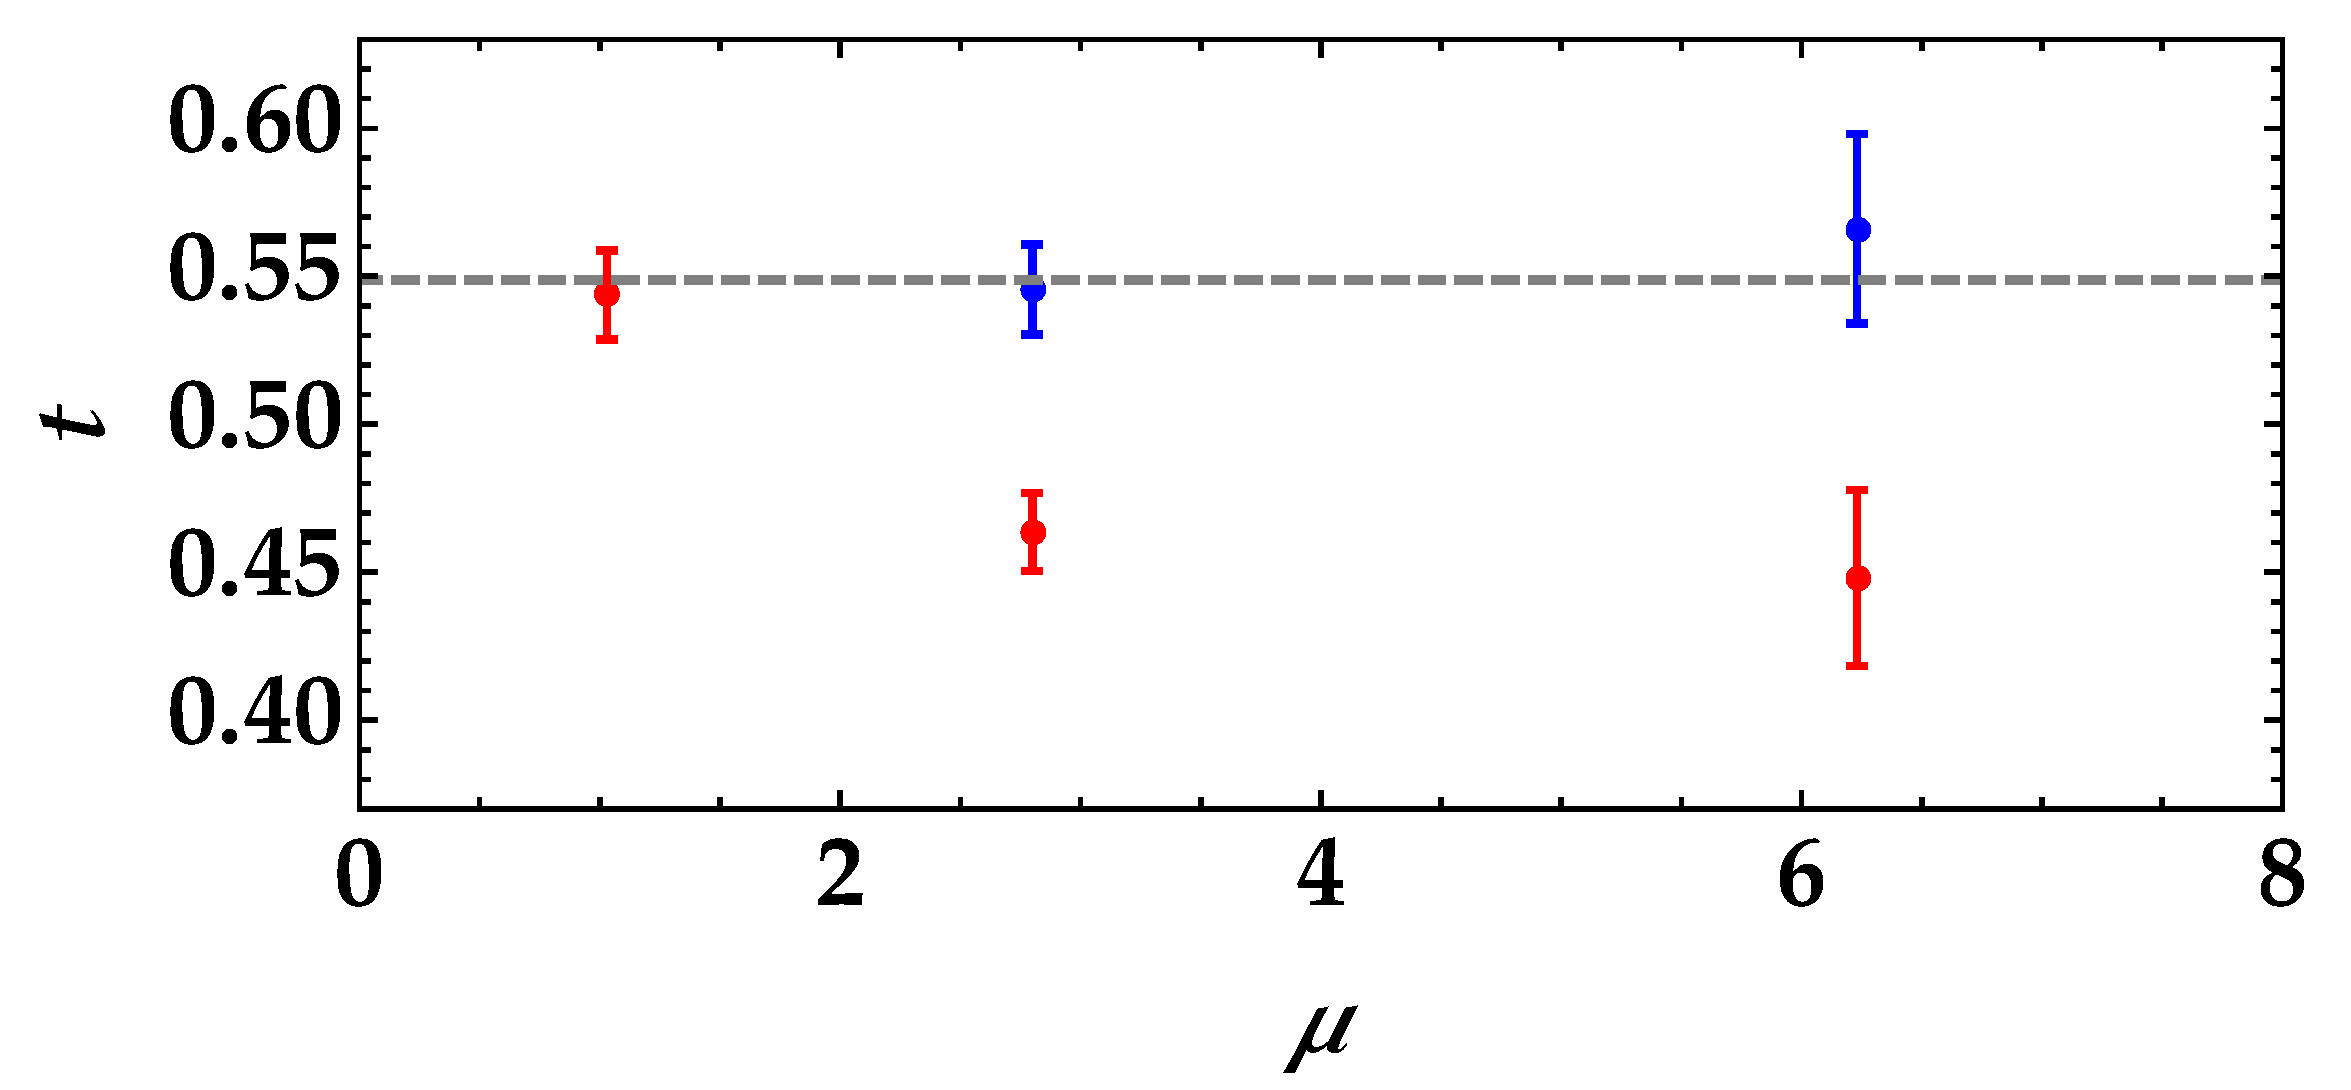
To further validate the method, we also considered the more critical case of a neutral-density filter with a higher transmittance coefficient, that is t = 0.804 ± 0.001 . First of all, we considered two possible values of μ obtained by changing the aperture of the iris and taking care to correctly collect the correlated speckles at the two BS outputs. In Figure 7, we show the experimental data as colored dots + error bars together with the theoretical fitting functions according to Equation (6). The values of t obtained from the fitting procedures are shown as a function of the number of modes in Figure 8.
Even in this case, the case μ = 1.05 is the best solution, since it gives a value of t that is in agreement with the expected one, shown as the gray dashed line. Indeed, by fitting the data according to Equation (6), that is in the absence of noise sources, the relative discrepancies for the two cases are 0.2% for μ = 1.05 and 3.0% for μ = 3.7 .
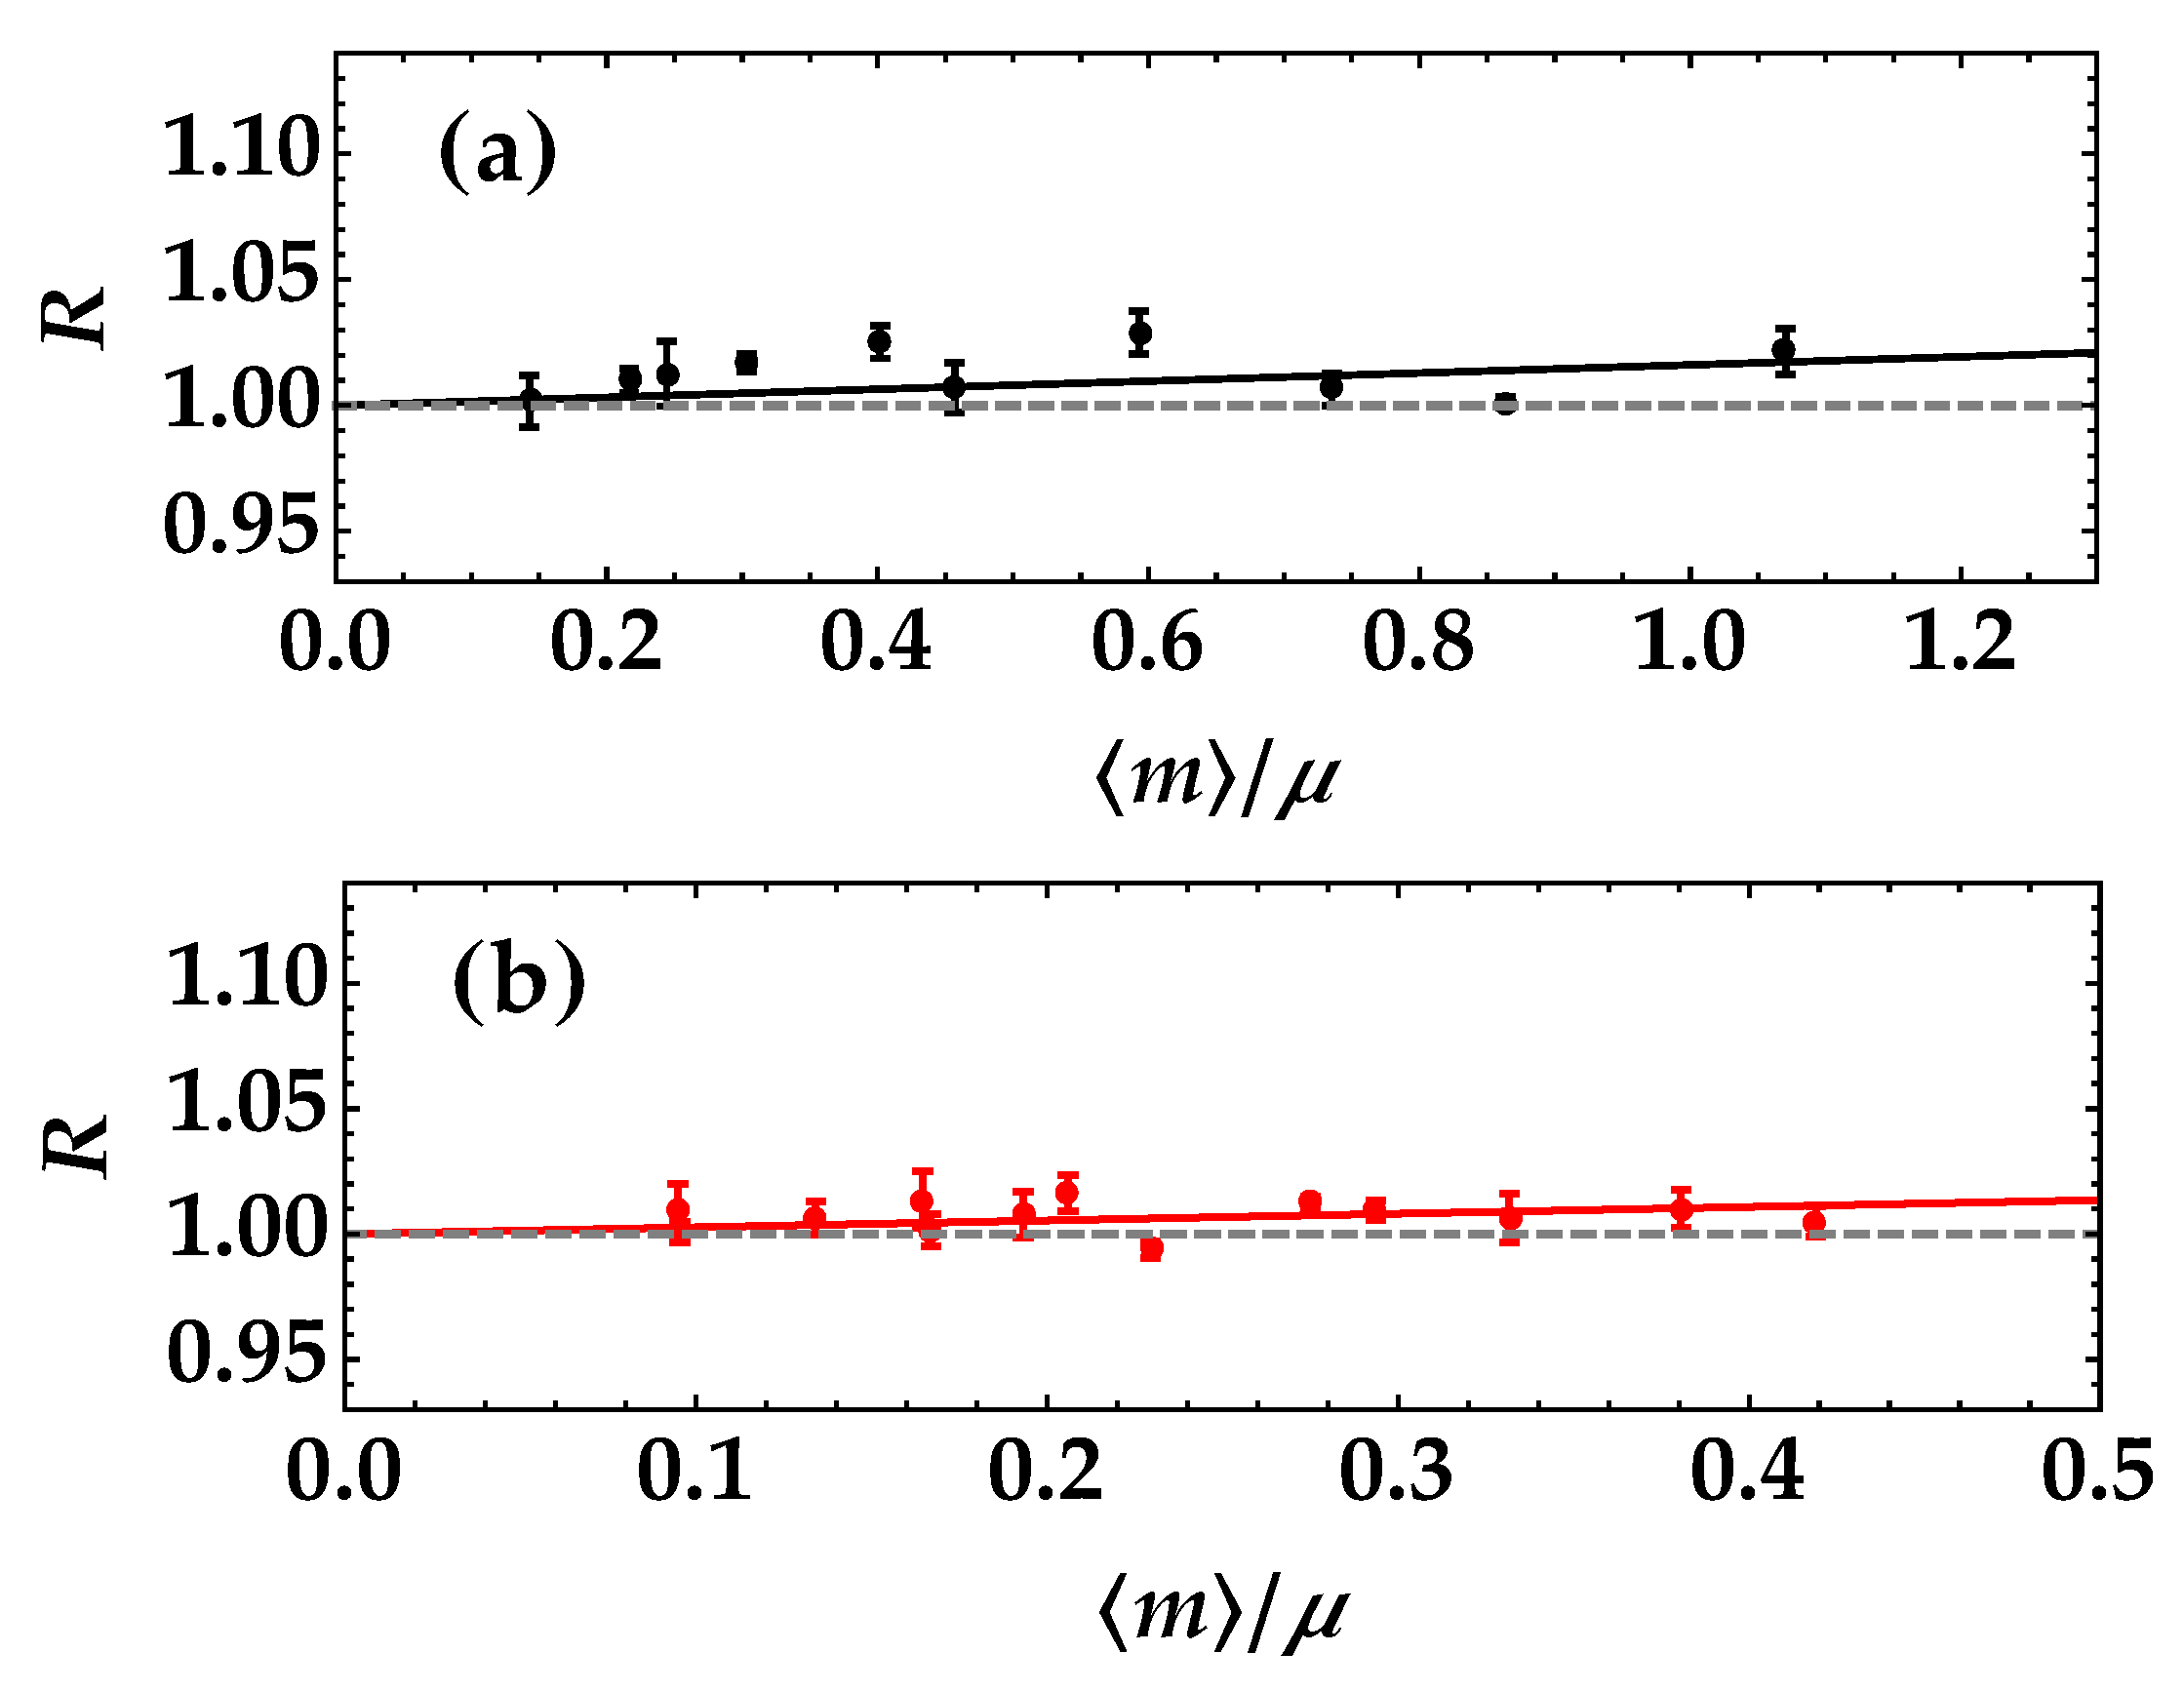
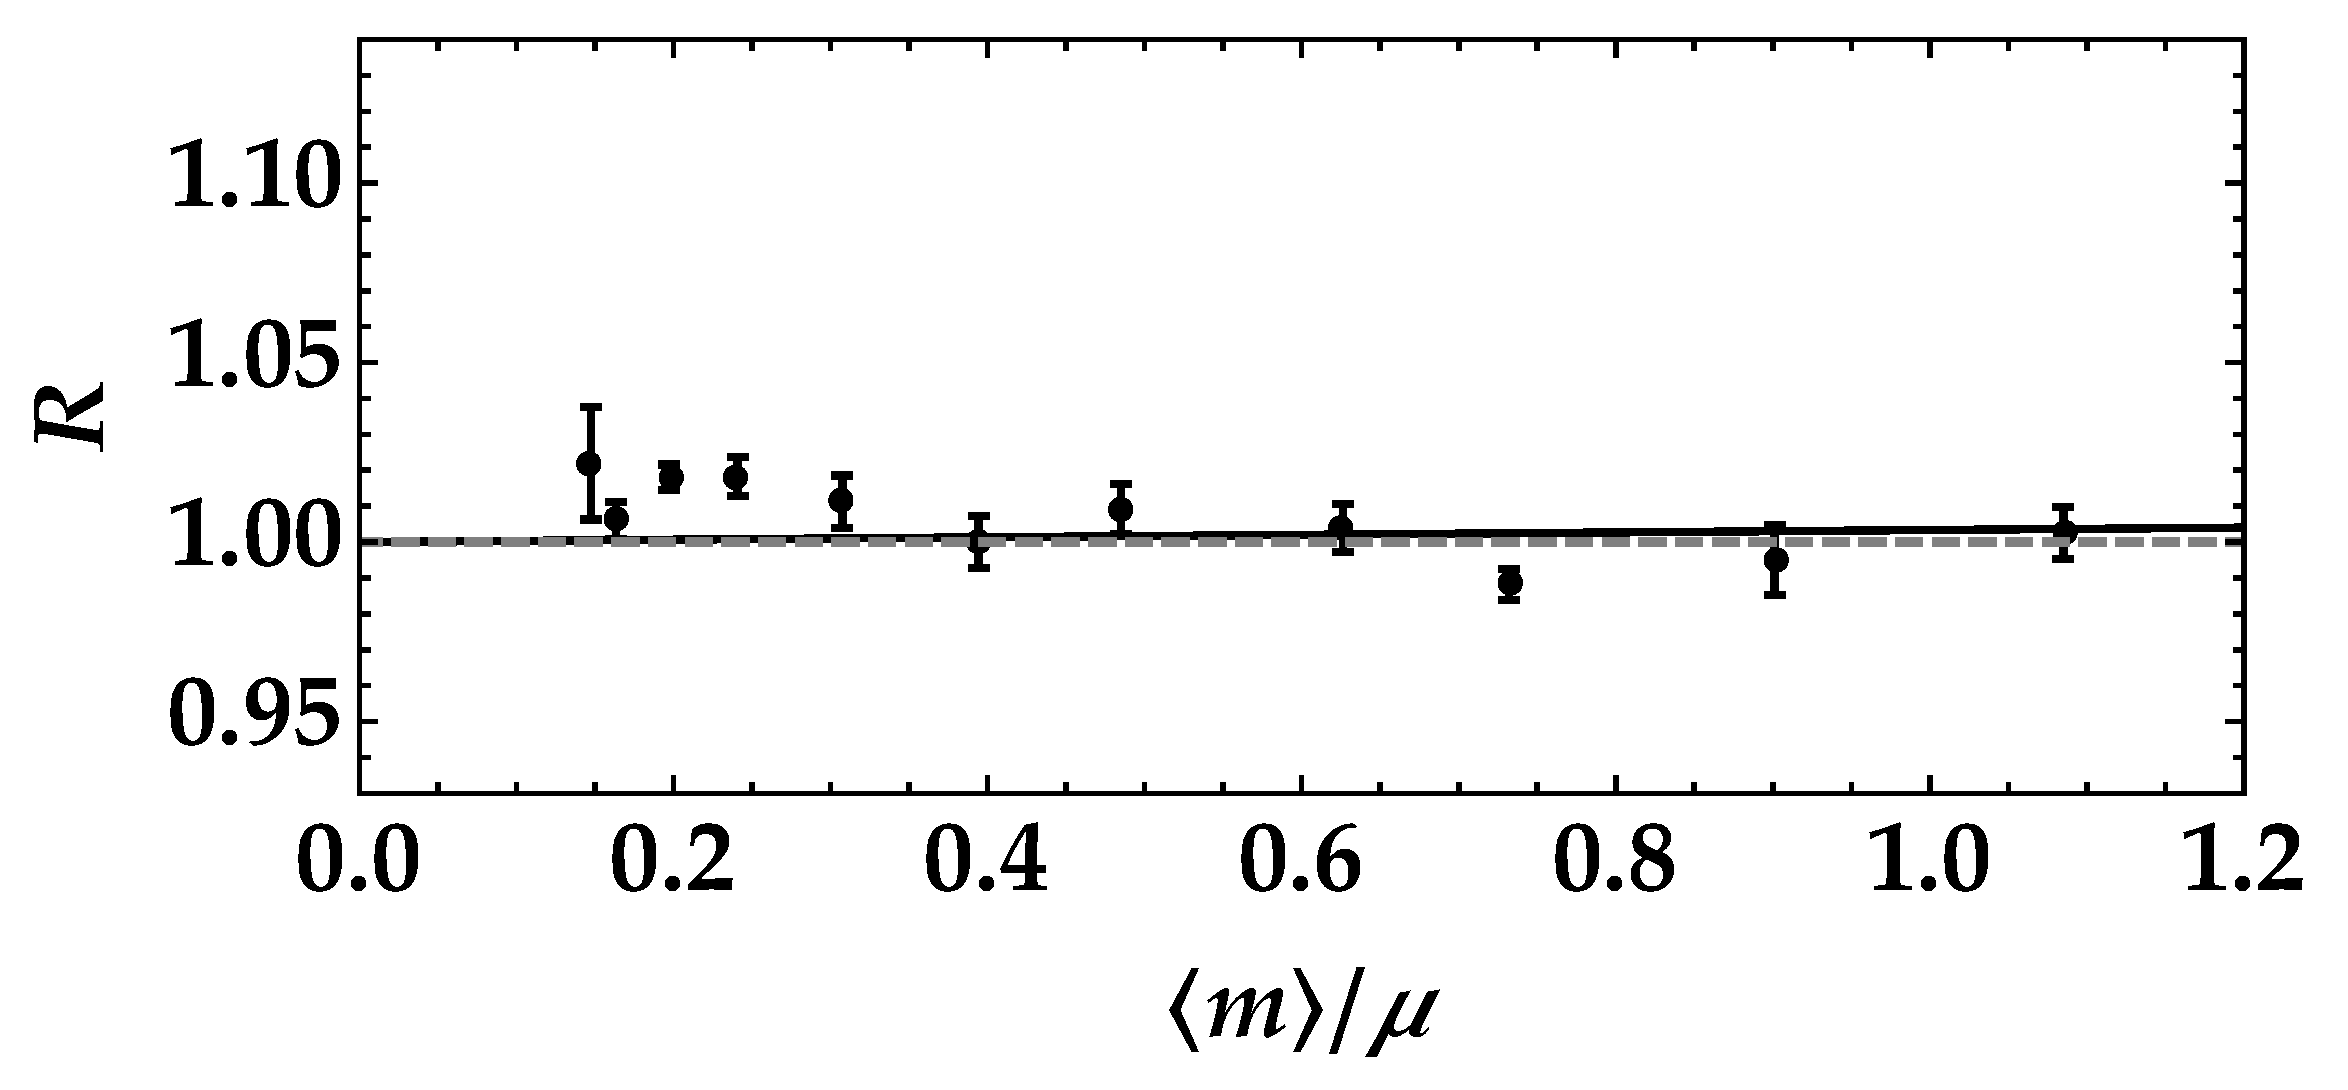
The analysis performed so far seems to indicate that the number of modes represents a crucial parameter for the determination of the transmittance coefficient. However, the point is much more subtle, as shown in the following. Let us assume that, in the case μ = 1 , we process offline each dataset by summing together in each arm the number of photons detected in a specific number (2, 3, 4, …) of subsequent laser shots. In such a way, we obtained measurements corresponding to 2, 3, 4 modes, and so on, as it can be easily verified by fitting the obtained photon-number distributions according to the multi-mode thermal statistics in Equation (7). However, also, the mean value increases correspondingly. Thus, the mean number of photons per mode remains constant. If we compare the results of the fitting procedure applied to the calculation of R as a function of m / μ for each combination of data, we obtain the roughly constant behavior shown in Figure 9.
This result proves that the parameter to control is the mean number of photons per mode rather than the number of modes. The higher the value of m / μ , the better the determination of t from the fit of R.
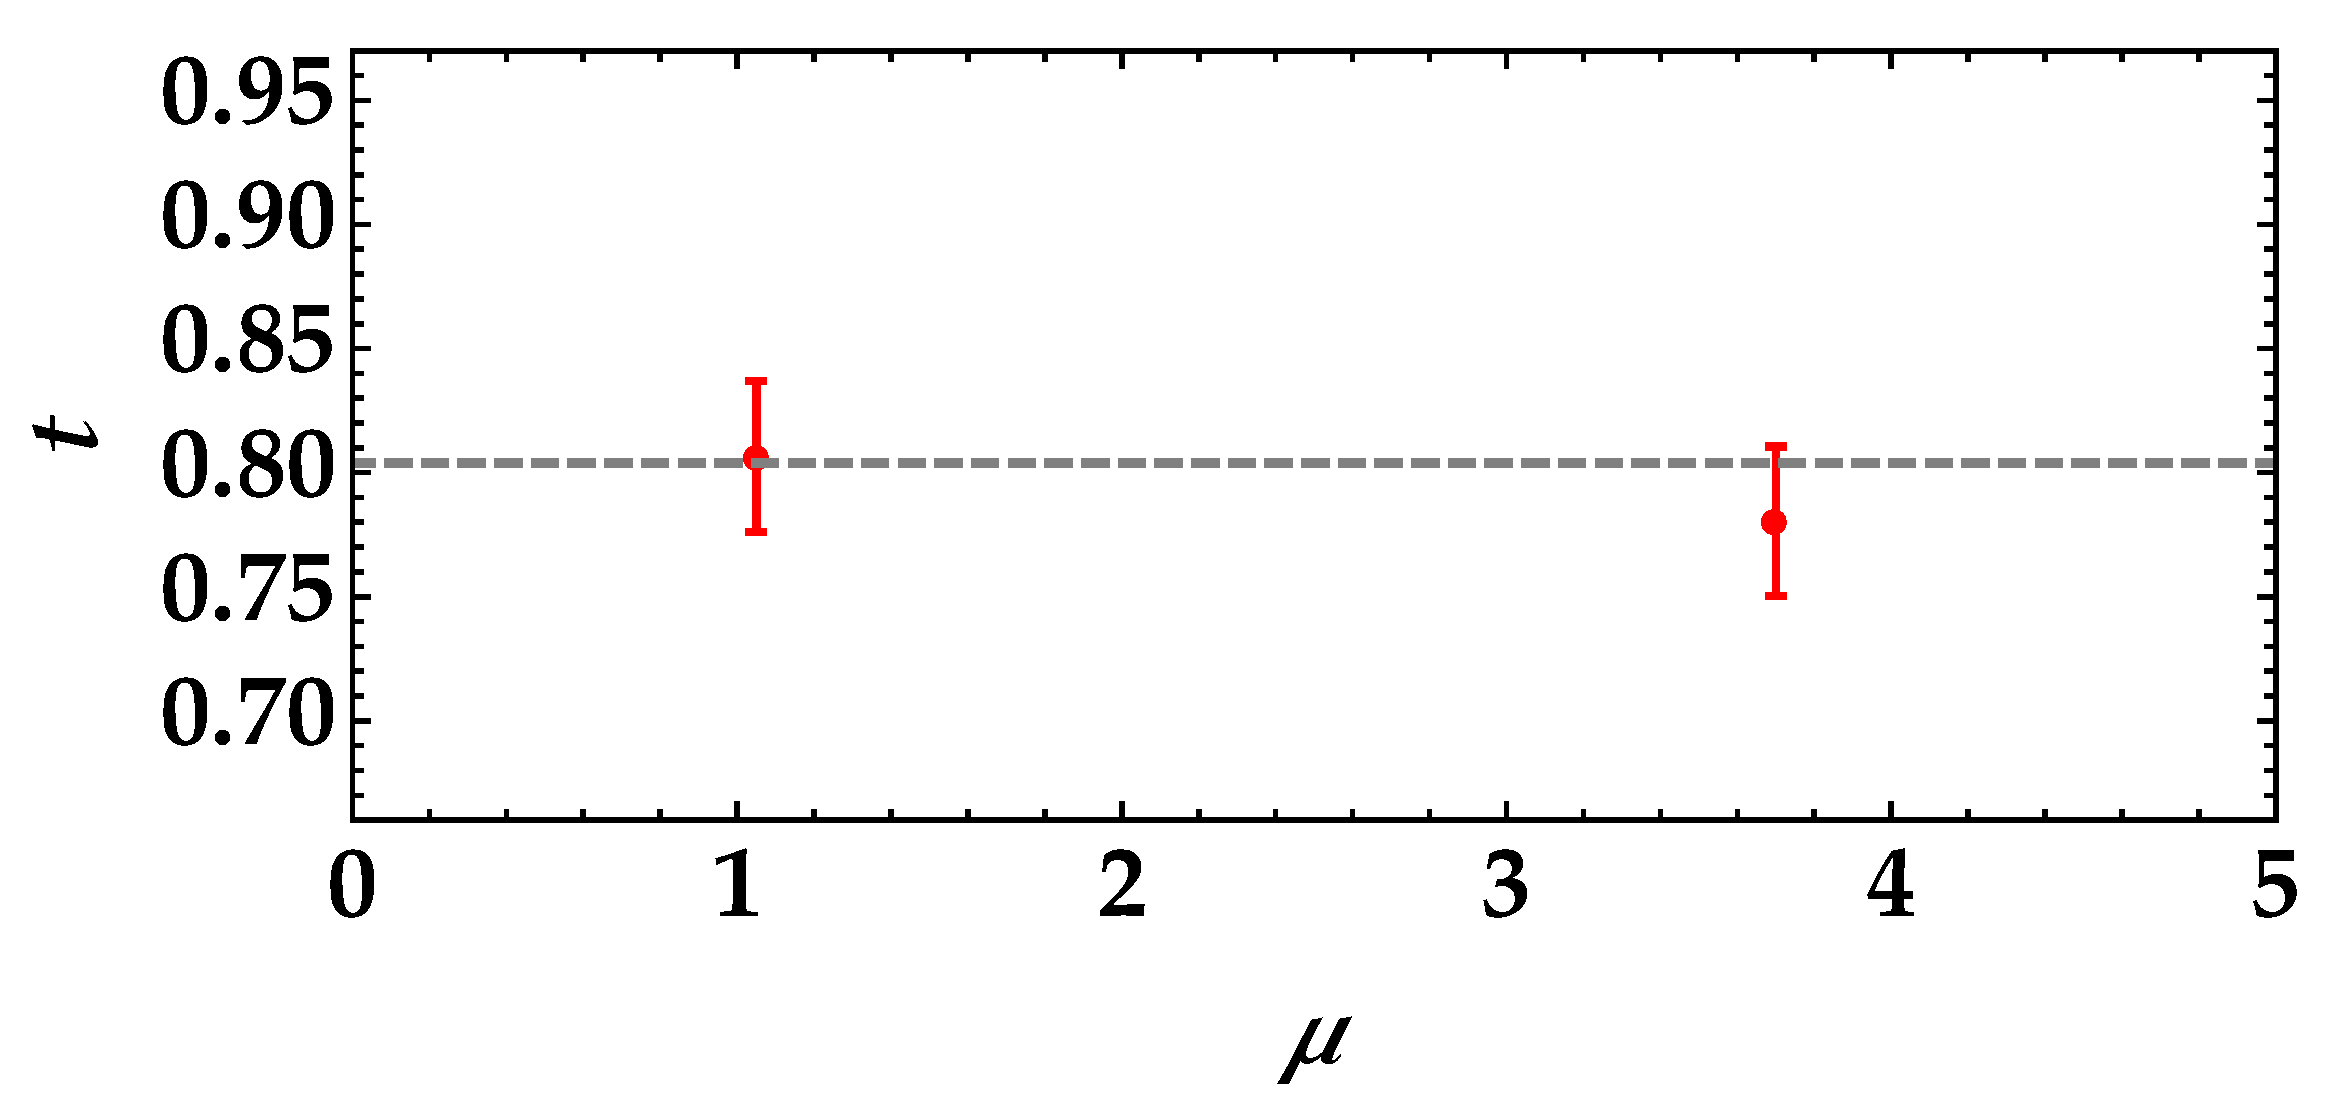
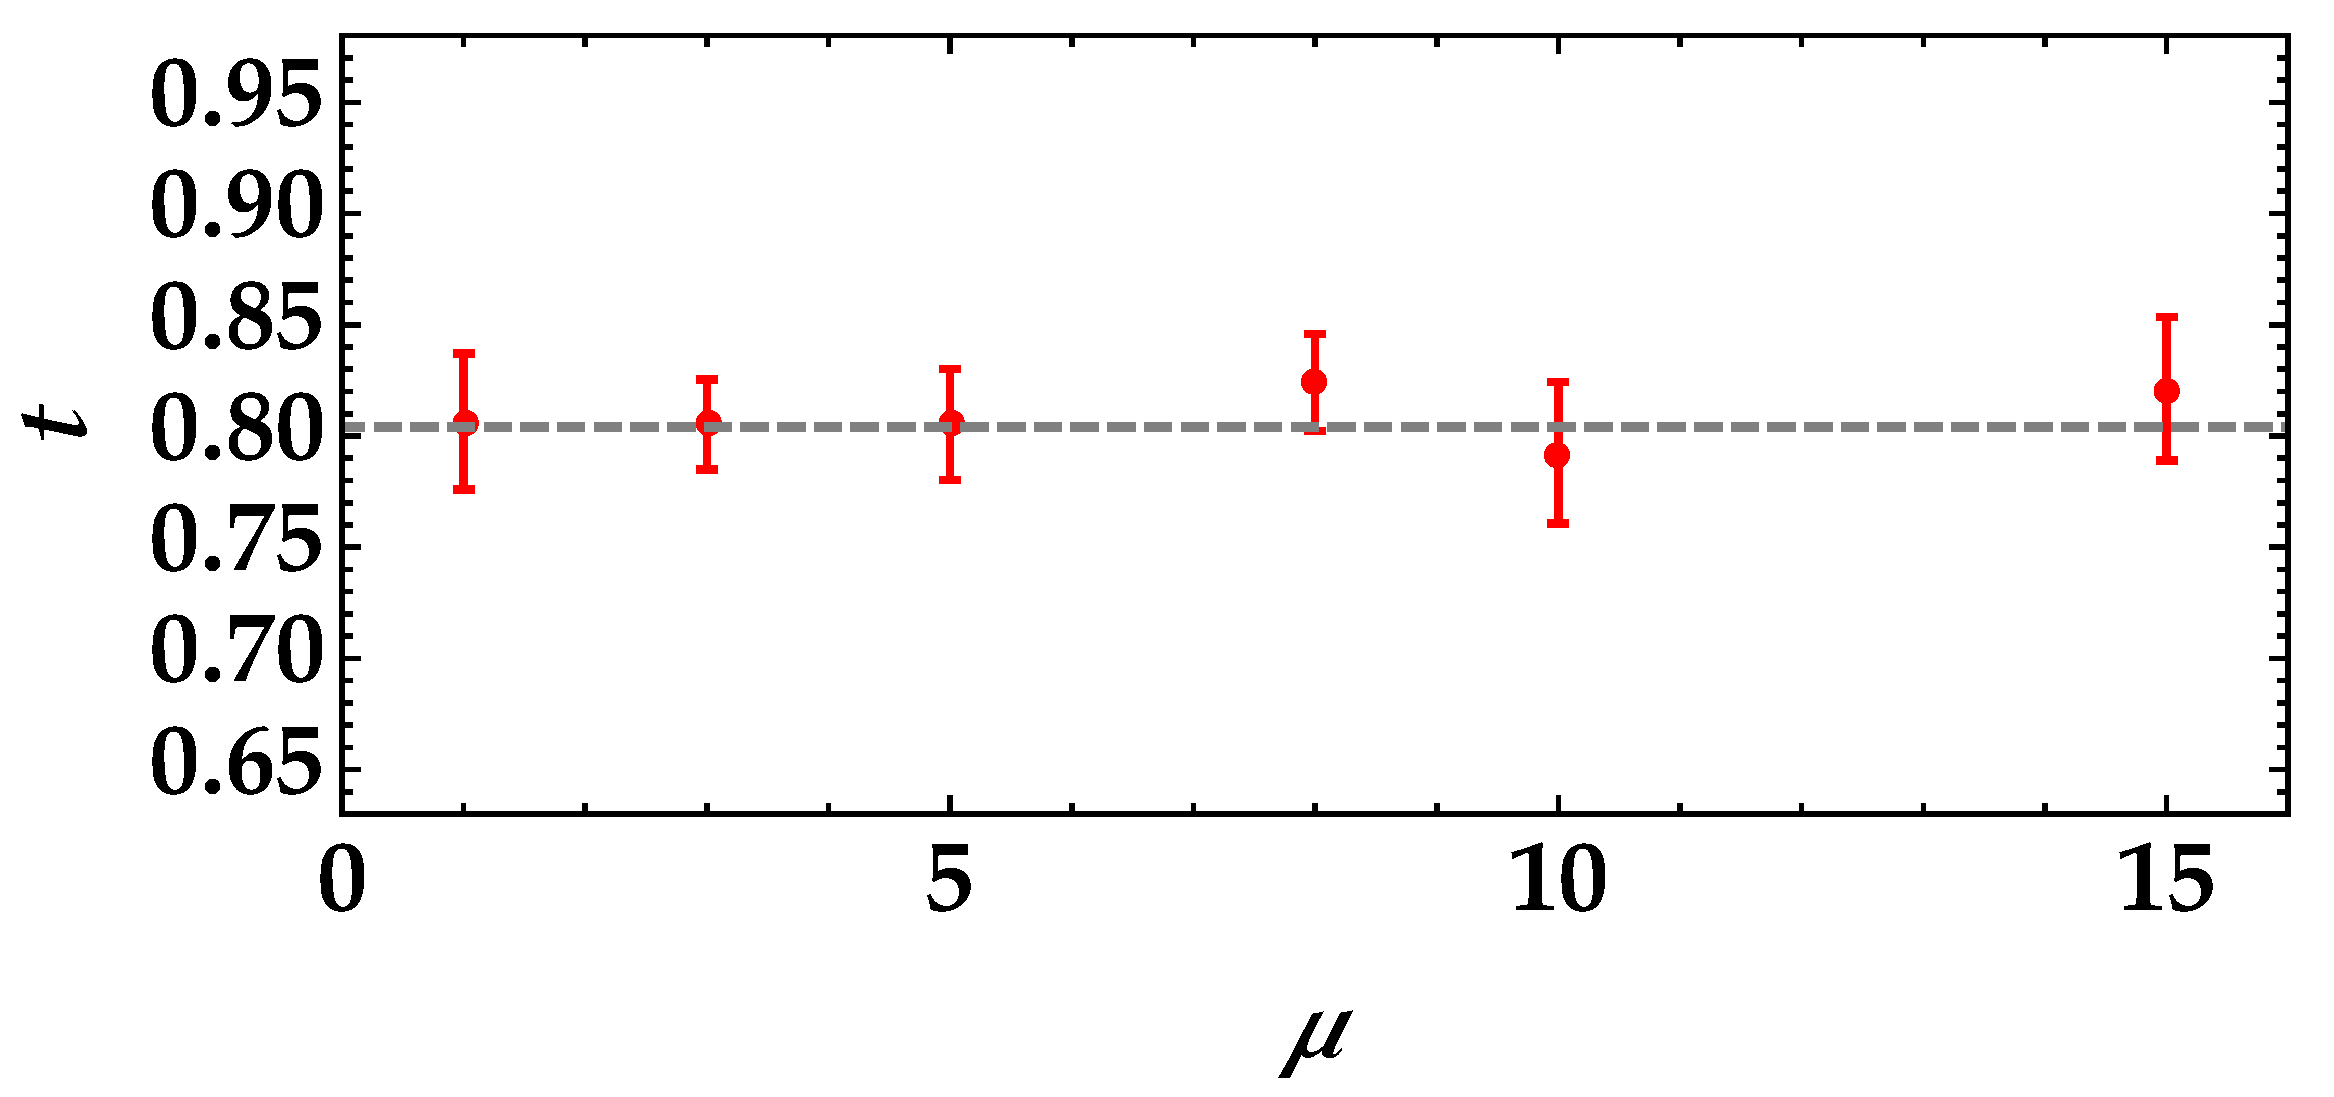
Based on these considerations, as a third test, we considered the case in which the neutral-density filter inserted in the transmitted arm has a transmittance t = 0.920 ± 0.001 . By employing a single-mode pseudothermal state divided at a beam splitter, from the fit of R as a function of the mean number of photons per mode shown in Figure 10, we obtained t = 0.92 ± 0.09 . The value perfectly matches the expected one, thus proving that the strategy still works for an object with a high transmittance value.

5. Discussion

In this work, we showed that the calculation of the noise reduction factor in the case of a mesoscopic multi-mode pseudothermal state divided at a balanced BS represents a good strategy to extract information about the transmission coefficient of an object placed at one of the two BS outputs. We showed the role played by the parameters involved in the expression of R, and in particular, we proved that the most critical one is the mean number of photons per mode.
From the experimental point of view, the most difficult aspect is the proper collection of correlated modes. If this is not the case, spurious light is collected together with the correlated one. Nevertheless, the developed model for the noise reduction factor also including noise sources can be exploited to still extract information about the transmission coefficient of the object. In this sense, our strategy can be preferred to a simple absorption measurement, since it is able to discriminate between the correct signal and spurious light.
The good quality of the experimental results, obtained by employing HPDs, a commercial class of PNR detectors, claims further experimental improvements in order to enhance the precision of the method. For instance, better results can be achieved by slightly increasing the dynamic range. This can be obtained by employing silicon photomultipliers instead of HPDs.

6. Conclusions

The experimental work presented in this paper opens new perspectives in the imaging context: it exploited the almost unexplored mesoscopic intensity regime and was based on the calculation of the noise reduction factor between the two outputs of a balanced BS at which a pseudothermal state of light was divided. The results achieved so far can now be optimized in order to make the method more precise. Moreover, this novel strategy can be used to determine the properties of more complex objects, such as masks endowed with different transmission coefficients. In this case, arrays of PNR detectors could be exploited, such as matrices of silicon photomultipliers and CMOS cameras, in which each pixel has PNR capability.

Funding

This research received no external funding.

Institutional Review Board Statement

Not applicable.

Informed Consent Statement

Not applicable.

Data Availability Statement

Data underlying the results presented in this paper are not publicly available at this time, but may be obtained from the author upon reasonable request.

Acknowledgments

The author acknowledges the Project “Investigating the effect of noise sources in the free-space transmission of mesoscopic quantum states of light”, supported by the University of Insubria.

Conflicts of Interest

The author declares no conflict of interest.

Abbreviations

The following abbreviations are used in this manuscript:
GIghost imaging
PNRphoton number resolving
CMOScomplementary metal oxide semiconductor
BSbeam splitter
HPDhybrid photodetector

References

  1. Samantaray, N.; Ruo-Berchera, I.; Meda, A.; Genovese, M. Realization of the first sub-shot-noise wide field microscope. Light Sci. Appl. 2017, 6, e17005. [Google Scholar] [CrossRef] [PubMed] [Green Version]
  2. Meda, A.; Losero, E.; Samantaray, N.; Scafirimuto, F.; Pradyumna, S.; Avella, A.; Ruo-Berchera, I.; Genovese, M. Photon-number correlation for quantum enhanced imaging and sensing. J. Opt. 2017, 19, 094002. [Google Scholar] [CrossRef] [Green Version]
  3. Ruo-Berchera, I.; Meda, A.; Losero, E.; Avella, A.; Santamaray, N.; Genovese, M. Improving resolution-sensitivity trade off in sub-shot noise quantum imaging. Appl. Phys. Lett. 2020, 116, 214001. [Google Scholar] [CrossRef]
  4. D’Angelo, M.; Shih, Y.H. Quantum Imaging. Laser Phys. Lett. 2005, 2, 567–596. [Google Scholar] [CrossRef]
  5. Gatti, A.; Brambilla, E.; Lugiato, L.A. Quantum imaging. Prog. Opt. 2008, 51, 251–348. [Google Scholar]
  6. Klyshko, D. Photons and Nonlinear Optics; Gordon and Breach: New York, NY, USA, 1988. [Google Scholar]
  7. Pittman, T.B.; Shih, Y.H.; Strekalov, D.V.; Sergienko, A.V. Optical imaging by means of two-photon quantum entanglement. Phys. Rev. A 1995, 52, R3429. [Google Scholar] [CrossRef]
  8. Abouraddy, A.F.; Saleh, B.E.A.; Sergienko, A.V.; Teich, M.C. Role of Entanglement in Two-Photon Imaging. Phys. Rev. Lett. 2001, 87, 123602. [Google Scholar] [CrossRef] [Green Version]
  9. Abouraddy, A.F.; Stone, P.R.; Sergienko, A.V.; Saleh, B.E.A.; Teich, M.C. Entangled-Photon Imaging of a Pure Phase Object. Phys. Rev. Lett. 2004, 93, 213903. [Google Scholar] [CrossRef] [Green Version]
  10. Zhang, D.; Zhai, Y.H.; Wu, L.A.; Chen, X.H. Correlated two-photon imaging with true thermal light. Opt. Lett. 2005, 30, 2354. [Google Scholar] [CrossRef] [Green Version]
  11. Ferri, F.; Magatti, D.; Gatti, A.; Bache, M.; Brambilla, E.; Lugiato, L.A. High-Resolution Ghost Image and Ghost Diffraction Experiments with Thermal Light. Phys. Rev. Lett. 2005, 94, 183602. [Google Scholar] [CrossRef] [Green Version]
  12. Bondani, M.; Allevi, A.; Andreoni, A. Ghost imaging by intense multimode twin beam. Eur. Phys. J. Spec. Top. 2012, 203, 151–161. [Google Scholar] [CrossRef]
  13. Iskhakov, T.; Allevi, A.; Kalashnikov, D.A.; Sala, V.G.; Takeuchi, M.; Bondani, M.; Chekhova, M. Intensity correlations of thermal light. Eur. Phys. J. Spec. Top. 2011, 199, 127–138. [Google Scholar] [CrossRef]
  14. Gatti, A.; Bondani, M.; Lugiato, L.A.; Paris, M.G.A.; Fabre, C. Comment on “Can Two-Photon Correlation of Chaotic Light Be Considered as Correlation of Intensity Fluctuations”. Phys. Rev. Lett. 2007, 98, 039301. [Google Scholar] [CrossRef] [Green Version]
  15. Erkmen, B.I.; Shapiro, J.H. Signal-to-noise ratio of Gaussian-state ghost imaging. Phys. Rev. A 2009, 79, 023833. [Google Scholar] [CrossRef] [Green Version]
  16. Mueller, J.D.; Samantaray, N.; Matthews, J.C.F. A practical model of twin-beam experiments for sub-shot-noise absorption measurements. Appl. Phys. Lett. 2020, 117, 034001. [Google Scholar] [CrossRef]
  17. Chiuri, A.; Gianani, I.; Cimini, V.; De Dominicis, L.; Genoni, M.G.; Barbieri, M. Ghost imaging as loss estimation: Quantum versus classical schemes. Phys. Rev. A 2022, 105, 013506. [Google Scholar] [CrossRef]
  18. Cardoso, A.C.; Berruezo, L.P.; A´vila, D.F.; Lemos, G.B.; Pimenta, W.M.; Monken, C.H.; Saldanha, P.L.; Pa´dua, S. Classical imaging with undetected light. Phys. Rev. A 2018, 97, 033827. [Google Scholar] [CrossRef] [Green Version]
  19. Ferri, F.; Magatti, D.; Lugiato, L.A.; Gatti, A. Differential Ghost Imaging. Phys. Rev. Lett. 2010, 104, 253603. [Google Scholar] [CrossRef] [Green Version]
  20. Allevi, A.; Bondani, M. Effect of noisy channels on the transmission of mesoscopic twin-beam states. Opt. Express 2021, 29, 32842–32852. [Google Scholar] [CrossRef]
  21. Allevi, A.; Bondani, M. Preserving nonclassical correlations in strongly unbalanced conditions. J. Opt. Soc. Am. B 2019, 36, 3275–3281. [Google Scholar] [CrossRef]
  22. Allevi, A.; Bondani, M. Tailoring asymmetric lossy channels to test the robustness of mesoscopic quantum states of light. Appl. Sci. 2020, 10, 9094. [Google Scholar] [CrossRef]
  23. Chesi, G.; Malinverno, L.; Allevi, A.; Santoro, R.; Caccia, M.; Bondani, M. Measuring nonclassicality with silicon photomultipliers. Opt. Lett. 2019, 44, 1371–1374. [Google Scholar] [CrossRef] [Green Version]
  24. Cassina, S.; Allevi, A.; Mascagna, V.; Prest, M.; Vallazza, E.; Bondani, M. Exploiting the wide dynamic range of silicon photomultipliers for quantum optics applications. EPJ Quantum Technol. 2021, 8, 4. [Google Scholar] [CrossRef]
  25. Available online: https://www.hamamatsu.com/eu/en/product/cameras/qcmos-cameras/C15550-20UP.html (accessed on 18 August 2022).
  26. Agliati, A.; Bondani, M.; Andreoni, A.; De Cillis, G.; Paris, M.G.A. Quantum and classical correlations of intense beams of light investigated via joint photodetection. J. Opt. B Quantum Semiclassical Opt. 2005, 7, S652–S663. [Google Scholar] [CrossRef] [Green Version]
  27. Bondani, M.; Allevi, A.; Zambra, G.; Paris, M.G.A.; Andreoni, A. Sub-shot-noise photon-number correlation in a mesoscopic twin beam of light. Phys. Rev. A 2007, 76, 013833. [Google Scholar] [CrossRef] [Green Version]
  28. Allevi, A.; Bondani, M. Nonlinear and quantum optical properties and applications of intense twin-beams. Adv. At. Mol. Opt. Phys. 2017, 66, 49–110. [Google Scholar]
  29. Allevi, A.; Bondani, M. Multi-mode twin-beam states in the mesoscopic intensity domain. Phys. Lett. A 2022, 423, 127828. [Google Scholar] [CrossRef]
  30. Arkhipov, I.I.; Perˇina, J., Jr.; Perˇina, J.; Miranowicz, A. Comparative study of nonclassicality, entanglement, and dimensionality of multimode noisy twin beams. Phys. Rev. A 2015, 91, 033837. [Google Scholar] [CrossRef] [Green Version]
  31. Micha´lek, V.; Perˇina, J., Jr.; Haderka, O. Experimental quantification of the entanglement of noisy twin beams. Phys. Rev. Appl. 2020, 14, 024003. [Google Scholar] [CrossRef]
  32. Perˇina, J., Jr.; Haderka, O.; Allevi, A.; Bondani, M. Absolute calibration of photon-number-resolving detectors with an analog output using twin beams. Appl. Phys. Lett. 2014, 104, 041113. [Google Scholar] [CrossRef] [Green Version]
  33. Machulka, R.; Haderka, O.; Perˇina, J., Jr.; Lamperti, M.; Allevi, A.; Bondani, M. Spatial properties of twin-beam correlations at low- to high-intensity transition. Opt. Express 2014, 22, 13374–13379. [Google Scholar] [CrossRef] [Green Version]
  34. Allevi, A.; Jedrkiewicz, O.; Brambilla, E.; Gatti, A.; Perˇina, J., Jr.; Haderka, O.; Bondani, M. Coherence properties of high-gain twin beams. Phys. Rev. A 2014, 90, 063812. [Google Scholar] [CrossRef]
  35. Bondani, M.; Allevi, A.; Agliati, A.; Andreoni, A. Self-consistent characterization of light statistics. J. Mod. Opt. 2009, 56, 226–231. [Google Scholar] [CrossRef]
  36. Mandel, L.; Wolf, E. Optical Coherence and Quantum Optics; Cambridge University Press: Cambridge, UK, 1995. [Google Scholar]
Figure 1. R as a function of the mean number of photons for t = 0.9 , μ = 1 , and η = 0.25 in the case of a multi-mode twin-beam state (black curve) and a multi-mode pseudothermal state (red curve). The gray dashed line at R = 1 defines the boundary condition between classical and quantum correlations.
Photonics 09 00819 g001
Figure 2. Sketch of the experimental setup. M: mirror; L 1 : 200 mm-focal-length lens; GD: rotating ground-glass disk; L 2 : 200 mm-focal-length lens; PH: pin-hole; I: variable iris; BS: balanced beam splitter; OBJ: object; L: achromatic doublet; MF: multi-mode optical fiber; HPD: hybrid photodetector.
Photonics 09 00819 g002
Figure 3. Photon-number distributions of detected photons in semi-log scale for almost the same mean value and three different choices of μ . In Panel (a), m = 0.53 and μ = 1.00 ± 0.02 ; in (b), m = 0.49 and μ = 2.65 ± 0.04 ; in (c), m = 0.54 and μ = 5.12 ± 0.07 .
Photonics 09 00819 g003
Figure 4. R as a function of the mean number of photons per mode for three different values of μ . The data are shown as colored dots + error bars, while the theoretical curves according to Equation (6) are shown as colored lines. From the fitting procedure, we obtain the value of t. In particular, in Panel (a), t = 0.54 ± 0.02 (case μ = 1.03 ± 0.01 ), in Panel (b), t = 0.46 ± 0.01 (case μ = 2.8 ± 0.1 ), and in Panel (c), t = 0.45 ± 0.03 (case μ = 6.2 ± 0.3 ).
Photonics 09 00819 g004
Figure 5. R as a function of the mean number of photons for μ = 2.8 ± 0.1 (Panel (a)) and μ = 6.2 ± 0.3 (Panel (b)). The data are shown as colored dots + error bars, while the theoretical curves according to Equation (8) are shown as colored lines. From the fitting procedure, we obtain the value of t. In particular, in Panel (a), t = 0.55 ± 0.02 , and in Panel (b), t = 0.56 ± 0.03 . The other parameters are m N = 0.09 ± 0.03 and μ N = 1.0 ± 0.1 in Panel (a) and m N = 0.15 ± 0.03 and μ N = 2.5 ± 0.3 in Panel (b).
Photonics 09 00819 g005
Figure 6. Values of t obtained fitting the data according to Equation (6) (red dots) and Equation (8) (blue dots) as a function of the number of modes. The gray dashed line represents the expected value t = 0.550 .
Photonics 09 00819 g006
Figure 7. R as a function of the mean number of photons per mode for two different values of μ . The data are shown as colored dots + error bars, while the theoretical curves according to Equation (6) are shown as colored lines. From the fitting procedure, we obtain the value of t. In particular, in Panel (a), t = 0.81 ± 0.03 (case μ = 1.05 ± 0.02 ), and in Panel (b), t = 0.78 ± 0.03 (case μ = 3.7 ± 0.1 ).
Photonics 09 00819 g007
Figure 8. Values of t obtained fitting the data according to Equation (6) as a function of the number of modes. The gray dashed line represents the expected value t = 0.804 .
Photonics 09 00819 g008
Figure 9. Values of t obtained fitting the data according to Equation (6) as a function of the number of modes, in the case in which the mean number of photons per mode is constant. The gray dashed line represents the expected value t = 0.804 .
Photonics 09 00819 g009
Figure 10. R as a function of the mean number of photons per mode for μ = 1.08 ± 0.02 . The data are shown as black dots + error bars, while the theoretical curve according to Equation (6) is shown as a black line. From the fitting procedure, we obtain t = 0.92 ± 0.09 .
Photonics 09 00819 g010
Publisher’s Note: MDPI stays neutral with regard to jurisdictional claims in published maps and institutional affiliations.

