Article

Performance Analysis of SOA and BPF Integration for S-, C-, and L-Band Photonic UWB Pulse Generation


by
Meryem Filiz
1,* and
Ömer Galip Saraçoğlu
2
1
Graduate School of Natural and Applied Sciences, Electrical and Electronics Engineering, Erciyes University, 38039 Kayseri, Turkey
2
Electrical and Electronics Engineering, Faculty of Engineering, Erciyes University, 38039 Kayseri, Turkey
*
Author to whom correspondence should be addressed.
Photonics 2026, 13(5), 402; https://doi.org/10.3390/photonics13050402
Submission received: 26 March 2026 / Revised: 17 April 2026 / Accepted: 17 April 2026 / Published: 22 April 2026
(This article belongs to the Special Issue Advanced Optical Fiber Communication)

Abstract

In this study, a simulation-based investigation of the variations of the bit error rate (BER) and the maximum quality factor are presented for short- (S-), conventional- (C-), and long- (L-) band wavelengths in a photonic ultra-wideband (UWB) circuit using a semiconductor optical amplifier (SOA) with different bias currents and a bandpass filter (BPF). Gaussian quadruplet UWB pulses are generated at the S-, C-, and L-band wavelengths, which are commonly used in fiber transmission lines. An analysis of the temporal and spectral features of the generated pulses is carried out. The highest maximum quality factor and the lowest minimum BER are obtained in the C-band at an SOA bias current of 150 mA. This study simultaneously investigates both UWB pulse generation and transmission performance. The proposed circuit has a simple design and high applicability, as it employs a SOA, a Gaussian optical filter, a low-pass filter (LPF) and a single BPF.

1. Introduction

The rapid expansion of social media platforms, virtual reality, interactive gaming, and the internet has led to an ever-growing demand for higher bandwidth and communication capacity. As technology advances, the communication industry continues to evolve rapidly. Photonics and ultra-wideband (UWB) systems have become increasingly intertwined. UWB technology offers numerous advantages, including a large bandwidth, low power consumption, high accuracy, sensitivity, low interference, high security, multifunctional usability, high data rates, low latency, long transmission ranges, and energy efficiency [1]. Initially designed for home networking applications, UWB technology has now been adopted across various domains—largely owing to the advancements in optical fiber communication. The generation and transmission of UWB pulses over fiber have led to the development of Ultra-Wideband over Fiber (UWBoF) systems, where the primary objective is to generate UWB signals in the optical domain. As UWBoF technology progresses, the use of UWB in advanced transmission technologies such as Wavelength Division Multiplexing (WDM) has increased. The definitions and limitations of UWB transmission have been established by the Federal Communications Commission (FCC) [2]. UWB occupies a spectral range between 3.1 GHz and 10.6 GHz with a 7.5 GHz bandwidth and a maximum effective isotropic radiated power of −41.3 dBm/MHz, enabling communication at extremely low energy levels [1]. To enable the long-distance operation of UWBoF systems, researchers have focused on optical amplifiers and fiber wavelength optimization. Commonly used optical amplifiers in fiber transmission include Raman amplifiers, doped fiber amplifiers (DFA), and semiconductor optical amplifiers (SOA) [3]. Among these, the SOA stands out due to its nonlinear gain characteristics, compactness, and ease of integration with other photonic components [4].
One of the most widely adopted techniques for photonic UWB pulse generation is the phase modulation to intensity modulation (PM–IM) conversion method [5]. The nonlinear characteristics of SOAs can also be utilized to produce UWB pulses in photonic circuits. Compared with other types of optical amplifiers, SOAs exhibit higher power efficiency and superior integration compatibility with optical devices. They offer low power consumption, short response times, high stability, a compact structure, and cost-effectiveness [6]. The application of SOAs in optical networks provides additional functionalities that are not achievable with fiber amplifiers due to nonlinear photon interactions within the semiconductor medium. These interactions enable useful effects such as all-optical signal processing and switching [7]. SOA-based cross-gain modulation (XGM) is relatively easy to implement and exhibits impressive performance at high bit rates. Moreover, XGM provides high conversion efficiency and is polarization insensitive [8]. Compared with fiber-based techniques, wavelength conversion methods using SOAs are advantageous due to their high gain, large saturation output power, wide gain bandwidth, compact design, and integrability with other photonic devices. Optical wavelength converters play an essential role in broadband optical networks, particularly in preventing wavelength blocking in WDM cross-connects [8,9]. In addition to their nonlinear amplification capability, SOAs are important building blocks in integrated photonic systems due to their compact structure, fast response, and compatibility with passive waveguides. Previous studies have investigated SOA design and applications in different communication bands, including issues such as gain characteristics, polarization sensitivity, and device integration, and in many cases have supported simulation results with experimental verification. These studies further demonstrate the importance of SOAs in broadband optical communication systems [10,11,12,13,14,15].
Raz et al. [16] significantly enhanced the performance of SOA–XGM-based wavelength conversion with adaptive filters that have adjustable bandwidth, wavelength tunability, and sharp spectral roll-off. Mazlan et al. [17] demonstrated an easy wavelength converter using an SOA, an erbium-DFA (EDFA), and a bandpass filter (BPF) in the C-band. By operating the SOA at a bias current of 700 mA, they achieved wavelength conversion at 40 Gb/s, suitable for dense WDM (DWDM) systems. Taki et al. [18] generated Gaussian quadruplet and quintuplet UWB pulses by adjusting the SOA bias current to 100, 150, and 200 mA without using optical filters. Pei et al. [19] designed a WDM system using PM–IM conversion without amplifiers, using BPF and low-pass filter (LPF) components to transmit mono- and doublet-type Gaussian UWB pulses simultaneously, achieving a fractional bandwidth (FBW) of 166%. Renaudier et al. [20] studied transmission performance at short (S), conventional (C), and long (L) wavelengths in WDM systems using SOAs and compared the signal-to-noise ratio (SNR) across wavelengths. They reported the SNR order as C, L, and S. Hamaoka et al. [21] examined maximum quality factors for S-, C-, and L-band transmissions using DFAs without filtering, finding the order C > L > S. Nielsen et al. [22] presented a simple all-optical wavelength converter in the C-band based on a single SOA, EDFA, and BPF, capable of 40 Gb/s while maintaining the return-to-zero (RZ) data format and polarity with minimal pulse energy. Wang [23] used EDFA and optical filtering to create mono- and doublet-type Gaussian UWB pulses with FBWs of 84% and 85%.
The photonic circuit includes a phase modulator (PM), Mach–Zehnder modulator (MZM), transmission fiber, optical filters, and a photodetector [24]. In this study, the generation and transmission of UWB Gaussian pulses over fiber are examined for S-, C-, and L-band wavelengths using SOA and BPF in a photonic UWB circuit. A high-quality communication system has a maximum quality factor and a low bit error rate (BER). In the proposed photonic UWB circuit, Gaussian pulses were generated through PM-IM conversion. The effects of varying SOA bias currents (100, 150, and 200 mA) and BPF inclusion on system performance were analyzed. Gaussian quadruplet pulses with an FBW of 100% were obtained for all wavelengths. Compared to the results presented by Taki et al. [18] under similar SOA bias conditions, the proposed system achieves improved bandwidth performance. The maximum quality factor for SOA currents of 100 and 150 mA followed the order C > S > L, while at 200 mA, it was S > L > C. The BER ranking reflected the same trend from lowest to highest values. Although similar approaches exist, this study presents a photonic UWB generation approach that integrates a single SOA and a single BPF within the same circuit architecture.
Although various photonic UWB generation techniques have been reported in the literature, the combined influence of SOA bias current and wavelength band selection on UWB pulse generation and transmission performance has not been systematically and comprehensively analyzed within a single photonic circuit architecture.
In particular, the relationship between SOA operating conditions and key performance metrics such as BER, maximum quality factor, and spectral characteristics across the S-, C-, and L-band wavelength regions has not been sufficiently investigated. Therefore, the main objective of this study is to evaluate, through simulation, the impact of SOA bias current and wavelength band selection on photonic UWB pulse generation and transmission performance. In this context, the influence of different SOA bias currents on BER, maximum quality factor, and spectral behavior across the S-, C-, and L-band wavelength regions is analyzed in a photonic UWB circuit employing a single SOA and a band-pass filter.
Unlike previous PM–IM-based UWB studies that primarily focused on either pulse shaping or transmission alone, this work presents a unified analysis of pulse generation and transmission quality by integrating a single SOA and a single BPF within the same photonic circuit, systematically evaluating wavelength-dependent performance across the S-, C-, and L-bands. To the best of our knowledge, such a comprehensive and unified evaluation of UWB pulse generation and transmission performance across S-, C-, and L-bands within a single SOA–BPF integrated PM–IM framework has not been extensively reported.

2. System Model and Methods

2.1. Transmission Line and Gaussian Pulse

The International Telecommunication Union (ITU) has defined several wavelength bands for single-mode optical fibers, as shown in Table 1 [25]. Among these bands, the C-band has the lowest loss, followed by the L-band. The C-band is commonly used in applications such as WDM technologies. Many studies have investigated the use of S + C, C + L, and S + C + L wavelength combinations to address increasing data traffic needs. These combinations achieve higher transmission speeds and capacities through different amplification and wavelength bands [26].
The FBW parameter is used to classify a signal as narrowband, wideband, or UWB. It is defined in Equation (1), where B W represents the bandwidth, and f L , f H , and f C are the lower, upper, and center frequencies, respectively [19]:
F B W = B W f C = ( f H f L ) ( f H + f L ) / 2   .
The Gaussian pulse x(t) is expressed in Equation (2). In this equation, σ 2 and A denote the pulse variance and amplitude, respectively:
x t = A 2 π σ 2 e ( t 2 2 σ 2 )   .
According to the Equation (2), if the superscript is expressed as (n), the nth derivative of the Gaussian pulse can be found in Equation (3):
x n t = n 1 σ 2 x n 2 t t σ 2 x n 1 t .
The Fourier transform of the n-th derivative of the Gaussian pulse is shown in Equation (4):
x n f = A ( j 2 π f ) n e 2 π f σ 2 2   .
Based on the Fourier transform in Equation (4), the power spectral density (PSD) of the n -th derivative Gaussian pulse is given in Equation (5):
P S D n ( f ) = x n ( f ) 2 = A 2 ( 2 π f ) 2 n e 2 π f σ 2 .
A normalized form of the PSD can also be considered for comparative analysis. This expression represents the spectral energy distribution of the generated UWB pulse. By adjusting the pulse variance and the derivative order, the Gaussian pulse can be shaped to closely match the FCC spectral mask and maximize bandwidth utilization. In this way, the PSD of the generated pulse can be optimized to meet FCC requirements [27].

2.2. PM-IM Conversion Principle

In the PM–IM conversion process, a Gaussian baseband signal modulates an optical carrier through a phase modulator. The resulting phase-modulated optical signal is then passed through an optical intensity-modulating stage and is converted into an electrical UWB signal by a photodetector. Figure 1 shows the schematic diagram of the simulated photonic communication circuit used for PM–IM conversion [19]. In the basic configuration, an optical filter is used after the phase modulation stage. Assuming x ( t ) represents the Gaussian pulse applied to the phase modulator, the phase-modulated optical signal can be described as follows:
A t = e x p [ j ω c t + j β P M x t ] ,
where β P M is the phase modulation coefficient and ω c is the optical carrier’s angular frequency. The optical filter has a frequency response defined as follows:
H d w = K ( ω ω 0 ) ,
where K is the slope of the optical filter’s transfer function and ω 0 is the frequency at which the response crosses zero. The filter output is then expressed as:
A o u t t = K ω c ω 0 A ( t ) .
Considering that the optical filter has a linear frequency response, its effect in the frequency domain corresponds to a differentiation operation in the time domain. By applying the Fourier transform to Equation (8) and using the differentiation property (i.e., a linear dependence on frequency in the frequency domain corresponds to time differentiation), the output signal is obtained as a superposition of the original signal and its first derivative. This leads to the expression given in Equation (9):
A o u t t = [ K ω c ω 0 + K β P M x ( t ) ] A ( t ) .
This behavior highlights that the PM–IM conversion process inherently performs a temporal differentiation, which is a key mechanism for generating higher-order Gaussian derivatives commonly used in UWB pulse shaping. After filtering, the phase of the modulated signal becomes intensity-dependent, effectively transforming the phase modulation into its first derivative. This forms the basis for UWB signal generation in the optical domain. The photodetector converts the optical field into an electrical current given by:
i P D t = K 2 ω c ω 0 2 + K 2 β P M 2 x t 2 + 2 K 2 ( ω c ω 0 ) β P M x ( t ) .
The DC component and higher-order terms in (10) can be simplified for small-signal conditions, resulting in the photodetector output being approximated as:
i s i g t = 2 K 2 ω c ω 0 β P M x t .
Hence, the optical filter output corresponds to the first derivative of the Gaussian pulse, producing an optical-domain UWB signal with steep rising and falling edges and low DC content and concentrated RF energy. As shown in Figure 1, the optical carrier undergoes phase modulation using a broadband Gaussian signal. One sideband of the phase-modulated signal is filtered by the optical filter to achieve the PM–IM conversion of UWB pulses. The optical field of the optical carrier after phase modulation is expressed as follows in Equation (12):
E t = P o   e x p j ω 0 t + ω m t .
where P 0 is the optical source power and ω m is the modulation frequency. This expression is consistent with the theoretical PM–IM conversion model. Since the amplitude remains constant, a direct current component would dominate the photodetector output without filtering. To obtain a single-frequency signal, the optical filter removes one of the sidebands, suppressing low-frequency components and preserving high-frequency UWB components in the final signal. This principle successfully generates a UWB pulse in the optical domain [19].
To provide further physical insight into the PM–IM conversion mechanism, it is important to note that the Gaussian pulse applied to the phase modulator introduces a time-varying phase shift on the optical carrier. When this phase-modulated signal passes through an optical filter with an approximately linear frequency response, the filtering operation acts as a differentiation process in the time domain. As a result, the output optical field becomes proportional to the first derivative of the input Gaussian pulse.
This transformation effectively converts phase variations into intensity variations, enabling the generation of UWB pulses with sharp temporal transitions and reduced low-frequency components. Physically, this corresponds to emphasizing rapid changes in the signal while suppressing slowly varying components, which is essential for achieving wide spectral occupancy within the FCC mask. All equations presented in this section are used to model the PM–IM conversion mechanism and to analyze the spectral and temporal characteristics of the generated UWB pulses.

2.3. Simulated and Developed Circuit

In this study, the simulation of a photonic UWB pulse generation circuit was carried out. The circuit proposed in [19] was modified by adding a SOA and a BPF. The effects of varying SOA bias currents—100, 150, and 200 mA—on system performance were analyzed in terms of frequency and time-domain responses, quality factor, and BER. The BER, defined as the ratio of incorrectly received bits to the total transmitted bits, and the maximum quality factor are key performance indicators for optical transmission systems.
The simulations were performed using OptiSystem version 22 (Optiwave Systems Inc., Ottawa, ON, Canada) and MATLAB R2025b (MathWorks, Natick, MA, USA) [28,29]. Most component parameters in OptiSystem 22.0 were kept at their default values, while some were adjusted for this specific application. The circuit consists of a user-defined bit sequence generator, a non-return-to-zero (NRZ) signal generator, a phase modulator (PM), a Gaussian optical filter, a photodiode, a low-pass filter (LPF), and a BPF. A continuous-wave (CW) laser operating in the C-band served as the optical source, and the nonlinear amplifier used in the circuit was a SOA. In this study, a travelling-wave SOA (TW-SOA) structure was employed due to its ability to support high-speed signal processing. The temporal response of the SOA is mainly governed by carrier recombination dynamics, which directly affects the gain recovery time and thus the achievable bit rate. In TW-SOAs, the short carrier lifetime allows fast gain recovery, making them suitable for high-speed UWB pulse generation and transmission. The system was analysed across the S, C, and L wavelength bands. The input bit sequence was “10,000,000” with a bit rate of 20 Gb/s and a fiber length of 20 km. These parameters were chosen to allow for clear comparison of quality factor and BER performance at different wavelengths and SOA current levels. The selected system parameters ensure a consistent and representative comparison framework. The 20 km fiber length provides a moderate transmission distance at which wavelength-dependent propagation effects can be observed clearly, while avoiding excessive degradation that could obscure the influence of SOA bias current. The 20 Gb/s bit rate was adopted to represent a high-speed operating condition relevant to photonic UWB transmission. The LPF and BPF settings were selected to ensure controlled spectral shaping and to enable a fair comparison of BER and maximum quality factor across the investigated wavelength bands. For each SOA bias current (100, 150, and 200 mA), the system’s temporal and spectral responses, BER, and quality factor were evaluated at S-, C-, and L-band wavelengths. Table 2 shows the characteristics of the SOA used in the simulation, while Table 3 presents the parameters of the LPF and BPF used in the circuit.
The linewidth enhancement factor (α) was taken as 5 from the OptiSystem SOA model parameters. This parameter is known to depend on the device structure and material system and may vary over a wide range in the literature [30]. The carrier lifetime is not explicitly specified in the OptiSystem SOA model but is considered based on typical values reported in the literature for travelling-wave SOAs. In particular, the carrier lifetime decreases with increasing injection level and can reach values on the order of hundreds of picoseconds under high injection conditions [31].
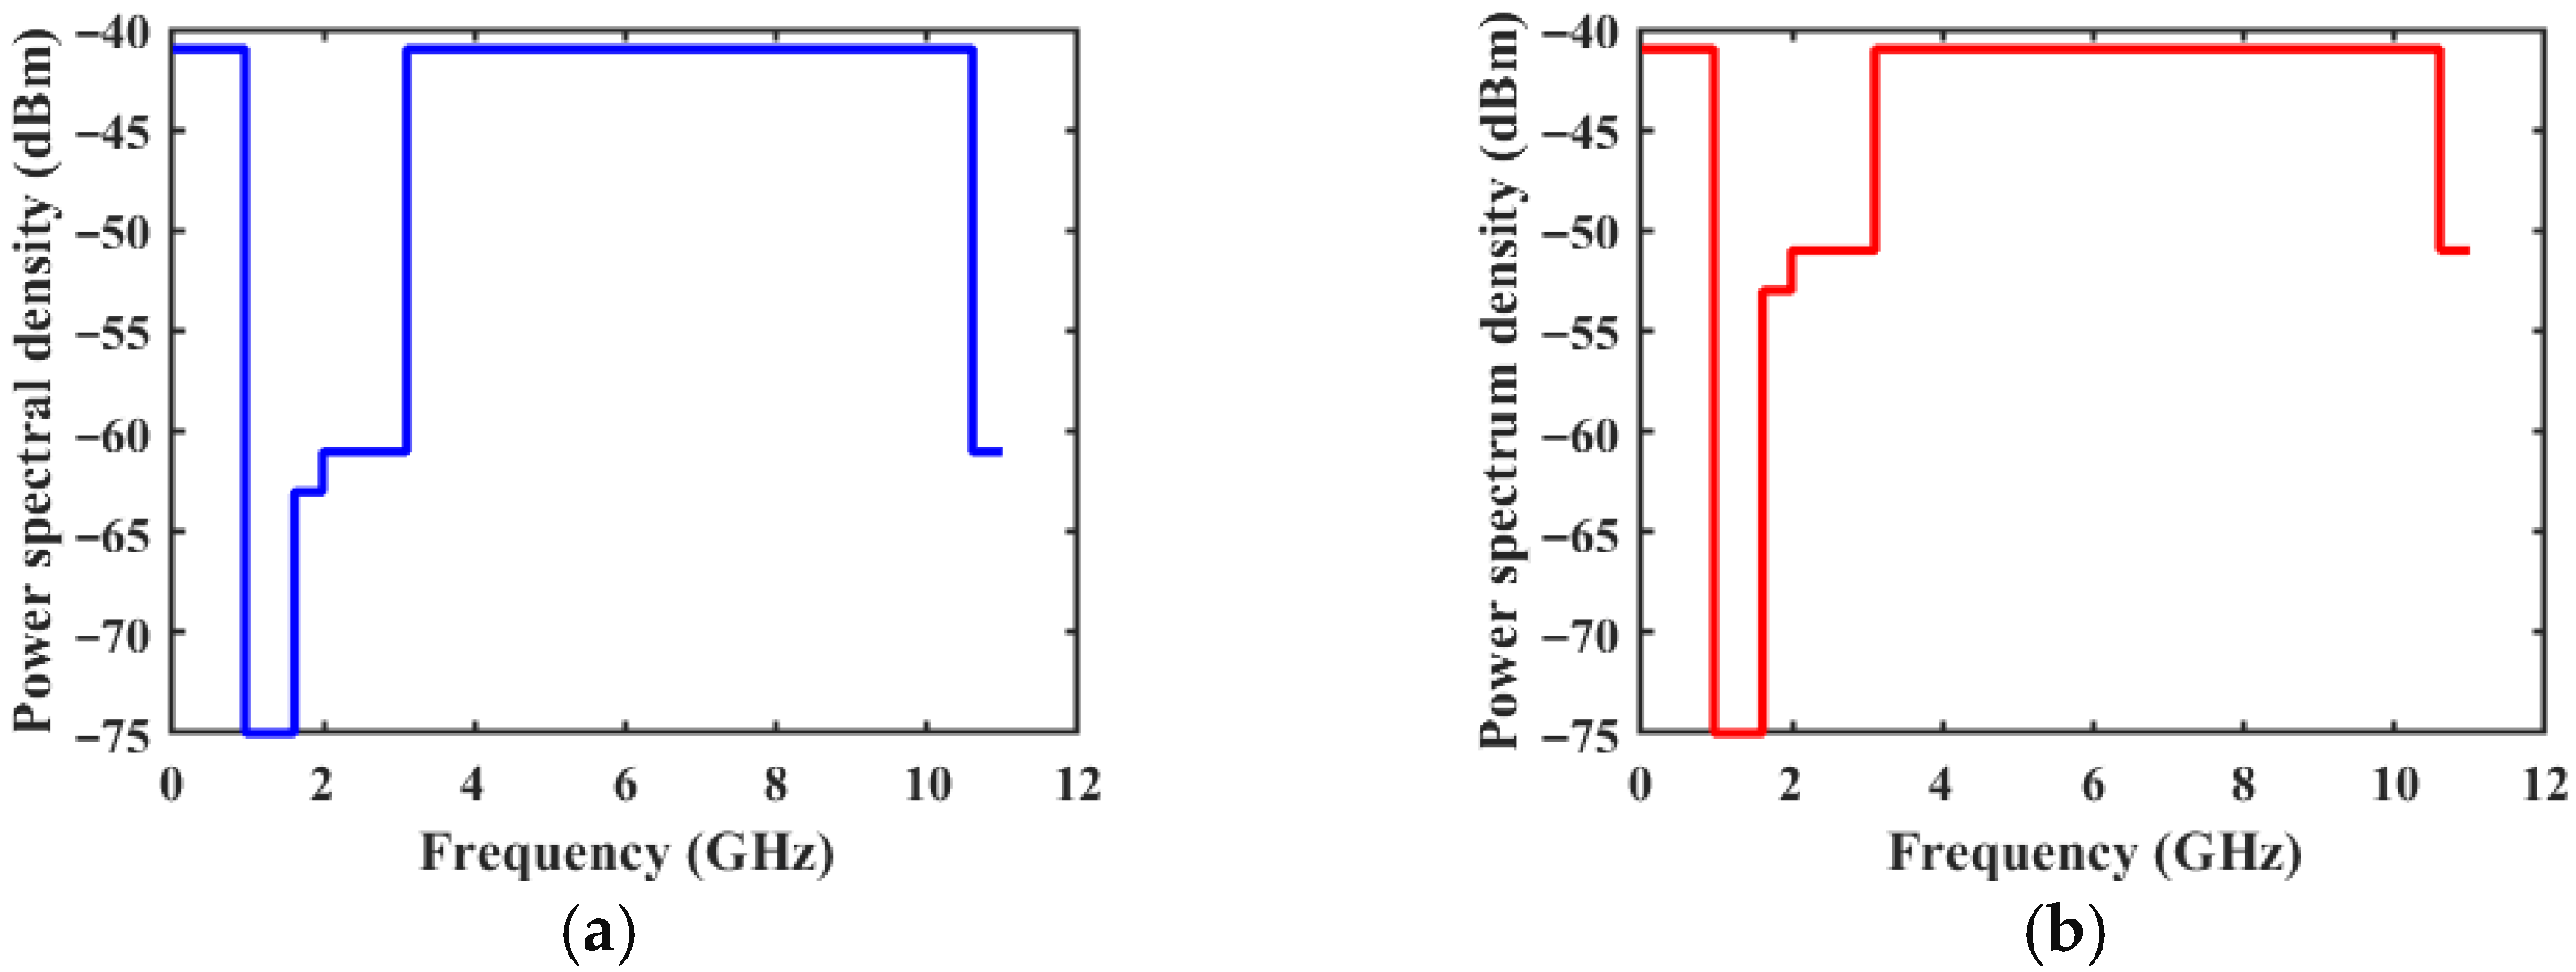
FCC spectral masks for indoor and outdoor UWB systems differ only slightly, as illustrated in Figure 2. In this study, the outdoor FCC mask was adopted. Although minor variations exist between countries—U.S. and Canadian regulations being more flexible, and European and Asian standards being stricter [32]—the FCC mask serves as the primary compliance reference.

3. Results and Evaluations

The effects of incorporating a SOA and a BPF into the photonic UWB pulse generation circuit were analyzed for SOA bias currents of 100, 150, and 200 mA for the S-, C-, and L-band wavelengths. The frequency- and time-domain characteristics, maximum quality factor, and BER were evaluated to assess system performance across the different conditions.

3.1. SOA Bias Current: 100 mA

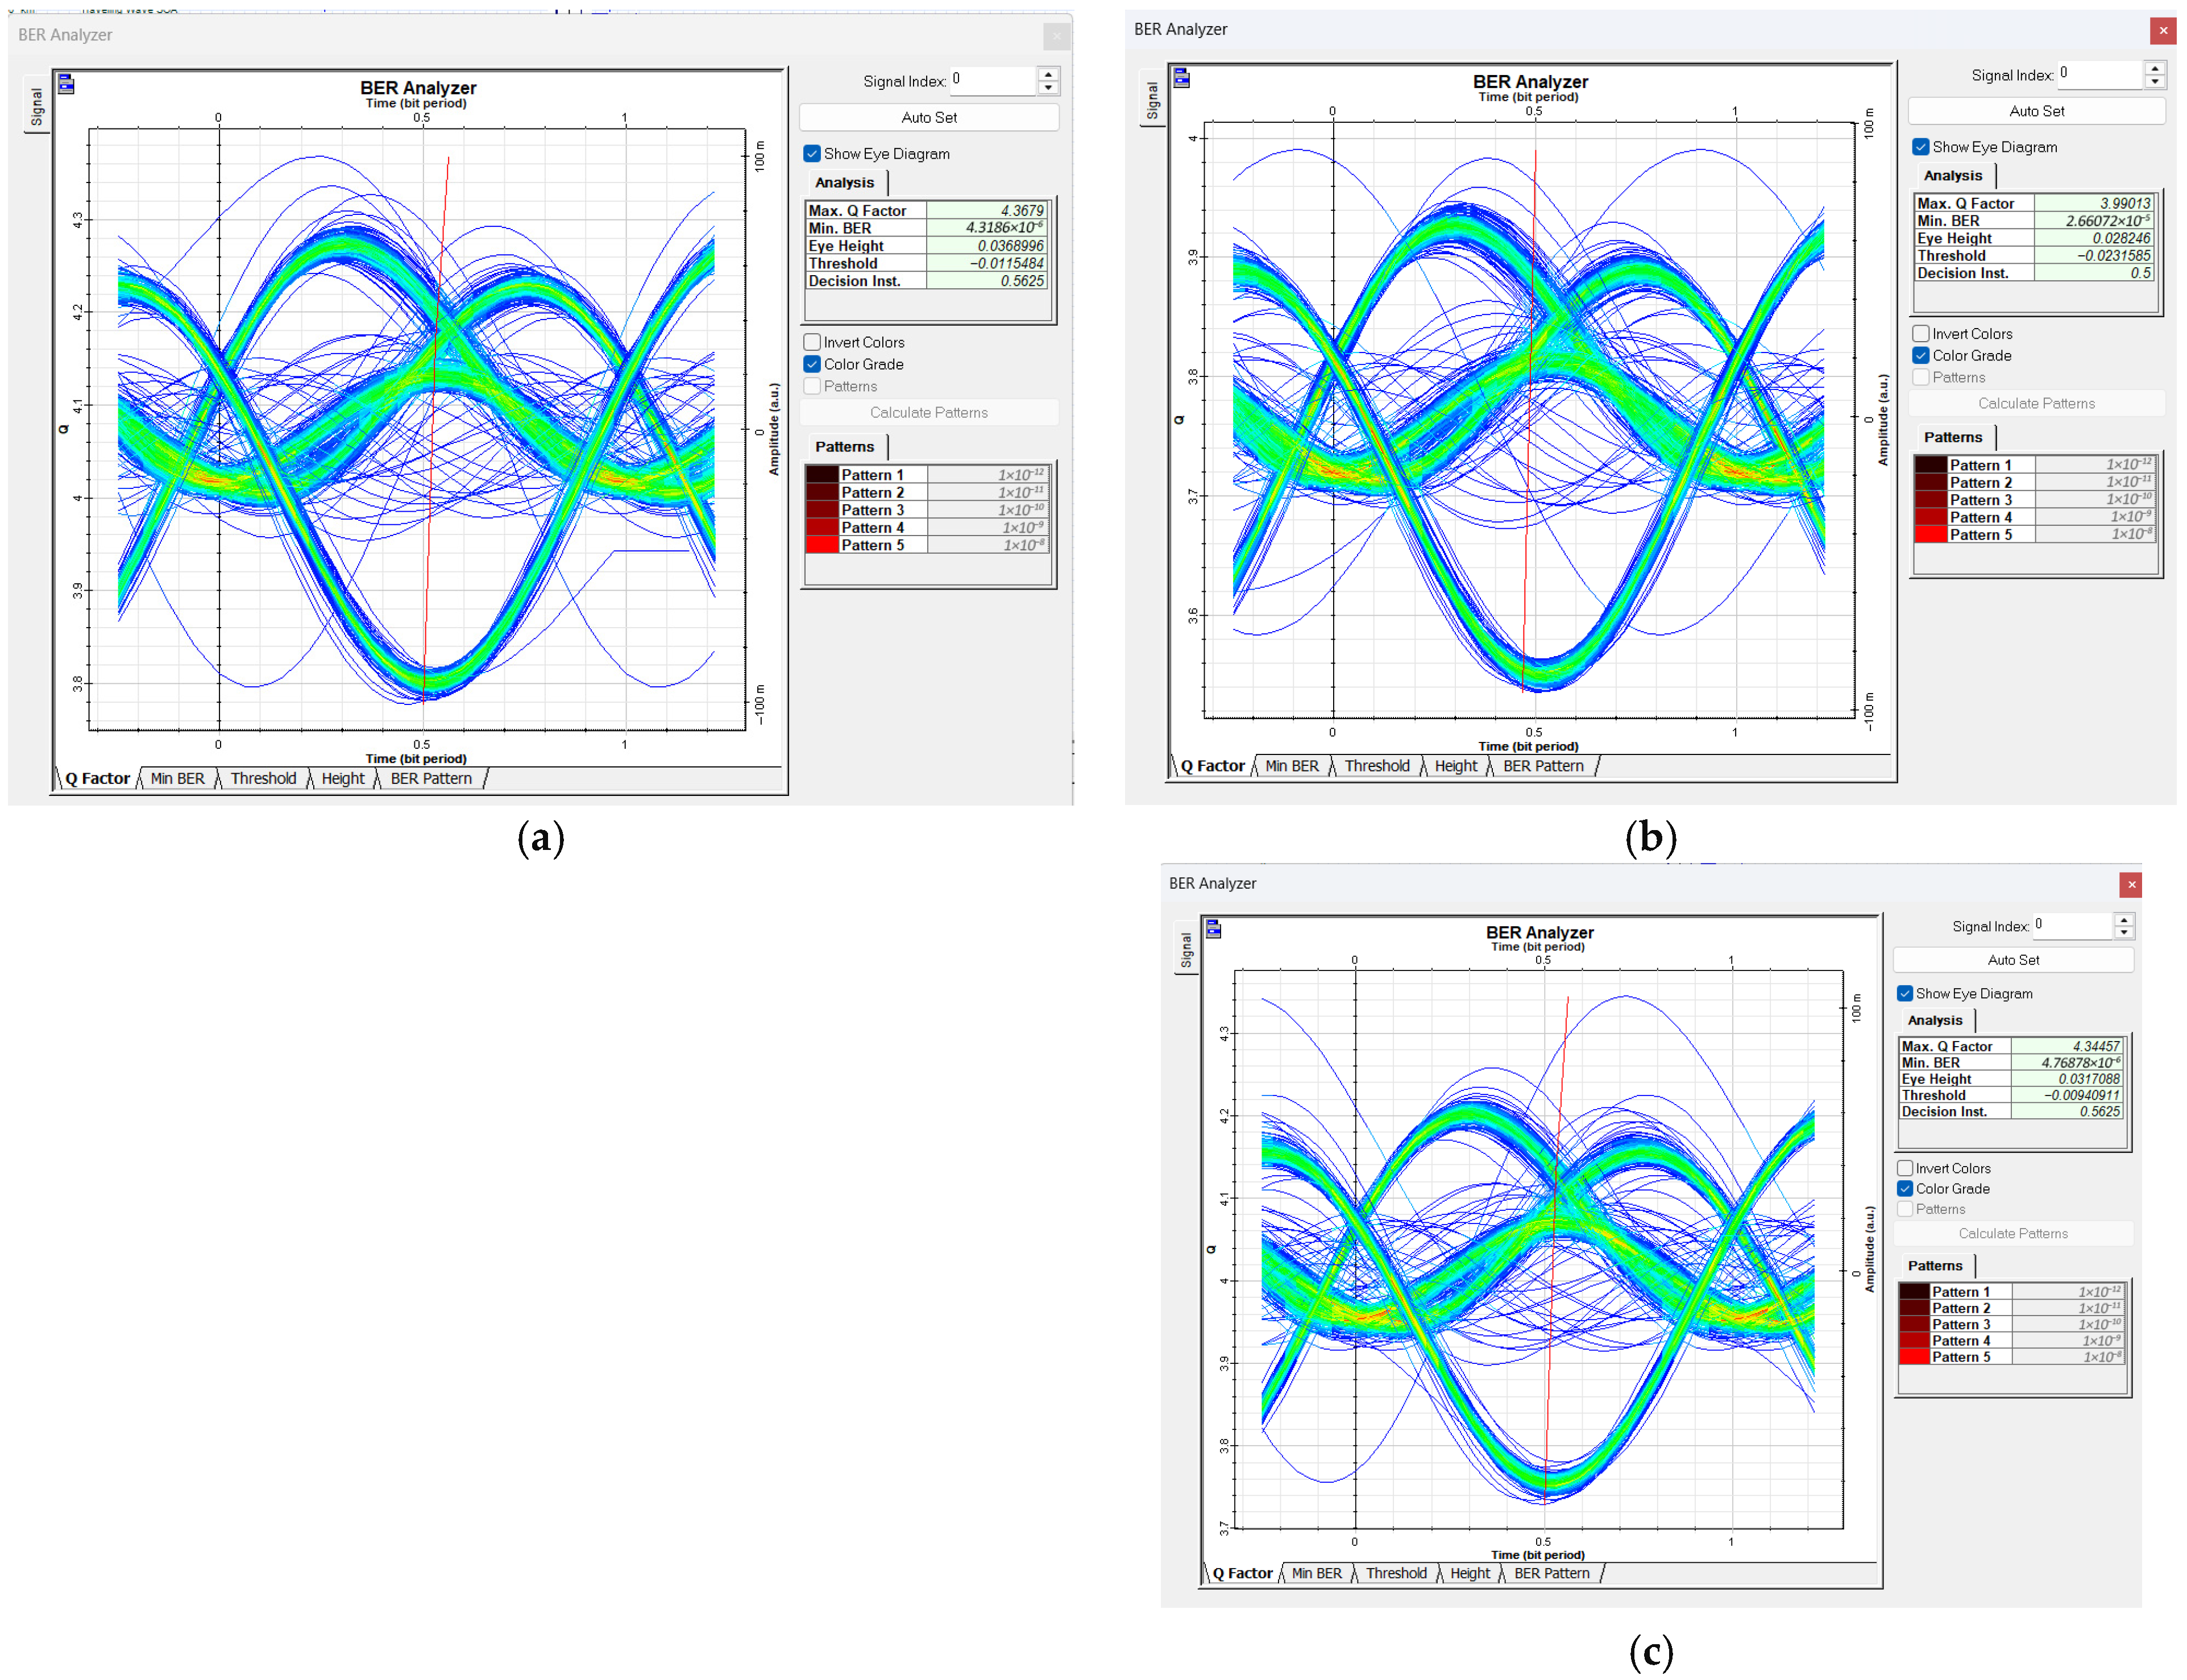
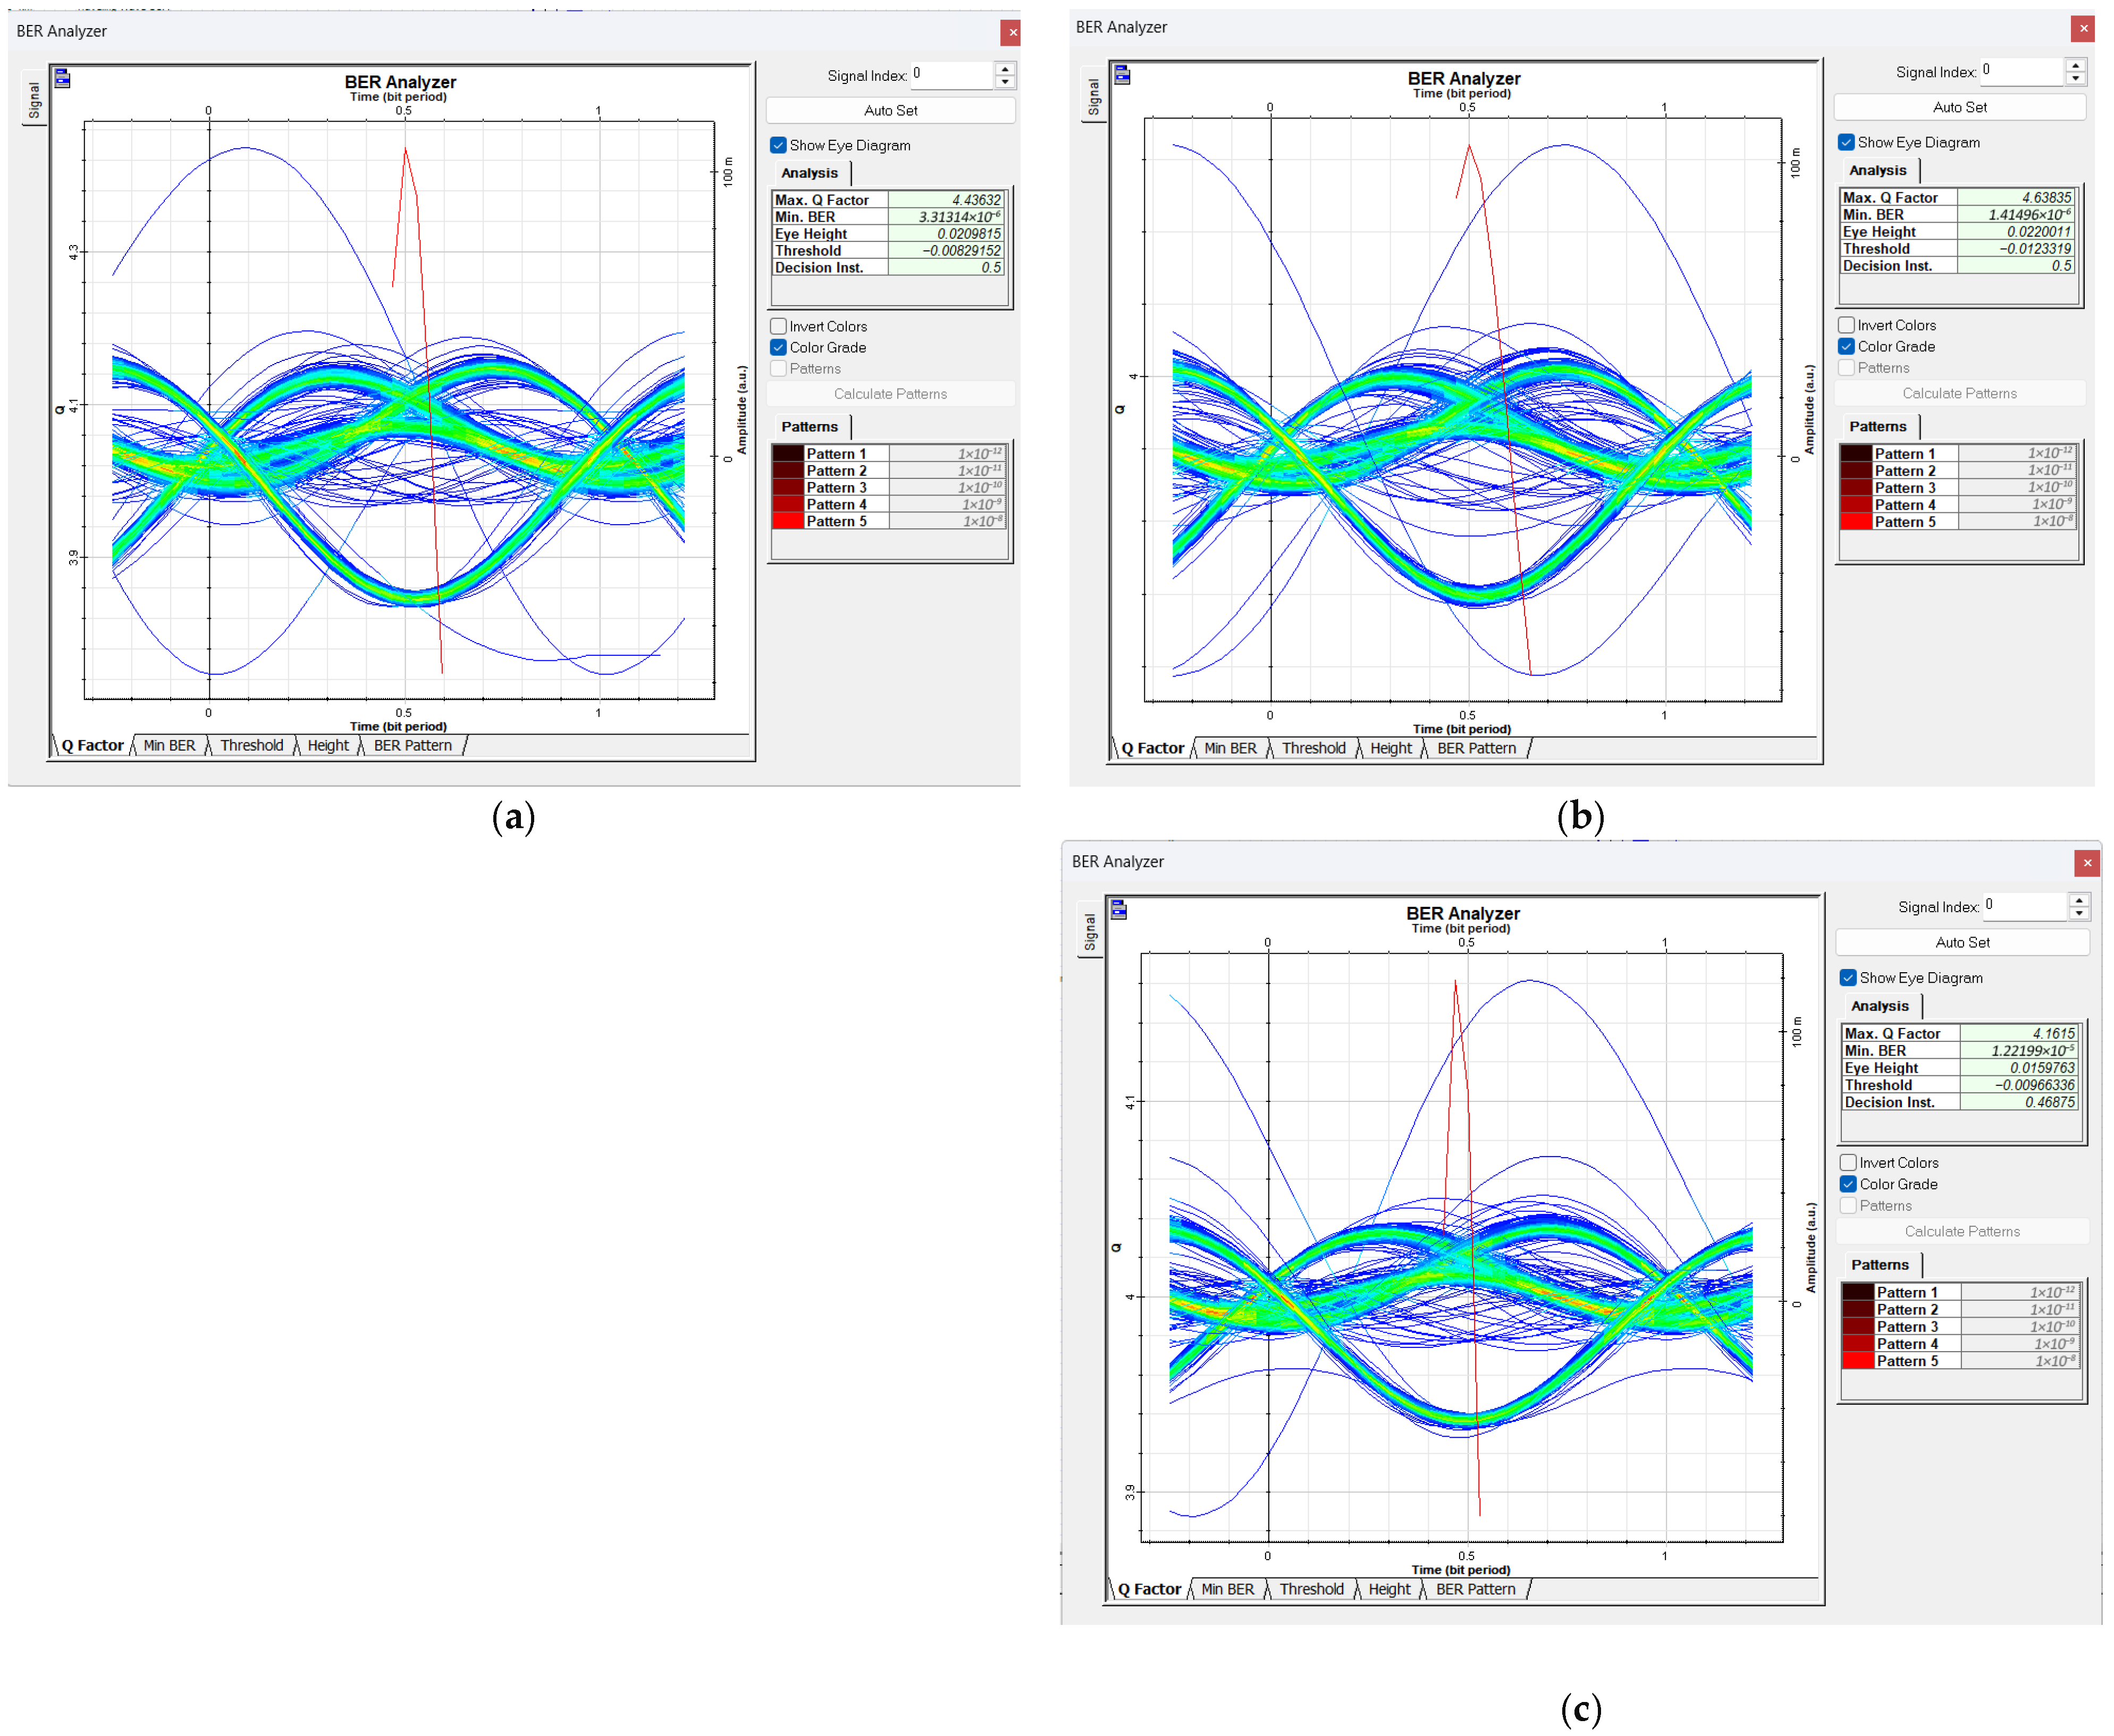
Figure 3 presents the BER and maximum quality factor graphs for S-, C-, and L-band wavelengths with the SOA bias current set to 100 mA. The order of the maximum quality factor from highest to lowest is C > S > L, while the BER values follow the reverse order, C < S < L.
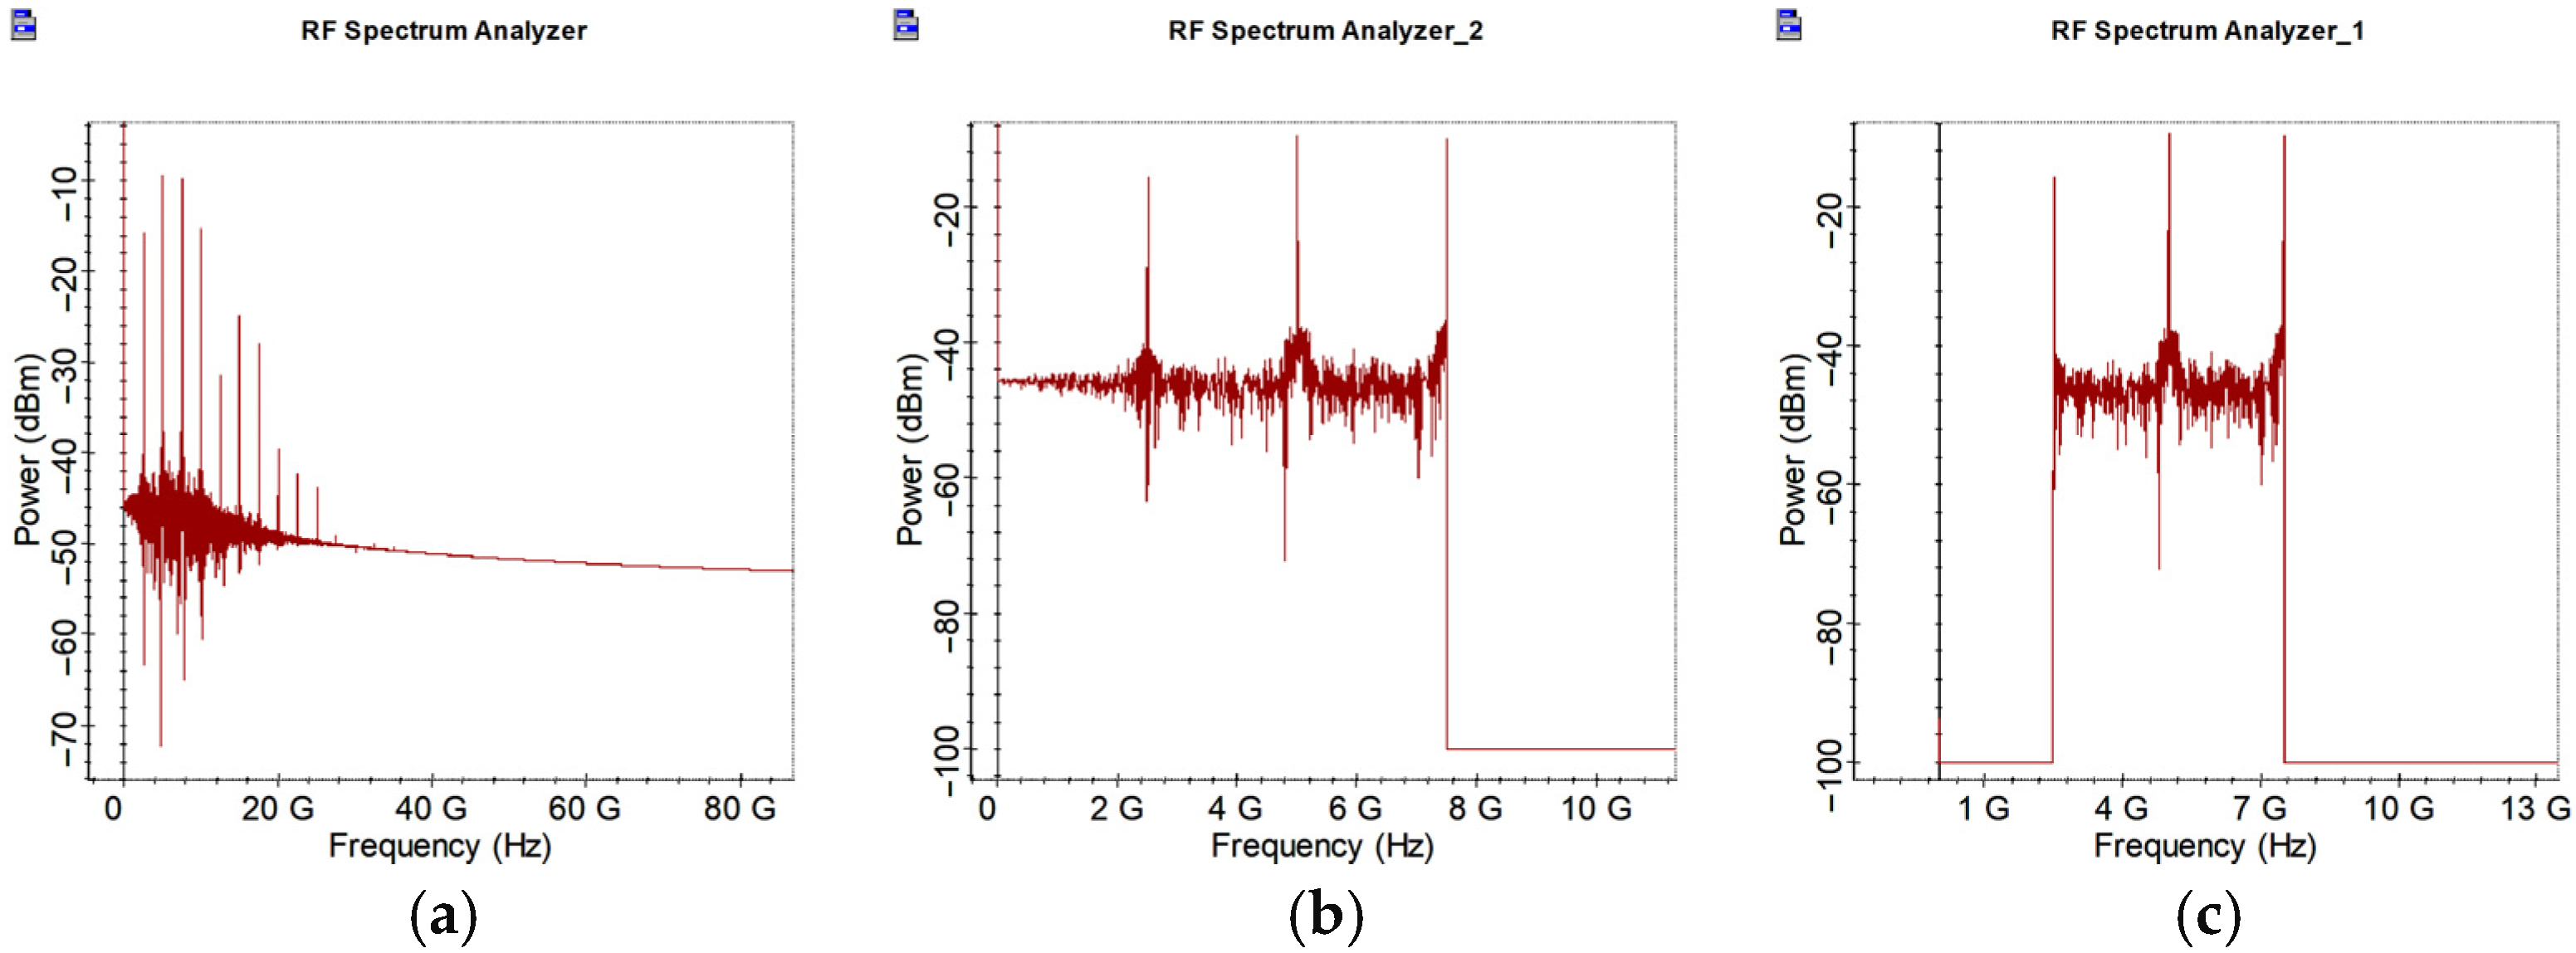
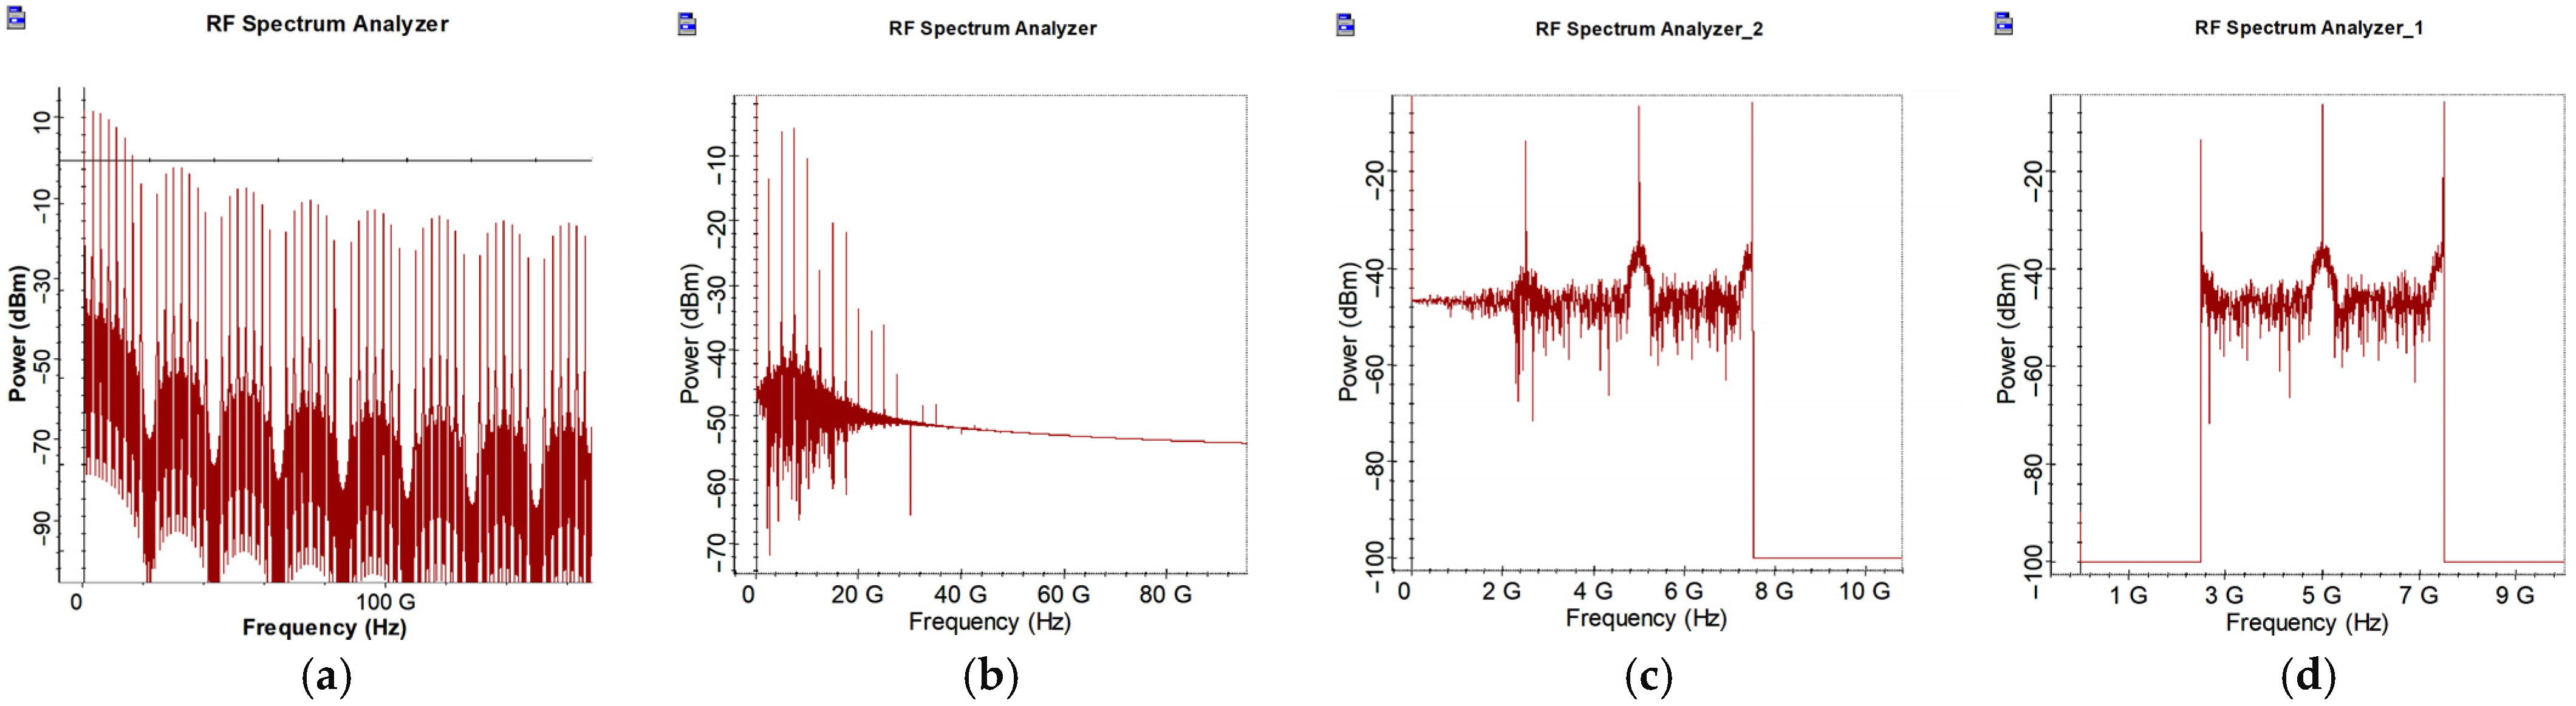
Figure 4 shows the input and output signals of the LPF and BPF stages. The LPF passes low-frequency components, whereas the BPF passes signals within the specified frequency range. The BPF effectively confines the signal within the UWB frequency band (3.1–10 GHz), with a passband centered at 10 GHz.
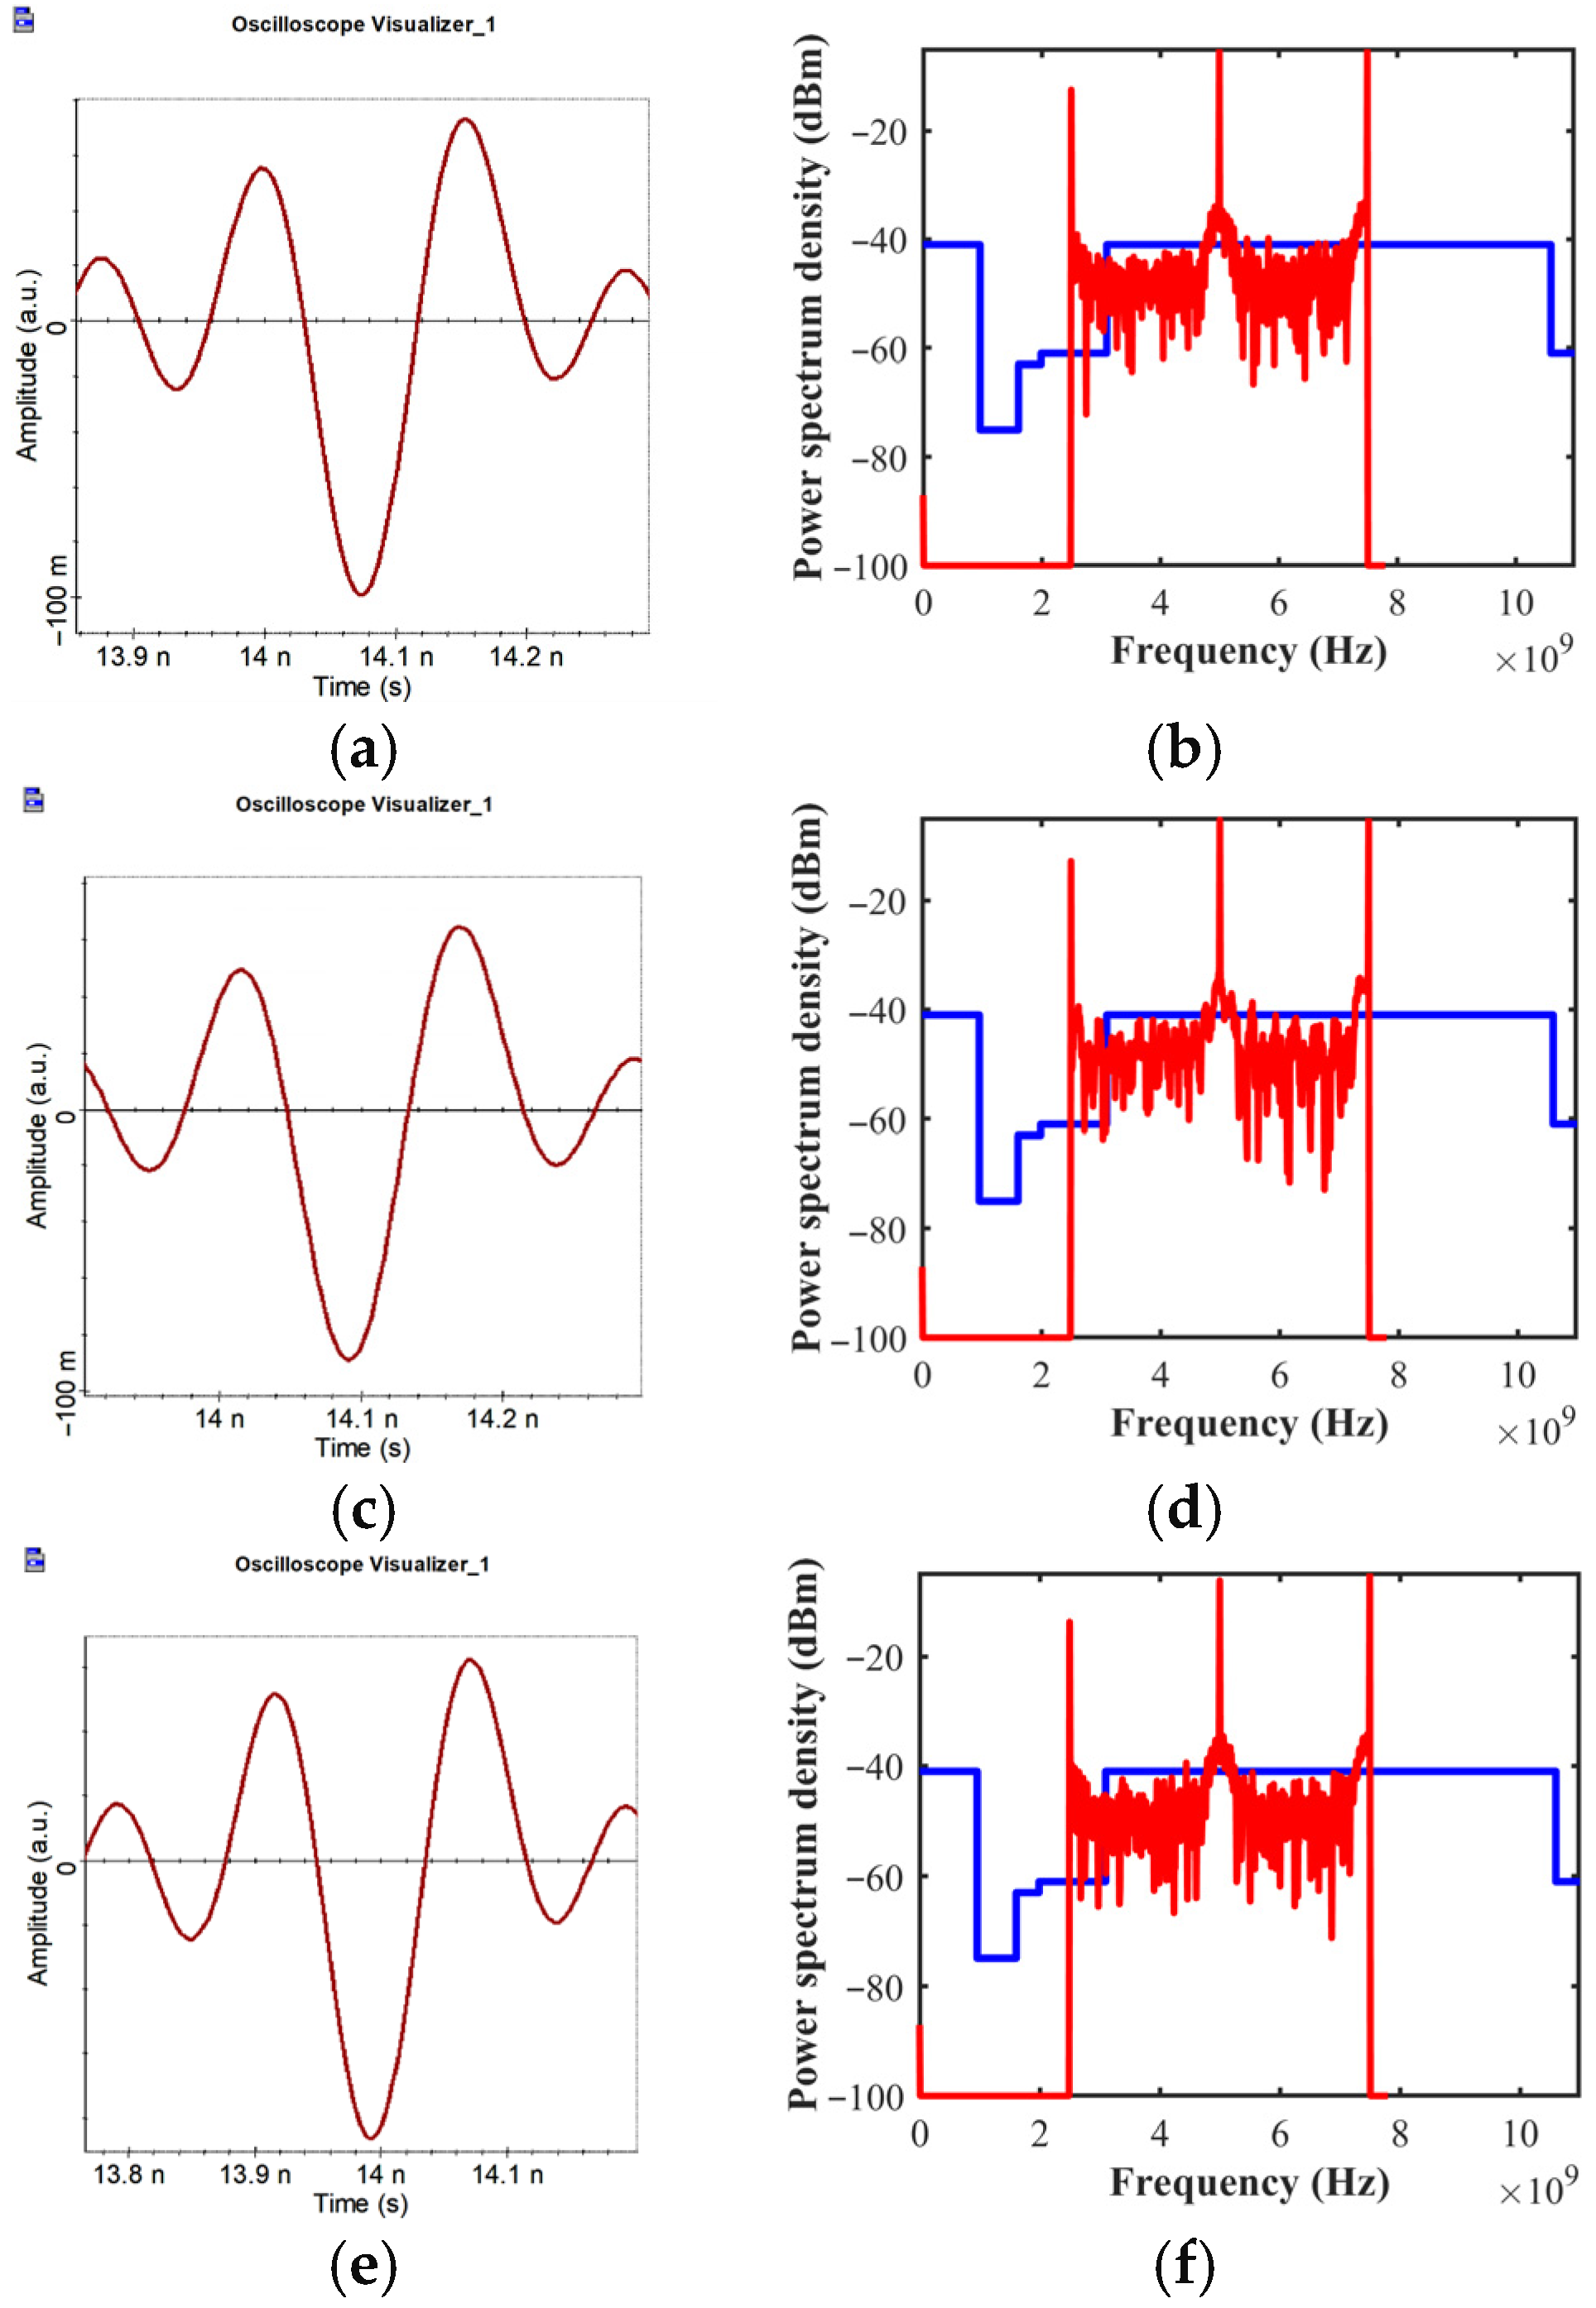
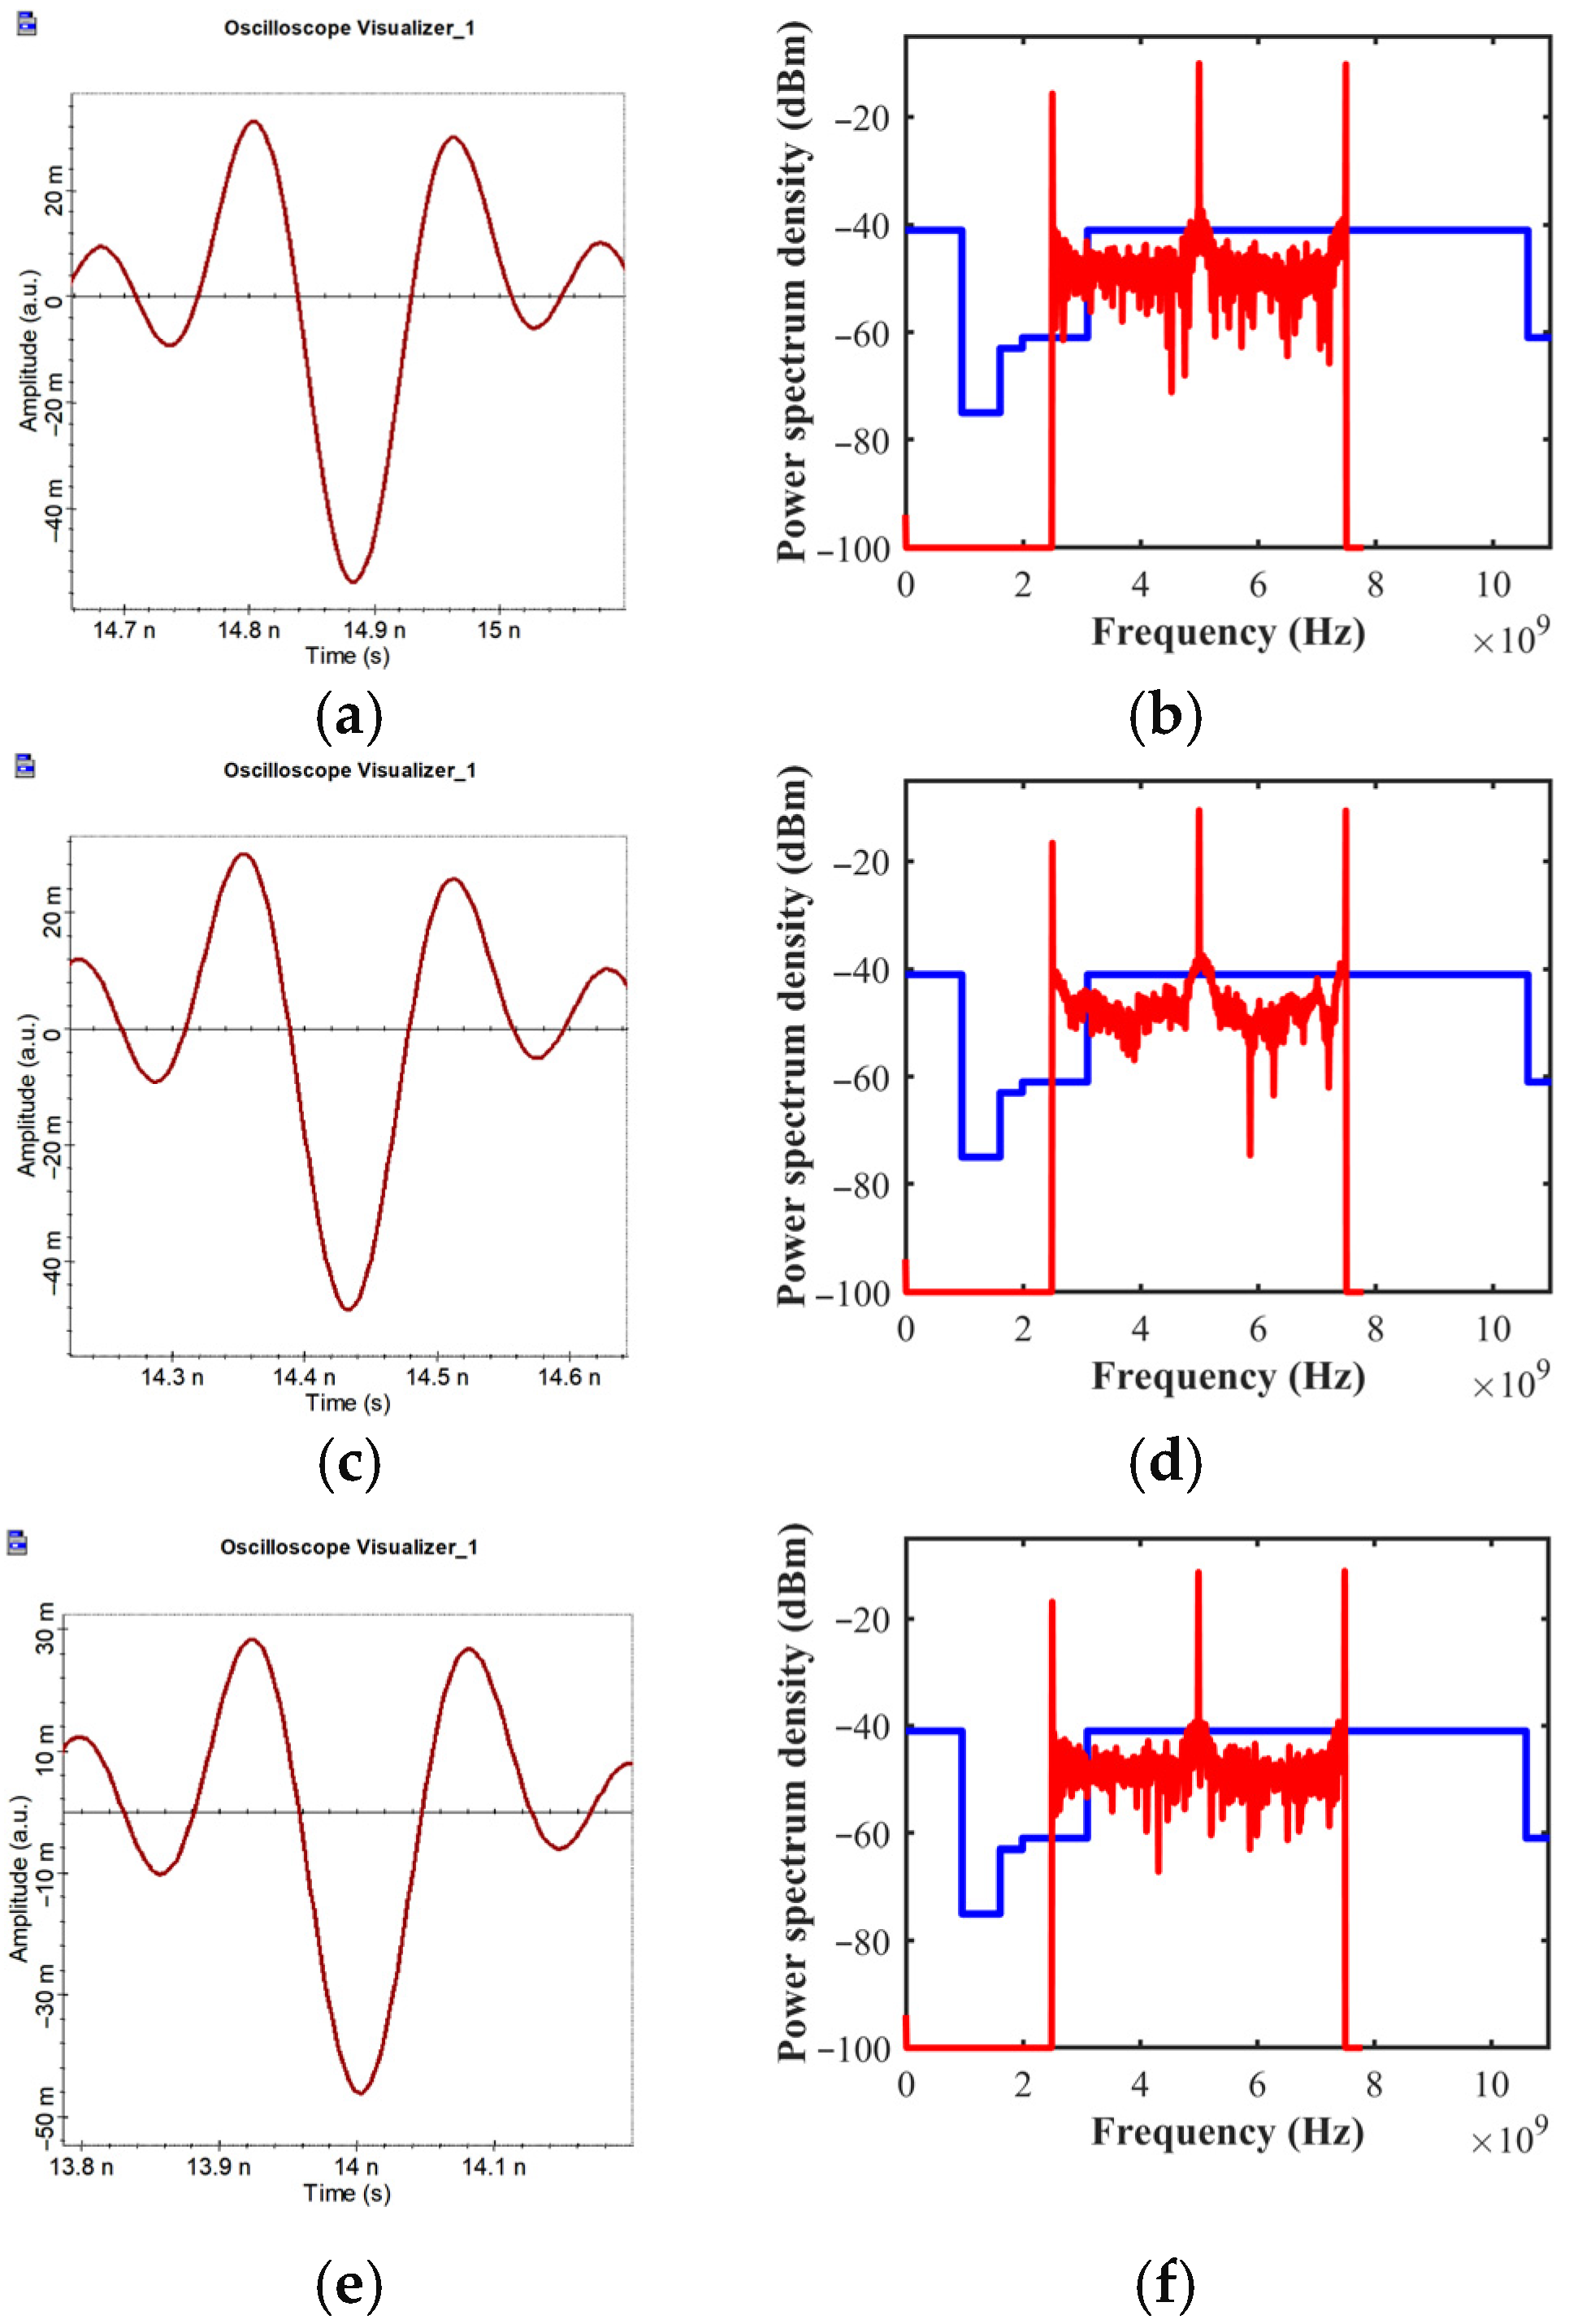
Figure 5 illustrates the time- and frequency-domain analysis of the generated UWB Gaussian pulses at S-, C-, and L-band wavelengths for 100 mA SOA bias. The negative Gaussian quadruplet pulse is obtained on the nanosecond scale with an FBW of 100%. The spectrum closely follows the FCC mask with only negligible deviations.

3.2. SOA Bias Current: 150 mA

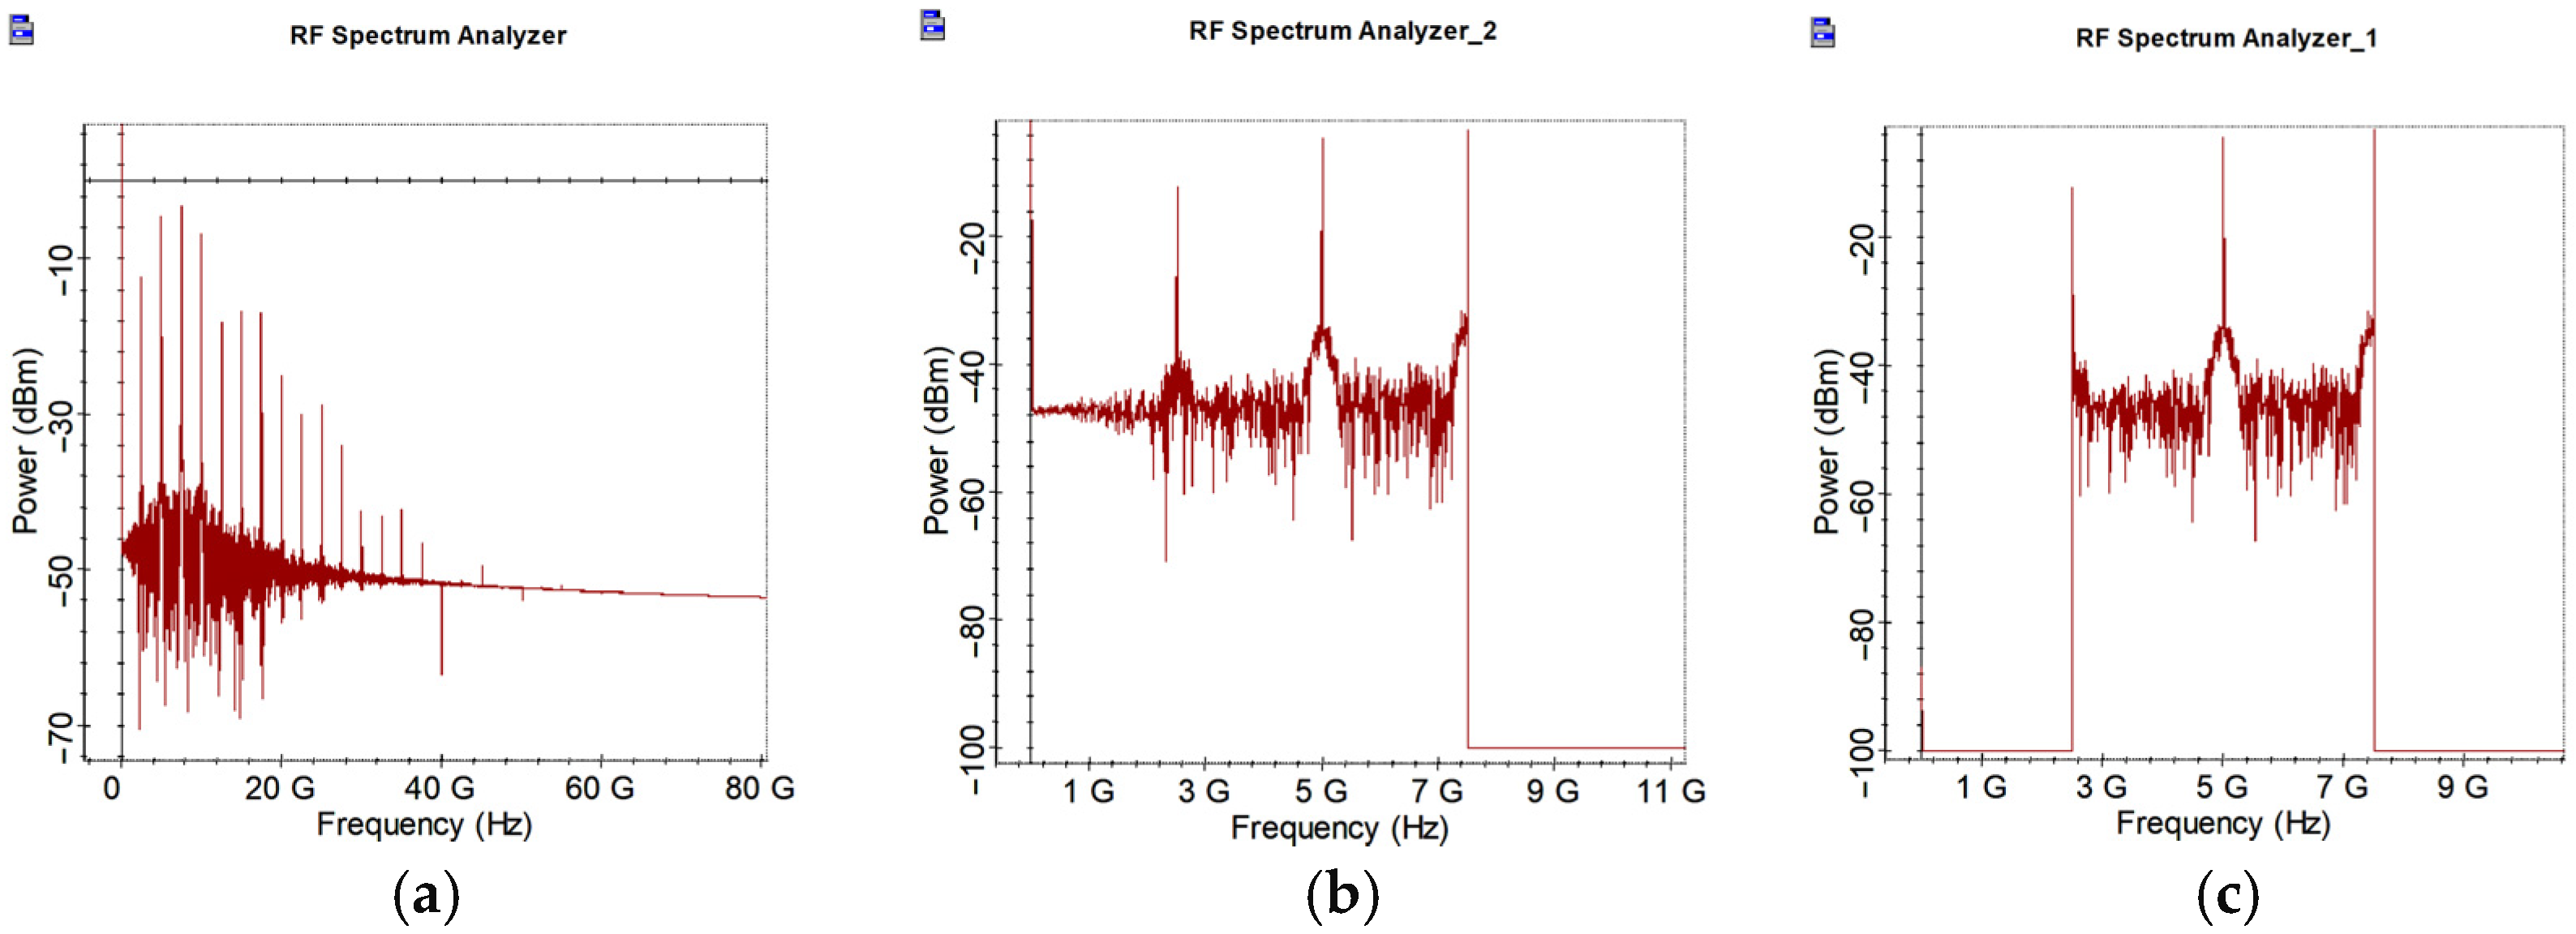
For a SOA current of 150 mA, the BER and quality factor results are shown in Figure 6. The maximum quality factor order remains C > S > L, while the BER order is L > S > C. The C-band shows the highest quality factor and lowest BER, indicating better system performance. Figure 7 presents the LPF and BPF input–output waveforms. The LPF output serves as input to the BPF, with the BPF allowing frequencies above 3 GHz to pass. The filtered signal is again confined within the 3.1–10 GHz UWB range.
Figure 8 shows the corresponding time- and frequency-domain analyses for the 150 mA SOA bias. Gaussian quadruplet pulses were obtained again with an FBW of 100%. The pulse observed in the C-band displays greater temporal symmetry compared to the quadruplet pulse structures obtained in S- and L-bands. Frequency spectra conform well with the FCC mask, with only minor deviations.

3.3. SOA Bias Current: 200 mA

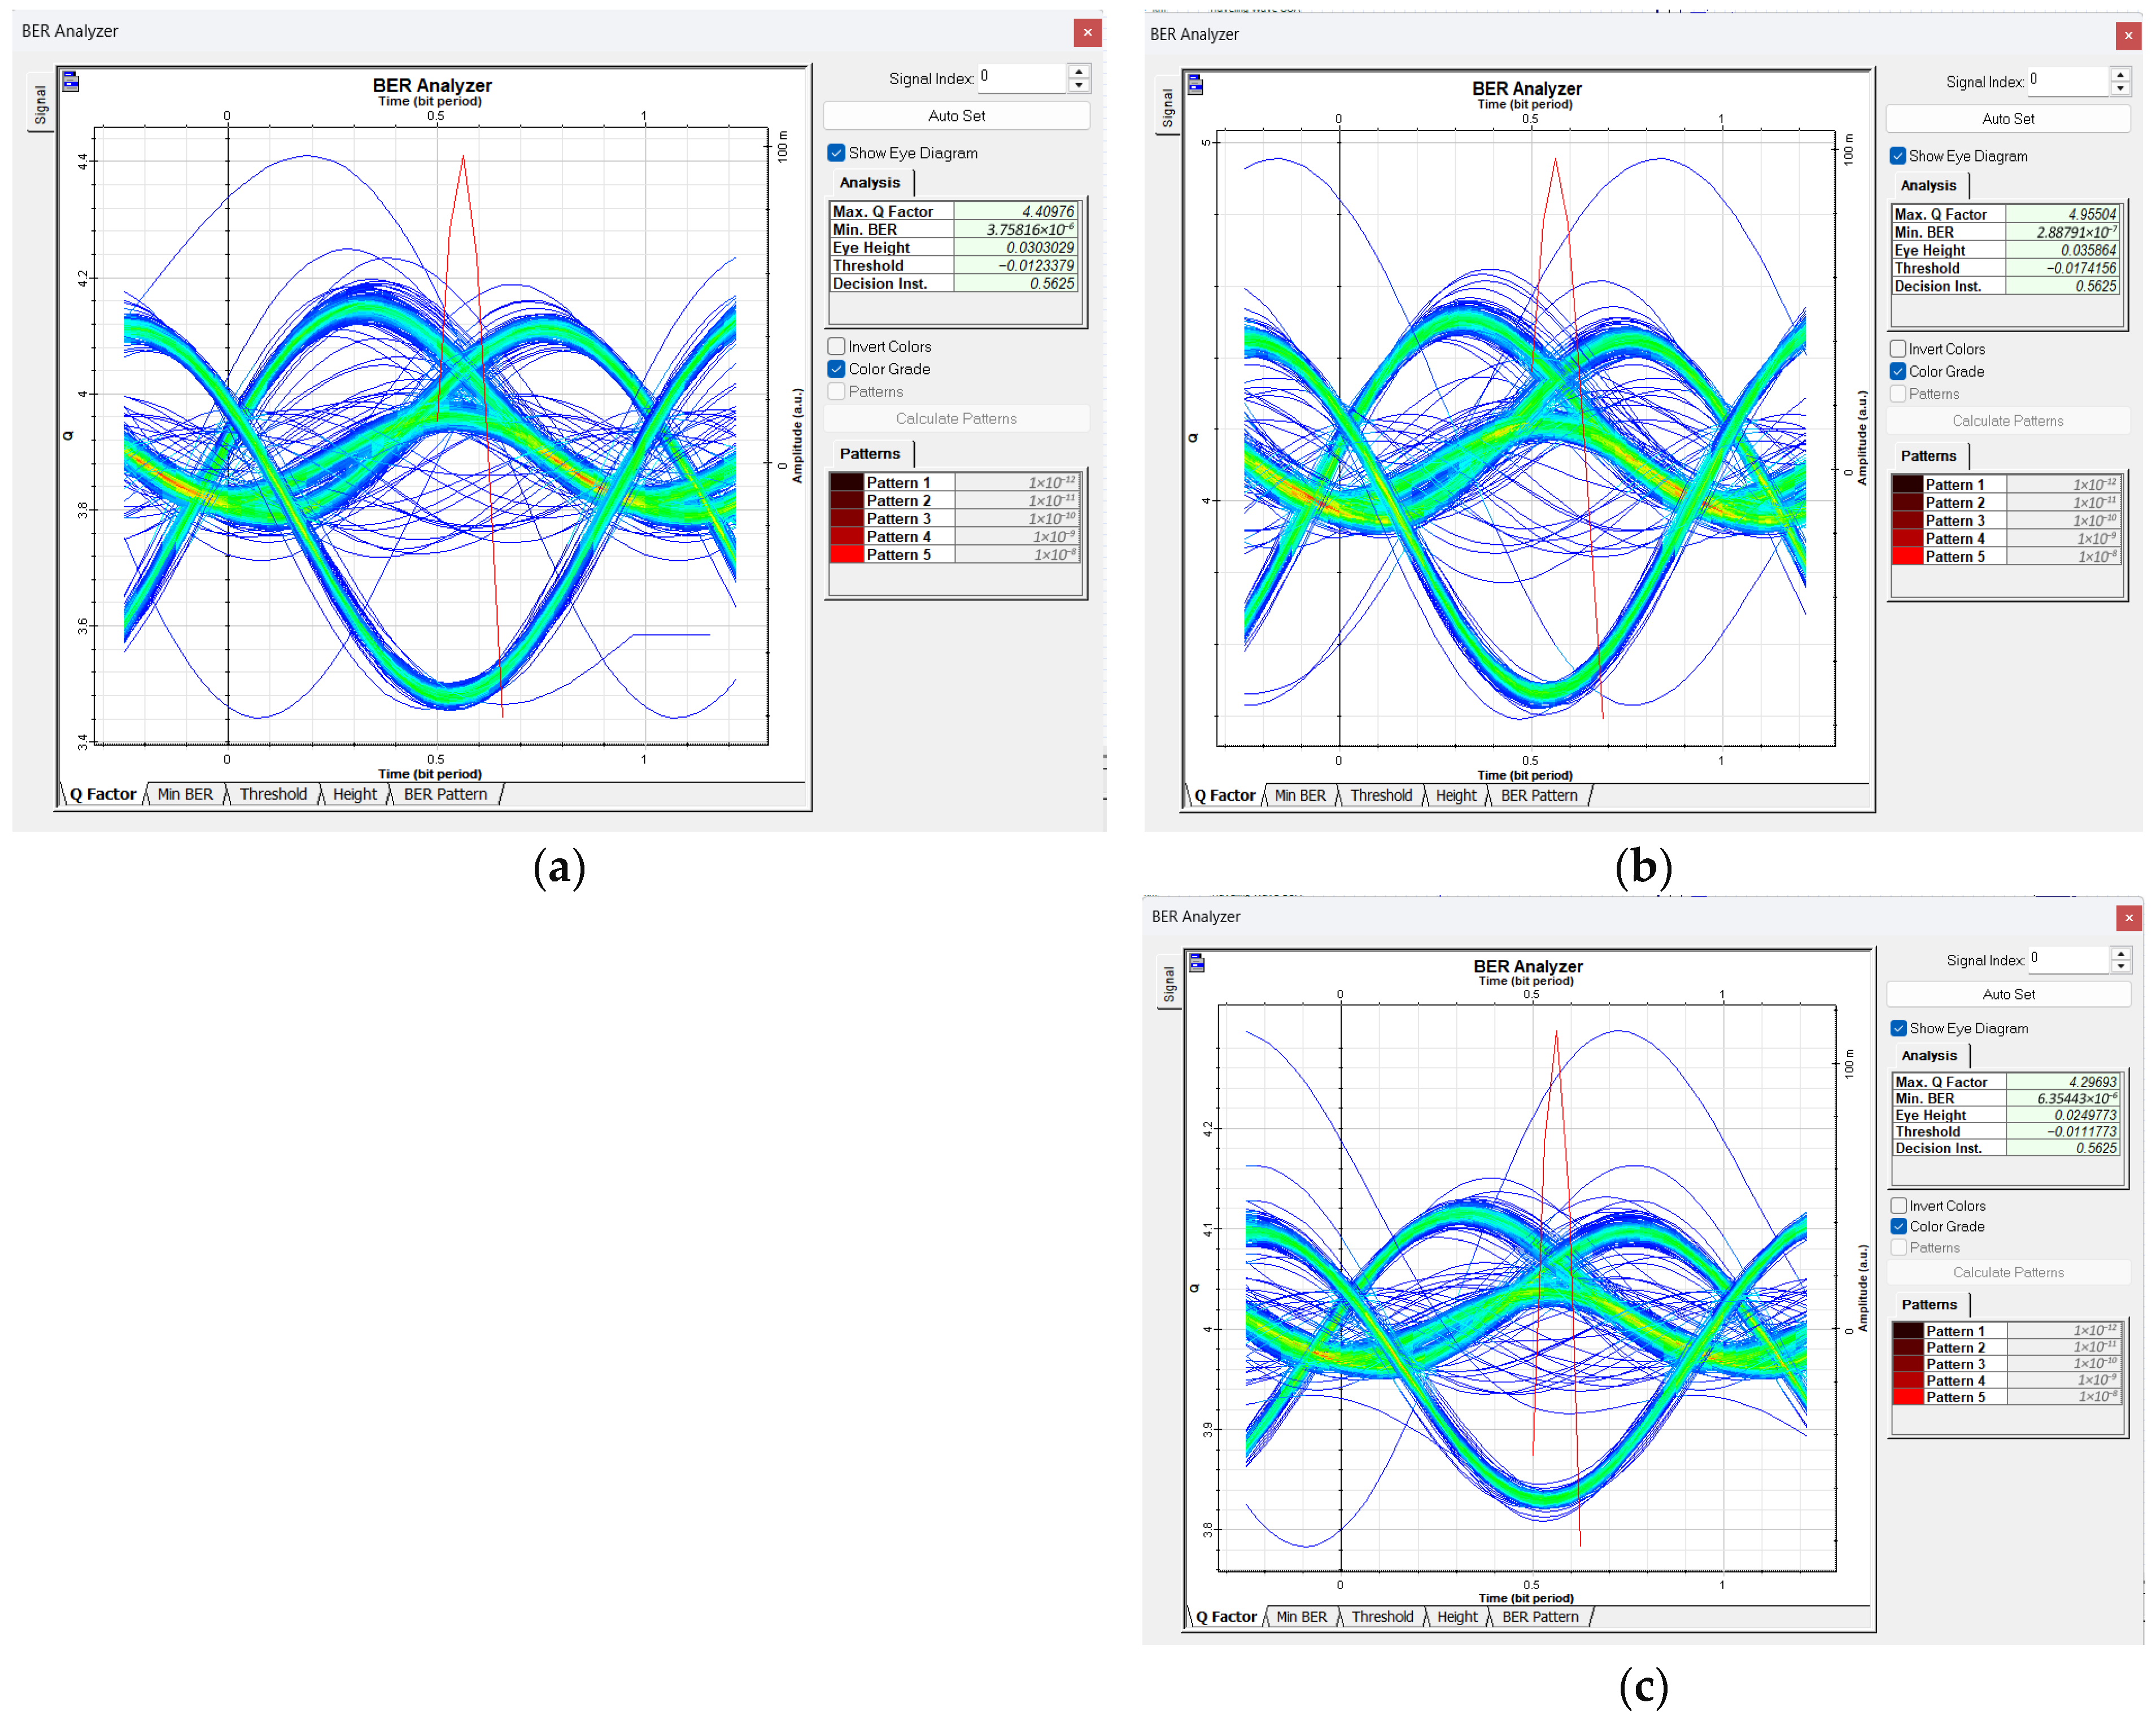
At a bias current of 200 mA, the BER and maximum quality factor graphs are shown in Figure 9. The quality factor order changes to S > L > C, while the BER follows S < L < C. Among all bias conditions, the best maximum quality factor was achieved at 150 mA in the C-band, while the lowest was obtained at 200 mA in the C-band. Figure 10 shows LPF and BPF responses at 200 mA. The BPF effectively confines the signal to the 3.1–10 GHz UWB region.
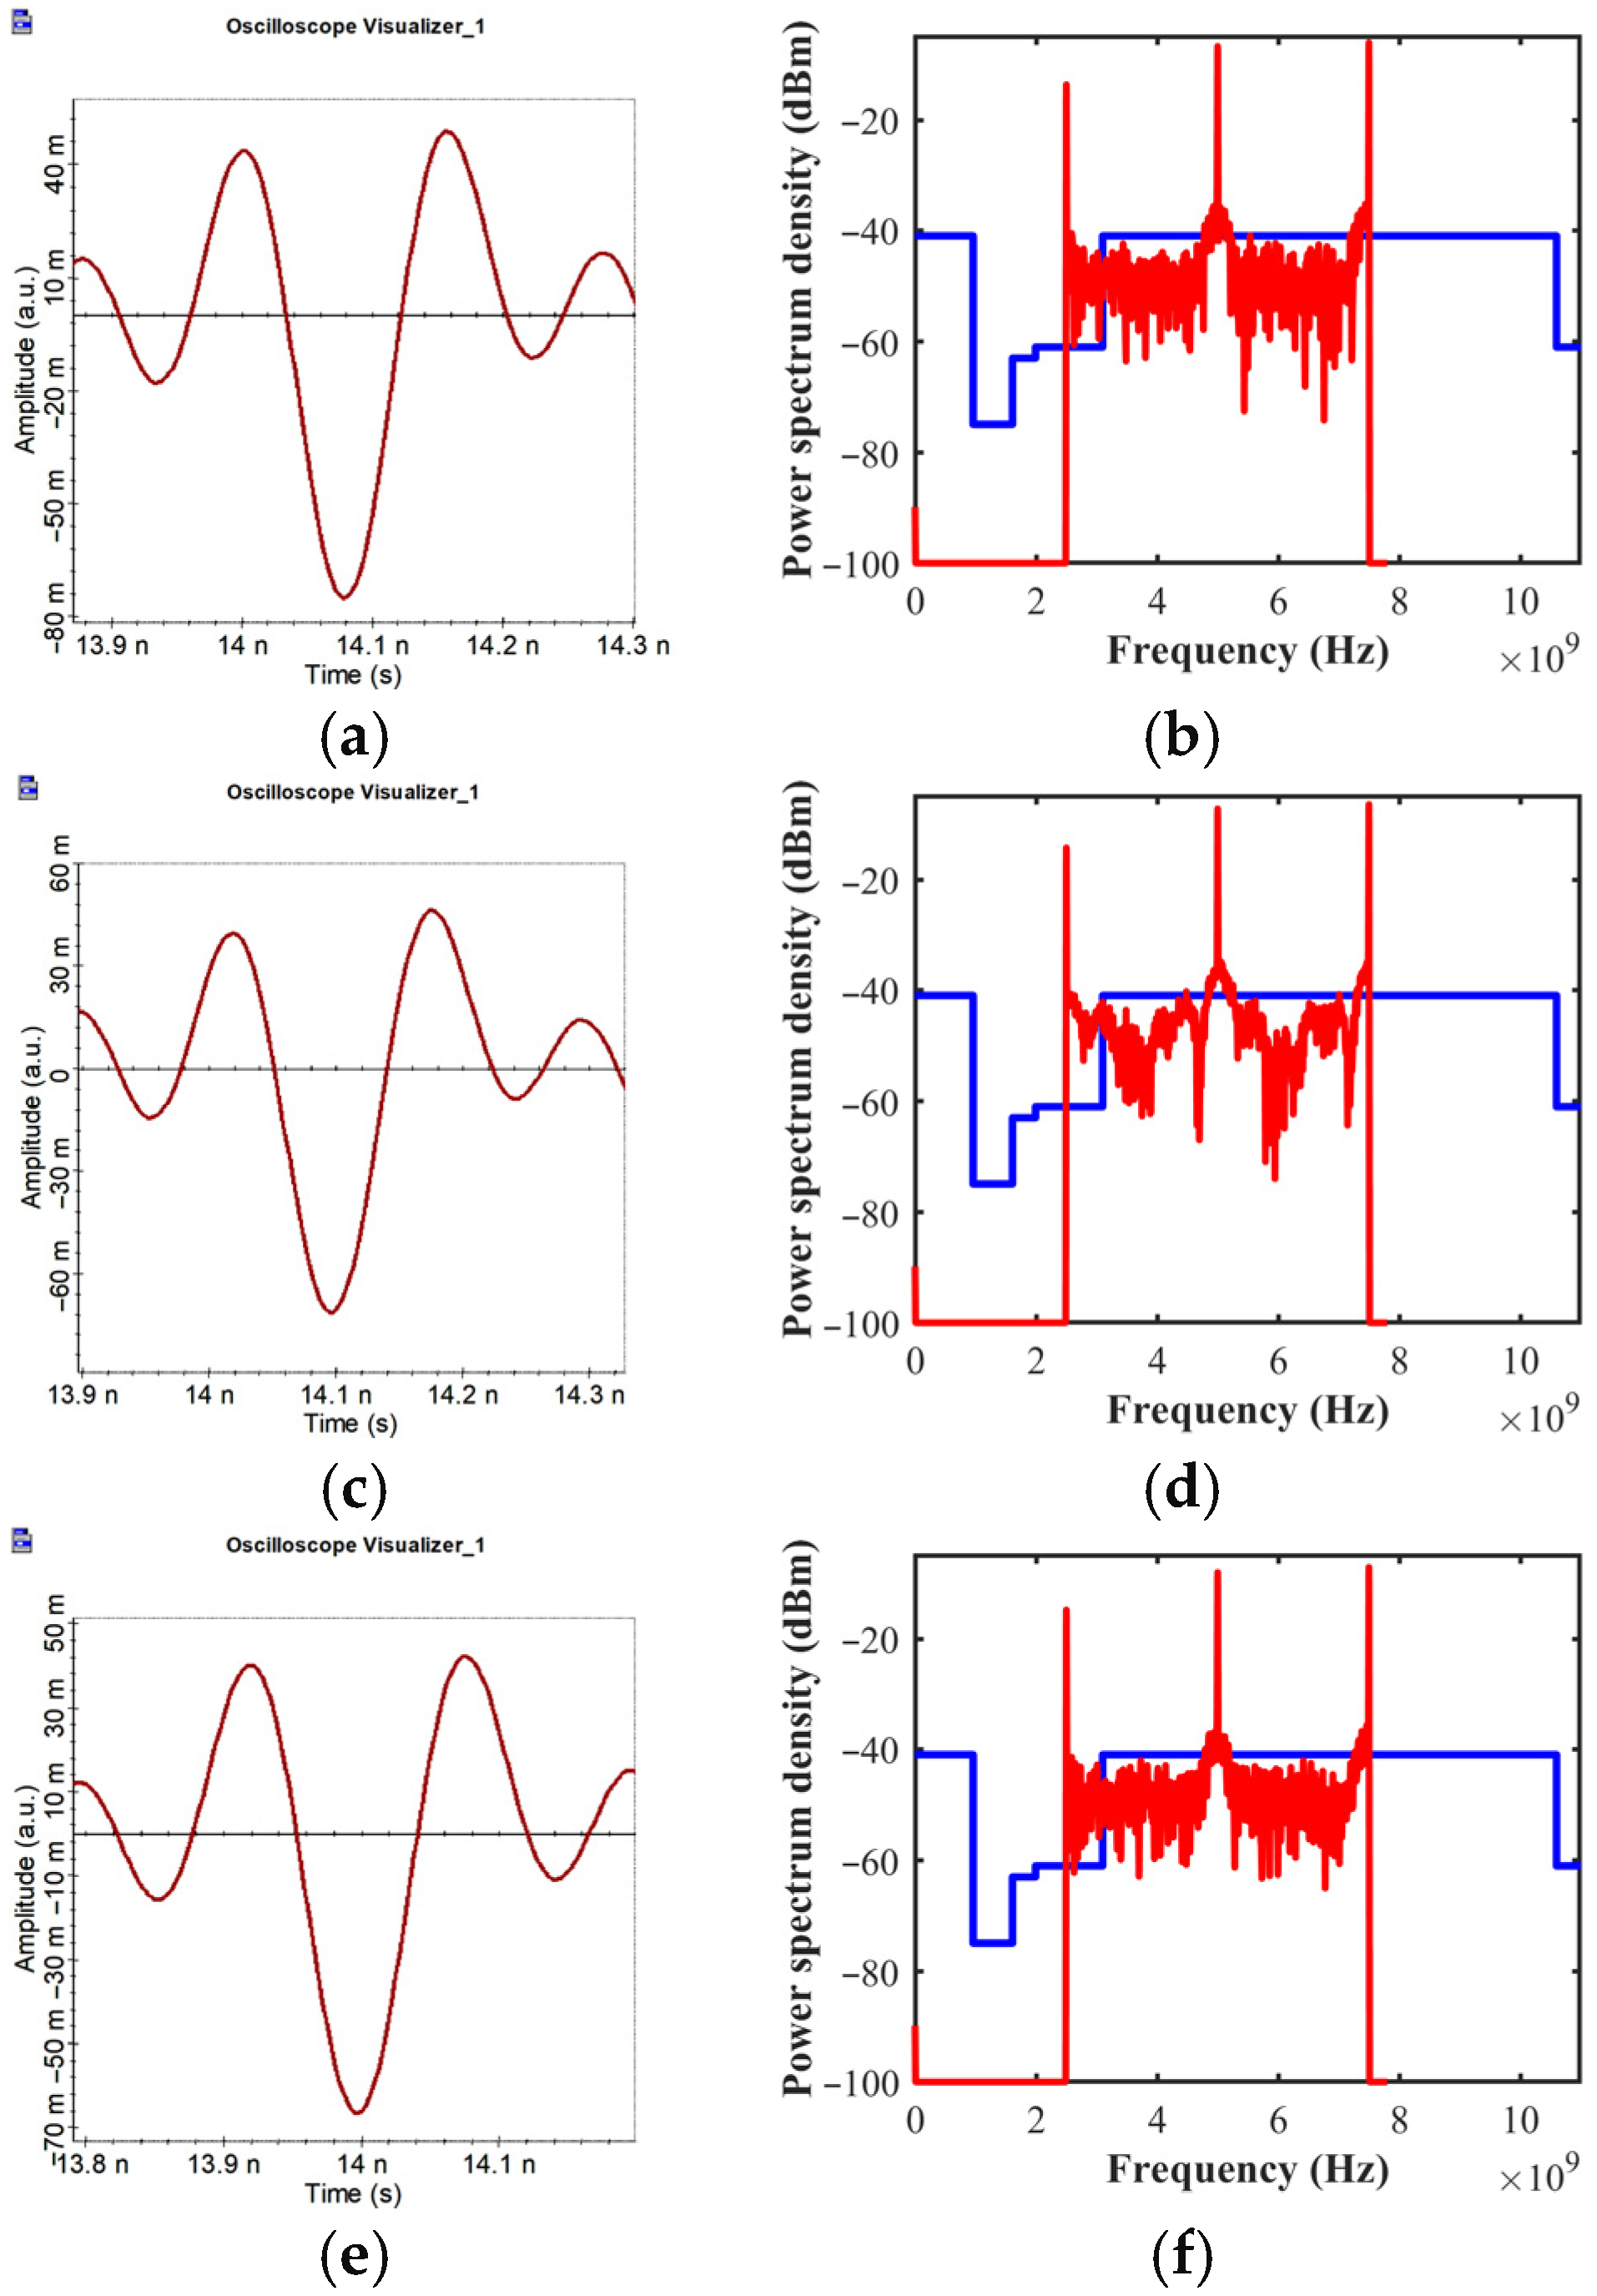
Figure 11 presents the time- and frequency-domain analyses for UWB Gaussian pulses generated with 200 mA SOA current at S-, C-, and L-band wavelengths. Gaussian quadruplet pulses at the nanosecond scale were obtained with an FBW of 100%. The frequency-domain analysis shows good compliance with the FCC outdoor mask, with only negligible deviations.

3.4. Performance Trends and Efficiency Analysis

Across all bias conditions, variations in SOA current did not affect the overall Gaussian pulse shape or the FBW value, which consistently remained at 100%. However, the SOA bias affected the BER and quality factor. The BPF played a critical role in aligning the generated UWB signal within the desired frequency limits. The LPF suppressed low-frequency components, while the BPF suppressed unwanted frequency components, improving conformity with the FCC mask. When the BPF was overly restrictive, the FBW decreased; therefore, it was optimally tuned to balance FCC compliance with bandwidth preservation, allowing minor spectral excesses within acceptable limits.
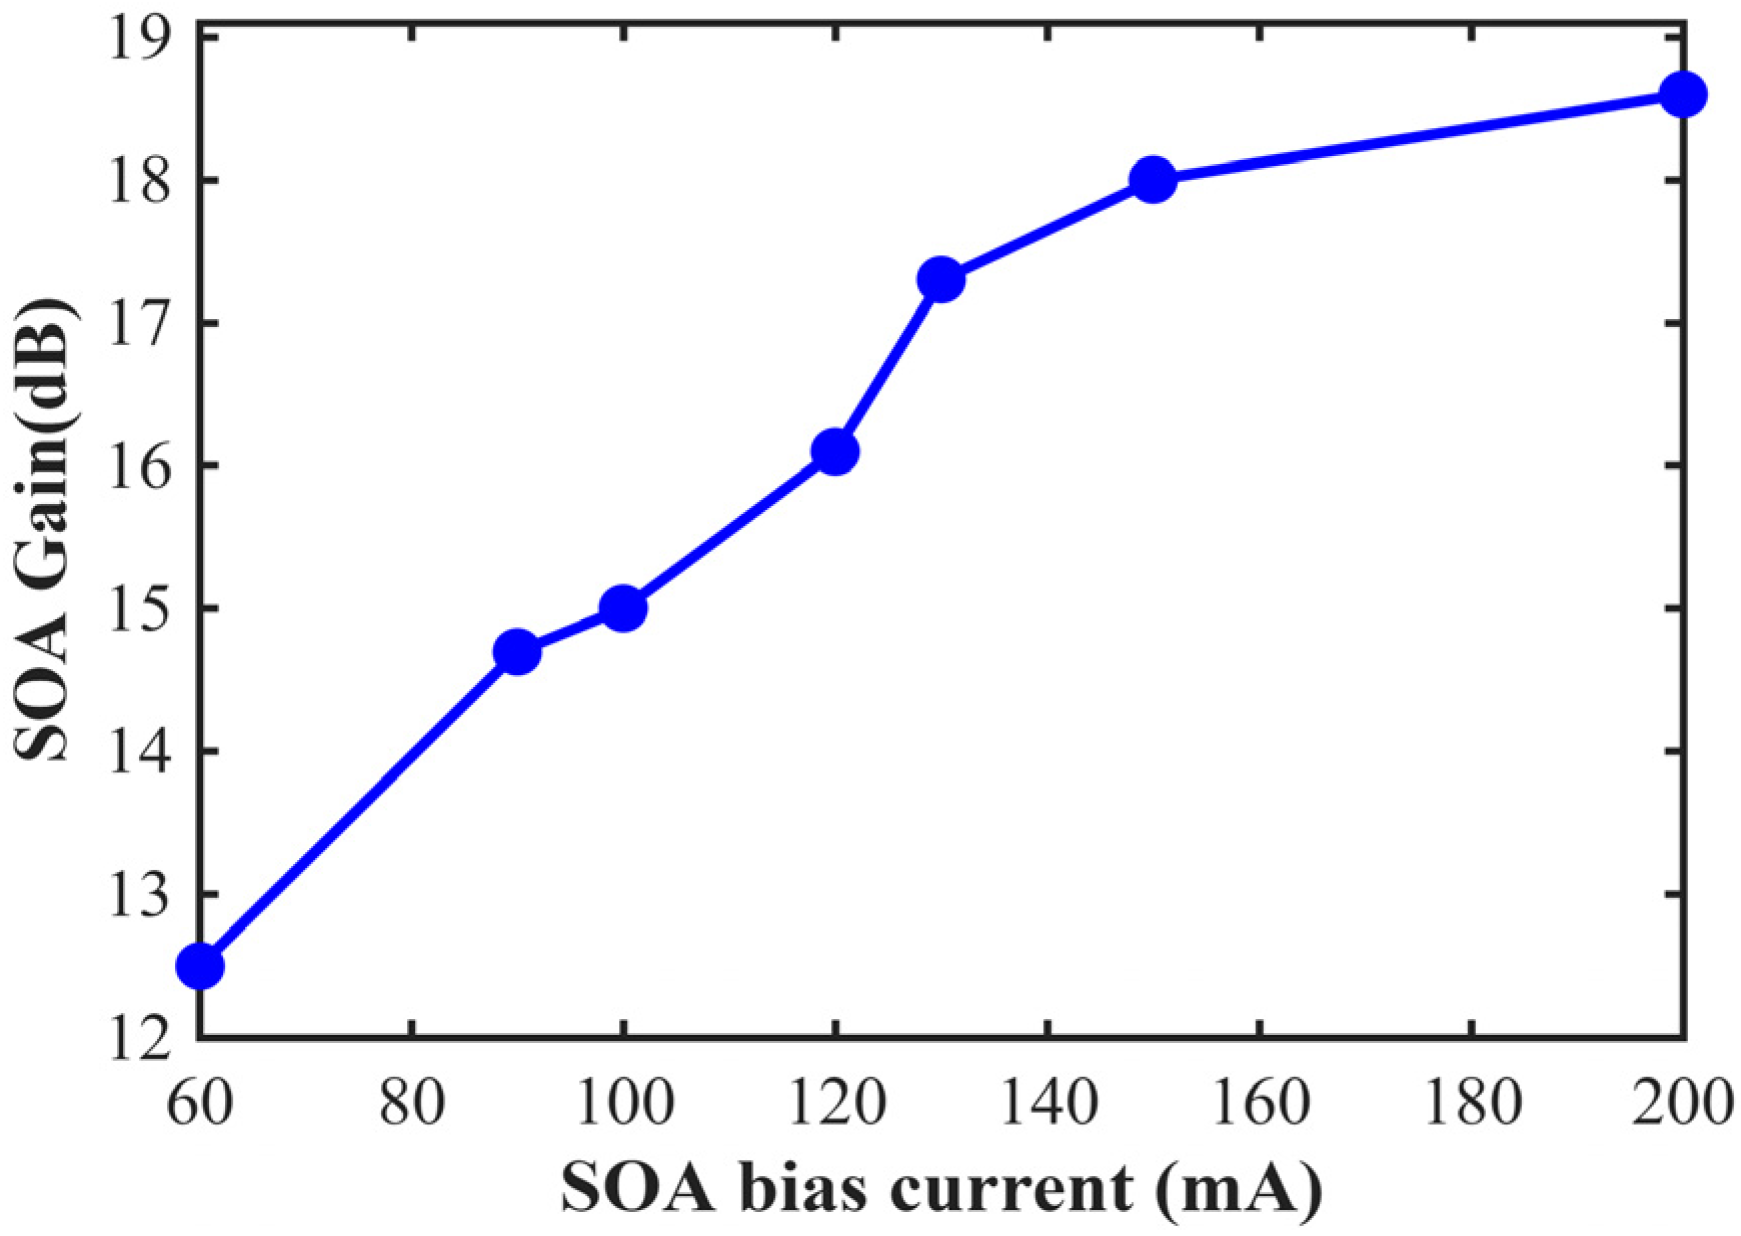
For S- and L-band wavelengths, the highest quality factor was obtained at 200 mA SOA bias, while for the C-band, both the highest and lowest values occurred at different SOA bias levels. The SOA gain, expressed in dB, is illustrated in Figure 12. The results show that the gain increases with higher SOA bias current, while remaining nearly constant across wavelengths. The observed gain behavior is consistent with previous studies, where the gain increases with bias current but exhibits saturation effects at higher current levels.
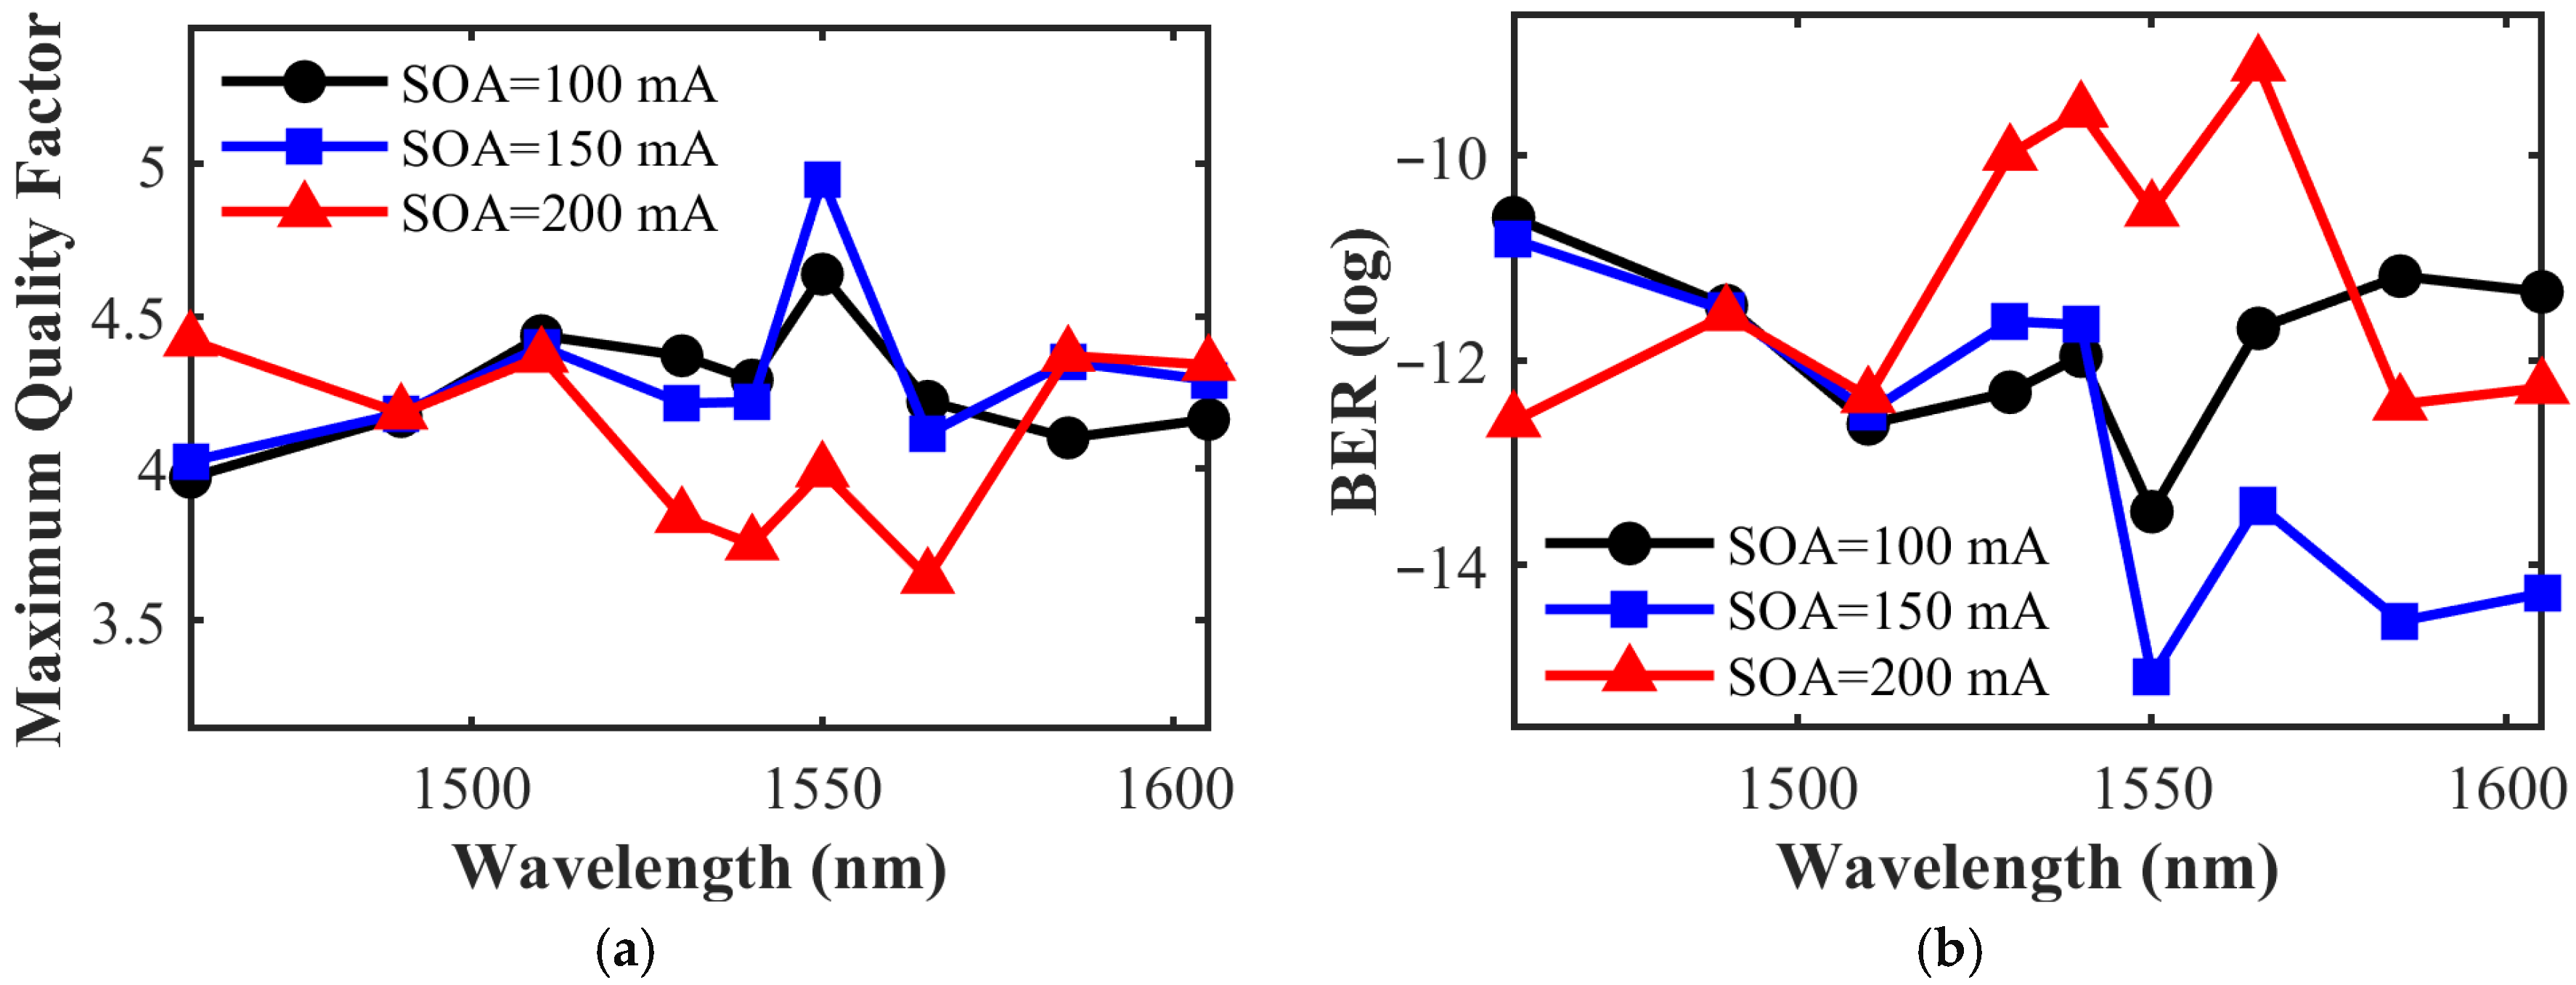
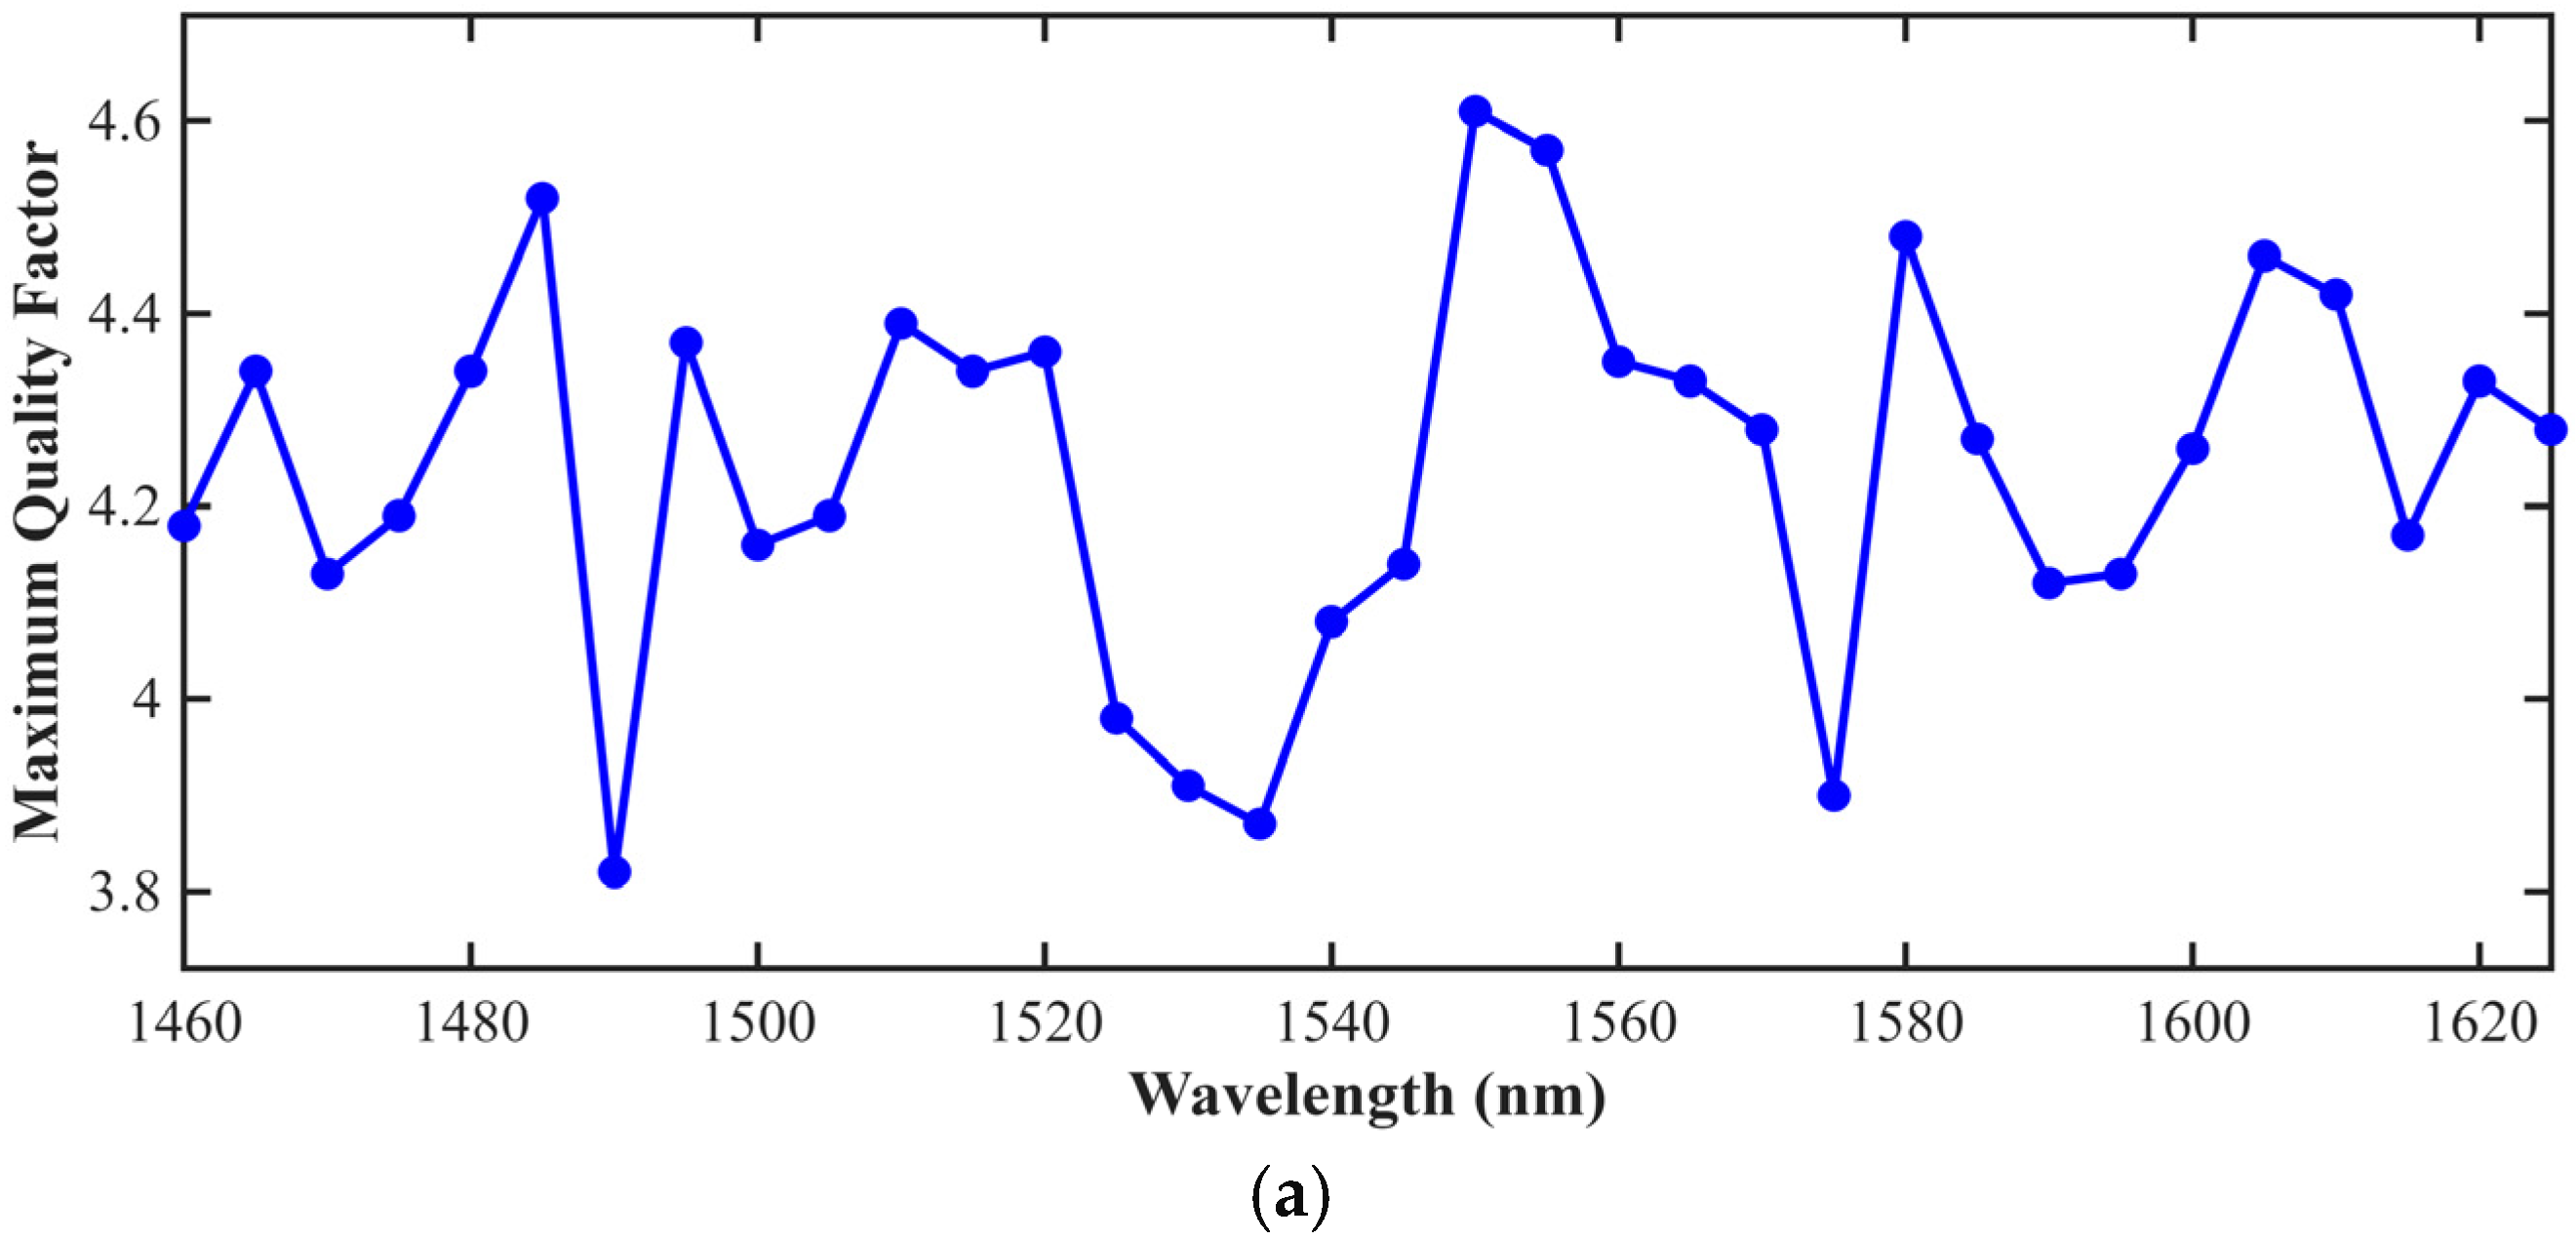
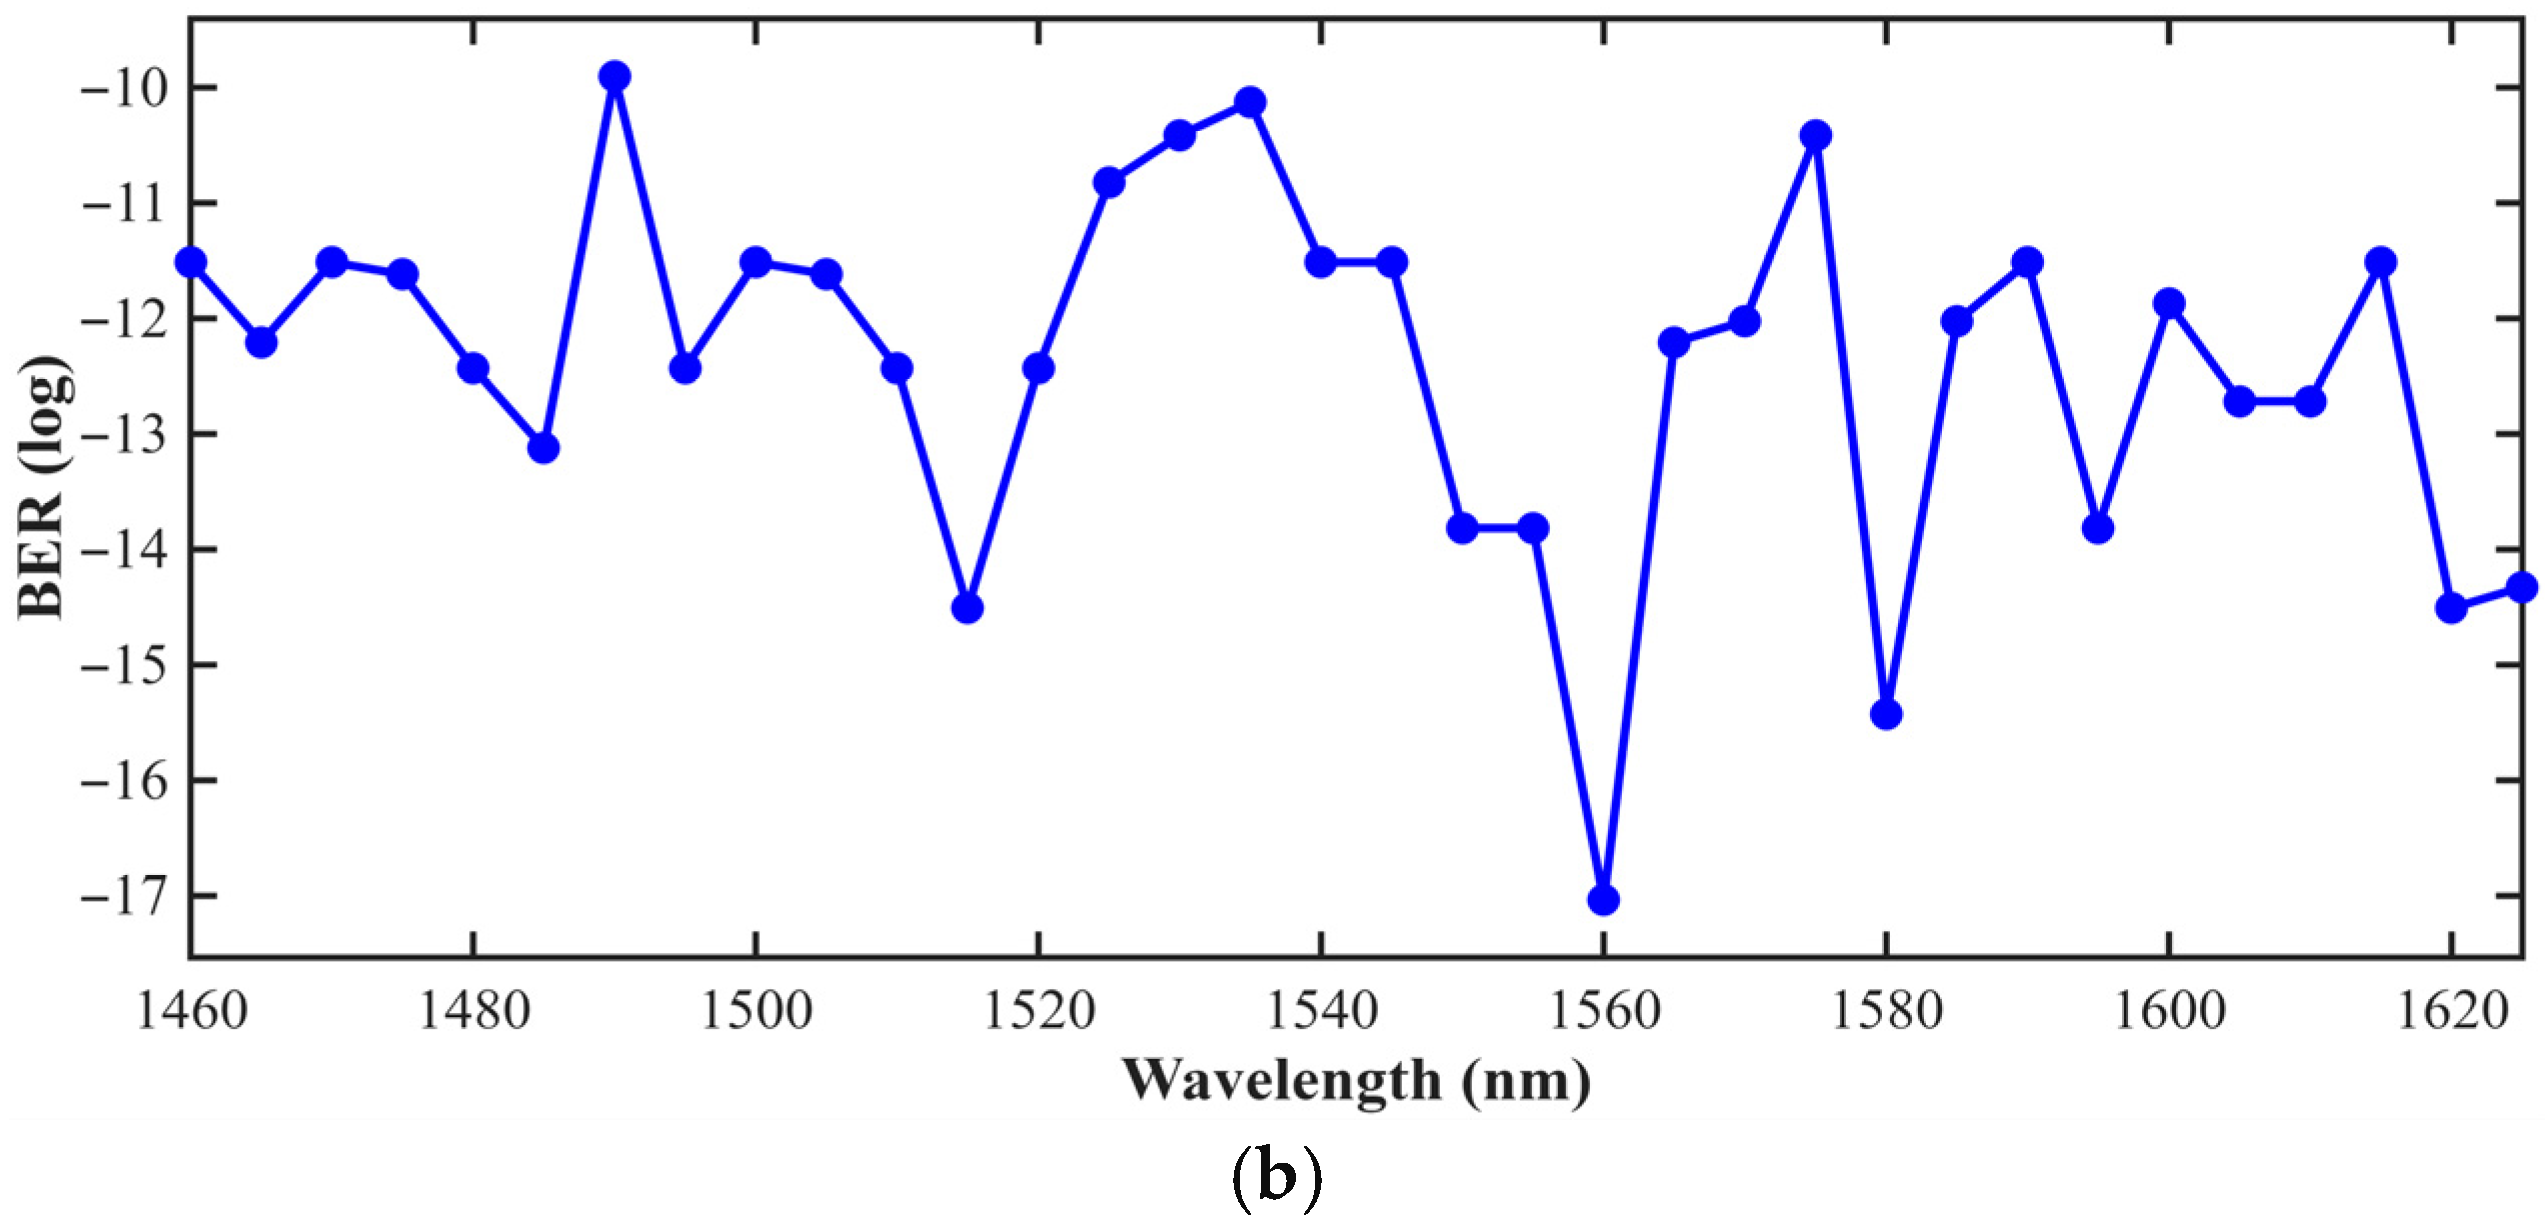
When small spectral deviations were neglected, the maximum quality factor ordering for 100 and 150 mA was C > S > L, while, for 200 mA, it was S > L > C. Figure 13 summarizes the maximum quality factor and BER variation with SOA current across all wavelengths.
Figure 14 also provides a detailed comparison for 150 mA SOA bias. It shows that the maximum quality factor is C > S > L, while the BER is C < S < L. The highest quality factor was achieved in the C-band, and the lowest was observed in the S-band.
The observed BER trends can be directly associated with the SOA gain dynamics and noise characteristics. At moderate bias currents, improved gain conditions lead to lower BER values, while, at higher bias levels, saturation effects and increased amplified spontaneous emission (ASE) noise contribute to BER degradation.
Similarly, the variations in maximum quality factor are closely related to the signal-to-noise conditions governed by SOA operation. Higher quality factor values are achieved under balanced gain conditions, whereas performance degradation at higher bias currents can be attributed to nonlinear distortion and noise accumulation.
In addition, wavelength-dependent propagation effects further influence both BER and maximum quality factor across the S-, C-, and L-bands, confirming the strong dependence of system performance on both SOA operating conditions and wavelength selection.

3.5. Comparative Literature Evaluation

Table 4 presents a comparative summary of related studies in the literature. In studies that incorporated SOA and BPF, the main goals were to enhance transmission capacity, generate pulses, and enable wavelength conversion. WDM-based systems typically focused on high data rates and capacity. Raz et al. [16] and Mazlan et al. [17] demonstrated UWB generation using high SOA drive currents (262–700 mA). In contrast, Taki et al. [18] produced quadruple and quintuple Gaussian pulses at substantially lower SOA currents (100–200 mA) without using optical filtering. Pei et al. [19] achieved a markedly broader FBW (166%) through amplifier-free PM–IM conversion, exceeding the EDFA–BPF-based performance reported by Wang [23] (84–85%). Regarding system-level performance, Renaudier et al. [20] showed that the SNR ranking across the S-, C-, and L-bands in SOA-based WDM systems follows C > L > S, while Hamaoka et al. [21] reported the same ordering (C > L > S) for the maximum quality factor using EDFA, TDFA, and Raman amplification. Nielsen et al. [22] introduced a simplified C-band converter architecture incorporating SOA, EDFA, and BPF. Recent integrated photonic SOA designs have also focused on improving polarization insensitivity and gain performance across different wavelength bands [10,11,12,13,14,15]. These studies demonstrate that SOA design parameters significantly influence gain behavior and system performance.
Our study, which utilizes SOA and BPF for photonic UWB generation, represents one of the limited number of reported examples of UWB pulse generation within a photonic circuit. Unlike the circuit in [19], which did not include an amplifier, our work achieved quadruplet-type Gaussian pulses with an FBW of 100%. Using the same SOA bias current levels as Taki et al. [18], the proposed system exhibits improved spectral bandwidth characteristics. Our findings confirm that SOA and BPF integration effectively enhances UWB pulse generation and transmission performance in photonic systems. The 100% FBW achieved and good compliance with FCC masks show the system’s efficiency and suitability for multiwavelength UWBoF communication.
Compared with previously reported studies, the proposed system demonstrates a balanced trade-off between spectral efficiency and system simplicity. A detailed comparison is summarized in Table 4, highlighting the differences in system architecture, performance metrics, and achieved FBW. For instance, Pei et al. [19] achieved a higher FBW of 166% without using optical amplification; however, their system did not evaluate transmission quality metrics such as BER and maximum quality factor. In contrast, Taki et al. [18] reported lower bandwidth performance under similar SOA bias currents, indicating that the integration of a BPF in the proposed design contributes to improved spectral shaping. Furthermore, studies such as those conducted by Renaudier et al. [20] and Hamaoka et al. [21] primarily focused on transmission performance across wavelength bands and reported the superiority of the C-band in terms of SNR and quality factor. These comparisons further confirm the effectiveness of the proposed SOA–BPF integrated architecture in achieving competitive performance with reduced system complexity.
The results of this study are consistent with these findings under moderate SOA bias conditions, while additionally revealing a performance shift at higher bias levels due to nonlinear saturation effects. Therefore, the proposed system not only confirms previously observed wavelength-dependent trends but also provides new insights into the interaction between SOA operating conditions and UWB signal quality.
Overall, a wide range of studies in the literature have investigated photonic UWB systems through both simulation and experimental approaches. Experimental studies have demonstrated the feasibility of generating Gaussian-derivative UWB pulses with high FBW values (on the order of 80–85%) [23], while multi-band UWB transmission across the S-, C-, and L-bands has been successfully achieved over practical distances (e.g., tens of kilometers) [21]. In addition, SOA-based optical systems have been widely employed for UWB transmission, including high-capacity scenarios exceeding 100 Tb/s [20]. Furthermore, experimental studies on SOA-based optical signal processing have demonstrated low penalty (around 0.5–0.7 dB) and high-performance operation at data rates up to 80 Gb/s [16]. It has also been reported that the SOA models used in simulation environments exhibit high accuracy and strong agreement with experimental data [18]. These findings suggest that the proposed system is not only theoretically sound but also has strong potential for practical implementation.

3.6. Discussion

  • Performance under Low Bias Current: The analysis shows a clear change in performance rankings as the SOA bias current moves from low to high gain. At low current levels (100–150 mA), the SOA provides high small-signal gain but remains weakly saturated. In this state, system behavior is mainly influenced by fiber loss. Given these conditions, the intrinsic low-loss features of the C-band result in the highest maximum quality factor, consistent with expectations in standard fiber-optic transmission. The performance ranking follows C > S > L, reflecting the attenuation-limited system.
  • Performance under High Bias Current: It can be observed that the gain increase becomes less pronounced at higher bias currents, indicating the presence of saturation effects in the SOA. At higher current levels (200 mA), the SOA enters deep saturation, causing a marked increase in ASE noise and nonlinear distortions, such as cross-gain modulation. The C-band, coinciding with the SOA gain profile peak, is greatly affected, leading to a decrease in maximum quality factor. In contrast, the S-band, positioned on the slope of the gain profile, accumulates less noise and exhibits better performance than the C-band. This situation shows a fundamental change in the maximum quality factor ranking to S > L > C, highlighting a shift from an attenuation-limited to a noise-limited system.
  • FBW and Spectral Compliance: The integration of the BPF was instrumental in achieving 100% FBW while maintaining strong compliance with the FCC spectral mask. The resulting nanosecond-scale Gaussian quadruplet UWB pulses show both high temporal accuracy and spectral efficiency, compared with earlier SOA-based setups that reported lower FBW values.
  • Implications for Photonic UWB Design: These findings highlight the important role of the SOA operational state in determining the optimal wavelength band for pulse generation. In PM-IM-based photonic UWB circuits, the interaction between fiber loss, the SOA gain profile, and nonlinear noise affects performance. This interaction requires careful optimization of bias current and wavelength choice. The results suggest that compact photonic designs can be tuned to achieve better pulse quality across different wavelength bands, providing design guidelines for next-generation broadband UWB systems.

4. Conclusions

UWBoF technology has become increasingly significant with the growing demand for high-capacity, low-latency communication. This study clearly demonstrates the successful generation of photonic UWB Gaussian quadruplet pulses using a single SOA and a single BPF in a compact photonic circuit. Numerous studies have explored different combinations of S-, C-, and L-band wavelengths and amplification schemes to improve transmission and pulse generation performance. By analyzing the effect of the SOA bias current on maximum quality factor, BER, and time-frequency characteristics, this study highlights the strong dependence of pulse performance on operational conditions. In this sense, this research constitutes a multi-purpose investigation that simultaneously addresses both UWB pulse generation and transmission quality. The proposed design achieves 100% FBW on the nanosecond scale while remaining compliant with the FCC spectral mask, demonstrating both high spectral efficiency and temporal precision. Previous studies have indicated variations in quality factor across wavelength bands, while this work shows that such variations can be actively managed through SOA bias, highlighting the circuit’s flexibility and potential for advanced UWB photonic systems.
High FBW values are attained, and the maximum quality factor rankings across S-, C-, and L-bands vary based on the SOA current level, with sequences such as C > S > L and S > L > C observed under different conditions. Overall, this study provides a comprehensive analysis of how varying SOA saturation levels within an SOA–BPF photonic UWB architecture modify the performance hierarchy across the S-, C-, and L-bands, offering insights into the wavelength-dependent behavior of photonic UWB pulse generation.
The proposed system offers several advantages. It provides a simple and compact photonic architecture by employing only a single SOA and a single BPF, reducing system complexity compared to multi-component designs. The system is capable of generating Gaussian quadruplet UWB pulses with a high FBW of 100% while maintaining strong compliance with the FCC spectral mask. In addition, the proposed approach enables the simultaneous evaluation of both pulse generation and transmission performance within a unified framework. The results also demonstrate that system performance can be flexibly controlled through SOA bias current adjustment across different wavelength bands. Although the system offers several advantages, it also presents certain constraints. The system performance is sensitive to the SOA bias current, and higher current levels may lead to saturation effects and increased noise. Furthermore, the study is based on simulation results, and experimental validation is required for practical implementation. The proposed architecture is composed of widely used photonic building blocks, such as a phase modulator, SOA, optical filter, photodiode, LPF, and BPF, supporting its practical feasibility and potential experimental implementation. Therefore, experimental validation is required to confirm the simulated BER, maximum quality factor, and spectral performance under realistic device and noise conditions.
Future research will focus on enhancing photonic UWB pulse generation by achieving higher FBW and better-quality factors, optimizing SOA biasing and filter setups, exploring new wavelength combinations and advanced modulation methods, and integrating compact photonic components to support scalable, energy-efficient, high-performance UWB systems for future optical communications.

Author Contributions

Conceptualization, M.F.; methodology, M.F.; software, M.F.; formal analysis, M.F.; investigation, M.F.; data curation, M.F.; writing—original draft, M.F.; visualization, M.F.; supervision, Ö.G.S.; validation, Ö.G.S.; writing—review and editing, Ö.G.S. All authors have read and agreed to the published version of the manuscript.

Funding

This research received no external funding.

Institutional Review Board Statement

Not applicable.

Informed Consent Statement

Not applicable.

Data Availability Statement

The data presented in this study are available on request from the corresponding author.

Conflicts of Interest

The authors declare no conflicts of interest.

References

  1. Faeik, M.; Al-Okby, R.; Junginger, S.; Roddelkopf, T.; Thurow, K. UWB-based real-time indoor positioning systems: A comprehensive review. Appl. Sci. 2024, 14, 11005. [Google Scholar] [CrossRef]
  2. US Federal Communications Commission. Revision of Part 15 of the Commission’s Rules Regarding Ultra-Wideband Transmission Systems; US Federal Communications Commission: Washington, DC, USA, 2002. Available online: https://www.fcc.gov/document/revision-part-15-commissions-rules-regarding-ultra-wideband-7 (accessed on 16 April 2026).
  3. Singh, S.; Singh, A.; Kaler, R.S. Performance evaluation of EDFA, RAMAN and SOA optical amplifier for WDM systems. Optik 2013, 124, 95–101. [Google Scholar] [CrossRef]
  4. Tang, H.; Yang, C.; Qin, L.; Liang, L.; Lei, Y.; Jia, P. A review of high-power semiconductor optical amplifiers in the 1550 nm band. Sensors 2023, 23, 7326. [Google Scholar] [CrossRef] [PubMed]
  5. Li, C.; Han, X.; Fu, S.; Gu, Y.; Wu, Z.; Zhao, M. Experimental generation of reconfigurable ultra-wideband signal based on the pulse difference by using optical polarization synthesis. IEEE Photonics J. 2022, 14, 1–9. [Google Scholar] [CrossRef]
  6. Senior, J.M.; Jamro, M.Y. Optical Fiber Communications: Principles and Practice; Pearson Education: London, UK, 2009. [Google Scholar]
  7. Saleh, B.E.A.; Teich, M.C. Fundamentals of Photonics, 2nd ed.; Wiley: Hoboken, NJ, USA, 2019. [Google Scholar]
  8. Yu, H.Y.; Mahgerefteh, D.; Cho, P.S.; Goldhar, J. Optimization of the frequency response of a semiconductor optical amplifier wavelength converter using a fiber Bragg grating. J. Light. Technol. 1999, 17, 308–314. [Google Scholar] [CrossRef]
  9. Dong, Y.; Lu, L.; Wang, H.; Xie, S. Improving performance using waveguide filter and optimal probe and signal powers for all-optical wavelength conversion. In Optical Fiber Communication Conference; IEEE: New York, NY, USA, 2000. [Google Scholar] [CrossRef]
  10. Zali, A.; Kleijn, S.; Augustin, L.; Stabile, R.; Calabretta, N. Low polarization sensitive semiconductor optical amplifier co-integrated with passive waveguides for optical datacom and telecom networks. In Proceedings of the 22nd European Conference on Integrated Optics (ECIO); Springer: Berlin/Heidelberg, Germany, 2020; Available online: https://www.ecio-conference.org/wp-content/uploads/2020/06/P1-Aref-Rasoulzadeh-Zali-Abstract-Low-Polarization-Sensitive-Semiconductor-Optical-Amplifier-Co-Integrated-with-PassiveWaveguidesforOptical-Datacom-and-Telecom-Networks-ECIO-2020.pdf (accessed on 16 April 2026).
  11. Zali, A.R.; Kleijn, S.; Augustin, L.; Tessema, N.M.; Prifti, K.; Stabile, R.; Calabretta, N. Design and fabrication of low polarization dependent bulk SOA co-integrated with passive waveguides for optical network systems. J. Light. Technol. 2022, 40, 1083–1091. [Google Scholar] [CrossRef]
  12. Zali, A.R.; Stabile, R.; Calabretta, N. Design and analysis of novel O-band low polarization sensitive SOA co-integrated with passive waveguides for optical systems. IEEE Photonics J. 2022, 14, 1–10. [Google Scholar] [CrossRef]
  13. Zali, A.R.; Stabile, R.; Calabretta, N. Design and investigation of low polarization strained-barrier quantum well SOA co-integrated with passive waveguides. Opt. Express 2025, 33, 27414–27428. [Google Scholar] [CrossRef] [PubMed]
  14. Kotb, A.; Zoiros, K.E.; Chen, W. High-performance optical NOR gate with SOA-MZI. Photonics 2025, 12, 179. [Google Scholar] [CrossRef]
  15. Stabile, R. Towards large-scale fast reprogrammable SOA-based photonic integrated switch circuits. Appl. Sci. 2017, 7, 920. [Google Scholar] [CrossRef]
  16. Raz, O.; Herrera, J.; Dorren, H.J.S. Enhanced 40 and 80 Gb/s wavelength conversion using a rectangular shaped optical filter for both red and blue spectral slicing. Opt. Express 2009, 17, 1184–1193. [Google Scholar] [CrossRef] [PubMed]
  17. Mazlan, I.Z.; Wahid, M.H.; Hassan, A.F.; Azidin, M.A.M.; Isa, N.F.M. Cross gain modulation (XGM) based on wavelength conversion using semiconductor optical amplifier and filter. Int. J. Microw. Opt. Technol. 2014, 9, 115–118. [Google Scholar]
  18. Taki, H.; Azou, S.; Hamie, A.; Al Housseini, A.; Alaeddine, A.; Sharaiha, A. Improving the power efficiency of SOA-based UWB over fiber systems via pulse shape randomization. Opt. Fiber Technol. 2016, 31, 161–167. [Google Scholar] [CrossRef]
  19. Pei, W.; Yalin, G.; Wen, L. Simultaneous generation and transmission of ultra-wideband wireless signals and baseband wired signals. In IEEE ICCT; IEEE: New York, NY, USA, 2017. [Google Scholar] [CrossRef]
  20. Renaudier, J.; Arnould, A.; Ghazisaeidi, A.; Le Gac, D.; Brindel, P.; Awwad, E.; Makhsiyan, M.; Mekhazni, K.; Blache, F.; Boutin, A.; et al. Recent advances in 100+ nm ultra-wideband fiber-optic transmission systems using semiconductor optical amplifiers. J. Light. Technol. 2020, 38, 1071–1079. [Google Scholar] [CrossRef]
  21. Hamaoka, F.; Nakamura, M.; Okamoto, S.; Minoguchi, K.; Sasai, T.; Matsushita, A.; Yamazaki, E.; Kisaka, Y. Ultra-wideband WDM transmission in S-, C-, and L-bands using signal power optimization scheme. J. Light. Technol. 2019, 37, 1764–1771. [Google Scholar] [CrossRef]
  22. Nielsen, M.L.; Lavigne, B.; Dagens, B. Polarity-preserving SOA-based wavelength conversion at 40 Gbit/s using bandpass filtering. Electron. Lett. 2003, 39, 1334–1335. [Google Scholar] [CrossRef]
  23. Wang, Z. UWB signal generation and transmission technology. In EIECS; IEEE: New York, NY, USA, 2023. [Google Scholar] [CrossRef]
  24. Tan, Y.; Zhai, J. Photonic synthesis based ultra-wide band signal generation. In AOPC; SPIE: Bellingham, WA, USA, 2023. [Google Scholar] [CrossRef]
  25. ITU. Optical System Design and Engineering Considerations (G. Sup 39); ITU: Geneva, Switzerland, 2016; Available online: https://www.itu.int/rec/T-REC-G.Sup39/en (accessed on 16 April 2026).
  26. Van den Hout, M. Ultra-Wideband and Space-Division Multiplexed Optical Transmission Systems. Ph.D. Thesis, Eindhoven University of Technology, Eindhoven, The Netherlands, 2024. [Google Scholar]
  27. Filiz, M.; Saraçoğlu, Ö.G. Analysis of Photonic UWB Pulse Generation in S, C, L Wavelengths. In SIU; IEEE: New York, NY, USA, 2025. [Google Scholar] [CrossRef]
  28. Optiwave Systems Inc., Ottawa, ON, Canada. Available online: https://optiwave.com/ (accessed on 17 October 2025).
  29. MATLAB. Available online: https://www.mathworks.com/products/matlab.html (accessed on 17 October 2025).
  30. Aşırım, Ö.E.; Jirauschek, C. Design of quantum-dot semiconductor optical amplifiers with near-zero linewidth enhancement factor. Opt. Quantum Electron. 2024, 56, 1574. [Google Scholar] [CrossRef]
  31. Storkfelt, N.; Mikkelsen, B.; Olesen, D.S.; Yamaguchi, M.; Stubkjaer, K.E. Measurement of carrier lifetime and linewidth enhancement factor for 1.5-μm ridge-waveguide laser amplifier. IEEE Photonics Technol. Lett. 1991, 3, 632–634. [Google Scholar] [CrossRef]
  32. Fernandes, J.R.; Wentzloff, D. Recent advances in IR-UWB transceivers: An overview. In IEEE ISCAS; IEEE: New York, NY, USA, 2010. [Google Scholar] [CrossRef]
Figure 1. Schematic of the simulated photonic communication circuit implementing PM–IM conversion [19]. BSG—bit sequence generator; NRZG—non-return-to-zero generator; CWL—continuous wave laser; PM—phase modulator; GOF—Gaussian optical filter; Fiber—single-mode fiber; TW-SOA—travelling-wave SOA; PD—photodiode; LPF—low-pass filter; BPF—band-pass filter.
Photonics 13 00402 g001
Figure 2. FCC spectral masks: (a) indoor, (b) outdoor.
Photonics 13 00402 g002
Figure 3. BER and quality factor analysis of the photonic UWB pulse generation circuit at (a) S-, (b) C-, and (c) L-band wavelengths for a 100 mA SOA current. Differently colored curves correspond to distinct eye diagram levels representing varying signal quality conditions.
Photonics 13 00402 g003
Figure 4. Filter input and output signals at 100 mA SOA current: (a) before LPF, (b) after LPF, (c) after BPF.
Photonics 13 00402 g004
Figure 5. Time- and frequency-domain analyses of UWB Gaussian pulses for 100 mA SOA current: (a,b) S-band, (c,d) C-band, (e,f) L-band. The blue curve represents the FCC mask, while the red curve corresponds to the generated UWB signal.
Photonics 13 00402 g005
Figure 6. BER and quality factor analysis of the photonic UWB pulse generation circuit at (a) S-, (b) C-, and (c) L-band wavelengths for a 150 mA SOA current. Differently colored curves correspond to distinct eye diagram levels representing varying signal quality conditions.
Photonics 13 00402 g006
Figure 7. Filter responses for 150 mA SOA current: (a) NRZ input signal at the circuit input, (b) before LPF, (c) after LPF, (d) after BPF.
Photonics 13 00402 g007
Figure 8. Time- and frequency-domain analyses for 150 mA SOA current: (a,b) S-band, (c,d) C-band, (e,f) L-band. The blue curve represents the FCC mask, while the red curve corresponds to the generated UWB signal.
Photonics 13 00402 g008
Figure 9. BER and quality factor analysis of the photonic UWB pulse generation circuit at (a) S-, (b) C-, and (c) L-band wavelengths for a 200 mA SOA current. Differently colored curves correspond to distinct eye diagram levels representing varying signal quality conditions.
Photonics 13 00402 g009
Figure 10. Filter input and output signals for 200 mA SOA current: (a) before LPF, (b) after LPF, (c) after BPF.
Photonics 13 00402 g010
Figure 11. Time- and frequency-domain analyses for 200 mA SOA current: (a,b) S-band, (c,d) C-band, (e,f) L-band. The blue curve represents the FCC mask, while the red curve corresponds to the generated UWB signal.
Photonics 13 00402 g011
Figure 12. SOA gain (dB) as a function of bias current in the photonic UWB circuit with BPF.
Photonics 13 00402 g012
Figure 13. Maximum quality factor (a) and BER variation (b) versus SOA current for S-, C-, L-band wavelengths.
Photonics 13 00402 g013
Figure 14. (a) Maximum quality factor and (b) BER values at 150 mA SOA current for S-, C-, L-bands.
Photonics 13 00402 g014aPhotonics 13 00402 g014b
Table 1. Spectral bands in single-mode fiber assigned by the International Telecommunication Union (ITU) [25].
O—OriginalE—ExtendedS—ShortC—ConventionalL—LongU—Ultra Long
1260–1360 nm1360–1460 nm1460–1530 nm1530–1565 nm1565–1625 nm1625–1675 nm
Table 2. Characteristics of the SOA used in the simulated photonic UWB circuit.
CategoryParameterValueUnit
Physical Length 0.0005 m
Physical Width 3 × 10⁻⁶ m
Physical Height 80 × 10−9 m
Physical Optical confinement factor 0.3
Physical Loss 0 1/m
Physical Differential gain 27.8 × 10⁻²¹ m2
Physical Carrier density at transparency 1.4 × 1024 m−3
Physical Linewidth enhancement factor 5
Physical Recombination coefficient A 143 × 106 1/s
Physical Recombination coefficient B 99.9 × 10⁻¹⁸ m3/s
Physical Recombination coefficient C 3 × 10−41 m6/s
Physical Initial carrier density 3 × 1024 m−3
Numerical Integration type Runge–Kutta 4th order
Numerical Relative tolerance 1 × 10⁻⁶
Numerical Maximum number of steps 1,000,000
Numerical Interpolation type Cubic
Numerical Number of interpolation points 4
Numerical Carrier Lifetime 50–200 ps
Table 3. Characteristics of the LPF and BPF used in the simulated photonic UWB circuit.
Filter TypeParameterValueUnit
LPF Cutoff frequency 0.75 × Symbol rate Hz
LPF Insertion loss 0 dB
LPF Depth 100 dB
BPF Center frequency 10 GHz
BPF Bandwidth 1.5 × Symbol rate Hz
BPF Insertion loss 0 dB
BPF Depth 100 dB
Table 4. Literature comparison summary. FBW value for [18] is estimated from the reported spectra. The table includes both simulation-based and experimentally validated studies for a comprehensive comparison. * indicates the results obtained in this work.
Ref.WavelengthAmplifier (mA)FilterUWB Pulse Generating Method/TechnologyType of UWB Pulse GeneratedWavelength Comparison TypePurposeFBW%Wavelength Comparison
[16]CSOA/262–400
EDFA
BPF--FWHM
BER
Pulse Generating--
[17]CSOA/700
EDFA
BPFWDM-PowerTransmission--
[18]-SOA/100
150
200
-XGMQuadruplet, QuintupletFBWPulse Generating~86 (estimated)-
[19]--BPF
LPF
PM-IM, WDMMono
Doublet
FBWTransmission166-
[20]S, C, LSOA
Raman
EDFA
BPFWDM-SNRTransmission-C > L > S
[21]S, C, LEDFA TDFA
Raman
-WDM-Maximum quality factorTransmission-C > L > S
[22]CSOA
EDFA
BPFWDM-BERTransmission--
[23]CEDFATrapezoidal
BPF
PM-IMMono
Doublet
FBWPulse Generating84
85
-
[*]
This Work
S, C, LSOA/100
150
200
BPFPM-IMQuadrupletFBW, Maximum quality factorTransmission
Pulse Generating
100C > S > L
C > S > L
S > L > C
Disclaimer/Publisher’s Note: The statements, opinions and data contained in all publications are solely those of the individual author(s) and contributor(s) and not of MDPI and/or the editor(s). MDPI and/or the editor(s) disclaim responsibility for any injury to people or property resulting from any ideas, methods, instructions or products referred to in the content.