Abstract
As spillways are hydraulic structures constructed for the safe release of floodwater from the upstream (US) side of a dam to the downstream side, or from the end of canals and drains to a lower stream, the upstream water flow of such structures gains significant amounts of potential energy. As this water flows over a spillway or escapes, the gained potential energy is converted into kinetic energy, resulting in the water gaining an increasing velocity, thereby enhancing the flow’s destructive potential. This can have a harmful impact on the hydraulic performance and the structural stability of the spillway itself. To avoid such harmful effects, engineers and designers of such structures usually provide the spillways and water escapes with some tools for dissipating that kinetic energy and decreasing the flowing water’s velocity. The present study aims to enhance the performance efficiency of such dissipating tools, as well as to improve the quality of the flowing water by leveraging the significant turbulence generated by the existing energy dissipators on the back of the spillway body. The aeration process enabled by this turbulence increases the dissolved oxygen contents, thereby enhancing the water quality, which is one of the main objectives of this work. On the back surface of the spillway, various dissipater shapes with different geometrical configurations, dimensions, and combinations were tested, in order to determine the most suitable engineering treatments for maximizing the dissolved oxygen content and improving the water quality for various uses, as the study’s main goal. By testing 21 different model configurations with the available laboratory discharges, the study successfully identified the most effective shape and properties of the desired dissipator, which increased the dissolved oxygen content by an average of 21.70% and dissipated water energy by about 69%.
1. Introduction
Through our review of the literature concerning technical treatments that can be implemented on the inclined back surface of a spillway body in order to increase its water energy dissipation efficiency, we conceived the idea of examining the role of these engineering treatments in enhancing the water’s dissolved oxygen content. In the present study, we aim to determine whether these treatments would similarly enrich both the rate of energy dissipation and the flow of dissolved oxygen, thereby improving the water quality. A total of 21 models were tested in the irrigation laboratory using different shapes of roughness elements (steps) on the back surface of the spillway body, with varying dimensions and distributions. The main objective of this study is to introduce a modified spillway, equipped with geometrical treatments designed to enhance its efficiency in aerating the flow and increasing the dissolved oxygen content. Such objectives will be achieved through studying the following parameters:
- -
- The most effective number of steps (Ns).
- -
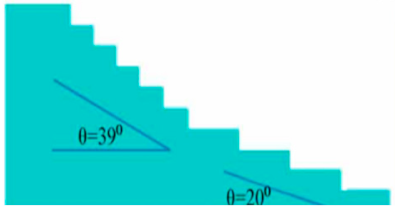
- The most effective angle of the back surface of the spillway body (θ°).
- -
- The optimum value of the ratio between the step height and the spillway height (h/H).
Additionally, the geometrical arrangement and distribution of the step roughness over the spillway back body were tested to determine whether straight rows of steps or a staggered arrangement is more effective.
2. Literature Review
Aeration is the process through which air interacts with the flow of water, allowing for an increase in the dissolved oxygen content, which in turn improves water quality. It is recognized as the most efficient and economical method for enhancing the dissolved oxygen levels in water, thereby making it suitable for uses such as irrigation and drinking. One of the most desirable outcomes of constructing stepped spillways or stepped weirs is the improvement of water quality and flow aeration.
The challenges posed by natural and artificial waterfalls have garnered the attention of researchers and scholars for a long time, as these structures can negatively impact safety and soil stability in their vicinity. Many investigators have sought to introduce geometrical modifications to the inclined back surface of spillways to enhance their efficiency in dissipating the kinetic energy generated by falling water. The goal is to ensure the safety of the structure and the downstream area.
Such geometrical treatments not only improve energy dissipation but also enhance the aeration of the falling flow, making them beneficial. Table 1 and Table 2 present the most common technical methods tested by various authors and their efforts to improve energy dissipation and flow aeration downstream of the spillway, respectively.

Table 1.
Effects of step geometry of spillways on the energy dissipation according to different authors.
Table 2.
Effects of step geometry of spillway on the flow aeration according to different authors.
From the above-constructed Table 1, the following can be noted:
- ▪
- Modification in rough step geometry could enhance the degree of the water energy dissipation efficiency.
- ▪
- The end sill proved more efficient than the reverse inclined angle.
- ▪
- The steps with inclined slopes proved to be more effective than the steps with end sills having the same size.
- ▪
- It was noticed that the effective length of the reverse inclined angle has not been investigated yet, according to the best of our knowledge. Therefore, it will be studied in the present experimental study.
From the constructed Table 2, it can be observed that the dissolved oxygen content increases with a decreasing Froude number and by decreasing the ratio of critical flow depth to step height (yc/h). Additionally, modifications in the geometry of the rough steps could enhance the degree of flow aeration.
3. Theoretical Approach and Dimensional Analysis
Dimensional analysis is used to investigate the relationships between the different parameters affecting the degree of water energy dissipation, efficiency, and flow aeration, through which the flow’s dissolved oxygen content can be improved.
The two primary challenges in the spillway design process are water conveyance and energy dissipation. Water conveyance involves hydraulic design, which ensures that the expected discharges can be effectively conveyed through the spillway. Energy dissipation, on the other hand, is influenced by multiple factors, including the geometry of the spillway body itself, the shape of the upstream crest edge, the degree of roughness on the downstream inclined surface of the spillway, and the geometry and arrangement of any roughening elements used on the spillway surface. Addressing both water conveyance and energy dissipation is crucial for the overall effectiveness and safety of the spillway design. The different parameters affecting stepped spillways can be classified as follows:
- Fluid characteristics: ρ is the water density (kg/m3); μ is the dynamic viscosity (kg/m.s); and ơ is the surface tension (kg/s2).
- Spillway Geometry Characteristics: B is the original channel width (m); h is the step height (m); H is the total height of the spillways (m); L is the length of the spillway (m); is the step length (m); Ns is the number of steps; and θ is the angle of the back surface of the spillway.
- Flow characteristics: ∆E is the total energy loss (m); is the critical velocity over the spillway (m/s); is the water velocity just downstream of the spillway (m/s); V0 is the upstream water velocity (m/s); g is the acceleration of gravity (m/s2), Q is the discharge (m3/s); q is the discharge per unit width of channel (m2/s); y is the flow depth over the crest level upstream of the spillway (m); y1 is the flow depth just downstream of the spillway (m); yo is the flow depth upstream of the spillway (m); and is the critical water depth over the spillway (m).
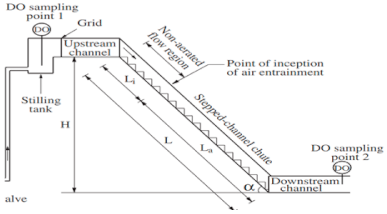
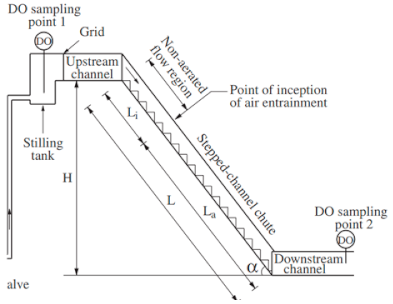
The following Figure 1 represents a schematic diagram for the experimental model of the present study and all the parameters affecting the specific energy.
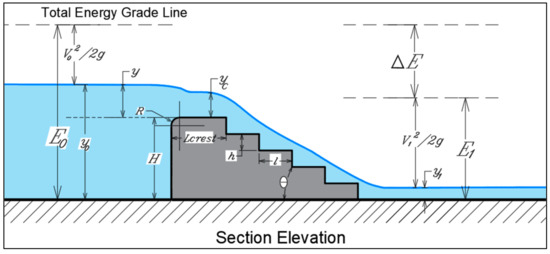
Figure 1.
Definition sketch of the experimental model.
The general relationship of the previously mentioned variables may be written as follows:
By using Buckingham’s π theorem with repeating variables ρ, and , Equation (1) can be written as follows:
where (Reynolds number), (Froude number at upstream section), (Weber number). The effect of viscosity is assumed to be of secondary importance in estimating the effect of aeration, as the flow is mainly driven by gravity, and therefore, the effect of the Reynolds number (Re) can be ignored. Similarly, the effect of the Weber number (We) can be ignored, as the temperature in the laboratory was kept almost constant during the experiments, implying no significant effect of surface tension. The channel bed width (B), the total height of the spillways (H), and the total length of the spillway (L) are all held constant. So, the general equation could be reduced to the following:
The relationship between energy dissipation or dissolved oxygen content and the spillway step length can be written as follows:
The relationship between energy dissipation or dissolved oxygen content and the number of steps in the spillway can be written as follows:
The relationship between energy dissipation or dissolved oxygen content and the length of the reverse slope on the steps of the spillway can be written as follows:
The relationship between energy dissipation or dissolved oxygen content and the radius of the end sill on the steps of the spillway can be written as follows:
4. Experimental Approach
The experimental work of the present study was carried out in the Irrigation and Hydraulic Laboratory of the Civil Engineering Department, Faculty of Engineering, Assiut University, Egypt. The experiments were conducted using a horizontal channel with a rectangular cross-section, measuring 20 m long, 0.30 m wide, and 0.50 m deep, as shown in Figure 2. The water was supplied to the channel by an electrically driven centrifugal pump in a closed system. The discharge was measured using a calibrated orifice meter with a manometer. A point gauge with a Vernier scale was used to measure the water depth along the flume. The accuracy of the point gauge reading is about ±0.1 mm. Seven discharge values (2.52, 3.57, 4.88, 8.17, 9.76, 12.92, and 19.12 L/s) were used with each model. To control the downstream water depth, a tailgate was located at the end of the channel. The tailgate opening was kept constant for all runs to provide equal conditions as a critical case in dissipating the energy downstream of the spillway.
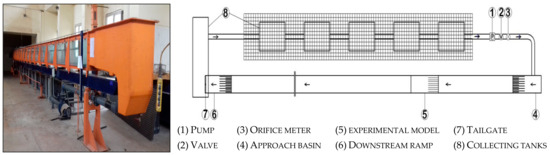
Figure 2.
Experimental set-up.
The Optical Dissolved Oxygen Sensor (PS-2196) is designed to measure the concentration and the saturation percentage of dissolved oxygen molecules in aqueous solutions. The sensor was connected to the Xplorer GLX for collecting, graphing, and analyzing the data. To reduce the dissolved oxygen content in the water, sodium sulfite and cobalt dichloride were added to the channel tanks. Approximately 50–55 g/m3 of was added to set the oxygen concentration in the storage tank between 1 mg/L and 2.5 mg/L at temperatures between 9 °C and 25 °C, according to the equations given by Henderson [35] and Chow [36]. The spillway model used in the experiment had the following dimensions: 30 cm height, 20 cm top width, 30 cm lateral width, 2.4 cm radius of curvature of the upstream face edge, and a variable angle of the back surface of the spillway.
The main objective of the present study is to introduce a new geometrically treated spillway design for more efficient enhancement of the flowing water quality through increased dissolved oxygen content. To achieve this, multiple parameters will be tested to determine the effect of each on meeting the required goals of the study. To achieve the study’s goals, the affecting parameters were tested in five stages.
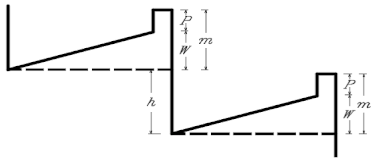
4.1. First Stage: Estimating the Best Effective Ratio of Step Height to Step Length (h/l)
In this stage, six models were tested with variable ratios of (h/l) equals 0.30, 0.40, 0.50, 0.67, 1.00, and 2.00 as shown in the following Figure 3.
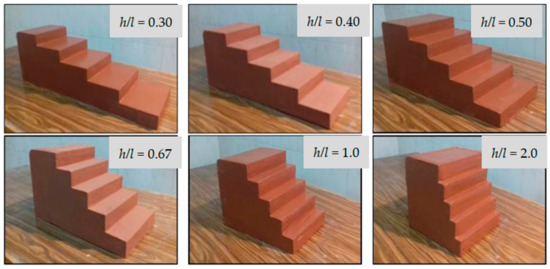
Figure 3.
Models used for estimating the best effective ratio of step height to step length (h/l) on the back surface of the spillway.
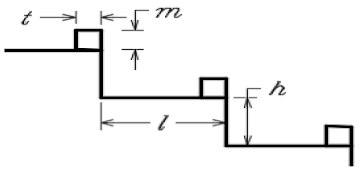
4.2. Second Stage: Estimating the Best Effective Ratio of Step Height to Spillway Height (h/H)
At this stage, six models were tested with variable ratios of (h/H), equals 1/3, ¼, 1/5, 1/6, 1/8, and 1/10, or the effective number of steps (Ns), equals 3, 4, 5, 6, 8, and 10, as shown in the following Figure 4.
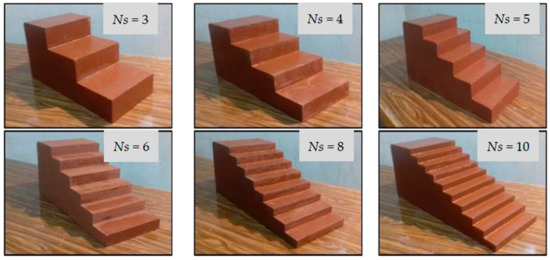
Figure 4.
Models used for estimating the best effective ratio of step height to spillway height (h/H) on the back surface of the spillway.
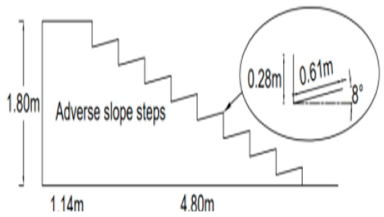
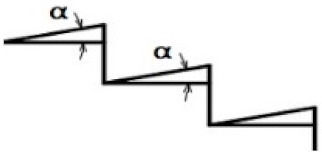
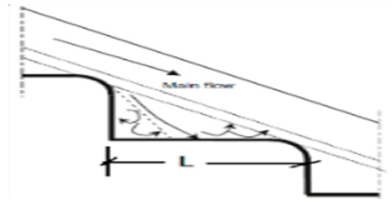
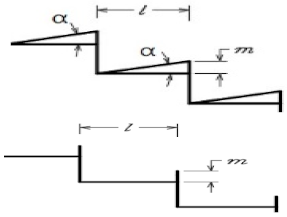
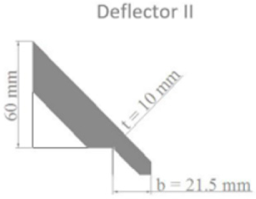
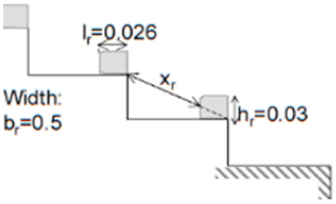
4.3. Third Stage: Estimating the Best Effective Ratio of Length of Reverse Inclined Step to Step Length (lr/l)
In this stage, four models were tested with variable ratios of (lr/l) equals 0.25, 0.50, 0.75, and 1.00, as shown in the following Figure 5.
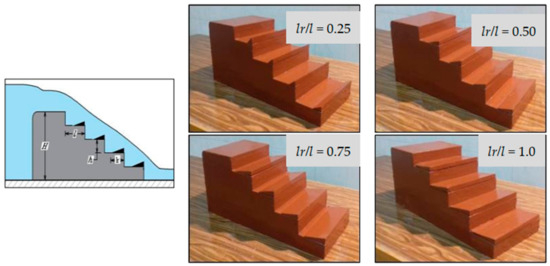
Figure 5.
Models used for estimating the most effective ratio of length of the reverse inclined step to step length (lr/l) on the back surface of the spillway.
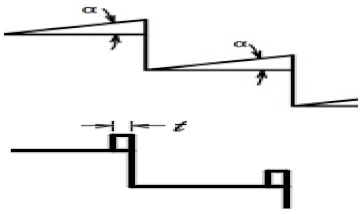
4.4. Fourth Stage: Estimating the Best Effective Ratio of End Sill Radius to Step Height (r/h)
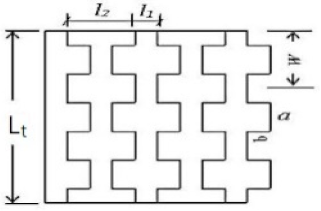
At this stage, four models were tested with varying ratios of (r/h) equals 0.20, 0.40, 0.6, and 0.80, as shown in the following Figure 6.
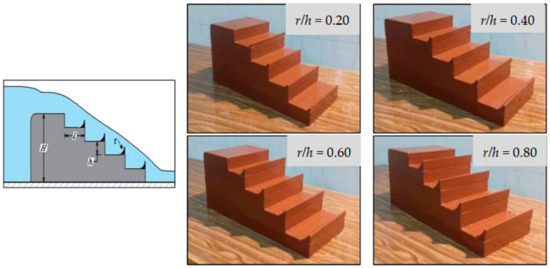
Figure 6.
Models used for estimating the best effective ratio of end sill radius to step height (r/h) on the back surface of the spillway.
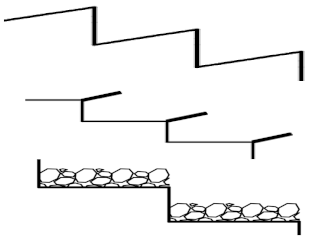
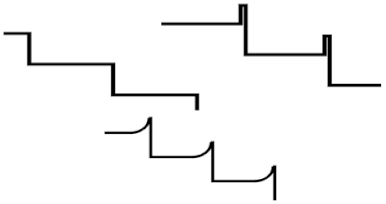
4.5. Fifth Stage: Effect of Staggered Steps Arrangement
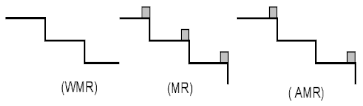
At this stage, five models were tested with different shapes of the back surface of the spillway (smooth spillway, stepped spillway, staggered steps spillway, steps with reverse slope and steps with quarter circular end sill), as shown in Figure 7, and as follows:
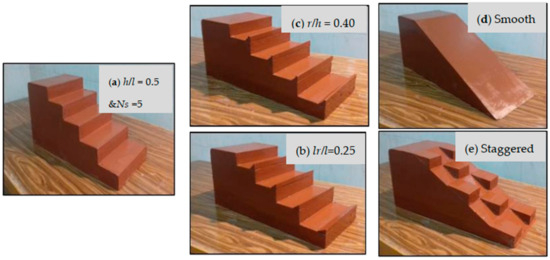
Figure 7.
Models used in comparison between different spillway geometrical arrangements.
- The stepped spillway model with step height to step length ratio (h/l = 0.50), as concluded in stage No. 1, and with the number of steps (Ns = 5), as concluded in stage No. 2.
- The stepped spillway model with the reverse inclined steps has the same dimensions as the stepped spillway, but with the reverse slope with a ratio (lr/l = 0.25), as concluded in stage No. 3.
- The stepped spillway model with a quarter circular end-sill has the same dimensions as the stepped spillway, but with a ratio (r/h = 0.40), as concluded in stage No. 4.
- The traditional spillway model (smooth spillway) has the same dimensions as the stepped spillway but without steps.
- The staggered step spillway model has the same dimensions as the stepped spillway but with staggered step arrangements.
5. Analysis and Discussion
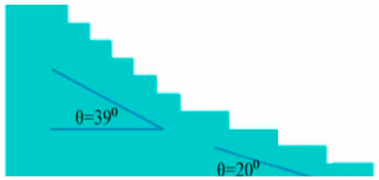
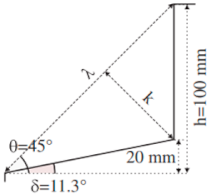
5.1. First Stage: Estimating the Best Effective Ratio (h/l) or Inclination Angle of the Spillway Back Surface (θ°)
At this stage, we tried to determine the optimum angle of the inclined back surface of the spillway (θ°) as an initial step, before equipping the tested roughness elements with different dimensions, shapes, and arrangements. Six models were tested with different values of (h/l) equal to 0.3, 0.4, 0.5, 0.67, 1, and 2. Seven discharge values were used (2.52, 3.57, 4.88, 8.17, 9.76, 12.92, and 19.12 L/s) for each of the six tested models.
To estimate the optimum ratio of step height to step length (h/l) for water energy dissipation efficiency, Figure 8 was plotted. It can be observed that, when the ratio of (h/l) decreases, the relative energy loss (∆E/Eo) increases. Additionally, the ratio (h/l) = 0.50 can be considered the optimum ratio for enhancing relative energy loss. Furthermore, with an increasing discharge, the relative energy loss (∆E/Eo) decreases, because the flow transitions from a napped flow pattern to transition and skimming flow patterns.
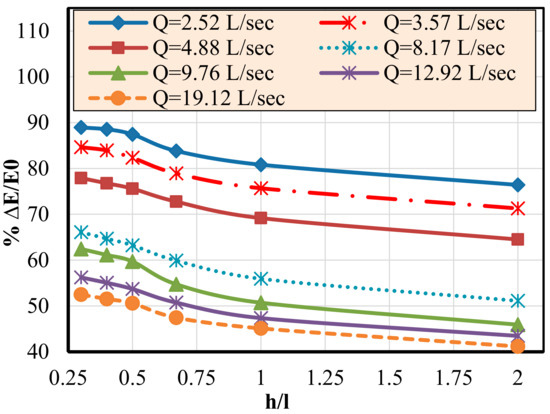
Figure 8.
Relationship between relative energy loss (∆E/Eo) and step height to step length ratio (h/l).
For estimating the most effective ratio of step height to step length (h/l) on the water flow aeration Figure 9 was plotted. From Figure 9, it can be concluded that as the step height to step length ratio (h/l) increases, the relative dissolved oxygen concentration (∆DO/DO0) decreases until the ratio (h/l) reaches 1.00. After this point, it increases slowly again because the water jumps over the steps without flowing directly over them, due to the relatively small step length. Additionally, with increasing discharge, the relative dissolved oxygen concentration (∆DO/DO0) decreases. The ratio (h/l) = 0.50 can be considered the optimum ratio for enhancing flow aeration.
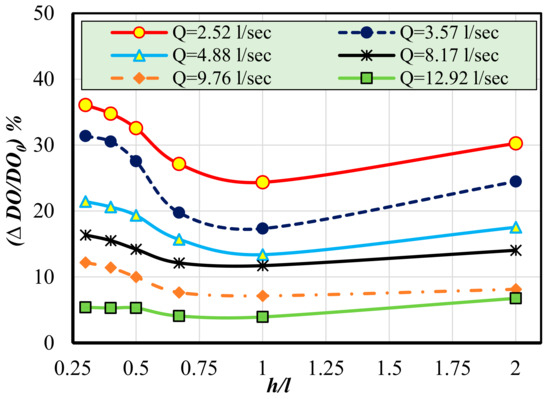
Figure 9.
Relationship between relative dissolved oxygen concentration (∆DO/Doo) and step height to step length ratio (h/l).
To determine the optimum ratio of step height to step length (h/l), taking into consideration the energy dissipation efficiency and the construction cost of the spillway as a function of the spillway mass volume, Figure 10 was created. This chart shows the relationship between the step height to step length ratio (h/l) and the relative residual energy (E1/E1(h/l = 2.0)) (the residual energy compared to the model with a ratio (h/l) equal to 2.00) in relation to the cost of the spillway, which can be considered a function of its volume (K). From Figure 10, it can be concluded that, at an average discharge (Q = 8.17 L/s), the optimum ratio of step height to step length (h/l) is 0.47 (practically h/l = 0.50) at the intersecting point of the two curves (cost and residual energy). The relative energy dissipation is 52.50% and 50.59% at h/l ratios of 0.3 and 0.50, respectively, while the cost of the spillway at h/l = 0.3 is about 1.3 times the cost at h/l = 0.50. This indicates that the ratio of step height to step length (h/l) = 0.50 is the optimum ratio for energy dissipation efficiency and the construction cost of the spillway.
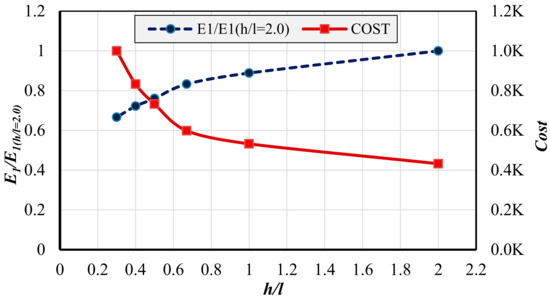
Figure 10.
Relationship between relative residual energy at the toe of the spillway (E1/E1(h/l = 2.0)) and the cost of the spillway at discharge Q = 8.17 L/s.
5.2. Second Stage: Estimating the Best Effective Ratio of Step Height to Spillway Height (h/H), and Number of Steps (Ns)
At this stage, six models were tested with different values of the relative ratio of (h/H), equal to 0.33, 0.25, 0.20, 0.17, 0.125, and 0.1, or with a number of steps (Ns) equal to 3, 4, 5, 6, 8, and 10. All the tested models were experimented with the available six experimental discharges equal to 2.52, 3.57, 4.88, 8.17, 12.92, and 19.12 L/s.
In the following Figure 11, the relationship between the relative energy dissipation (∆E/Eo) and the number of steps (Ns) was plotted for all values of the discharges. From Figure 10, it was noted that the relative energy loss (∆E/) increases with the increase in the number of steps (Ns) until the number of used steps (Ns) equals 5, at which point the relative energy loss decreases with all used discharge values. It is clear from the figure that five steps (Ns) (h/H = 0.20) can be considered the optimum ratio, which enhances the energy dissipation by 86.76% and 52.44% at a flow rate equal to 2.52 L/s and 19.12 L/s, respectively. Although increasing the number of steps (Ns) to six may be the best for small discharges, the percentage of enhancement in energy dissipation is very low and can be neglected, especially if it is compared with the cost of the additional step.
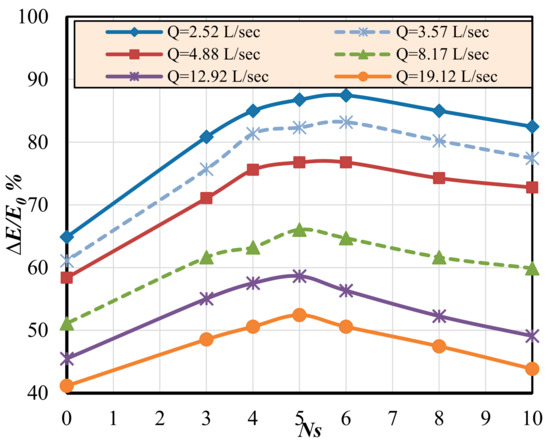
Figure 11.
Relationship between relative energy loss (∆E/Eo) and number of steps (Ns).
Figure 12 shows the relationship between relative dissolved oxygen concentration (∆DO/DOo) and the number of steps (Ns). From the figure, it can be observed that, with an increasing ratio of step height to total height (h/H) or an increasing number of steps (Ns), the relative dissolved oxygen concentration (∆DO/Doo) increases. However, once (Ns) equals five steps, the relative dissolved oxygen concentration (∆DO/Doo) decreases with a large flow rate and remains nearly constant with a small flow rate. Specifically, with Ns equal to 5, the dissolved oxygen content increases by 32.57% at the lowest flow rate and by 5.29% at the highest flow rate. Additionally, with increasing discharge, the relative dissolved oxygen concentration (∆DO/Doo) decreases.
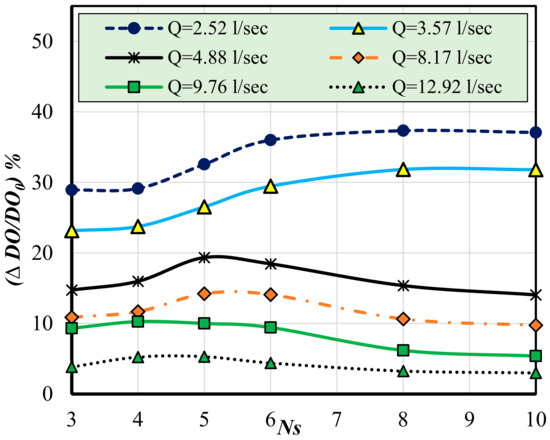
Figure 12.
Relationship between relative dissolved oxygen concentration (∆DO/DOo) and number of steps (Ns).
With a small flow rate, an increase in the number of steps enhances flow aeration compared to a smaller number of steps because the water passes over many rough surfaces, and the flow pattern remains a napped flow. Thus, with Ns equal to 10, the dissolved oxygen content increases by 37.07% at the lowest discharge. Conversely, at the highest discharge, the same model (Ns = 10) gives a minimum increase in dissolved oxygen content of 2.99%. This is because, as the number of steps increases, the flow pattern on the steps transitions from napped flow and transition flow to skimming flow more quickly with a large flow rate.
5.3. Third Stage: Estimating the Best Effective Ratio of Length of Reverse Inclined Step to Step Length (lr/l)
At this stage, five models were tested with different values of the ratio lr/l equal to 0.00, 0.25, 0.50, 0.75, and 1.0. Six available discharges were used (2.52, 3.57, 4.88, 8.17, 9.76, and 12.92 L/s) with each one of the five models of varied lr/l.
The following relationships were plotted and discussed to estimate the best ratio of the length of the reverse inclined step to the length of the step (lr/l). From Figure 13, it can be concluded that the maximum relative energy loss (∆E/Eo) occurs when the relative ratio of lr/l equals 0.25, which enhances the water energy dissipation efficiency by 3.88% to 5.52%, compared to the model without the inclined step, at flow rates of 2.52 and 12.92 L/s, respectively. Also, it can be concluded that the relative energy loss (∆E/Eo) decreases with the increase in flow rate (Q).
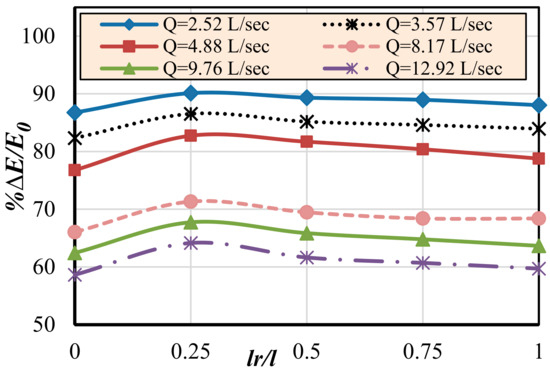
Figure 13.
Relationship between relative energy loss (∆E/Eo) and inclined step length to total step length ratio (lr/l).
Figure 14 shows the relationship between the relative dissolved oxygen content (∆DO/Doo) and the inclined step length to total step length ratio (lr/l). From Figure 10, it can be observed that the reverse inclined angle enhances flow aeration efficiency. The ratio (lr/l) = 0.25 increases the dissolved oxygen content by 13.11% and 34.63% compared to horizontal steps at flow rates of 2.52 L/s and 12.92 L/s, respectively. Additionally, with increasing discharge, the relative dissolved oxygen concentration decreases.
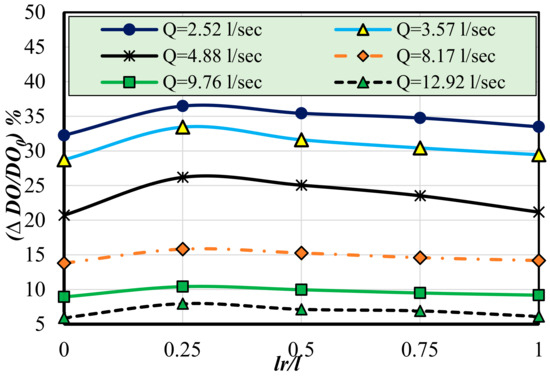
Figure 14.
Relationship between relative dissolved oxygen concentration (∆DO/DOo) and inclined step length to total step length ratio (lr/l).
5.4. Fourth Stage: Estimating the Best Effective Ratio of End Sill Radius to Step Height (r/h)
At this stage, five models were tested with different values of the relative ratio (r/h) equal to 0.0, 0.20, 0.40, 0.60, and 0.80. Eight available discharges were used (2.52, 3.57, 4.88, 8.17, 9.76, 12.92, 17.14, and 19.12 L/s) with each one of the five-quarter circular end sill models, in order to study the effect of the quarter circular end sill on the water energy dissipation.
Figure 15 shows the relationship between the relative energy dissipation (∆E/Eo) and the ratio of the radius of the end sill to the step height (r/h). From the figure, it can be noted that the quarter circular end sill enhances the water energy dissipation, and the maximum relative energy loss (∆E/Eo) occurs when the relative ratio of (r/h) equals 0.40, which improves the water energy dissipation efficiency by 3.62% and 6.20%, compared to the model without the end sill (r/h = 0.00), at flow rates of 2.52 and 19.12 L/s, respectively. Also, the relative energy loss (∆E/Eo) decreases with the increase in flow rate (Q).
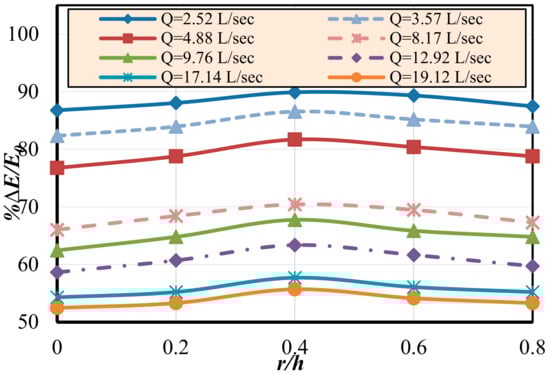
Figure 15.
Relationship between relative energy loss (∆E/) and end sill radius to step height ratio (r/h).
Figure 16 shows the relationship between the relative dissolved oxygen concentration (∆DO/Doo) and the end sill radius to step height ratio (r/h). From the figure, it can be concluded that as the ratio of end sill radius to step height (r/h) increases, the relative dissolved oxygen concentration (∆DO/Doo) also increases, until (r/h) reaches 0.40, after which the relative dissolved oxygen concentration decreases. Additionally, it can be concluded that with increasing discharge, the relative dissolved oxygen concentration (∆DO/Doo)
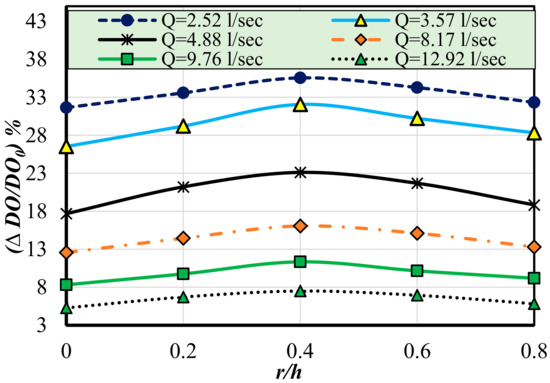
Figure 16.
Relationship between relative dissolved oxygen concentration (∆DO/) and end sill radius to step height ratio (r/h).
5.5. Fifth Stage: Comparison Between Different Spillway Geometrical Arrangements
This stage is a comparison stage between the optimum models from the previous stages. Five models were tested with different shapes of the back surface of the spillway (smooth spillway, stepped spillway, staggered steps spillway, steps with reverse slope, and steps with quarter circular end sill), as shown in Figure 7. Ten available discharges were used (2.52, 3.57, 4.88, 8.17, 9.76, 12.92, 14.65, 17.14, 18.48, and 19.12 L/s) with each model.
Figure 17a,b show the relationship between the relative energy dissipation (∆E/Eo) and the discharge (Q) with variable back surface arrangements. From the above figure, it can be concluded that the stepped spillway with a quarter-end sill or reverse slope enhances the water energy dissipation, compared to the smooth spillway or staggered step spillway, by about 69.39% on average. The staggered step spillway does not enhance the water energy dissipation compared with the stepped spillway, although it improves the energy dissipation by 24.58% and 22.88%, compared to the smooth spillway, at flow rates of 2.52 L/s and 19.12 L/s, respectively. The same conclusion can be observed clearly by plotting that relationship for the high, medium, and small available discharges.
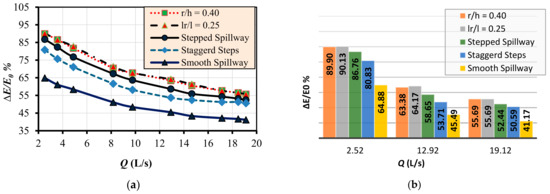
Figure 17.
(a,b). Relationship between the relative energy loss (∆E/Eo) and the flow rate (Q) (L/s) with variable back surface arrangements.
Figure 18a,b show the relationship between the relative dissolved oxygen content (∆DO/Doo) and the discharge (Q), from which it can be observed that the stepped spillway with a quarter-end sill or reverse slope improves water flow aeration compared to the smooth spillway or staggered step spillway by about 21.73% on average. The quarter circular end sill with an r/h ratio of 0.40 increases the dissolved oxygen content by 35.56% at a flow rate of 2.52 L/s and by 7.50% at a flow rate of 12.92 L/s. This result closely aligns with the findings of Jahad et al. (2022). Additionally, the reverse inclined step with (lr/l = 0.25) increases the dissolved oxygen content by 36.49% and 7.97% at flow rates of 2.52 L/s and 12.92 L/s, respectively. Although the staggered step spillway enhances the dissolved oxygen content at the lowest flow rate by 33.64% and by 8.35% at the highest flow rate. This is due to the high turbulence that occurs on the staggered steps spillway compared to the straight stepped spillway.
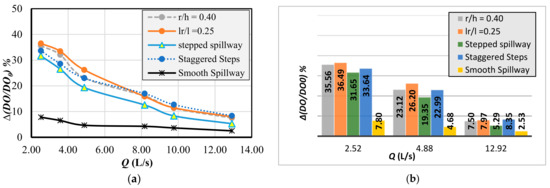
Figure 18.
(a,b). Relationship between dissolved oxygen content (∆DO/DOo) and the flow rate (Q)(L/s) with variable back surface arrangements.
All the previous experimental runs for all models were used to introduce accurate Equations (14)–(21) for calculating the effect of the geometrical treatments on the back surfaces of spillways on the water energy dissipation and flow aeration, using the MATLAB program (Version 2014-B). These equations may be used for the Froude number (Frus) ranging from 0.014 to 0.077 (discharge 2.52 L/s to 19.12 L/s), with R2 ranging between 0.94 and 0.99.
6. Conclusions
From the above presented experimental study, and the results obtained therein, the following main technical points can be extracted:
- The study successfully introduced a new geometrically modified spillway, achieving a significant increase in water energy dissipation efficiency, with an average value of about 69%, and increasing the dissolved oxygen content by an average of about 21.70% within the specified laboratory discharge limits, which is quite good.
- The optimal dimensions of the desired stepped spillway for achieving maximum performance efficiency in both water energy dissipation and enhancing the dissolved oxygen content were identified. The main goal of the study was achieved, with the following parameters identified: a step height to step length ratio (h/L) of 0.50, a step height to total spillway height ratio (h/H) of 0.20, and a reverse inclined step ratio (lr/L) of 0.25, or a radius of end sill to step height ratio (r/h) of 0.40.
- Among all the tested angles of inclination for the back surface of the spillway body, an angle of 26.57 degrees yielded the best measured results and is recommended for achieving maximum efficiency in both water energy dissipation and flow aeration.
- The best results for flow energy dissipation (ranging between 90.13% at the lowest flow rate and 55.69% at the highest flow rate) were achieved by using a reverse inclination for the stepped back of the spillway with a relative step length (lr/L) of 0.25. This set-up also provided the best results for flow aeration, with flow rates ranging between 2.52 L/s and 12.92 L/s. The recorded increase in dissolved oxygen content was between 36.49% and 7.97%, which is significant.
- The study demonstrated that using a quarter-end sill with a modified stepped back for the spillway generally increased the energy dissipation efficiency. Specifically, using a quarter-end sill with a relative radius (r/h) of 0.4 increased the energy dissipation by approximately 89.90% at the lowest flow rate and by 55.59% at the highest flow rate. At the same time, using a quarter-end sill increased the dissolved oxygen content by about 35.56% and 7.50% for the lowest and highest discharges, respectively.
- The comparison of the obtained results from different spillway geometrical arrangements (smooth spillway, stepped spillway, staggered steps spillway, steps with reverse slope, and steps with a quarter circular end sill) proved that using the reverse inclination for the stepped back of the spillway with a relative step length (lr/L) of 0.25 was the most efficient for both water energy dissipation and flow aeration.
- The results obtained from all the experimental runs carried out for all tested models were used to develop accurate equations for calculating the effect of the geometrical treatments of spillway backs on water energy dissipation and flow aeration, using the MATLAB program (Version 2014-B). Mohamed A. Ashour, M. Khairy Ali and Tawab E. Aly
Author Contributions
Conceptualization, M.A.A., M.K.A. and T.E.A.; methodology, M.A.A.; software, M.K.A.; validation, M.A.A., M.K.A. and T.E.A.; formal analysis, M.A.A., M.K.A. and T.E.A.; investigation M.K.A. and T.E.A.; resources, M.A.A.; M.K.A. and T.E.A.; data curation M.A.A., M.K.A. and T.E.A.; writing—original draft preparation, M.A.A., M.K.A. and T.E.A.; writing—review and editing M.A.A., M.K.A. and T.E.A.; visualization, M.A.A., M.K.A. and T.E.A.; supervision, M.A.A. and T.E.A.; project administration, M.A.A., M.K.A. and T.E.A.; funding acquisition, M.A.A., M.K.A. and T.E.A. All authors have read and agreed to the published version of the manuscript.
Funding
This research received no external funding.
Data Availability Statement
The data used were extracted from laboratory experiments at the Irrigation and Hydraulics Laboratory, Department of Civil Engineering, Faculty of Engineering, Assiut University.
Conflicts of Interest
The authors declare no conflict of interest.
References
- Pandey, B.R.; K C, M.R.; Crookston, B.; Zenz, G. Numerical Investigation of Different Stepped Spillway Geometries over a Mild Slope for Safe Operation Using Multi-Phase Model. Water 2024, 16, 1635. [Google Scholar] [CrossRef]
- Jahad, U.A.; Chabuk, A.; Alabas, M.A.; Mahmoud, A.S.; Al-Ansari, N.; Laue, J. CFD Analysis of the Effects of Compound Downstream Slope on Flow Over the Spillway. J. Ecol. Eng. 2023, 24, 274–286. [Google Scholar] [CrossRef]
- Ghaderi, A.; Abbasi, S. Experimental and numerical study of the effects of geometric appendance elements on energy dissipation over stepped spillway. Water 2021, 13, 957. [Google Scholar] [CrossRef]
- Arjenaki, M.O.; Sanayei, H.R.Z. Numerical investigation of energy dissipation rate in stepped spillways with lateral slopes using experimental model development approach. Model. Earth Syst. Environ. 2020, 6, 605–616. [Google Scholar] [CrossRef]
- Ashoor, A.; Riazi, A. Stepped spillways and energy dissipation: A non-uniform step length approach. Appl. Sci. 2019, 9, 5071. [Google Scholar] [CrossRef]
- Abdel-Aal, G.M.A.; Sobeah, M.; Helal, E.; El-Fooly, M. Improving energy dissipation on stepped spillways using breakers. Ain Shams Eng. J. 2018, 9, 1887–1896. [Google Scholar] [CrossRef]
- Jahad, U.A.; Al-Ameri, R.; Chua, L.; Das, S. Geometry effects on energy dissipation over stepped spillway. In Proceedings of the First MoHESR and HCED Iraqi Scholars Conference, Melbourne, Australia, 5 December 2017; p. 96. [Google Scholar]
- Hussein, B.S.; Jalil, S.A. Hydraulic Comparison between Labyrinth and Plain Stepped Falls. J. Univ. Duhok 2016, 19, 226–237. [Google Scholar]
- Hamedi, A.; Ketabdar, M.; Fesharaki, M.; Mansoori, A. Nappe flow regime energy loss in stepped chutes equipped with reverse inclined steps: Experimental development. Fla. Civ. Eng. J. 2016, 28–37. [Google Scholar]
- Al-Husseini, T.R. A Novel experimental work and study on flow and energy dissipation over stepped spillways. J. Babylon Univ.-Eng. Sci. 2016, 24, 1050–1063. [Google Scholar]
- Asadi, E.; Dalir, A.H.; Farsadizadeh, D.; Hassanzaheh, Y.; Salmasi, F. Energy dissipation of skimming flow with different sill dimensions in stepped spillway model. Inter. J. Agric. Biosci. 2015, 4, 118–121. [Google Scholar]
- Hamedi, A.; Malekmohammadi, I.; Mansoori, A.; Roshanaei, H. Energy dissipation in stepped spillway equipped with inclined steps together with end sill. In Proceedings of the 2012 Fourth International Conference on Computational Intelligence and Communication Networks, Uttar Pradesh, India, 3–5 November 2012; pp. 638–642. [Google Scholar] [CrossRef]
- Zare, H.K.; Doering, J.C. Energy dissipation and flow characteristics of baffles and sills on stepped spillways. J. Hydraul. Res. 2012, 50, 192–199. [Google Scholar] [CrossRef]
- Chinnarasri, C.; Wongwises, S. Flow patterns and energy dissipation over various stepped chutes. J. Irrig. Drain. Eng. 2006, 132, 70–76. [Google Scholar] [CrossRef]
- Barani, G.A.; Rahnama, M.B.; Sohrabipoor, N. Investigation of flow energy dissipation over different stepped spillways. Am. J. Appl. Sci. 2005, 2, 1101–1105. [Google Scholar]
- James, C.S.; Main, A.G.; Moon, J. Enhanced energy dissipation in stepped chutes. Proc. Inst. Civ. Eng.-Water Marit. Eng. 2001, 148, 277–280. [Google Scholar] [CrossRef]
- Kökpinar, M.A. Flow over a stepped chute with and without macro-roughness elements. Can. J. Civ. Eng. 2004, 31, 880–891. [Google Scholar] [CrossRef]
- Baylar, A.; Emiroglu, M.E.; Bagatur, T. An experimental investigation of aeration performance in stepped spillways. Water Environ. J. 2006, 20, 35–42. [Google Scholar] [CrossRef]
- Aras, E.; Berkun, M. Comparison of stepped and smooth spillway effects on stream reaeration. Water SA 2010, 36, 309–314. [Google Scholar]
- Zare, H.K.; Doering, J.C. Inception point of air entrainment and training wall characteristics of baffles and sills on stepped spillways. J. Hydraul. Eng. 2012, 138, 1119–1124. [Google Scholar] [CrossRef]
- Wuthrich, D.; Chanson, H. Aeration performances of a gabion stepped weir with and without capping. Environ. Fluid Mech. 2015, 15, 711–730. [Google Scholar] [CrossRef]
- Zhang, G.; Chanson, H. Air-water flow properties in stepped chutes with modified step and cavity geometries. Int. J. Multiph. Flow 2018, 99, 423–436. [Google Scholar] [CrossRef]
- Wan, W.; Raza, A.; Chen, X. Effect of height and geometry of stepped spillway on inception point location. Appl. Sci. 2019, 9, 2091. [Google Scholar] [CrossRef]
- Novakoski, C.K.; Ferla, R.; Priebe, P.D.; Abreu, A.S.; Marques, M.G.; Prá, M.D.; Canellas, A.V.; Teixeira, E.D. Induced aeration flow over stepped spillways: Mean pressures, air entrainment and flow behavior. RBRH 2021, 26, e34. [Google Scholar] [CrossRef]
- Raza, A.; Wan, W.; Mehmood, K. Stepped spillway slope effect on air entrainment and inception point location. Water 2021, 13, 1428. [Google Scholar] [CrossRef]
- Arosquipa Nina, Y.; Shi, R.; Wüthrich, D.; Chanson, H. Air–Water flows and head losses on stepped spillways with inclined steps. J. Irrig. Drain. Eng. 2022, 148, 04022037. [Google Scholar] [CrossRef]
- Jahad, U.A.; Al-Ameri, R.; Chabuk, A.; Majdi, A.; Majdi, H.S.; Al-Ansari, N.; Laue, J. Dissolved oxygen variation on the steps with a quarter circle end sill for flows over the stepped spillways. Int. J. Des. Nat. Ecodynamics 2022, 17, 639–648. [Google Scholar] [CrossRef]
- Jahad, U.A.; Alabas, M.A.; Mahmoud, A.S.; Al-Ameri, R.; Das, S. The effect of the compound slope spillway on air entrainment and total kinetic energy using computational fluid dynamics. Water Pract. Technol. 2024, 19, 1032–1046. [Google Scholar] [CrossRef]
- Baylar, A.; Bagatur, T.; Emiroglu, M.E. Prediction of the oxygen content of nappe, transition, and skimming flow regimes in stepped-channel chutes. J. Environ. Eng. Sci. 2007, 6, 201–208. [Google Scholar] [CrossRef]
- André, S. High-Velocity Aerated Flows over Stepped Chutes with Macro-Roughness Elements. Ph.D. Thesis, EPFL, Lausanne, Switzerland, 2004. [Google Scholar]
- Baylar, A.; Emiroglu, M.E. Study of aeration efficiency at stepped channels. Proc. Inst. Civ. Eng.-Water Marit. Eng. 2003, 156, 257–263. [Google Scholar] [CrossRef]
- Bung, D.B.; Schlenkhoff, A. Self-aerated skimming flow on embankment stepped spillways: The effect of additional micro-roughness on energy dissipation and oxygen transfer. In Proceedings of the IAHR European Congress (CD-ROM), Edinburgh, UK, 4–6 May 2010; International Association for Hydro-Environment Engineering and Research: Munich, Germany, 2010. [Google Scholar]
- Chanson, H. Predicting oxygen content downstream of weirs, spillways and waterways. Proc. Inst. Civ. Eng.-Water Marit. Energy 1995, 112, 20–30. [Google Scholar] [CrossRef]
- Toombes, L.; Chanson, H. Air–water mass transfer on a stepped waterway. J. Environ. Eng. 2005, 131, 1377–1386. [Google Scholar] [CrossRef]
- Henderson, F.M. Open Channel Flow; Rouse, H., Ed.; Macmillan: New York, NY, USA, 1966; Volume 29. [Google Scholar]
- Chow, V.T. Open Channel Hydraulics; McGraw-Hill Book Company, Inc.: New York, NY, USA, 1959. [Google Scholar]

Disclaimer/Publisher’s Note: The statements, opinions and data contained in all publications are solely those of the individual author(s) and contributor(s) and not of MDPI and/or the editor(s). MDPI and/or the editor(s) disclaim responsibility for any injury to people or property resulting from any ideas, methods, instructions or products referred to in the content. |
© 2024 by the authors. Licensee MDPI, Basel, Switzerland. This article is an open access article distributed under the terms and conditions of the Creative Commons Attribution (CC BY) license (https://creativecommons.org/licenses/by/4.0/).