Abstract
This study aims to analyze the relationships between various health indicators, using an exploratory graph analysis, repeated measures correlation, and cluster construction. Primary healthcare is essential for providing continuous and comprehensive care, with indicators as crucial tools to identify and improve weaknesses in health units. Data from 41 health units in Baixo Vouga, Portugal, from January 2017 to March 2024, were analyzed. Through the database, the behavior of the indicators and health units over time was identified, along with the strongest positive and negative correlations between the indicators and their graphical illustration. Finally, through clusters, the grouping of indicators and health units was achieved. Thus, this study provides healthcare professionals with important insights for the management and continuous improvement of health units.
1. Introduction
Primary healthcare (PHC) constitutes the first level of personal health services in the community, ensuring accessible, continuous, and comprehensive care to meet the health needs throughout the life of everyone [1]. The importance of primary healthcare has been increasingly discussed, and it is understood that when well supported and functioning effectively, it forms the cornerstone of all healthcare, bridging gaps that may exist in more advanced care.
In Portugal, healthcare is organized into categories: at the top is the Ministry of Health, followed by the Regional Health Administrations (ARSs), which include Hospitals and Health Center Groupings (ACeS). The ACeS comprise Family Health Units of type A and type B (USF-A and USF-B), Personalized Healthcare Units (UCSP), Shared Assistance Resources Units (URAP), Public Health Units (USP), and Community Care Units (UCC) [2]. Family Health Units (USF) are organized into two distinct models: USF A and USF B [3,4]. Both provide primary healthcare services but differ in the remuneration system for professionals [3,4]. In the USF-B model, there is a pay-for-performance component, meaning that part of the remuneration depends on achieving predefined goals [3,4]. In contrast, USF-A operates with a basic remuneration model without this type of incentive [4]. Personalized Healthcare Units (UCSP), on the other hand, are primary care units where doctors provide healthcare services to the population without the need for prior registration on specific patient lists. In these units, patients are treated by the family doctor available at the time [3,4].
In this context, health indicators were implemented to enable each team within a healthcare unit to manage and improve their weaknesses, based on the results of these indicators [5]. These indicators are organized into five areas, subdivided into thirteen dimensions, and finally, forty-three indicators, which are specified in Appendix A [6].
2. Materials and Methods
The database was created using data from a Portuguese National Health System webpage that contains indicator results for health units [7]. In this case, data were extracted from 41 health units in Baixo Vouga, covering the period from January 2017 to March 2024. Thus, the database includes months, different health units, and the corresponding indicator results. For the analysis, the software RStudio was used.
To assess the behavior of indicators and health units over time, the ggplot2 package was utilized. In addition to generating visually appealing figures, it improves data interpretation and has become a crucial tool for data visualization due to its ability to produce detailed and comprehensive graphs [8]. To enhance this analysis, plotly was employed, enabling the creation of interactive graphs that facilitate dynamic data exploration, making the analysis more intuitive. By converting graphs created with ggplot2 into interactive plotly visualizations, it improves the process of an exploratory data analysis [9]. Due to the interactivity of plotly charts, it is possible to represent a trend line, which can be smoothed or not. Additionally, it is also possible to represent the error of this trend line. Furthermore, you can remove the points and the line, leaving only the trend line, all without altering the source code.
To identify potential correlations between different indicators, a statistical technique called repeated measures correlation (rmcorr) was used [10]. This technique helps to analyze how two or more variables are related over time for the same indicators. It is especially useful when there are multiple measurements for each indicator, which simple correlation methods like Pearson’s correlation cannot handle properly because they assume that all observations are independent of each other [10]. The rmcorr technique considers that the measurements are not independent, allowing for a more accurate analysis of the data [10].
The repeated measures correlation addresses the lack of independence between observations by using an analysis of covariance (ANCOVA) [11]. Therefore, it shares the same statistical assumptions as ANOVA, except for the assumption of error independence [11].
Moreover, recent research highlights the effectiveness of rmcorr in primary healthcare settings, offering valuable insights for enhancing quality management and continuously improving healthcare services [11].
After reorganizing the data, correlations were calculated using the rmcorr function, which evaluates the linear relationship between pairs of indicators while accounting for the structure of the repeated measures across months for different health units. Pairs of indicators with months that had fewer than three observations, with fewer than two health units, or with fewer than two distinct months were excluded from the analysis.
The calculation of correlations derives directly from the rrm coefficient, using a specific formula that accounts for the dependency structure of the means over time. The formula is described as
where is the Sum of Squares for the measure representing the variability between measures attributed to the variables under study. is the Sum of Squares for the error representing the residual variability in the measures that are not explained by the variables under study.
This formula allows for the calculation of the r coefficient, which is a measure of correlation adjusted to handle the dependency among repeated measures of indicators over time. In other words, r quantifies the relationship between the indicators over time, considering how the measures are interdependent.
In addition to the correlation value, a p-value is also obtained. This p-value is based on the F-ratio test statistic, where the formula for its calculation is shown in Formula (2) [10].
Regarding the degrees of freedom, the exact degrees for rmcorr can be calculated using Formula (3), where k is the (average) number of repeated measures per participant and N is the total number of participants [10].
Subsequently, to visualize the correlations, graphs were created to illustrate the relationship between the indicators. In addition to visualizations, a correlation table was generated, filtering to highlight the most significant relationships.
For a more in-depth analysis of the relationships between the indicators as well as between health units, different types of clusters were achieved. The function TSclust was used to create the clusters, and the dissimilarity measure considered was the Shape-based distance, which is based on the cross-correlation normalized by the coefficient, measuring how well two-time series align with each other. The adopted clustering method was hierarchical, a classic approach where observations are grouped hierarchically based on proximity or similarity [12]. Within hierarchical clustering, there are different algorithms to perform the clustering, which can be characterized by how they define the distance between clusters [12]. In this case, we focus on the complete linkage method, which considers the greatest distance between two points from different clusters [12]. To determine the optimal number of clusters, a silhouette plot was used.
All the results obtained through the methods mentioned earlier were presented in the form of a Shiny application (https://jvazc.shinyapps.io/expl_bi_csp/, accessed on 25 January 2025).
3. Results
3.1. Exploratory Analysis
To verify the behavior of the indicators over the months, three types of graphs were created, each including a trend line. This facilitates the analysis of trends and patterns.
The first allowed the selection of only one of the health units present in the database, along with all the indicators we wanted to analyze and include in the graph. In Figure 1, the behavior of the indicators 2013.008.01 FL, 2013.011.01 FL, 2013.020.01 FL, 2013.023.01 FL, and finally 2013.037.01 FL, between February 2017 and February 2024, for the Family Health Unit (USF) Arte Nova is represented.
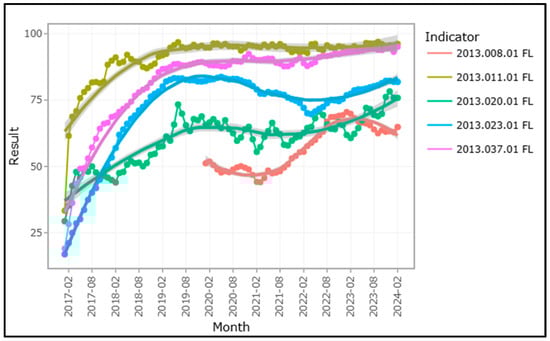
Figure 1.
Trend graph of indicators over time for USF Arte Nova.
By observing the graph, we can see that the results of the indicators for USF Arte Nova showed a significant increase until the year 2020. Except for indicator 2013.037.01 FL and indicator 2013.011.01 FL, the remaining indicators show a decrease after the year 2020, followed by an increase in the subsequent period.
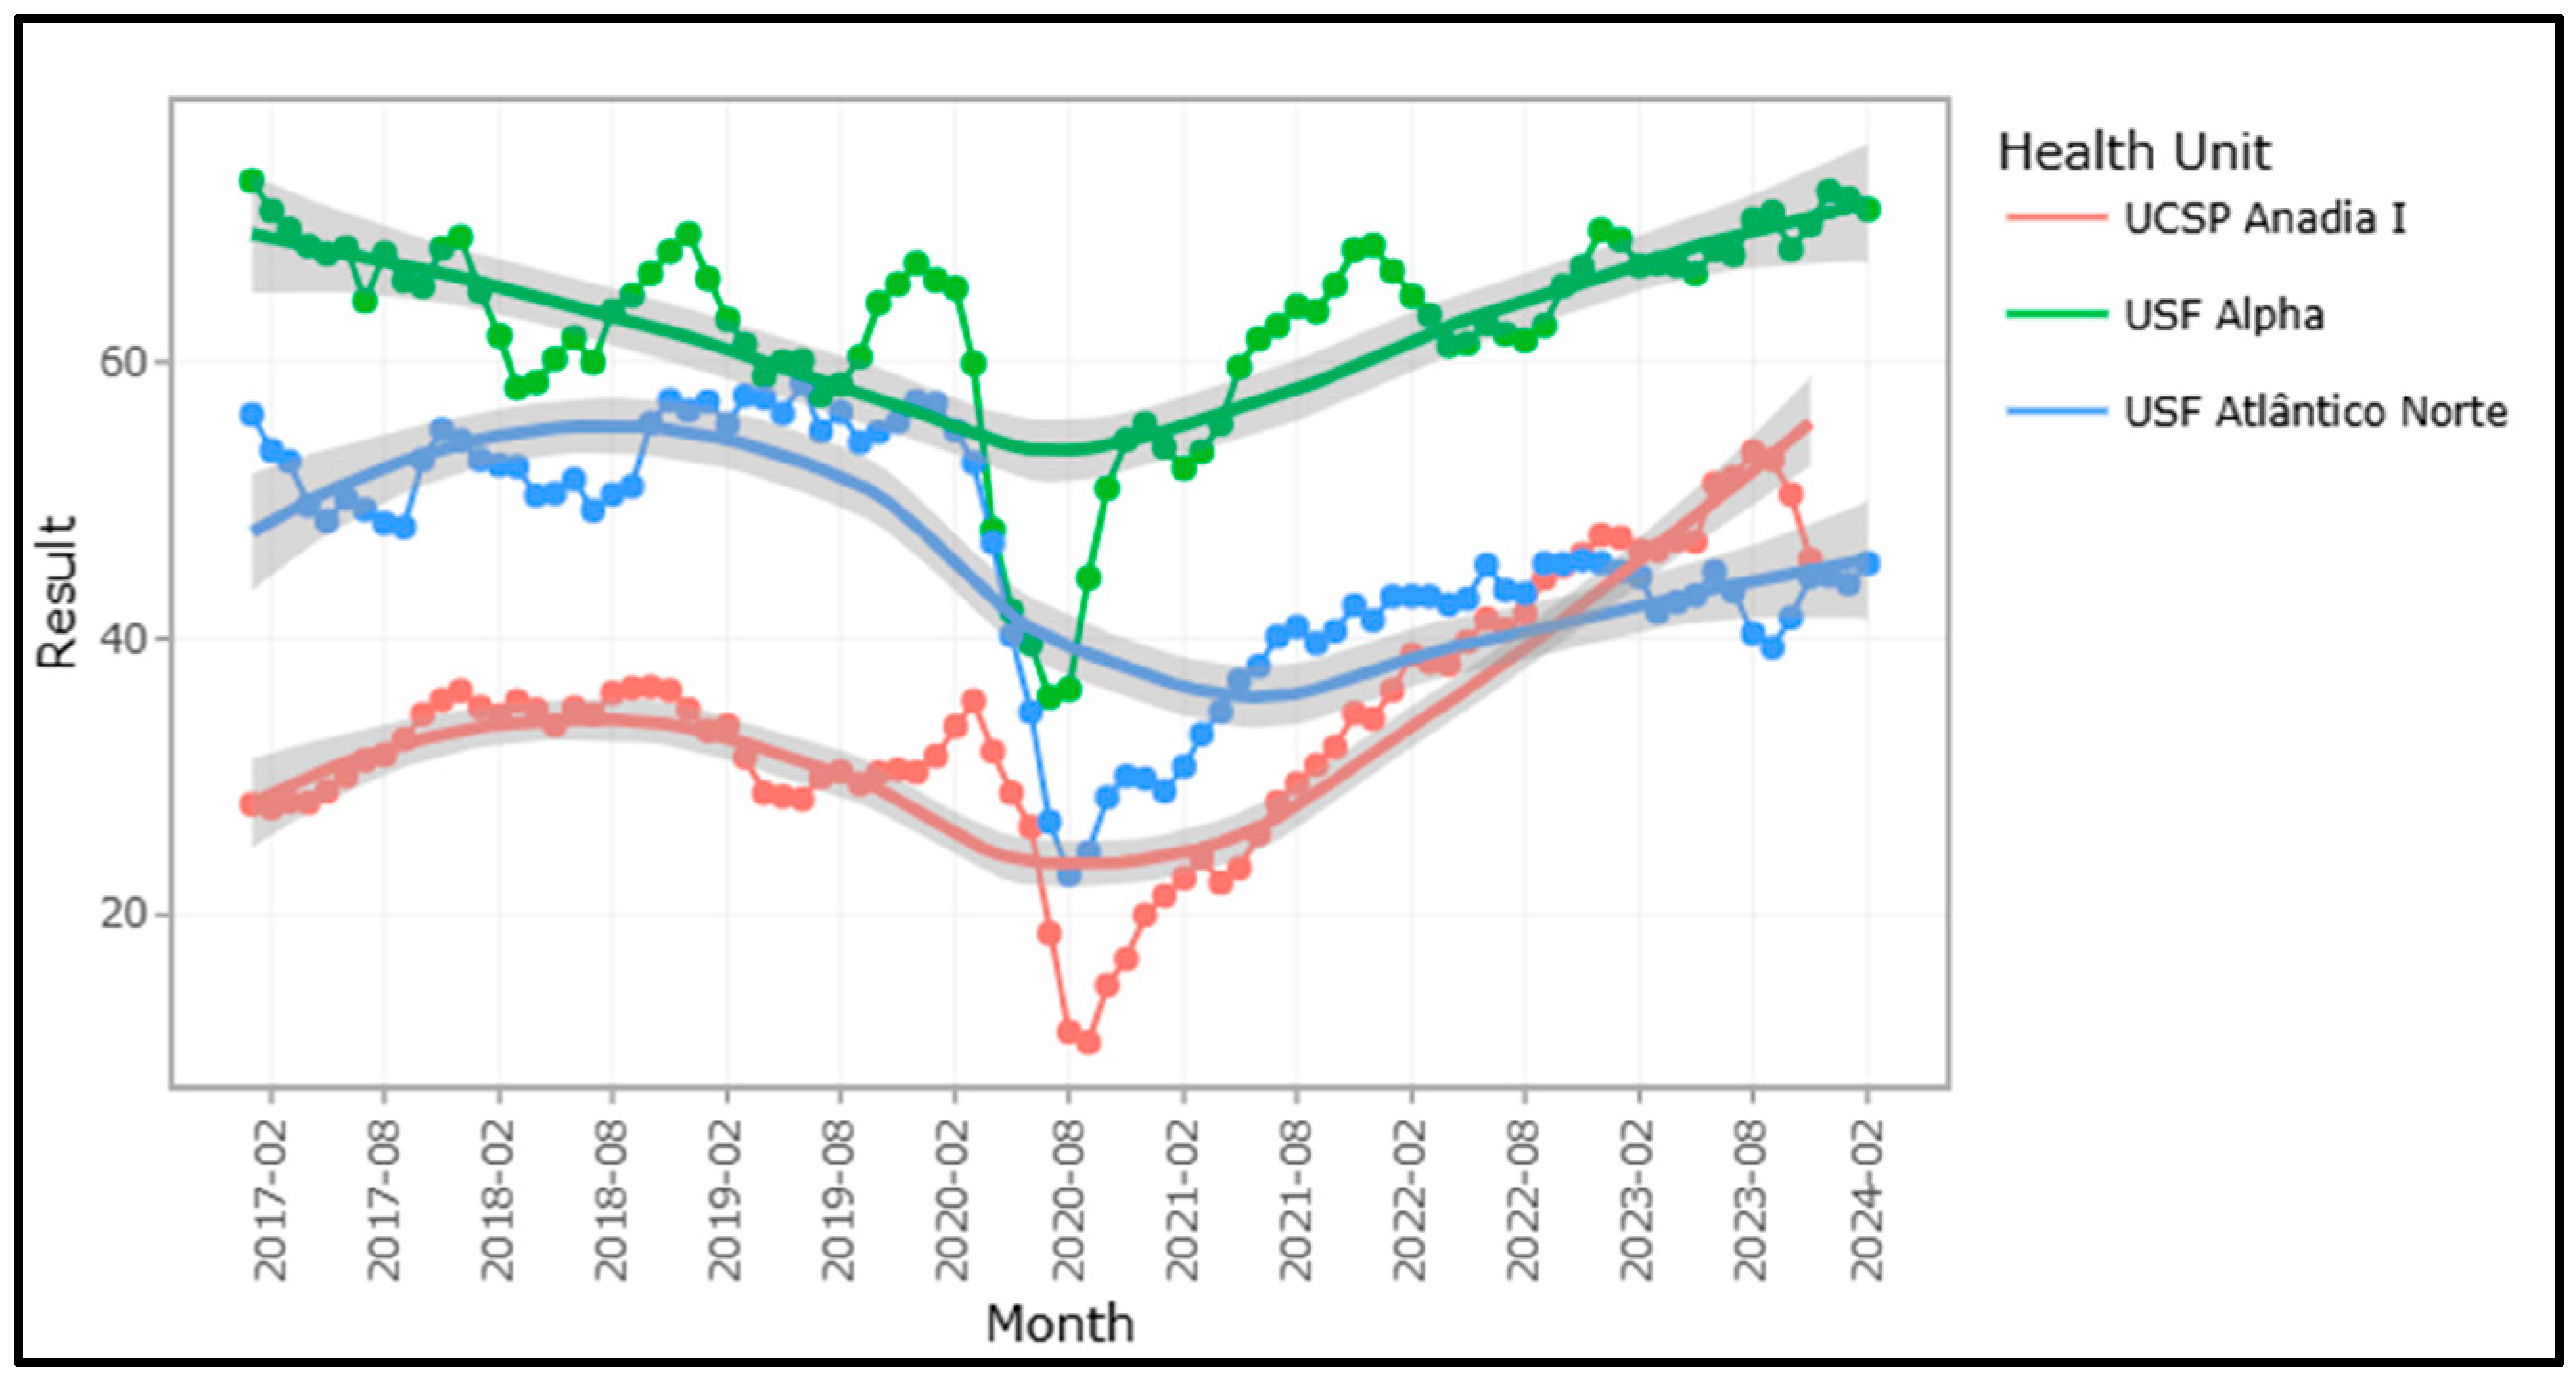
The second graph developed offers the reverse option, allowing the selection of a single indicator from the database and displaying the desired number of health units, enabling a visual comparison of the units’ behavior for that specific indicator. In the specific case of Figure 2, the behavior of the indicator 2013.020.01 FL over time is represented for the following health units: Anadia I, Alpha, and Atlântico Norte.
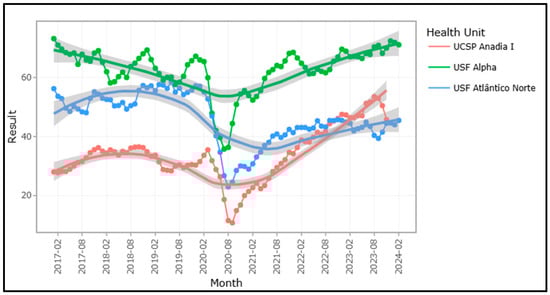
Figure 2.
The trend graph over time of the health units for the indicator 2013.020.01 FL.
By analyzing the behavior of the healthcare units over time, we observed a sharp decrease in 2020, followed by an increase in the indicator results for the three units afterward.
The application also allowed the selection of a single indicator for different types of health units over time, enabling the observation of trends in the indicator responses according to the selected type of unit. The types of health units mentioned include USF-A, USF-B, and UCSP. In Figure 3, the behavior of the indicator 2013.046.01 FL is represented for the USF-B-type health units.
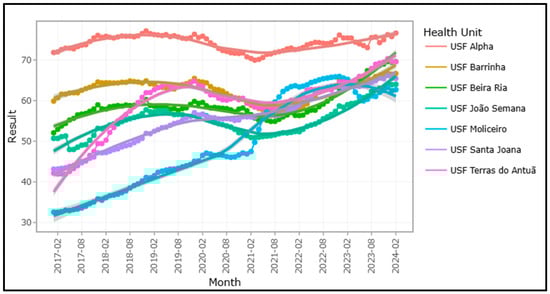
Figure 3.
Trend graph over time of USF-B for indicator 2013.046.01 FL.
We can observe in Figure 3 the improvement over time; in this specific case, the result for the indicator 2013.046.01 FL in the different USFs improves over the period.
The results shown above provide just one example; different indicators, as well as the health units present in the database, can be selected and subsequently represented in the different graphs.
3.2. Repeated Measures Correlations
The application of repeated measures correlation revealed significant patterns of correlation among the studied indicators. We identified positive and negative strong correlations; the negative ones suggest inverse relationships between the indicators.
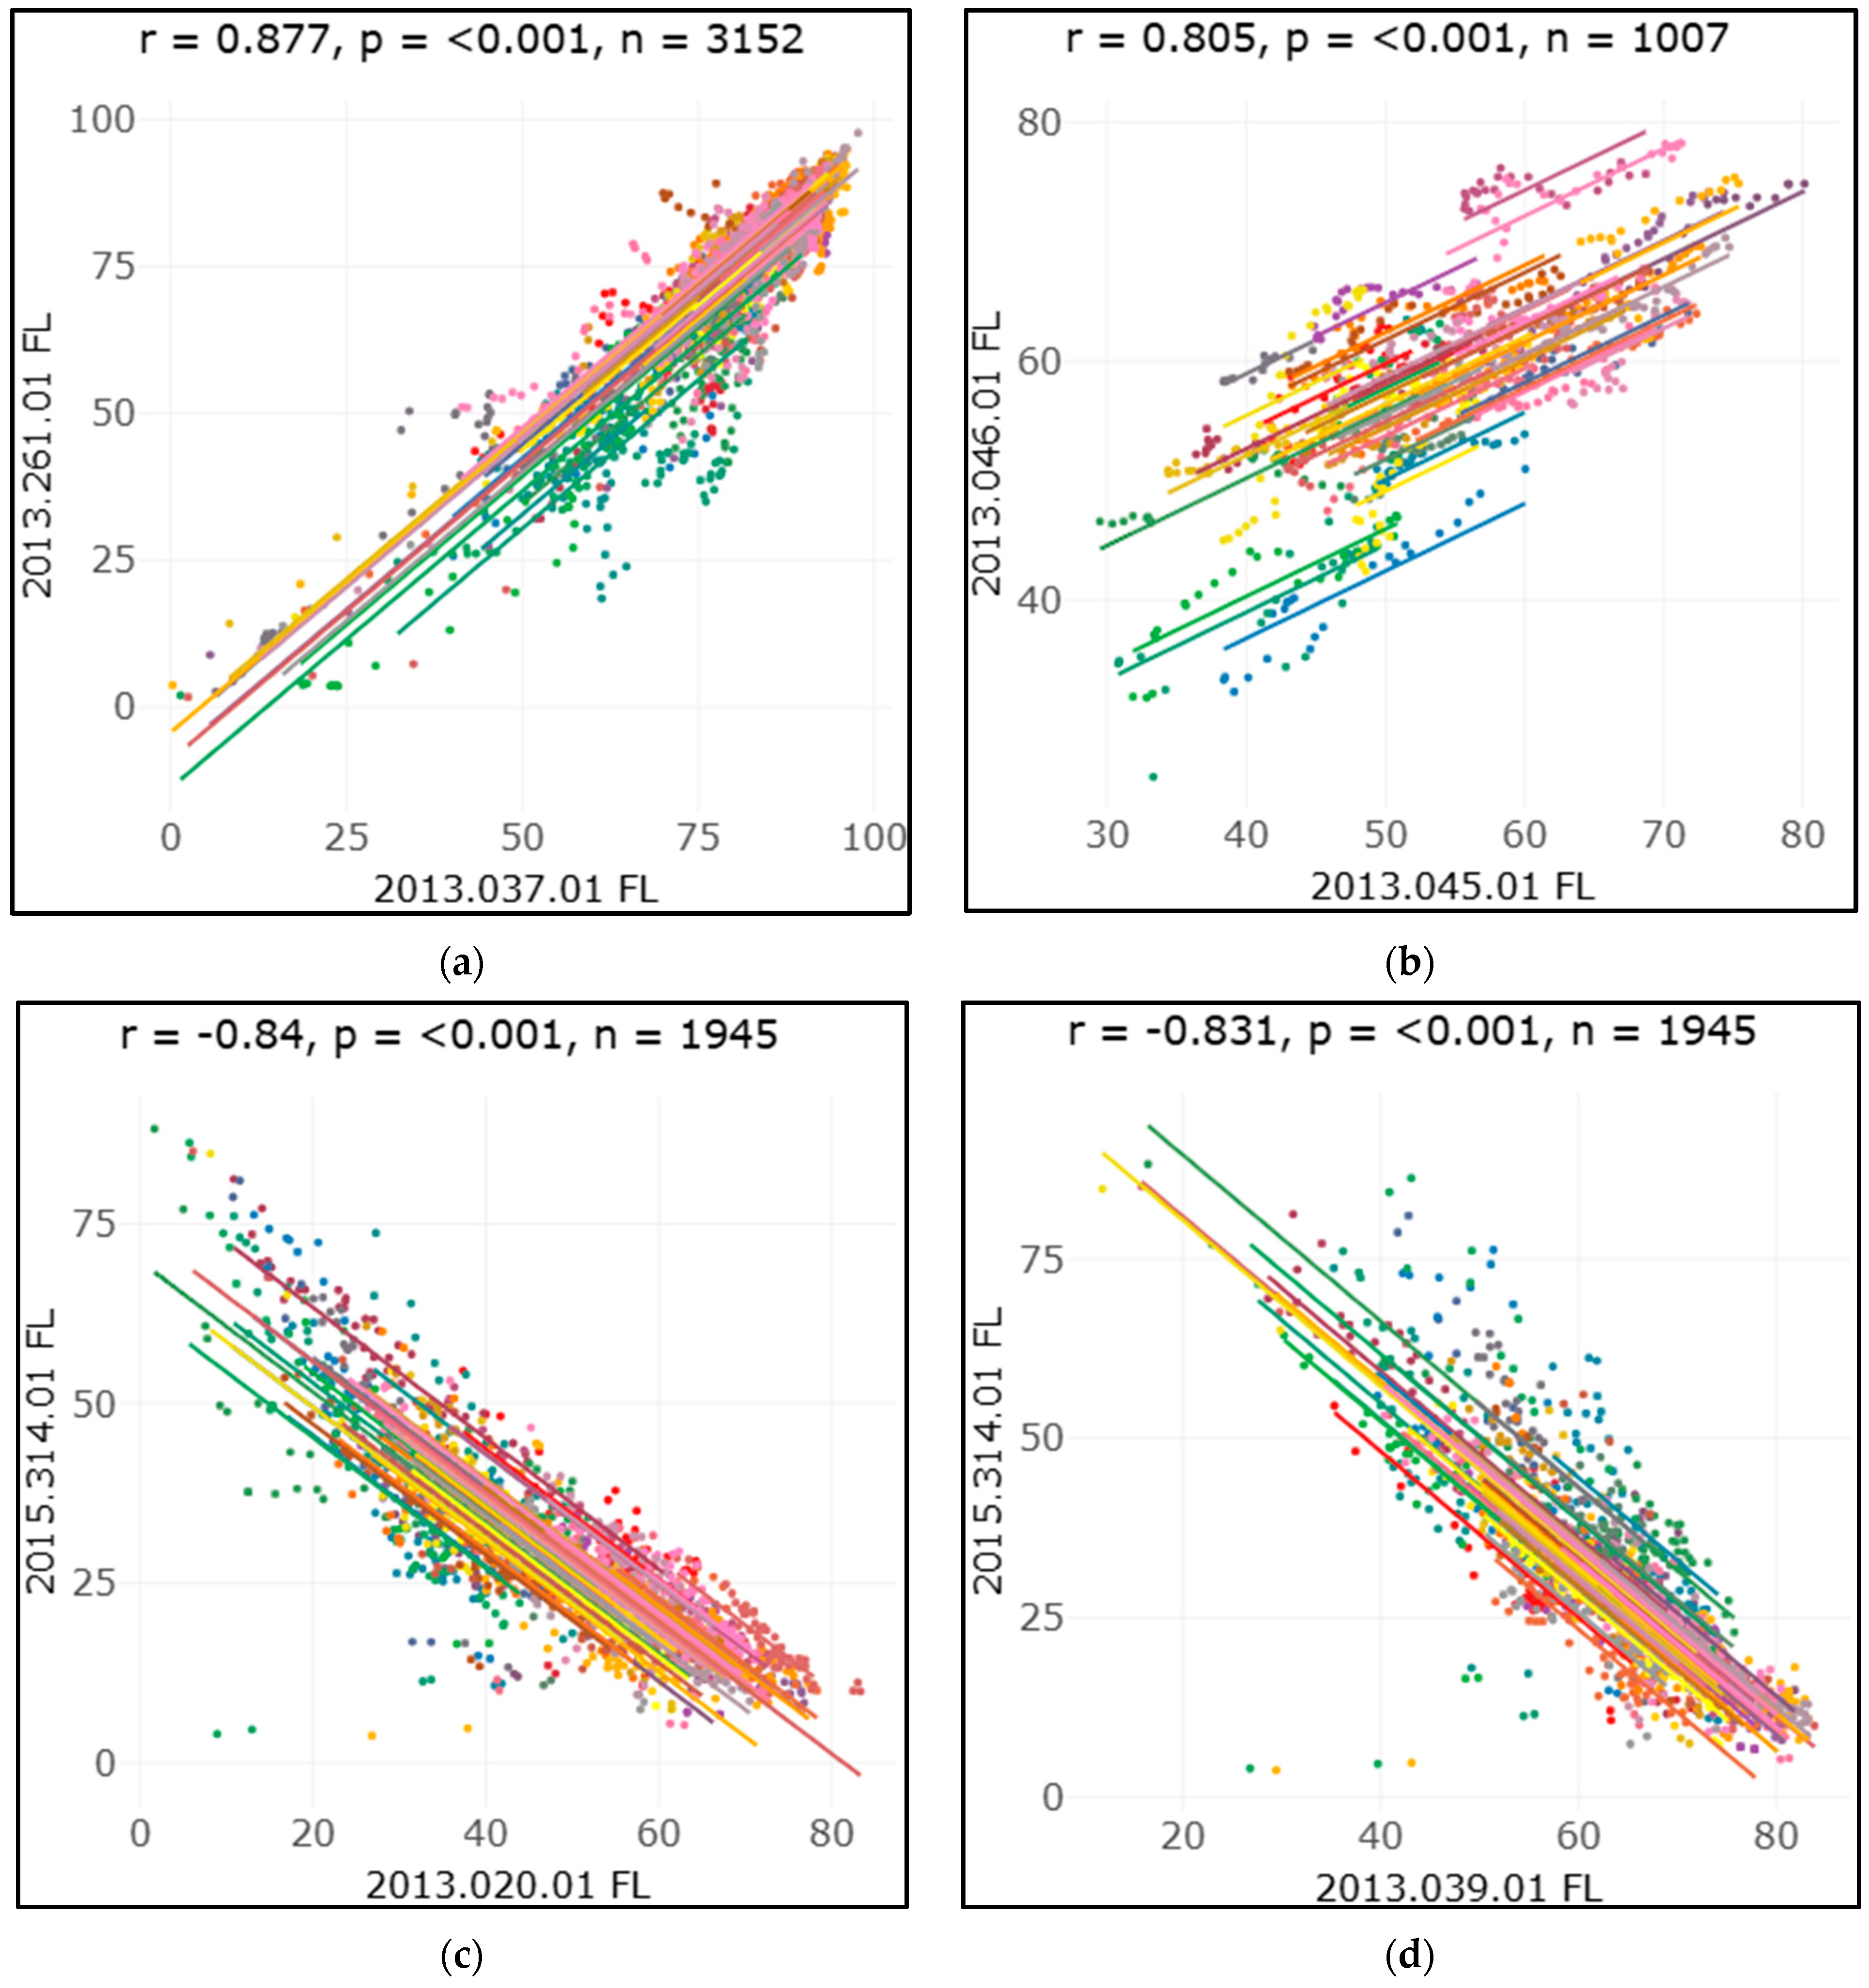
Upon examining the results in Table 1, we find that the indicators with the strongest positive correlation are 2013.037.01 FL (proportion of diabetes mellitus patients with a nursing consultation for diabetes monitoring in the past year) and 2013.261.01 FL (proportion of diabetes mellitus patients with an assessment of foot ulcer risk), with a correlation of 0.877. Additionally, we observed that in seven out of the ten indicator pairs, both indicators belong to the same area.

Table 1.
Correlations of Repeated Measures: Positive and Negative Among Indicators.
In contrast, the indicators with the strongest negative correlation are 2013.020.01 FL (proportion of hypertensive patients under 65 years old with blood pressure < 150/90) and 2015.314.01 FL (proportion of diabetes mellitus patients with blood pressure ≥ 140/90 mmHg), with a correlation of −0.840.
The complete description for all the indicator codes used in this study can be found in Table A1 of Appendix A.
To visualize the correlations specified in Table 1, graphs were created to show the relationship between the indicators over time. Each graph illustrates how the correlation between different pairs of indicators varies across months, with the points and lines colored by healthcare unit. Each point corresponds to a pair of indicator results for a given month. Below, in Figure 4, four specific graphs are presented: two showing the highest positive correlations, (a) and (b), and two illustrating the most negative correlation, (c) and (d). In the four graphs, each line represents a month, and the dots represent healthcare units.
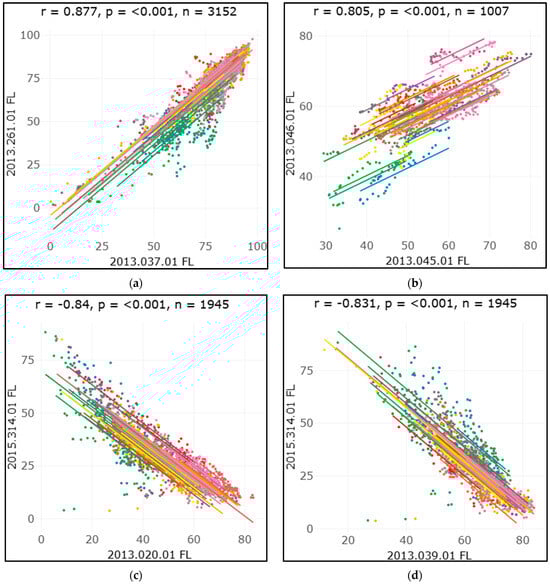
Figure 4.
Rmcorr plot: The rmcorr plot for the correlation between the indicators and corresponding rmcorr values and p-values. (a) Correlation between the indicators 2013.037.01 FL and 2013.261.01 FL; (b) correlation between the indicators 2013.046.01 FL and 2013.045.01 FL; (c) correlation between the indicators 2013.020.01 FL and 2015.314.01 FL; (d) correlation between the indicators 2013.039.01 FL and 2015.314.01 FL.
3.3. Clusters
Subsequently, a cluster analysis was conducted, in which three distinct types of clusters were created. Initially, clusters of indicators were formed, considering the various dimensions of each health unit. In the dendrogram presented in Figure 5, we see the two clusters formed for the indicators of the “Women’s Health” dimension, along with their results for the Arte Nova health unit, as well as the indicators that make up each group.
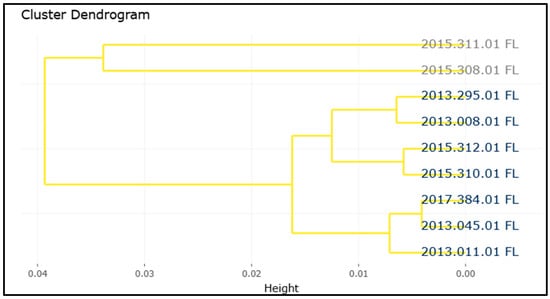
Figure 5.
Dendrogram for “Women’s Health” dimension and Arte Nova health unit.
By analyzing the created clusters, we observe the grouping of two indicators, indicating that the temporal pattern of these indicators is similar.
The second type of cluster was created for each type of health unit, considering the various indicators. As an example, in Figure 6, we have the dendrogram regarding the clusters created for the health units that are part of the USF-B type, included in the database, for the indicator 2013.020.01 FL.

Figure 6.
Dendrogram of USF-B for indicator 2013.020.01 FL.
In this case, we see the clustering of two healthcare units, which indicates that over time, the indicator’s result for these units is similar.
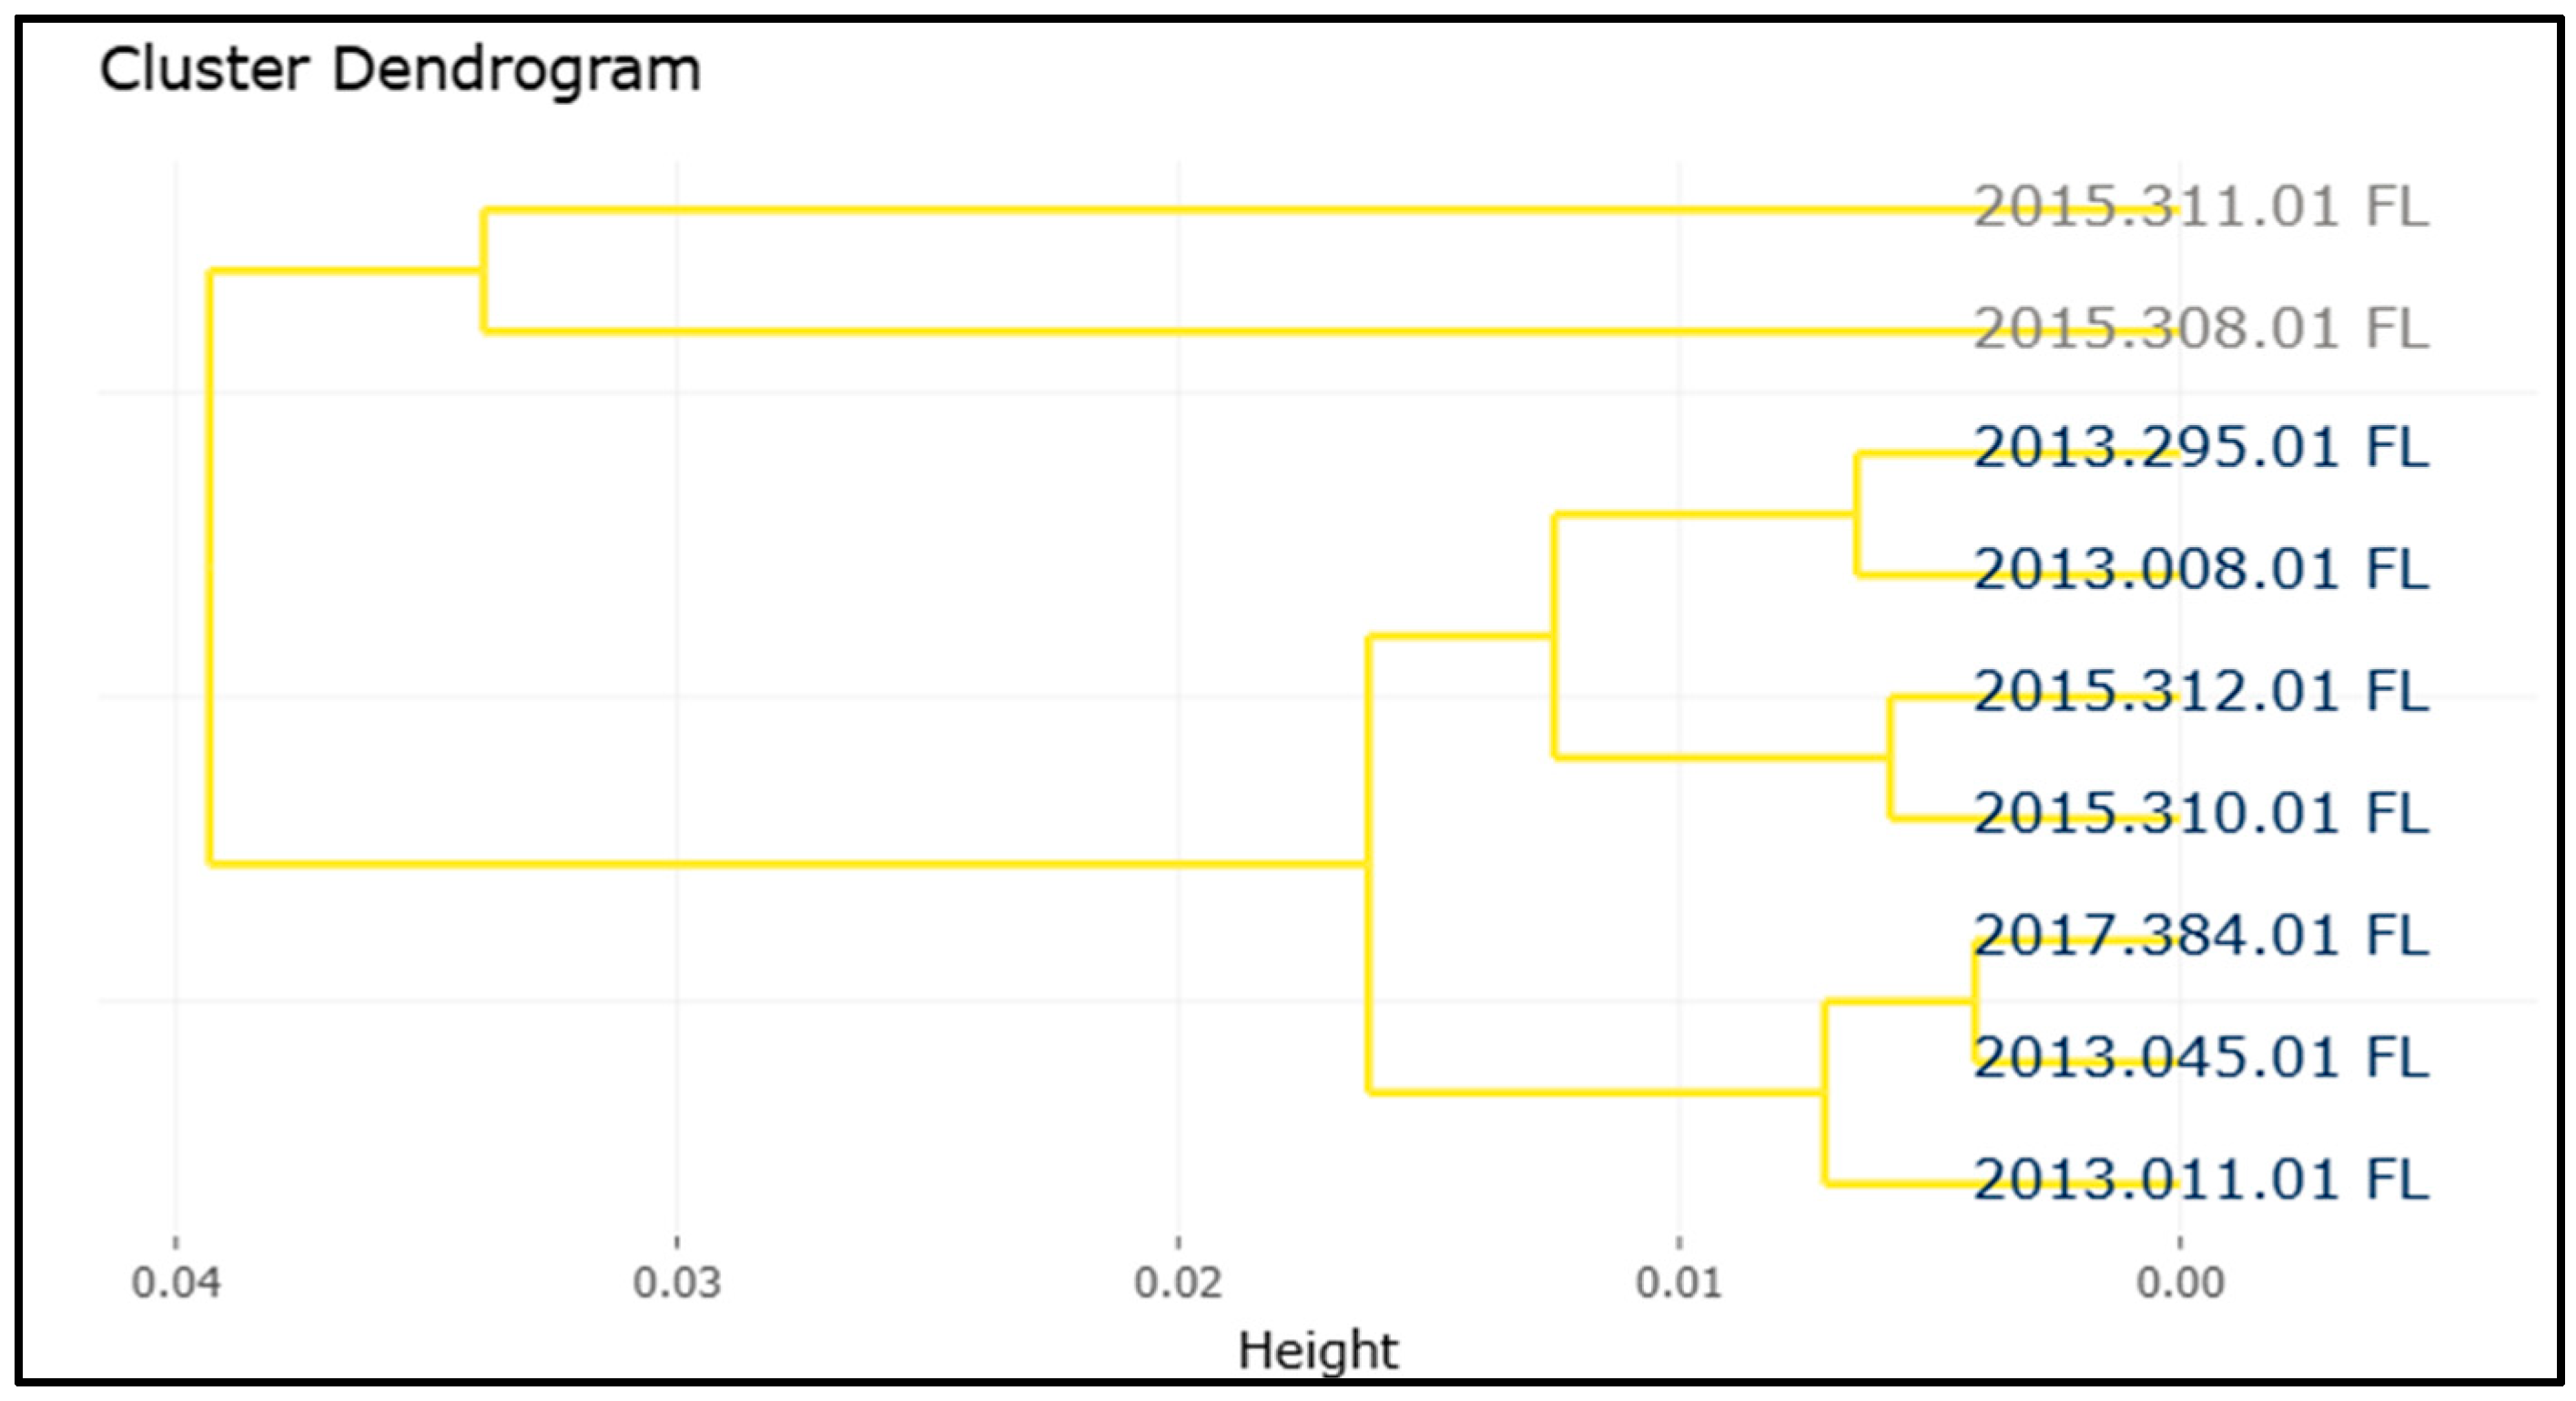
Finally, clusters of all indicators were created for each of the health units. Specifically, Figure 7 presents the clustering of indicators for the Arte Nova health unit.
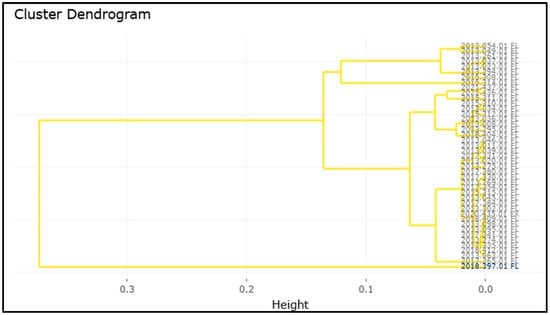
Figure 7.
Dendrogram of indicators for USF Arte Nova.
Lastly, in this type of cluster, we observe that one indicator was grouped alone, indicating that this indicator has a different behavior over time compared to the others in USF Arte Nova.
4. Discussion
Regarding the exploratory analysis of the indicators, this revealed significant patterns in the behavior of the indicators and healthcare units over time. Through the presented graphs, it was possible to observe similar trends between indicators and healthcare units, as well as different behaviors among them.
The ability to select multiple indicators and multiple healthcare units over time allows for not only understanding the behavior of each indicator and each unit separately but also facilitates the comparison of their behaviors. Additionally, the possibility of including trend lines makes it clearer to identify both growth and decline patterns.
The type of graph exemplified in Figure 3 allows the identification of healthcare units that, within each type of unit, performed better concerning the desired indicators. Consequently, the practices adopted by these units could serve as a model for those with lower performance.
In general, through the graphs created, specifically in the three analyzed examples, we can observe a decrease in the values of the indicators in the year 2020. In some cases, this decrease is clearly visible, while in others, it is more subtle. This behavior can largely be explained by the SARS-CoV-2 pandemic, which had a significant impact on various areas of public health due to the heavy burden on healthcare systems [13]. During the peak of the pandemic, there was a decrease in the demand for consultations and follow-up care due to patients’ fear of contracting the virus [14]. The suspension of non-urgent activities, such as routine consultations and preventive exams, contributed to this decrease, especially in areas related to maternal and child health, chronic disease management, and preventive care in general [13]. However, after the year 2020, many indicators began to show signs of recovery, reflecting the adaptation of healthcare services and the gradual return to normalcy.
The use of repeated measures correlation revealed significant patterns in the relationships between health indicators over time within health units. It proved effective in capturing the interactions between indicators, overcoming the limitations of simple correlations, such as Pearson’s correlation.
In this context, the analysis highlighted a strong positive correlation between indicators 2013.037.01 FL (proportion of diabetes mellitus patients with a nursing consultation for diabetes monitoring in the past year) and 2013.261.01 FL (proportion of diabetes mellitus patients with an assessment of foot ulcer risk). This result suggests that health units that provide more comprehensive monitoring of diabetes patients also have better practices for assessing complications such as foot ulcers.
On the other hand, a significant negative correlation of −0.8414 was observed between 2013.020.01 FL (proportion of hypertensive patients under 65 years old with blood pressure < 150/90) and 2015.314.01 (proportion of diabetes mellitus patients with blood pressure ≥ 140/90 mmHg). This indicates a significant inverse relationship, meaning that where the proportion of hypertensive patients with controlled blood pressure is high, the proportion of diabetes patients with elevated blood pressure tends to be lower. This suggests that effective hypertension control strategies are especially valuable in diabetic patients, many of whom also have hypertension.
Therefore, the results indicate that health units may benefit from adopting integrated care strategies that address multiple indicators simultaneously.
Subsequently, the creation of groups of indicators and groups of healthcare units simplifies the analysis by allowing them to be evaluated together. Understanding the relationship between the indicators as well as between the units can facilitate the identification of patterns, comparison between groups, and more efficient and informed management. In the case of the dendrogram of the “Women’s Health” dimension for the Arte Nova healthcare unit (Figure 5), we see the two clusters formed for the “Women’s Health” dimension as well as the indicators that are part of each group. By observing the dendrogram, we note that two indicators are grouped within the same cluster, suggesting that the temporal patterns of these indicators are similar.
5. Conclusions
In conclusion, this exploratory analysis allowed for the identification of important patterns in the behavior of health units and indicators, as well as enabling a comparative analysis through the ability to select multiple indicators and health units. The use of the repeated measures correlation (rmcorr) technique allowed for exploring the relationships between indicators across health units over time, revealing relevant correlation patterns. Additionally, the creation of clusters provided further insights into the relationships between indicators and health units.
Thus, the analysis of primary health indicators is expected to provide healthcare professionals with important insights for the management and continuous improvement of health units. The implementation and monitoring of these indicators allow for a detailed view of the areas that require attention, facilitating more informed and strategic decision making.
Author Contributions
Conceptualization, A.L.S., C.J.S., J.C., J.P.A., P.R., S.J.P. and V.A.; methodology, A.L.S., C.J.S., J.C., J.P.A., P.R., S.J.P. and V.A.; software, A.L.S., C.J.S., J.C., J.P.A., P.R., S.J.P. and V.A.; validation, A.L.S., C.J.S., J.C., J.P.A., P.R., S.J.P. and V.A.; formal analysis, A.L.S., C.J.S., J.C., J.P.A., P.R., S.J.P. and V.A.; investigation, A.L.S., C.J.S., J.C., J.P.A., P.R., S.J.P. and V.A.; writing—original draft preparation, A.L.S., C.J.S., J.C., J.P.A., P.R., S.J.P. and V.A.; writing—review and editing, A.L.S., C.J.S., J.C., J.P.A., P.R., S.J.P. and V.A.; visualization, A.L.S., C.J.S., J.C., J.P.A., P.R., S.J.P. and V.A.; supervision, C.J.S., J.C., J.P.A., P.R., S.J.P. and V.A. All authors have read and agreed to the published version of the manuscript.
Funding
This research was partially supported by Portuguese funds through CIDMA, The Center for Research and Development in Mathematics and Applications of University of Aveiro, and the Portuguese Foundation for Science and Technology (FCT—Fundação para a Ciência e a Tecnologia), within projects UIDB/04106/2020 (https://doi.org/10.54499/UIDB/04106/2020) and UIDP/04106/2020 (https://doi.org/10.54499/UIDP/04106/2020) and by the project “Mathematical Modelling of Multi-scale Control Systems: applications to human diseases (CoSysM3)”, 2022.03091.PTDC (https://doi.org/10.54499/2022.03091.PTDC), financially supported by national funds (OE), through FCT/MCTES. A. L. Saraiva was supported by a Research Grant of the Thematic Line Biomathematics of CIDMA.
Data Availability Statement
The original contributions presented in this study are included in the article. Further inquiries can be directed to the corresponding author.
Conflicts of Interest
The authors declare no conflicts of interest.
Appendix A
Table A1.
A table with the name of the indicators and their corresponding code.
Table A1.
A table with the name of the indicators and their corresponding code.
| Indicators | Code | Area | Dimensions |
|---|---|---|---|
| Prop. cons. ind. w/response within 3 working days | 2017.335.01 FL | Access | Maximum Guaranteed Response Times |
| Annual utilization index of nursing consultations | 2017.331.01 FL | Access | Coverage or Utilization |
| Utilization rate of primary care consultations (medical/nursing) | 2013.008.01 FL | Health Management | Women’s Health |
| Rate of home nursing visits per 1000 elderly registrants | 2013.294.01 FL | Health Management | Elderly Health |
| Annual utilization index of medical consultations | 2017.330.01 FL | Access | Coverage or Utilization |
| The proportion of 7-year-olds with ongoing medical consultations and routine vaccination | 2013.063.01 FL | Health Management | Child and Youth Health |
| The proportion of 14-year-olds with completed or administered routine vaccinations | 2013.095.01 FL | Health Management | Child and Youth Health |
| Adequate follow-up index for children in the 2nd year | 2013.269.01 FL | Health Management | Child and Youth Health |
| Adequate follow-up index for children in the 1st year | 2013.302.01 FL | Health Management | Child and Youth Health |
| The proportion of individuals aged 14 and over with obesity who have received obesity monitoring consultations for 2 years | 2013.034.01 FL | Health Management | Adult Health |
| The proportion of patients aged 50 to 74 with colorectal cancer screening | 2013.046.01 FL | Health Management | Adult Health |
| The proportion of patients with alcohol consumption, with consultation 3Y | 2013.054.01 FL | Health Management | Adult Health |
| The proportion of patients aged 25 and over with a tetanus vaccination | 2013.098.01 FL | Health Management | Adult Health |
| The proportion of smokers with a brief or very brief intervention within 1 year | 2018.397.01 FL | Health Management | Adult Health |
| The annual incidence of the individual in tobacco abstinence within 12 months | 2018.404.01 FL | Health Management | Adult Health |
| The proportion of patients with free influenza vaccine provided by the National Health Service | 2020.435.01 FX | Health Management | Adult Health |
| The proportion of pregnant women with a medical consultation for monitoring in the 1st trimester | 2013.011.01 FL | Health Management | Women’s Health |
| The proportion of women aged 25–60 with cervical cancer screening | 2013.045.01 FL | Health Management | Women’s Health |
| The proportion of postpartum women with a consultation for monitoring by a nurse within 5+ days and with periodic reassessment | 2013.295.01 FL | Health Management | Women’s Health |
| The proportion of pregnant women with a 2nd trimester ultrasound | 2015.308.01 FL | Health Management | Women’s Health |
| Index of laboratory tests performed in the 1st trimester of pregnancy | 2015.310.01 FL | Health Management | Women’s Health |
| Index of laboratory tests performed in the 2nd trimester of pregnancy | 2015.311.01 FL | Health Management | Women’s Health |
| Index of laboratory tests performed in the 3rd trimester of pregnancy | 2015.312.01 FL | Health Management | Women’s Health |
| The proportion of newborns whose mother has a record of pregnancy | 2017.384.01 FL | Health Management | Women’s Health |
| The proportion of hypertensive patients under 65 years old with blood pressure < 150/90 | 2013.020.01 FL | Disease Management | Hypertension |
| The proportion of hypertensive patients with cardiovascular risk (3 years) | 2013.023.01 FL | Disease Management | Hypertension |
| The proportion of patients with COPD who have had FeV1 measured within 3 years | 2013.049.01 FL | Disease Management | Respiratory System Diseases |
| The proportion of adults with asthma/COPD/chronic bronchitis who have a diagnosis | 2017.380.01 FL | Disease Management | Respiratory System Diseases |
| The proportion of patients with COPD aged 40 and over who have had a COPD monitoring consultation within 1 year | 2021.436.01 FL | Disease Management | Respiratory System Diseases |
| The proportion of patients with asthma aged 18 and over who have had an asthma monitoring consultation within 1 year | 2021.437.01 FL | Disease Management | Respiratory System Diseases |
| The proportion of diabetes mellitus patients with a record of glucose response testing | 2013.036.01 Fl | Disease Management | Diabetes Mellitus |
| The proportion of diabetes mellitus patients with a nursing consultation for diabetes monitoring in the past year | 2013.037.01 FL | Disease Management | Diabetes Mellitus |
| The proportion of diabetes mellitus patients with their most recent HbA1c ≤ 8.0% | 2013.039.01 FL | Disease Management | Diabetes Mellitus |
| The proportion of diabetes mellitus patients with an assessment of foot ulcer risk | 2013.261.01 FL | Disease Management | Diabetes Mellitus |
| The proportion of type 2 diabetes mellitus patients with insulin indications who are on appropriate therapy | 2013.274.01 FL | Disease Management | Diabetes Mellitus |
| The proportion of new type 2 diabetes mellitus patients on therapy with monotherapy metformin | 2013.275.01 FL | Disease Management | Diabetes Mellitus |
| The proportion of diabetes mellitus patients with blood pressure ≥ 140/90 mmHg | 2015.314.01 FL | Disease Management | Diabetes Mellitus |
| The proportion of diabetes mellitus patients with LDL cholesterol < 100 mg/dL | 2015.315.01 FL | Disease Management | Diabetes Mellitus |
| Expenditure on prescribed diagnostic and therapeutic procedures per standard enrollee (conventional weight) | 2017.354.01 FL | Prescription Qualification | MCDT Prescription |
| The proportion of patients without prolonged prescription of anxiolytics/sedatives/hypnotics (adjusted) | 2018.409.01 FL | Prescription Qualification | Pharmacotherapeutic Prescription |
| Expenditure on prescribed medications per standard enrollee | 2017.341.01 FL | Prescription Qualification | Pharmacotherapeutic Prescription |
| Rate of avoidable hospitalizations in adult population (adjusted) | 2017.365.01 FL | Care Integration | Multimorbidity and Other Types of Diseases |
| [Same-day consultation of registered patients]/[same-day consultation + emergency consultations] | 2018.412.01 FL | Care Integration | Same-Day Appointment |
References
- Dimensões do Cuidar nos Cuidados de Saúde Primários. Available online: https://www.ordemenfermeiros.pt/centro/noticias/conteudos/dimens%C3%B5es-do-cuidar-nos-cuidados-de-sa%C3%BAde-prim%C3%A1rios/ (accessed on 1 July 2024).
- Biscaia, A.R.; Heleno, L.C.V. A reforma dos cuidados de saúde primários em Portugal: Portuguesa, moderna e inovadora. Cienc. Saude Coletiva 2017, 22, 701–711. [Google Scholar] [CrossRef]
- Barros, P.P. Competition policy for health care provision in Portugal. Health Policy 2017, 121, 141–148. [Google Scholar] [CrossRef] [PubMed]
- Diário da República. Portaria n.° 212/2017. Available online: https://diariodarepublica.pt/dr/detalhe/portaria/212-2017-107709510 (accessed on 14 January 2025).
- Pereira, A.L. Indicadores: O que são, o que não devem ser e o que poderão ser. Rev. Port. Med. Geral Fam. 2018, 34, 124–126. [Google Scholar] [CrossRef]
- Metainformação—Especificação de Conceito. Available online: https://sdm.min-saude.pt/bi.aspx?id_con=129#REGRAS_0016 (accessed on 2 July 2024).
- BI-CSP Bilhete de Identidade dos Cuidados de Saúde Primários. Available online: https://bicsp.min-saude.pt/pt/contratualizacao/idg/Paginas/default.aspx (accessed on 21 July 2024).
- Wickham, H. ggplot2. Wiley Interdiscip. Rev. Comput. Stat. 2011, 3, 180–185. [Google Scholar] [CrossRef]
- Li, R.; Bilal, U. Interactive web-based data visualization with R, plotly, and shiny (Carson Sievert). Biometrics 2021, 77, 776–777. [Google Scholar] [CrossRef]
- Bakdash, J.Z.; Marusich, L.R. Repeated measures correlation. Front. Psychol. 2017, 8, 456. [Google Scholar] [CrossRef]
- Marusich, L.R.; Bakdash, J.Z. rmcorrShiny: A web and standalone application for repeated measures correlation. F1000Research 2021, 10, 697. [Google Scholar] [CrossRef] [PubMed]
- Murtagh, F.; Contreras, P. Algorithms for hierarchical clustering: An overview. Wiley Interdiscip. Rev. Data Min. Knowl. Discov. 2012, 2, 86–97. [Google Scholar] [CrossRef]
- Khetrapal, S.; Bhatia, R. Impact of COVID-19 pandemic on health system & Sustainable Development Goal 3. Indian J. Med. Res. 2020, 151, 395–399. [Google Scholar] [CrossRef] [PubMed]
- Schäfer, I.; Hansen, H.; Menzel, A.; Eisele, M.; Tajdar, D.; Lühmann, D.; Scherer, M. The effect of COVID-19 pandemic and lockdown on consultation numbers, consultation reasons and performed services in primary care: Results of a longitudinal observational study. BMC Fam. Pract. 2021, 22, 125. [Google Scholar] [CrossRef]


Disclaimer/Publisher’s Note: The statements, opinions and data contained in all publications are solely those of the individual author(s) and contributor(s) and not of MDPI and/or the editor(s). MDPI and/or the editor(s) disclaim responsibility for any injury to people or property resulting from any ideas, methods, instructions or products referred to in the content. |
© 2025 by the authors. Licensee MDPI, Basel, Switzerland. This article is an open access article distributed under the terms and conditions of the Creative Commons Attribution (CC BY) license (https://creativecommons.org/licenses/by/4.0/).