Article

Optimized Apparatus Design for Continuous Aqueous Two-Phase Flotation (ATPF)

Institute of Mechanical Process Engineering and Mechanics, Karlsruhe Institute of Technology (KIT), Strasse am Forum 8, 76131 Karlsruhe, Germany
*
Author to whom correspondence should be addressed.
Separations 2023, 10(9), 511; https://doi.org/10.3390/separations10090511
Submission received: 3 August 2023 / Revised: 3 September 2023 / Accepted: 5 September 2023 / Published: 16 September 2023
(This article belongs to the Section Purification Technology)

Abstract

:
Aqueous two-phase flotation (ATPF) is an integrative downstream method for separating and concentrating biomolecules from crude biosuspensions such as fermentation broth. Its continuous operation not only increases throughput, but also makes it recommended for continuous upstreams. In this work, an optimized apparatus design in the form of a horizontal flotation tank is presented. The geometry of the new apparatus for continuous ATPF is optimized using flow simulations so that the two aqueous phases can be pumped uniformly through the flotation tank in co-current or counter-current flow. The implementation of a conductivity measurement enables to characterize the phase mixing effect induced by the rising gas bubbles introduced through three different gassing units. ATPF experiments with the model enzyme phospholipase A2 show that there are favorable combinations of gas flow rates to increase the flotation rate and reduce the back-diffusion at the outlet of the apparatus. This allows high phase exchange rates up to 2/h and hence increases the amount of enzymes that can be recovered per time. Co-current operation of continuous ATPF increased separation efficiency about 14% up to E = 74% compared to counter-current operation.

1. Introduction

Aqueous two-phase flotation (ATPF) is a combination of aqueous two-phase extraction (ATPE) and flotation. It was first described 2009 by Bi et al. [1] for the separation and concentration of penicillin G from fermentation broth. For both, ATPF and ATPE an aqueous two-phase system (ATPS) forms the basis of the process. By mixing phase-forming components of two different species (mostly polymers and salts) in sufficiently high concentrations, an aqueous solution is split into a top phase and a bottom phase. Water forms the main component of both phases, which is the reason for the high biocompatibility of ATPS. In polymer-salt systems, the lighter top phase usually has a high polymer concentration and a low salt concentration, while the opposite is true for the heavier bottom phase. For the purpose of extracting biomolecules, the composition of the two-phase system is chosen such that the product shows an increased affinity for the top phase. In ATPE, the top phase is dispersed as small droplets in the bottom phase and the biomolecules diffuse into the top phase droplets. Without input of mixing energy, the two aqueous phases separate due to their density difference and the biomolecules are thus concentrated in the top phase, whereas impurities (e.g., microorganisms) maintain in the bottom phase. In ATPE, a large volume of top phase must be dispersed in the product-containing bottom phase, since this creates the necessary surface for diffusive mass transfer. In ATPF, the top phase is not dispersed in the bottom phase, but gas bubble introduction takes place at the bottom of a flotation cell. The biomolecules attach themselves with their hydrophobic regions to the bubble surface, rise with the gas bubbles and are thus transported into the collecting top phase. Since the main mass transfer is realized by flotation, no large amount of top phase is needed to be dispersed for rapid mass transfer. While in ATPE the volume ratio V R of top phase to bottom phase ( V T O P / V B O T ) is usually in the range of 0.2–0.5, ratios of 0.03–0.25 are common in ATPF [2]. This results in low costs for phase-forming components and in high concentration factors of the product in the liquid top phase.
ATPF combines the material advantages of ATPS with the high mass transfer of flotation. This allows biomolecules to be selectively separated from complex biosuspensions and concentrated in a collecting top phase. Both pharmaceutical and technical molecules [1,3,4,5,6,7,8,9] and enzymes [10,11,12,13,14,15,16,17,18,19,20,21,22,23] can be separated from plant extracts or fermentations with microalgae, bacteria or fungi. In a review Lee et al. [2] summarized the research on ATPF and justified the great potential in direct recovery of biotechnological products by ATPF. They concluded that there are four main advantages: High separation efficiency, high concentration factors, environmental friendliness, and cost effectiveness. However, combining extraction with flotation also increases the number of parameters influencing the separation result and complexity of the process.
Although ATPF has been well investigated on the material side (product, ATPS, pH), almost no process optimization has been carried out to date. Only recently the important influence of the gas input could be shown [22]: Bubble introduction into the bottom phase can occur via different porous media in ATPF, resulting in different bubble size distributions. The bubble size is crucial for both, enzyme transport and the stability of the aqueous phase boundary between top and bottom phase. In general, the smaller the gas bubbles and the higher the gas volume flow rate, the higher the interfacial entry and thus the total bubble surface area to which the enzymes can adsorb. Even if a high amount of gas bubble introduction is targeted, the gas flow rate cannot be chosen arbitrarily high, since this also entails an increase in bubble size. Bubbles that are too large rise very quickly and swirl in the bottom phase as they pass the top phase boundary [22].
Furthermore, a continuous ATPF was presented for the first time, which leads to a significant increase in space-time yield [23]. In this work it is found that most of the mass transfer occurs at the beginning of batch ATPF, when the concentration gradient between enriched bottom phase and unloaded top phase is highest. To take advantage of this effect, continuous phase exchange was implemented. However, it was found during the studies that the vertical flotation columns used for batch ATPF and known from froth flotation are disadvantageous in continuous operation of the process, since there is no spatial separation between unloaded and loaded top phase and thus no selective exchange is possible [23].
The aim of this work was to design an optimized apparatus for continuous ATPF, taking into account the kinetic parameters (e.g., flotation rate and phase exchange rate) and the mechanical design (geometry, local gassing units), as both are key variables for a possible later scale-up [24].
The results presented in this article show the development of an optimized apparatus design for continuous aqueous two-phase flotation, which allows a controlled phase exchange, as well as locally variable gas input. Computational fluid dynamics (CFD) supported the optimization of the design. By integrating suitable measurement technology, the mixing effect of the rising gas bubbles can be characterized. Continuous ATPF experiments with model enzyme phospholipase A2 show the impacts of both, gas input and phase turbulence on separation efficiency. In addition, a comparison of the flow directions of the aqueous phases was carried out in order to investigate whether pumping the phases in co-current or counter-current flow is to be preferred.

2. Experimental Setup

The materials for the experiments as well as the methods to evaluate the results are described in the following.

2.1. Aqueous Two-Phase System (ATPS)

Beside demineralized water, tri-sodium citrate dihydrate and polyethylene glycol (PEG) 1000 (both Ph.Eur., Carl Roth, Karlsruhe, Germany) are the main components of the two aqueous phases. In the bottom phase (BOT) the salt concentration is very high at 25.8% (w/w) and the polymer concentration is relatively low at 0.7% (w/w). The opposite is true for the top phase (TOP), which contains 39.4% (w/w) PEG and 3.0% (w/w) citrate. The initial enzyme concentration in the enriched bottom phase was 1.5% (w/w) of the model enzyme phospholipase A2, which was dissolved from spray-dried powder (PLP 21159, Sternenzym, Ahrensburg, Germany). Due to the different compositions of the phases, there is a density difference of 101 kg/m3, leading to the vertical separation of the two phases in the flotation apparatus. The selection of the material system is based on previous work [22,23].

2.2. Continuous Aqueous Two-Phase Flotation (ATPF)

For the continuous operation of the ATPF, a horizontal flotation tank was designed (see Section 4.1) and a prototype manufactured using 3D-printing. For that the 3D-printer (AGILISTA-3200, KEYENCE, Neu-Isenburg, Germany) and acrylic based material (AR-M2) was used. Flow simulations were used to support the design and to ensure that the flow through the flotation tank was uniform (see Section 3). Figure 1 shows the prototype from different views. The volume of the bottom phase was about 500 mL and 100 mL of the top phase was added on top, resulting in a volume ratio V R of 0.2. During the ATPF-experiments, both phases were fully recirculated during the first 60 min of flotation and then continuously discharged for another 60 min by using a 4-channel peristaltic pump (Ismatec Reglo ICC, Cole-Parmer, St. Neots, UK). Air was introduced via three gassing units, each containing a circular metal mesh (twill weave) with pore size of 10 µm (TopMesh TM10, Spoerl, Spörl, Sigmaringendorf, Germany) and diameter of 2 cm to introduce the gas bubbles into the bottom phase.

2.3. Measurement Techniques and Evaluation Methods of the ATPF-Experiments

To measure the electrical conductivity, a conductivity probe (Cond 340i, WTW) was installed near the outlet and about 2 cm below the aqueous phase boundary. Via calibration (see Section 4.3), the amount of in bottom phased dispersed top phase could be determined. In order to characterize the phase mixing by rising bubbles in the flotation tank, it was filled with bottom and top phase. After starting the gas input and after a steady flow pattern had formed (approx. 2 min), the gas input was switched off again so that the air bubbles would not distort the conductivity measurement, which was recorded immediately afterwards. After the initial stationary phase boundary had regenerated (several minutes), the procedure was repeated and a total of five conductivity readings were recorded. The deviation of these values around the respective mean value was less than 1%.
The gas input was adjusted using a mass flow controller (SLA5800, Brooks Instrument, Dresden, Germany) for each of the three gassing units. Bubble surface area flux ( S b ) is a key parameter for evaluating gas input and describes the total bubble surface to which the enzymes can attach. For the complete apparatus S b is the sum of the individual bubble surface area fluxes in each compartment ( S b , i ) It was calculated according to Equation (1), where the gas flow rate of each gassing unit ( V ˙ G , i ), the cross-sectional area of each gassing compartment ( A C , i ), and the known Sauter mean diameters ( d 3,2 , i ) for the different flow rates used (see [22]) are considered.
S b = i S b , i = i 6 V ˙ G , i d 3,2 , i A C , i
Several samples were taken from the discharged bottom phase to measure the phospholipase concentration by absorbance measurement at 280 nm wavelength using a UV/Vis spectrophotometer (UV-1900, Shimadzu, Duisburg, Germany). The initial ( c B , 0 ) and actual ( c B , t ) enzyme concentration of the bottom phase were used to calculate the separation efficiency ( E ( t ) ) using Equation (2).
E ( t ) = c B , 0 c B , t c B , 0 · 100 %
Combining Equation (2) with a first-order kinetic leads to Equation (3). By graphical fitting E ( t ) with the exponential expression, the flotation rate constant k and the maximal achievable final separation efficiency E can be determined in terms of fit parameters [22]. The exponential fit visualizes the trend during flotation time ( t ) for the recirculation mode, while a linear fit works for the continuous operation.
E ( t ) = E 1 e k t 100 %

3. Numerical Setup

Computational fluid dynamics (CFD) helped to optimize the geometry of the inlet of the continuous flotation cell. In order to prevent flow separation from the wall and to achieve a uniform flow through the flotation cell, the inlet geometry was optimized. For this purpose, the cross-section of the inlet tube was continuously expanded to the cross-section of the flotation cell. The flow separation depends on the angle of the cross-section expansion and the Reynolds number. In the present case, the angle was kept constant at 45° and the flow rate was varied. To study the flow separation, simulations were performed in single phase using the solver pimpleFoam. A multiphase simulation served as validation afterwards. The simulation software used was the open source software OpenFOAM (v9, The OpenFOAM Foundation Ltd., London, UK).

3.1. Numerical Description of the Flow Behavior

In OpenFoam, the fluid flow is calculated by solving the Navier-Stokes equations discretely. In the case of two or more incompressible, isothermal, immiscible fluids, the material properties are constant in the region filled exclusively by one of the fluids, except at the interphases. For incompressible fluids (the density along a trajectory is constant and thus the volumetric strain rate is zero), the mass continuity equation reduces to a volume continuity equation, which means that the divergence of the velocity field is zero everywhere.
u j   x j = 0
Thereby, x j represents the carthesian coordinates and u i the carthesian components of the flow velocity vector, whereby the indexes i and j denote the balance direction and assume all three spatial directions. To take into account the multiphase nature, the incompressible Navier-Stokes-equations was extended to include a momentum source due to surface tension f σ i .
( ρ u i )   t + x j ρ u j u i = p x i + η 2 u i x j 2 + f σ i + ρ g i
The first term describes the temporal spatial change of the transport quantity and the second term represents the convection by incoming and outgoing currents. The terms on the right side describe surface forces like pressure, friction or tension as well as mass forces like gravitation acting on the momentum. Thereby, the parameter p stands for the pressure, the parameter η represents the dynamic viscosity, ρ the density and g i is the gravitational acceleration.
If two or more immiscible fluids are present, the volume of fluid method (VOF) [25] is suitable for describing the multiphase system. Additionally to the conservation equations for the flow, an equation for the volume fraction α n of each fluid n is also solved.
α n   t + ( α n u i )   x j = 0
The volume fractions α n are related to each other by the normalization:
n = 1 N α n = 1                 α n 0,1   .
The density ρ and kinematic viscosity ν of the multiphase system are treated as volumetric mixture values and calculated in each grid cell using the densities ρ n and viscosities η n of the individual fluids and the volumetric phase fractions α n as weighting factors.
ρ = n = 1 N α n   ρ n
η = n = 1 N α n   η n
The force due to surface tension acts solely in regions with a free surface, meaning in partially filled grid cells. The surface tension f σ i is modeled as a continuous surface force (CSF) according to Brackbill et al. [26].
f σ i = n m n σ n m   k n m α n   x i
Here, the variable σ n m describes the surface tension between the phases n and m . The curvature of the free surface k n m can be calculated as the divergence of a unit vector perpendicular to the surface.
k n m = x i   α m α n x i α n α m x i α m α n x i α n α m x i
In grid cells filled with solely one fluid, the gradient of α n is zero and thus f σ i = 0 is valid there. Furthermore, it is obvious these cells also retain the material properties of the respective phase ( ρ n , η n ).

3.2. Mesh Characteristics

The most important point of the simulation is the consideration of the flow separation in the inlet area of the flotation cell. Three grids were created: two geometries to study the flow separation in the inlet zone and the final geometry for comparison with the experimental results. Figure 2 shows the three geometries. All meshes were created with the mesh generator snappyHexMesh. The first inlet geometry (a) shows an abrupt expansion of the cross-section, comparable to a Carnot diffuser. The mesh consists of about 600,000 cells in the form of structured hexahedrons. A local refinement serves to resolve the boundary layer. Thereby, the boundary layer thickness was estimated according to Blasius [27,28]. The second inlet geometry (b) has a continuous expansion of the cross section. The angle is 45°. The mesh consists of about 600,000 cells and the boundary layer at the walls was also resolved accordingly. The final flotation cell is shown in (c). The top phase is located in the zone shown in red. In the blue zone, there is no top phase present but air (above) or bottom phase (below). The mesh consists of about 1,000,000 cells in the form of structured hexahedrons. A detail enlargement shows the grid in the region of the phase boundary. A local refinement serves to resolve the boundary layer at the level of the inlets as well as a finer resolution of the phase boundary.
The simulation of the flow separation was performed using a single phase. The velocity was specified at the inlet and the pressure at the outlet. In the multiphase simulation, the zones of air, top phase and bottom phase were pre-defined at the beginning of the simulation and the corresponding segments were pre-patched in each case. The air phase was at the top, the top phase was in the middle, and the bottom phase was located underneath. Both the top and the bottom phase had two inlets each, recognizable Figure 1 and Figure 2. At the inlets, the volume flow was defined by a fixed value. A fixed value for the pressure was specified at the outlets, while the Neumann boundary condition applied for the velocity and the respective phase. At the walls, the Neumann boundary condition was chosen for the pressure and phase components, and adhesion conditions applied to the velocity.
In the present case, three phases existed: top phase, bottom phase and air. The top and bottom phases were aqueous solutions that were immiscible with each other and also not miscible with air. The material properties, density and viscosity, were constant. An important aspect in the design of the flotation cell is the uniform distribution of the incoming volume flows in the horizontal direction. Thus, the focus was particularly on the optimization of the inlet. Here, the idea was to prevent the separation of the flow by uniformly widening the cross-section. Simpler geometries, starting with a cuboid, preceded the mesh. The inflow velocity and the characteristic properties of the fluid, meaning the density and viscosity, have a significant influence on the flow separation. The Reynolds number Re, which describes the ratio of inertia forces to viscous forces, is a dimensionless quantity for describing the flow pattern.
R e = u d h ρ η
Here, d h describes the hydraulic diameter. For a pipe flow, the hydraulic diameter corresponds to the pipe diameter d i n . For the cross-sectional tank, the hydraulic diameter is calculated from the width w t of the tank and the height h t . of the area occupied by the considered phase.
d h = 2 w t h t w t + h t

4. Results and Discussion

An optimized apparatus design for continuous ATPF ensures spatial separation of the feed phases as well as the processed phases. In addition, the geometry at the inlet of the apparatus must be optimized for a uniform inflow of the bottom phase. Crucial for a good separation process is a suitable and controllable gas input. This requires consideration of the phase mixing effect caused by the rising gas bubbles, as well as the effects of gas input and phase mixing on continuous ATPF.

4.1. Design of the Continuous ATPF Apparatus

When ATPF is operated in batch mode, a vertical flotation cell as known from conventional froth flotation is usually used. This allows integrating only one single gassing unit and disables a spatial separation of unloaded and loaded top phase in a continuous ATPF [23]. To overcome these disadvantages, an alternative apparatus design is needed. For continuous ATPF, a horizontal flotation tank has the advantage of separating the feed and processed phases across the longitudinal section of the apparatus. In Figure 1, a 3D-printed prototype of the labor-sized horizontal flotation tank is shown and in 
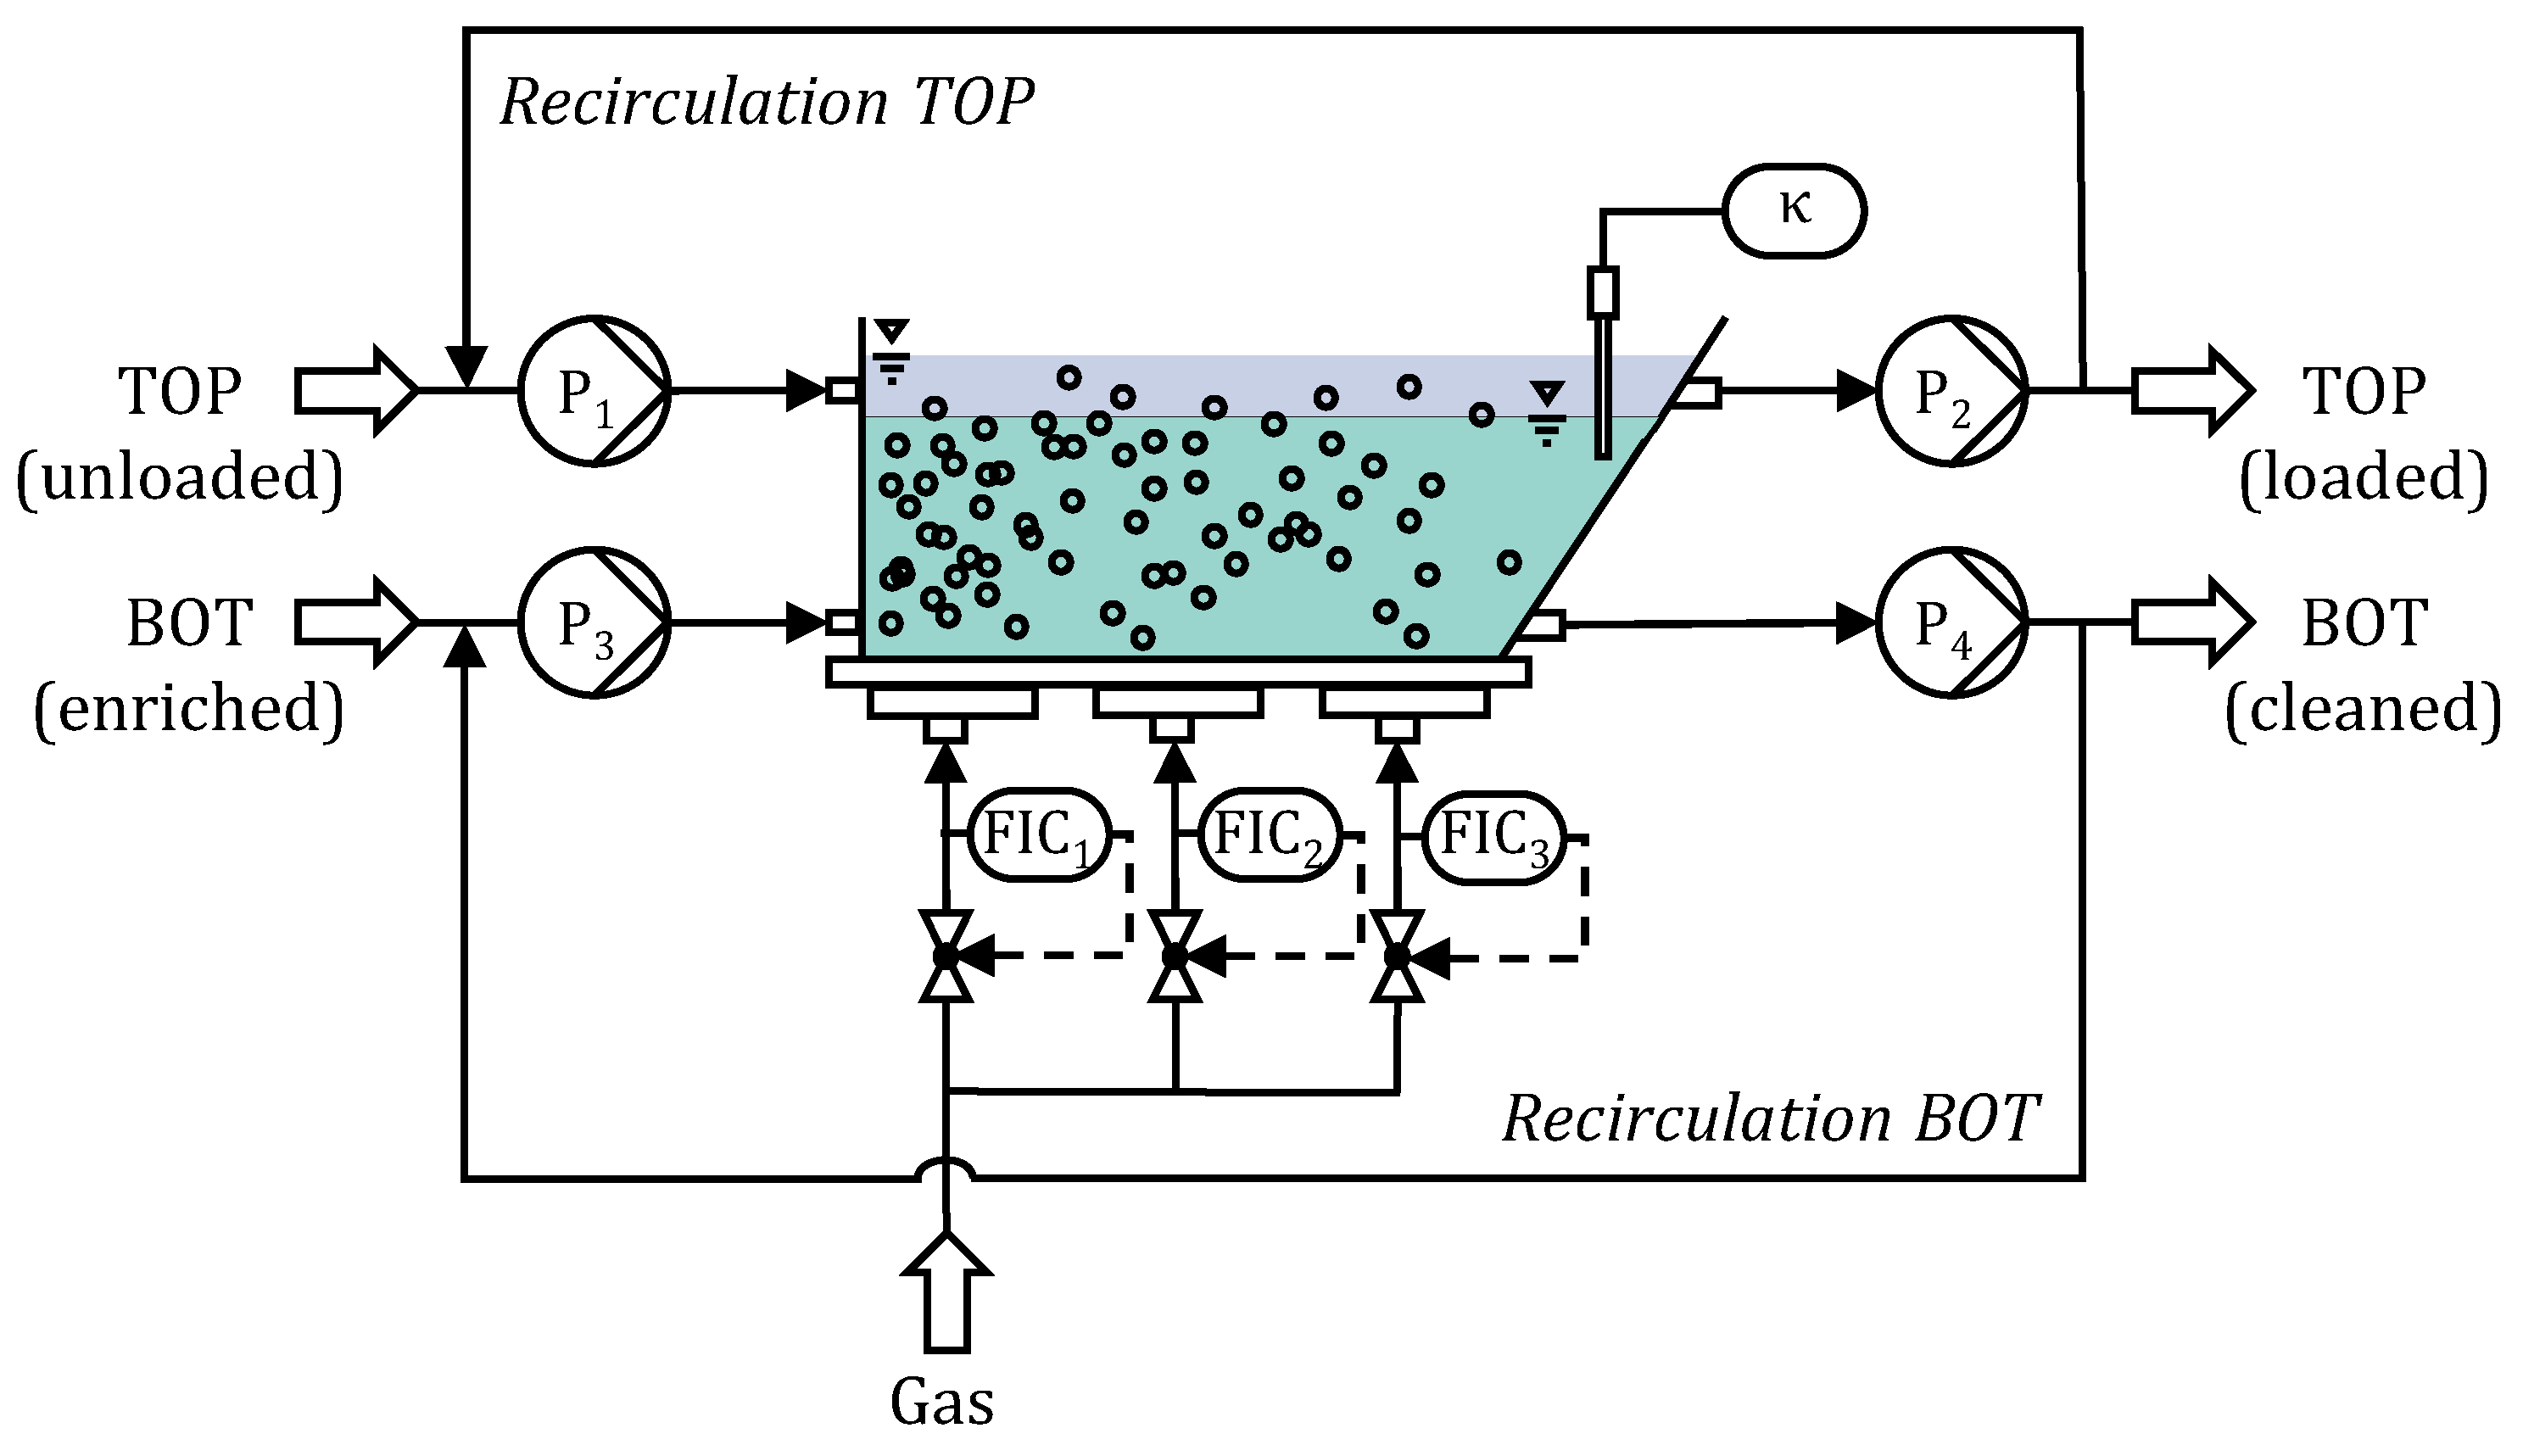
Figure 3, the apparatus is schematically illustrated for the case of co-current flow. The enzymes enriched bottom phase (BOT) is insert via the peristaltic pump P3 at the bottom of the flotation tank on the left side. The unloaded top phase (TOP) entries the flotation tank right above, conveyed by pump P1. Two outlets at the right side, connected with pump P2 and P4, allow exhausting the loaded top and cleaned bottom phase, respectively. While both phases move through the apparatus, gas bubbles are introduced via three identical gassing units. The gas flow rates of each unit can be adjusted separately by the mass flow controllers 1, 2 and 3. Additionally a conductivity measurement is implemented in the bottom phase near the outlet 2 cm below the aqueous phase boundary. For operating continuous ATPF efficiently, the handling of the throughput of bottom and top phase as well as the gas flows is essential. To keep a constant level of the two aqueous phases, the corresponding pumps for bottom phase (P3 and P4) can adjust the same flow rate at the inlet and outlet. The two pumps exchanging the top phase (P1 and P2) enable a constant volume of top phase in the same manner. By increasing the pumping rates, the phase exchange rate can be increased, if rapid mass transfer ensures high separation efficiency during continuous ATPF.
To achieve a high bubble surface area flux and hence a high flotation rate a high gas flow rate can be adjusted on the entry of the flotation tank. To avoid high penetration of the aqueous phase boundary between bottom and top phase, small bubbles and moderate gas flow rates are needed [22]. Hence, lower flow rates near the outlet of the apparatus prevent phase mixing, which would lead to back-diffusion of the enzymes from the enriched top into the cleaned bottom phase as well as a drainage of mixed phases. By measuring the electrical conductivity (κ) the phase separation can be characterized and the phase mixing controlled by adjusting the gas input. Since ATPF is most efficient, when there is a high concentration gradient of the enzymes between bottom and top phase [23], the co-current flow of the two aqueous phases provides a maximal mass transfer near the inlet of the horizontal flotation tank. Due to the spatial separation of the inlet and outlet, the gas input can be adjusted as needed for high amount of bubble introduction in the inlet as well as reduced phase mixing at the outlet. Consequently, the optimized design of the introduced apparatus assurances an efficient continuous ATPF process.

4.2. Geometry Optimization of the Inlet

To ensure a uniform flow through the flotation tank, there must be no stall in the inlet area. Otherwise, dead zones or backflow zones might occur. The Reynolds number at which stall occurs was determined by successively varying the volume flow rate or flow velocity at the inlet, starting at 1.6 mL/min up to 83 mL/min (16 mL/min corresponds to a phase exchange rate of 2/h). To ensure that the flow is stationary, the residence time of the flow domain was estimated. 
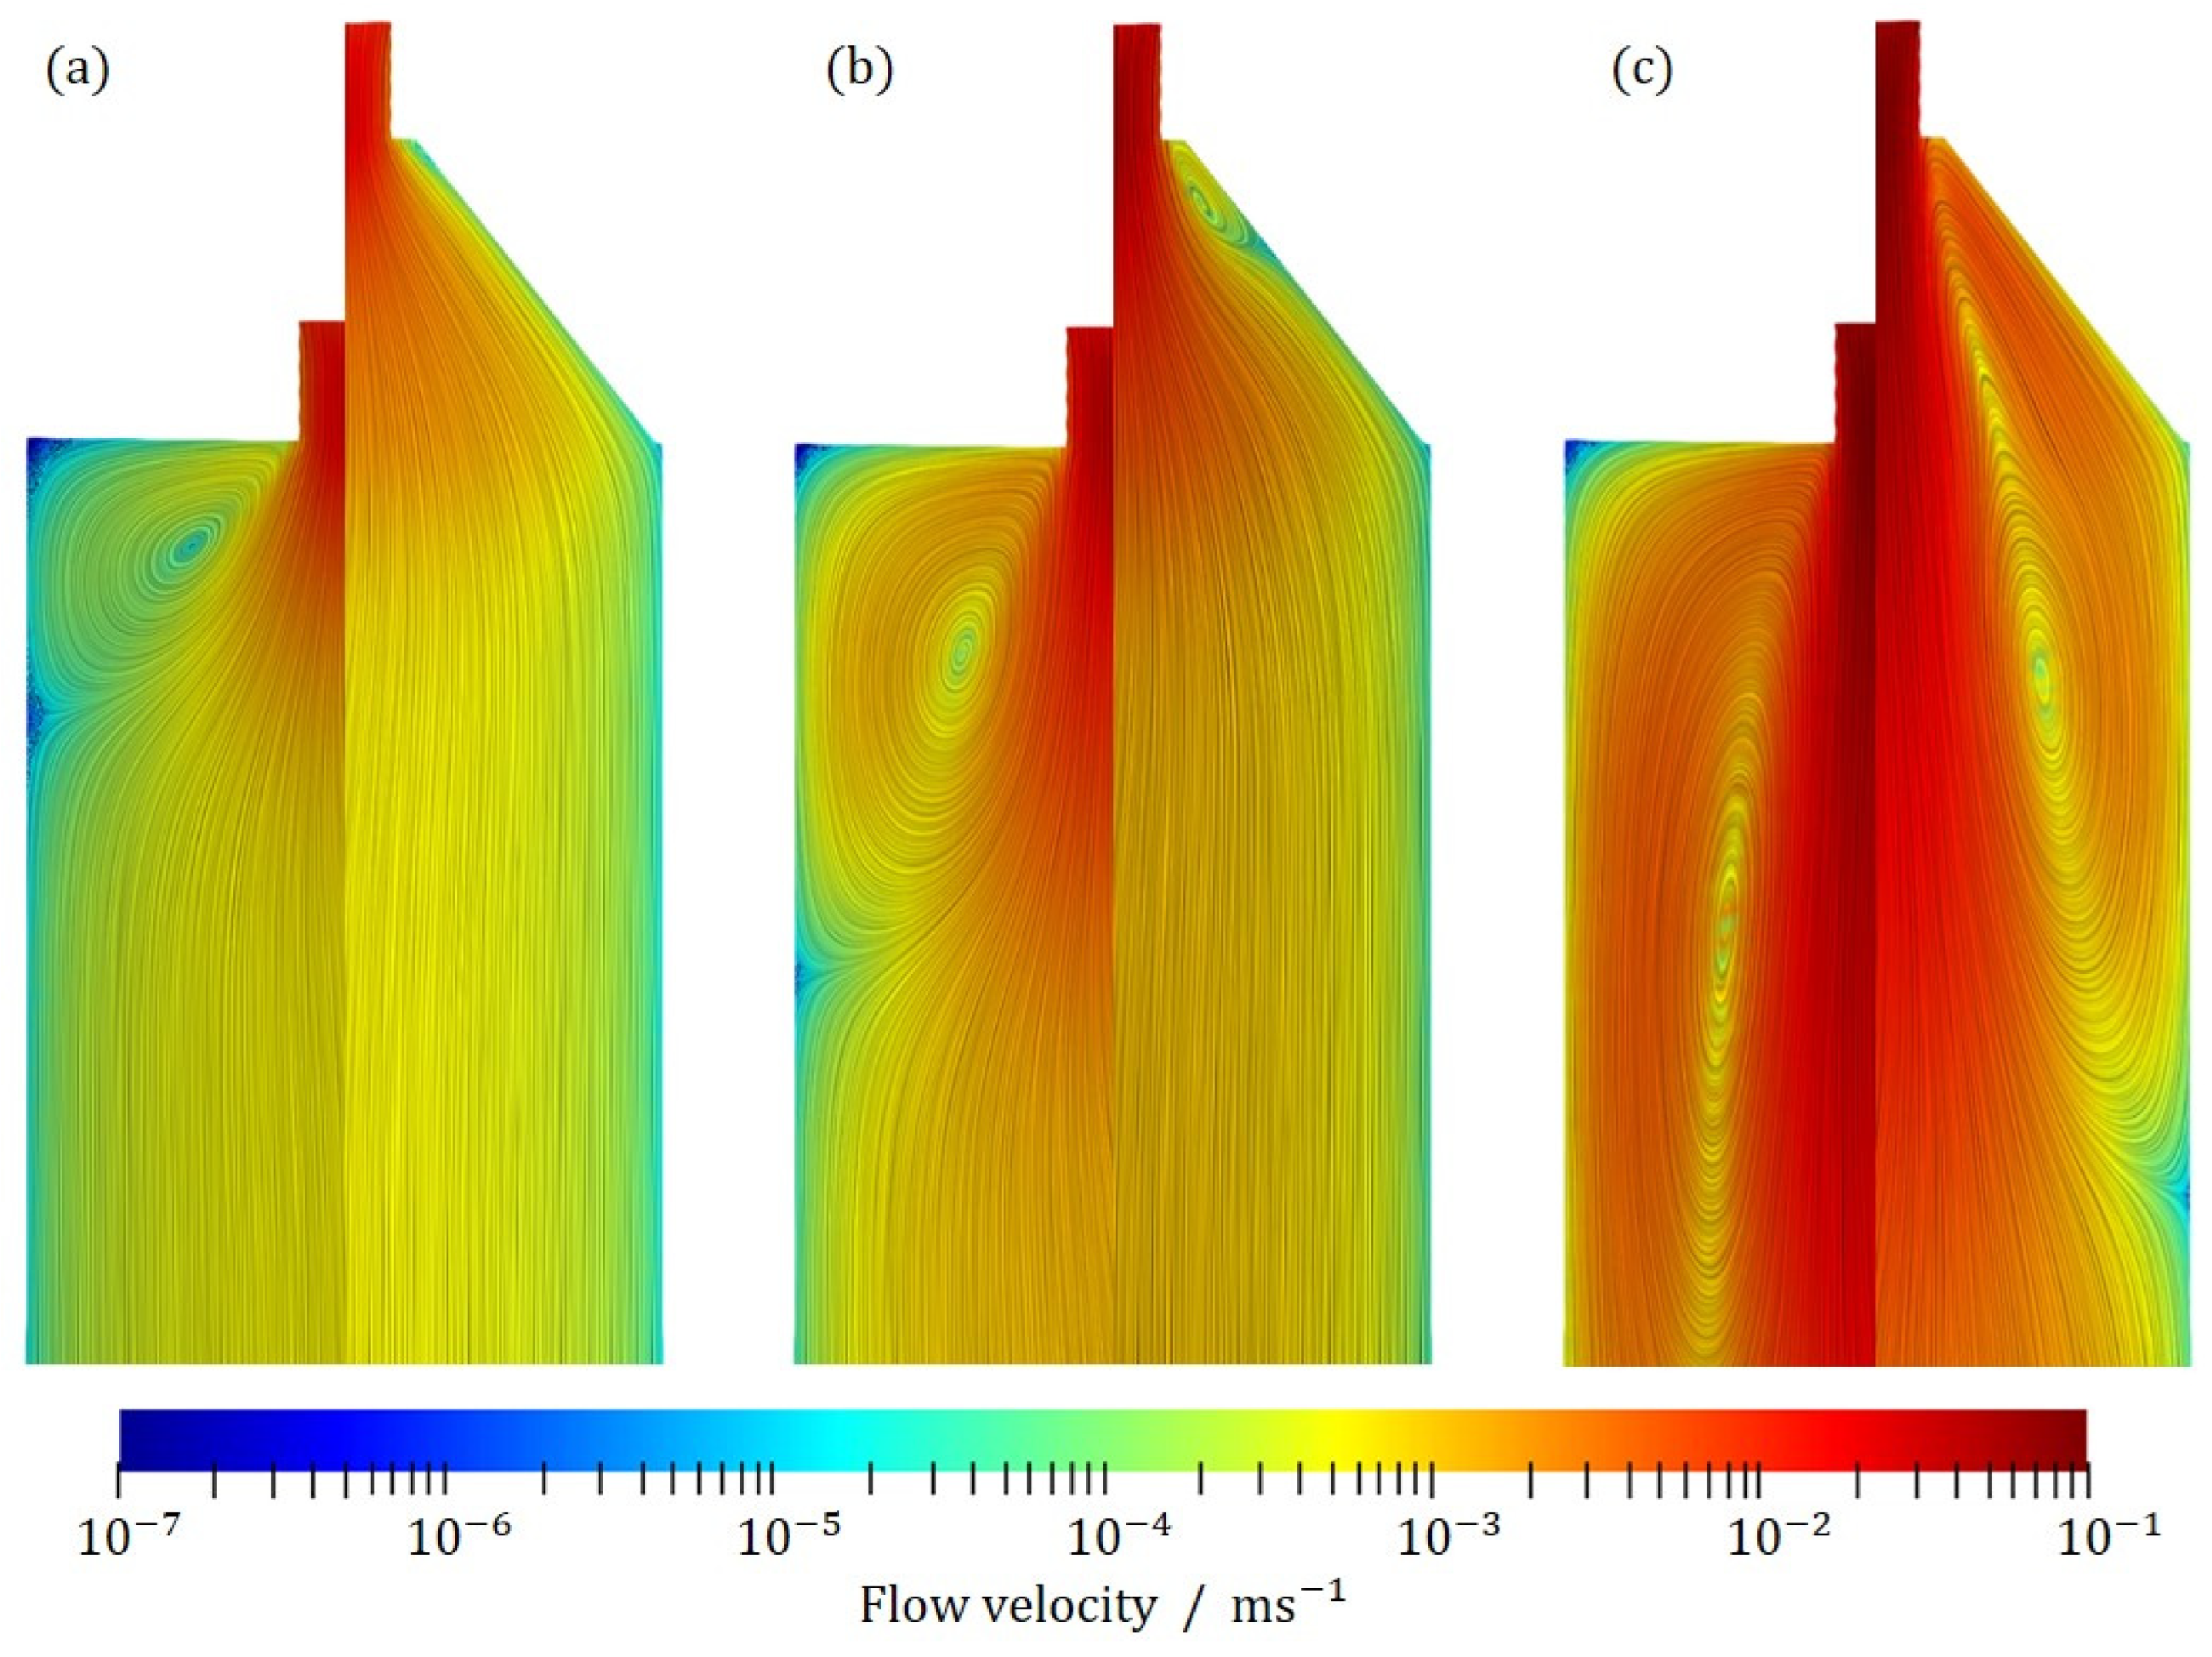
Figure 4 shows exemplary the inlet zone for three different inlet velocities, R e = 10 , 25 and 60 . In each case, the abrupt transition between the inlet pipe and the flotation tank is shown on the left, while a continuous expansion of the cross-section with an angle of 45° is shown on the right. For better visibility, a logarithmic representation of the speed was chosen. In addition, the streamlines are shown.
As expected, an abrupt transition causes an immediate separation of the flow as it enters the flotation tank. A backflow occurs, which may be recognized by the vortex formed by the streamlines. The continuous expansion of the inlet pipe allows a uniform flow through the entire cross-section of the flotation tank. At a Reynolds number of R e = 25 , it may be seen that flow separation occurs immediately at the inlet, where a small step exists. Due to the length of the inlet area, however, the flow stabilizes, so that no backflow occurs in the flotation tank itself and the flow through the tank is uniform. At higher Reynolds numbers, the flow is completely detached and a reverse flow is formed, just as in the case of the abrupt transition. In summary, it may be said that up to a Reynolds number of 25, the flow through the cross-section flotation cell is uniform. At higher values, flow separation and the formation of vortices and dead zones may occur. Thus, a uniform inflow is guaranteed approximately up to Re = 25.
For verification, the final geometry was simulated and compared with experiments. For this purpose, the bottom phase was dyed with red food coloring. 
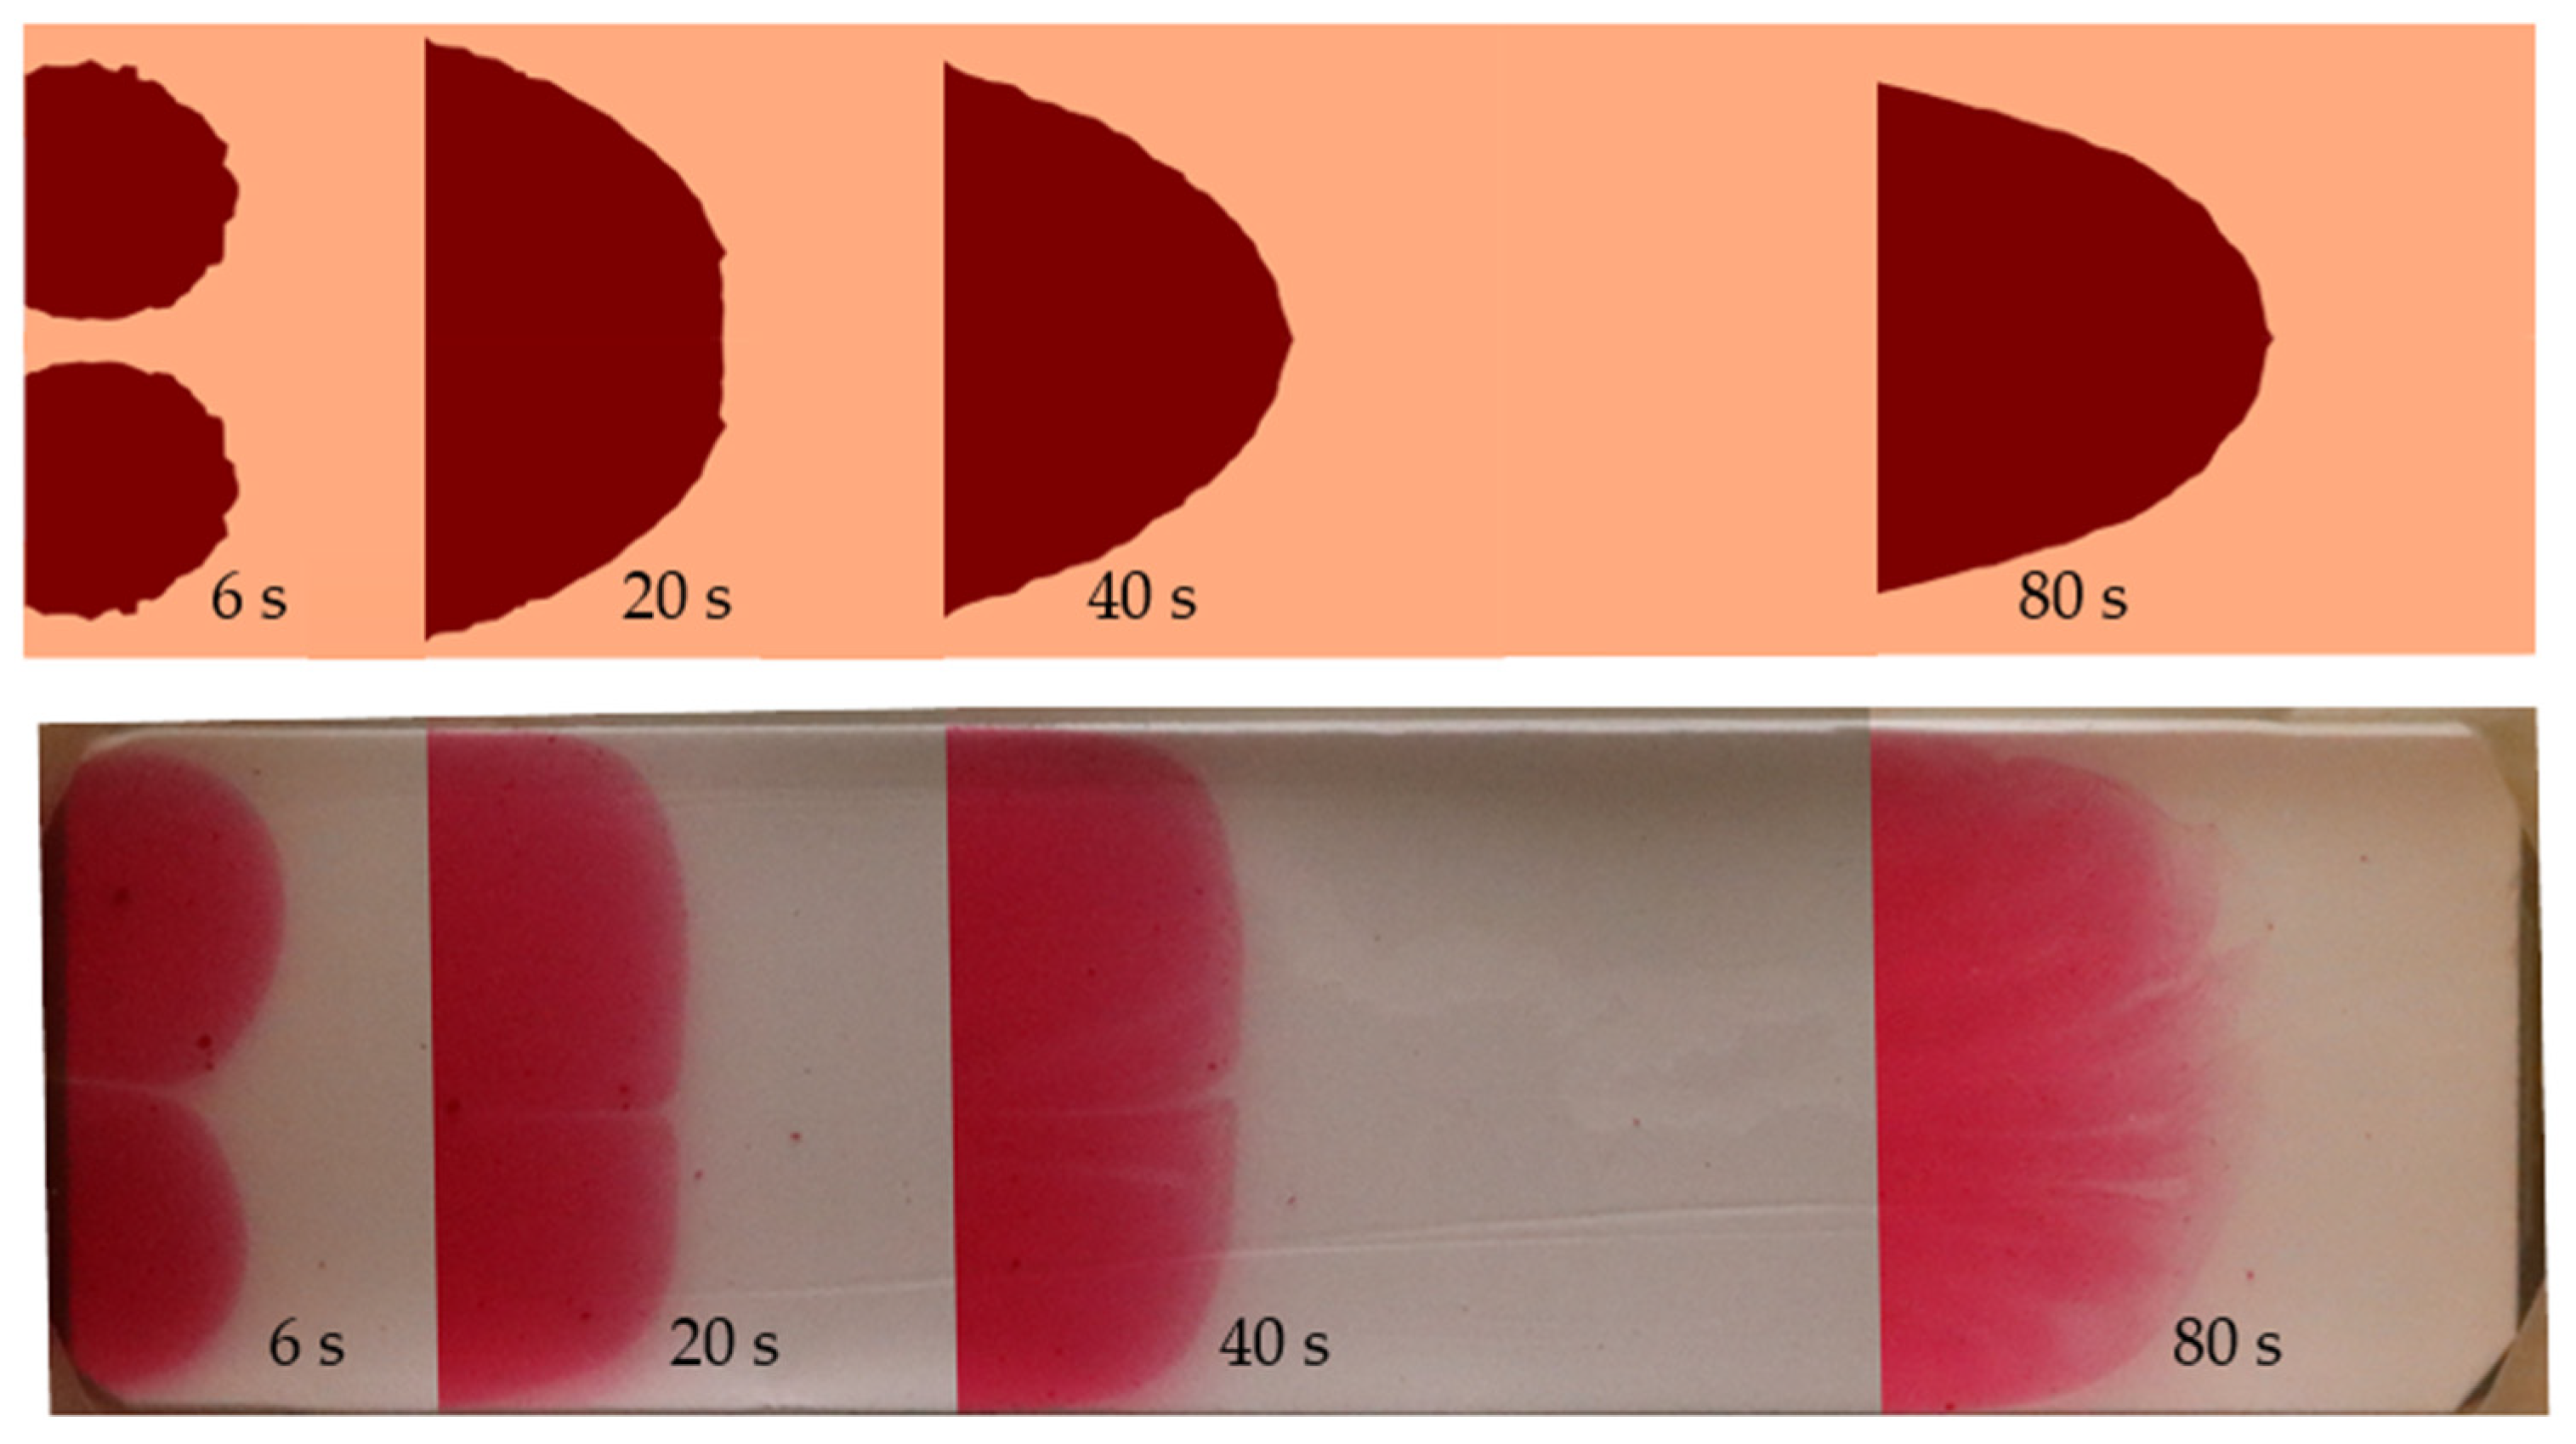
Figure 5 shows the temporal progress of the red colored bottom phase in the simulation (top) and in the experiment (bottom) for the time points 6, 20 and 40 s as well as 80 s at a flow rate of 16 mL/min. Both the simulation and the experiment show the uniform flow of the bottom phase into the flotation tank. At the beginning, the flow pattern indicates the two inlets (6s). After some time, the two inlet flows merge into one uniform flow over the entire width of the flotation tank. In the experiment, the flow through the tank lasts 100 s, in the simulation 106 s. The simulations indicate a steeper parabolic flow profile, while the experiment shows an almost uniform flow front. The different flow profiles may possibly be explained by diffusion, which may have an influence at low flow velocities occurring close to the wall due to the no-slip boundary condition (0 m/s). Experimental data for the diffusion coefficient was not available. In the simulation, the diffusion coefficient was estimated with 10−9 m2/s. Apparently, the simulation reproduces the experiment well. For the ATPF process the uniform over the cross-section of the flotation cell guarantees, that the enriched bottom phase comes into contact with gassing area and hence that the enzyme molecules can attach to the gas bubbles.

4.3. Characterization of the Phase Mixing Effect by Measuring the Electrical Conductivity

To characterize the phase mixing effect induced by gas input by measuring the electrical conductivity in the bottom phase, calibration is needed. 
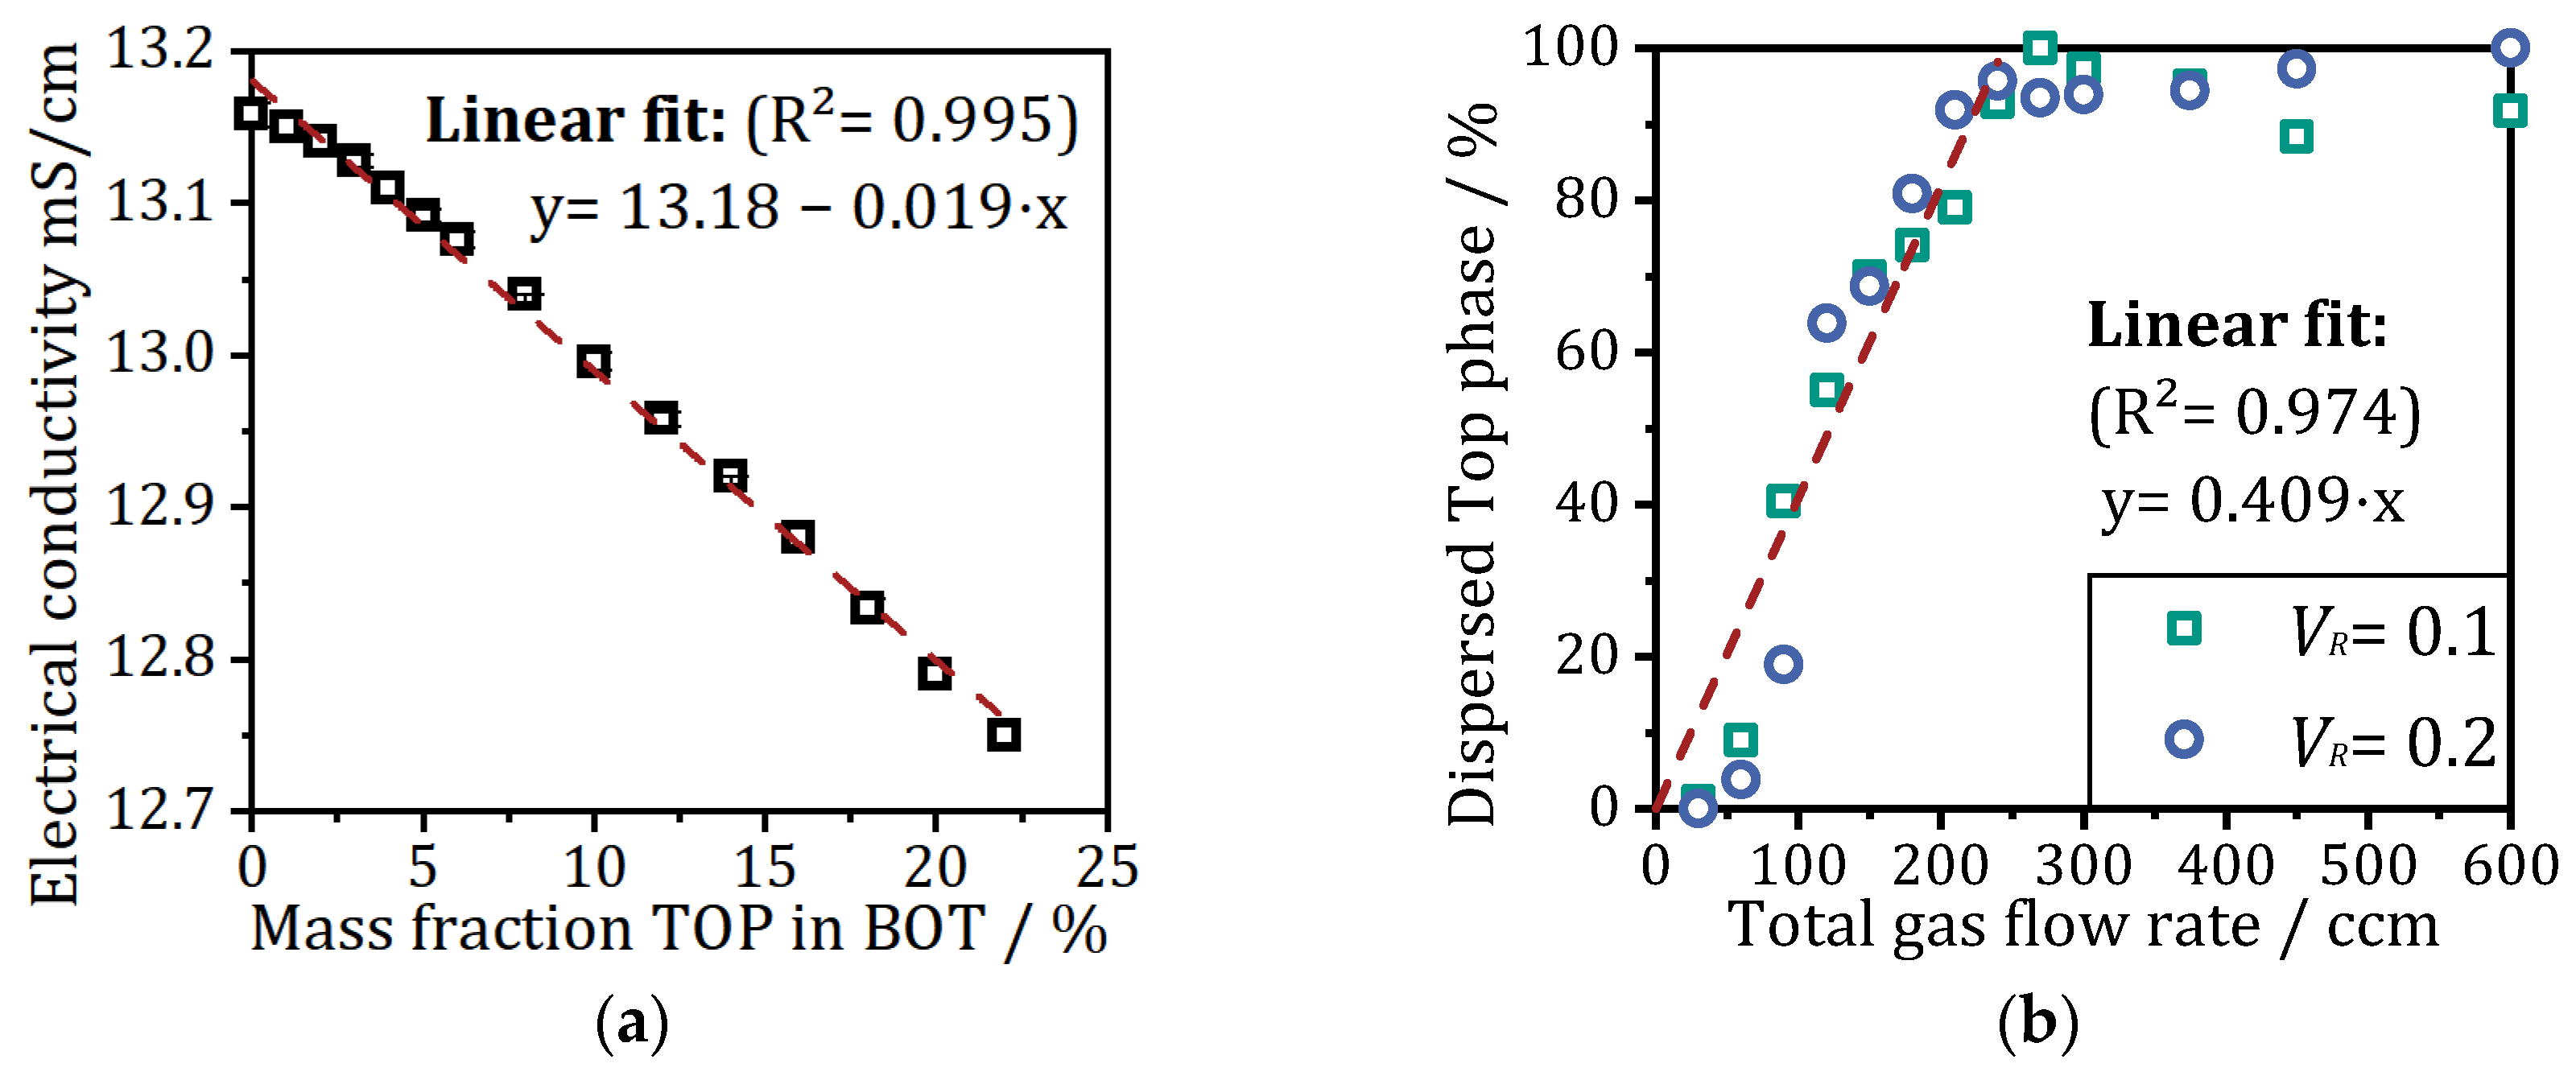
Figure 6a shows the electrical conductivity as a function of the mass fraction of the top phase dispersed in the bottom phase obtained from mixing both phases inside a laboratory beaker. In pure bottom phase a high conductivity of about 13.16 mS/cm is measured. With increasing amount of top phase dispersed, the conductivity decreases linearly down to 12.78 mS/cm at 20% (w/w). Since the phase-forming components (citrate and PEG1000) are distributed differently within the two-phase system, the electrical conductivity of the salt-rich bottom phase is very high due to the dissolved ions. The measured values can be classified with the comparison to sea water where the electrical conductivity ranges between 21–63 mS/cm and fresh water in the µS/cm range [29]. When the polymer-rich top phase gets dispersed in the bottom phase, the polymer molecules inhibit the movement of ions and thus reduce the conductivity. Due to the density difference between the top and bottom phases, a mass fraction of about 11% corresponds to 100% dispersed top phase in ATPF when a volume ratio (VR) of 0.1 is used and 22% when VR is 0.2. The linear dependency can be used to calculate the amount of dispersed top phase caused by the rising bubbles during ATPF experiments with integrated conductivity measurements inside the flotation tank.
Figure 6b shows the correlation between the total gas flow rates (all three gassing units with uniform flow rates) and the percentage of dispersed top phase for two different volume ratios of 0.1 and 0.2. For total gas flow rates lower than 60 ccm, less than 10% of the top phase is dispersed. Doubling the flow rates to 120 ccm total gas flow rate increases the amount to more than 55%. At 240 ccm total gas flow rate, more than 90% of the top phase is dispersed. Up to this point, a linear trend of the gassing rate and phase mixing effect can be observed independent of the volume ratio used. Higher flow rates lead to unpredictable high phase mixing effects with about 90–100% dispersed top phase. As described in previous work [22], rising bubbles can lead to phase mixing effects as they rise from the bottom to the top phase. Crucial to this effect is the bubble size, with larger bubbles causing more microswirls and thus leading to higher dispersion of the top phase. In the previously noted study, it was also observed that an increase in gas flow rate increased not only the number but also the size of the gas bubbles. Therefore, when setting a higher flow rate at all three gassing units, the stress on the aqueous phase boundary between the bottom and top phases increases.
For the ATPF process the phase mixing effect caused by to high gassing rates is crucial. On the one hand, the mixing of the unloaded top and enriched bottom phases near the inlet of the flotation tank increases the contact area and thus the diffusion of the enzyme from bottom into the top phase; on the other hand, near the outlet, it leads to back-diffusion from the loaded top phase into the cleaned bottom phase. In addition to avoiding the undesirable back-diffusion, strong phase mixing near the outlet must also be prevented, so that no mixed phases exit. If there is almost no phase separation, as observed at total flow rates higher than 240 ccm (see Figure 6b), no enzyme-laden top phase can be collected. To ensure high separation and concentration of enzymes, minimal phase mixing should be ensured at the outlet.
The total gas flow rate is the sum of the individual flow rates of the three gassing units. Since the phase mixing effect is most important to consider close the outlet, lower flow rates should be set at gassing unit 3, and gassing units 2 and 1 can achieve equal or higher flow rates. 
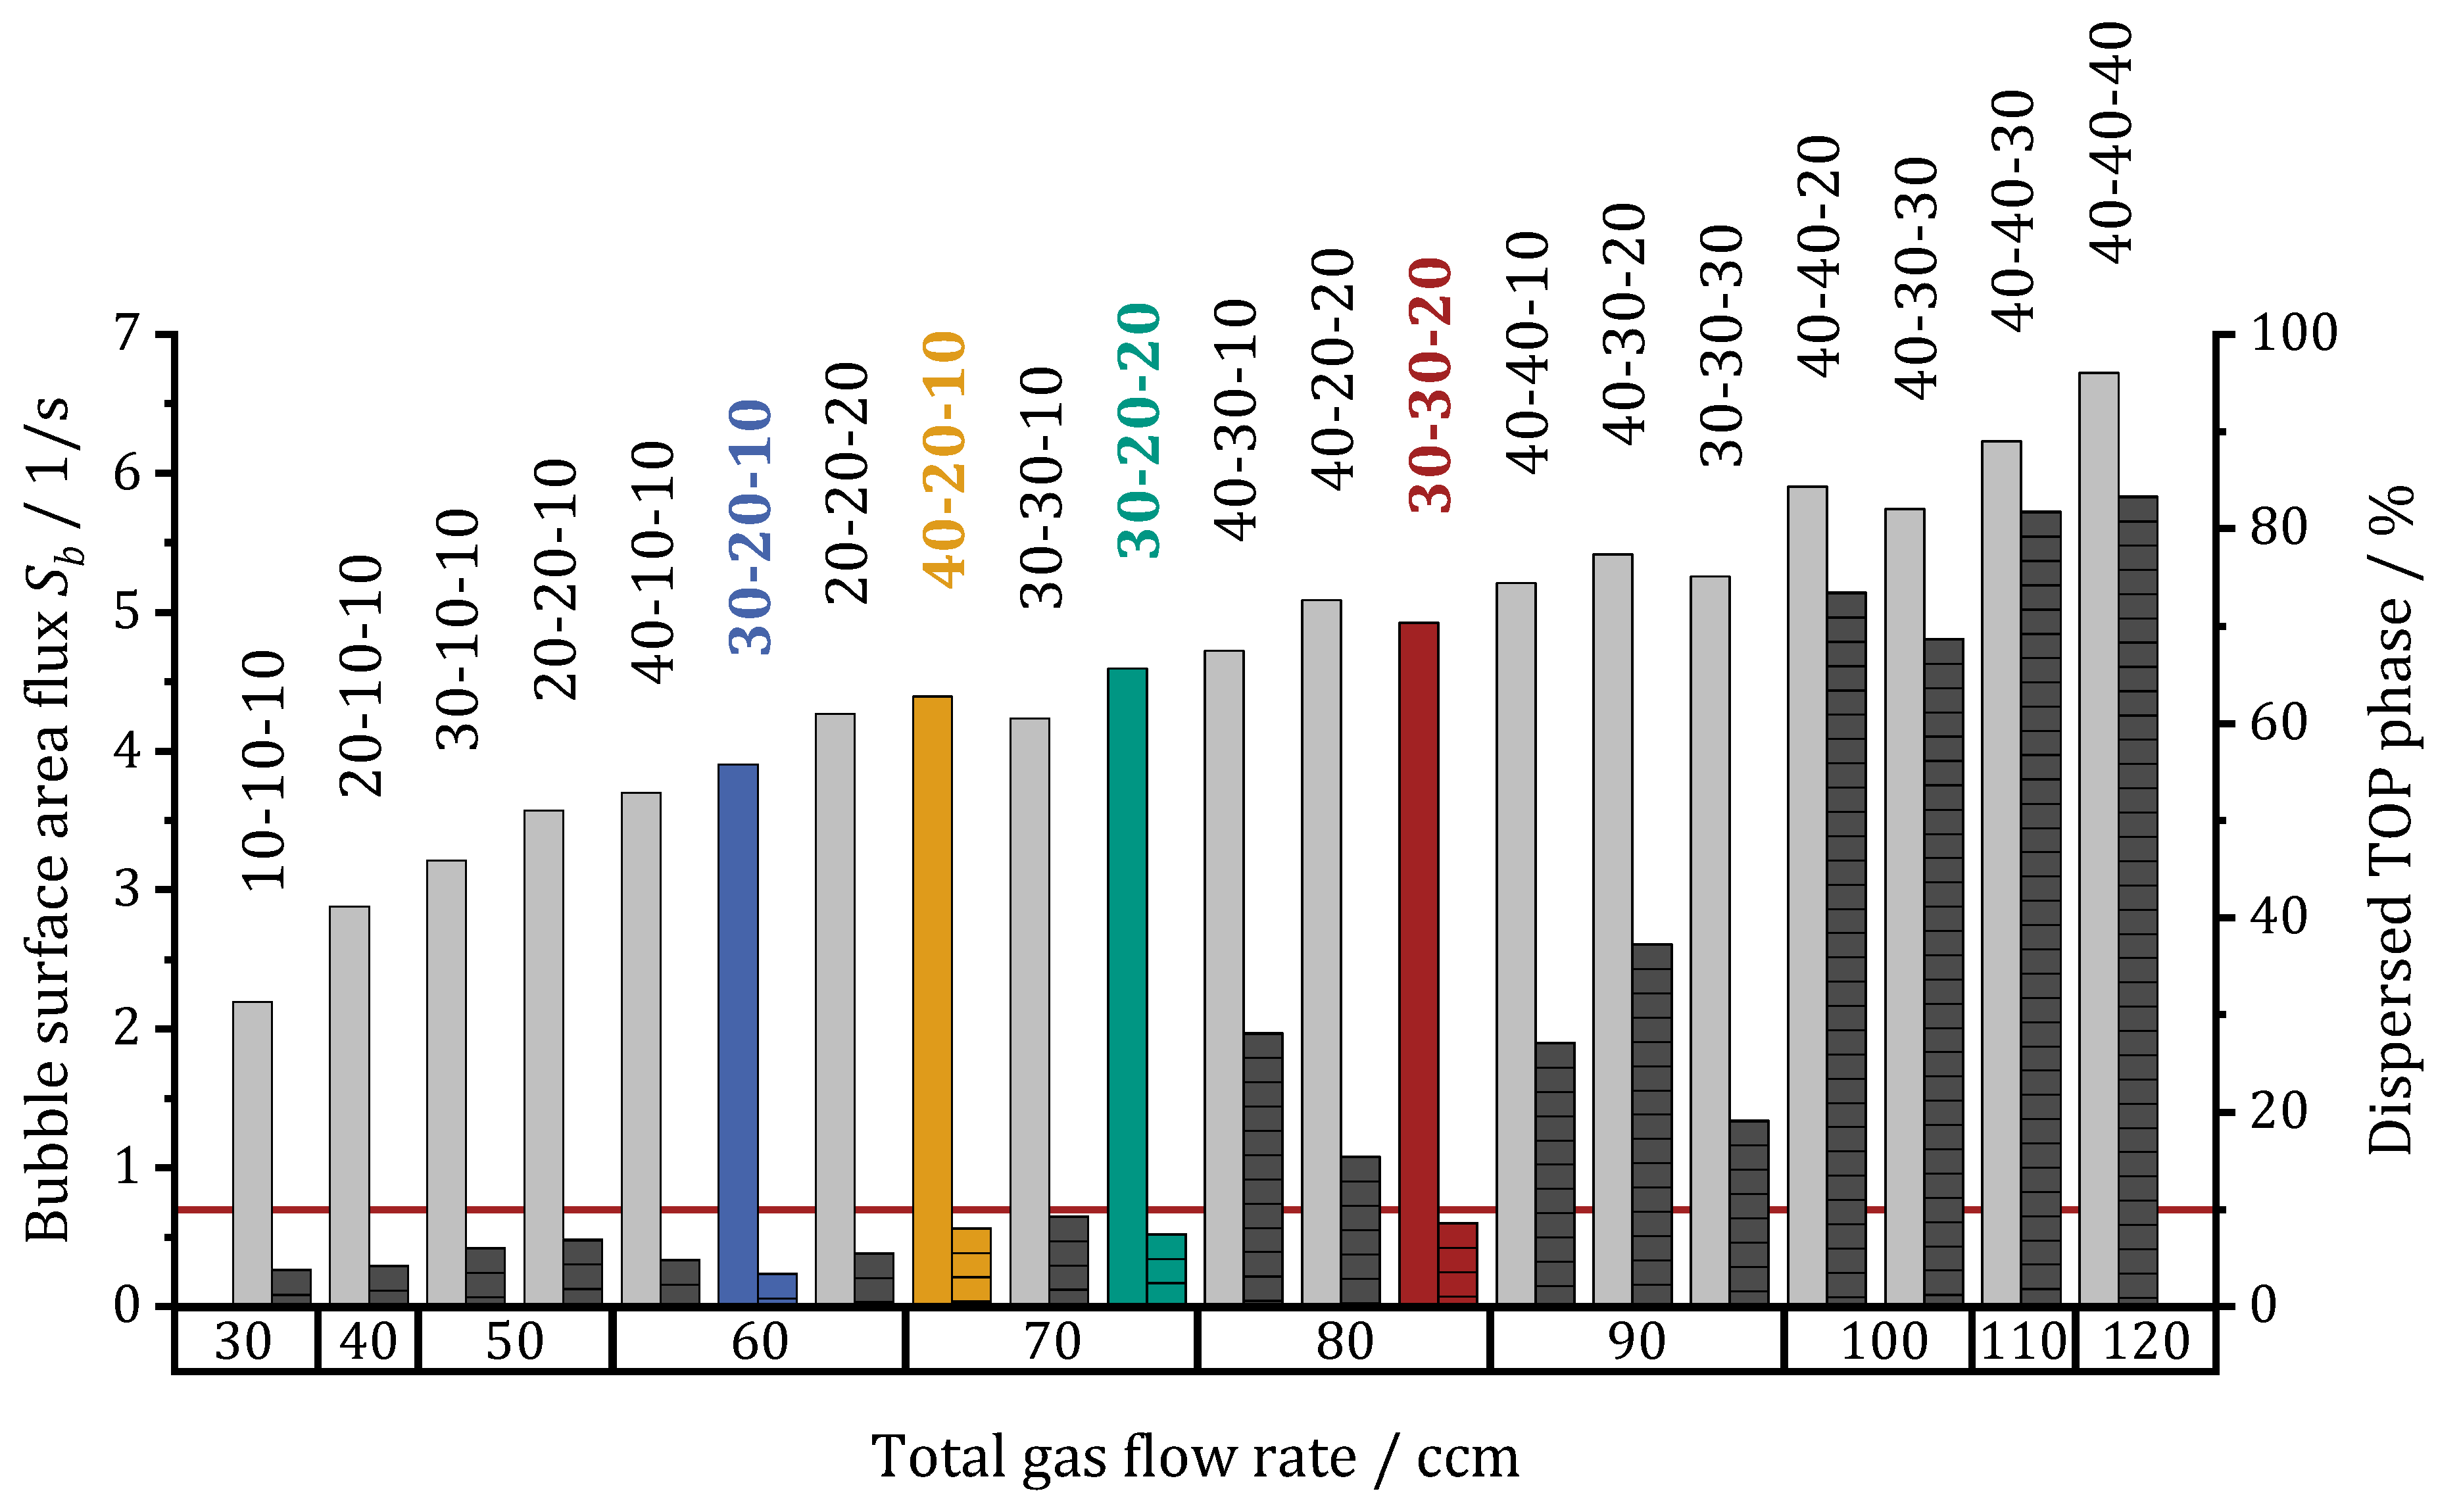
Figure 7 shows the effect of different gassing combinations on the percentage of dispersed top phase (shaded, dark bars) and the bubble surface area flux (left, gray bars). The latter was calculated according to [22] considering a changing mean Sauter diameter for different gas flow rates. The individual flow rates are written above the bars (FIC1–FIC2–FIC3) and sum up to the total gas flow rate (x-axis labels). The colored bars indicate the flow rate combinations chosen for flotation experiments described later, and the red horizontal line marks 10% dispersed top phase.
Overall, the bubble surface area flux increases at higher total gas flow rates. For one total gas flow rate, the Sb value can vary for different combinations of the individual flow rates, as can be seen for the total gas flow rate of 70 ccm. Here, the highest Sb value is about 4.6 (1/s) and results for the 30-20-20 ccm combination. At 30 ccm total gas flow rate, the Sb value is about 2.2 (1/s), while tripling the total gas flow rate up to 90 ccm increases the Sb value non-linearly up to a maximum of 5.4 (1/s). This is due to the larger bubble diameter caused by higher individual flow rates [22]. Nevertheless, the individual flow rates dominate the increased bubble sizes when considering Sb. Looking at the amount of dispersed top phase, there is no general trend up to a total gas flow rate of 70 ccm. Further increasing of the total gas flow rates leads to higher amounts of dispersed top phase. At 80 ccm only one combination (30-30-20) does not exceed 10% (red horizontal line). At 100 ccm total gas flow rate or more, most of the top phase is dispersed. With respect to the 10% as the maximum amount of accepted top phase dispersion, the various combinations at 70 and 80 ccm are of major interest, as here some gassing combinations result in higher and some in lower percentages. At 30-20-20 ccm, the amount of top phase dispersed is lowest, while Sb is highest in this group. Increasing the gas flow rate in gassing unit 1 and decreasing it in unit 3 leads to similar values for the 40-20-10 ccm combination, while increasing it in unit 2 and decreasing it in unit 3 causes a higher dispersion amount and a lower Sb value. The 30-30-20 ccm combination (80 ccm total gas flow rate) shows highest Sb for all combination avoiding more than 10% dispersed top phase. High individual flow rates of 40 ccm lead to a strong phase mixing effect. When all three gassing units aerate at this setting, most of the top phase is dispersed, as Figure 6b already suggested. Low individual flow rates of 10 ccm result in only small amounts of dispersed top phase, but also in a small Sb value when set the same for all three gassing units.
An efficient ATPF process requires both, low phase mixing at the end of the flotation tank and a high Sb value for fast mass transfer of the enzymes into the top phase. Since many combinations of individual flow rates are possible, four combinations were selected for comparison in ATPF-experiments: The 30-30-20 ccm combination (red) shows the highest Sb value targeting the selected limit of 10% dispersed top phase. The second and third highest values are obtained from the combinations 30-20-20 ccm (green) and 30-20-10 (yellow). The 30-20-10 ccm combination (blue) leads to a minimal phase mixing and deviates only in the third or first gassing unit, compared to the two combinations chosen at 70 ccm total gas flow rate.

4.4. Effect of Gas Input and Phase Mixing Effect on Continuous ATPF

To characterize the effects of gas input and phase mixing on continuous ATPF, flotation experiments were performed using the four previously selected gassing combinations and the phospholipase model enzyme. The separation efficiency (E) describes the amount of enzyme molecules separated from the bottom phase and concentrated in the top phase.
Figure 8a shows the separation efficiency during flotation time for different gassing combinations. During the first 60 min, complete recirculation of the bottom and top phase is applied. After that, a continuous operation with complete discharge of the phases starts. At the beginning of the ATPF experiments, all curves of the separation efficiency show a steep increase, with the curve of the 30-20-10 ccm combination (blue circles) showing the flattest increase compared to the others. After 15 min of flotation, the slope of the separation efficiency curve slowly decreases and reaches a constant level after 30 min (E ≈ 60%). The fastest mass transfer occurs during gassing with the 30-20-20 ccm combination, resulting in a steep increase up to 10 min flotation time, followed by a short period of converging to a separation efficiency of about 70%, which is reached after 15 min and remains constant during the next 45 min of ATPF with recirculation of the phases. The other two gassing combinations range between the two mentioned above. While they have similar slopes in the beginning, the curves flatten out differently. The curve of the 30-30-20 ccm combination (red triangles pointing up) flattens out just above 60%, while that of the 40-20-10 ccm combination (yellow triangles pointing down) levels off above 68%. The rapid separation of the enzymes during aerating with the 30-20-20 ccm combination is caused, on the one hand, by the high bubble surface are flux and, on the other hand, by favorable phase mixing conditions, which led to the highest constant level of the separation efficiency during the recirculation operation.
The fast mass transfer of this gassing combination is also reflected in form of a high flotation rate constant (k), which is shown in Figure 8b. As can be seen, higher bubble surface area fluxes lead to higher flotation rate constants expect for the 30-30-20 ccm combination, where k is only the second highest despite the highest Sb. One reason for this could be that the high aeration of 30 ccm at gassing unit 2 leads to phase mixing causing enhanced back-diffusion effects, which reduce both flotation rate and the maximum separation efficiency. The latter is the result of an equilibrium between the uptake of enzymes in the top phase by flotation and diffusion and the return by back-diffusion [23]. After 60 min of flotation, continuous discharge of the phases begins when the equilibrium state is reached for each ATPF experiment shown. While a slight decrease in the separation efficiency curves can be seen for both the 30-30-20 ccm and 30-20-10 ccm combinations, the 40-20-10 ccm combination leads to a constant level and the 30-20-20 ccm combination shows a small increase in separation efficiency. A decrease during continuous operation occurs when not all enzyme molecules in the enriched bottom phase entering the flotation tank can be transferred to the top phase before passing the apparatus and being removed in the cleaned bottom phase. The small increase during gassing with 30-20-20 ccm supports the previously hypothesized favorable phase mixing conditions, which provide high diffusion into the top phase at the inlet, but reduced back-diffusion near the outlet.
Consequently, the ATPF experiments with different gassing combinations show the influence of the local aeration on overall performance, including a fast separation during recirculation to reach the equilibrium as quickly as possible. In case of the 30-20-20 ccm combination, continuous operation could have been started after 15 min, which is half the time of the 30-20-10 ccm combination. As can be seen, high bubble surface area flux is necessary for efficient operation of the ATPF, but the choice of optimal gassing must take into account the phase mixing that causes both the desired diffusion to the top phase at the inlet and the undesired back-diffusion to the bottom phase close the outlet.
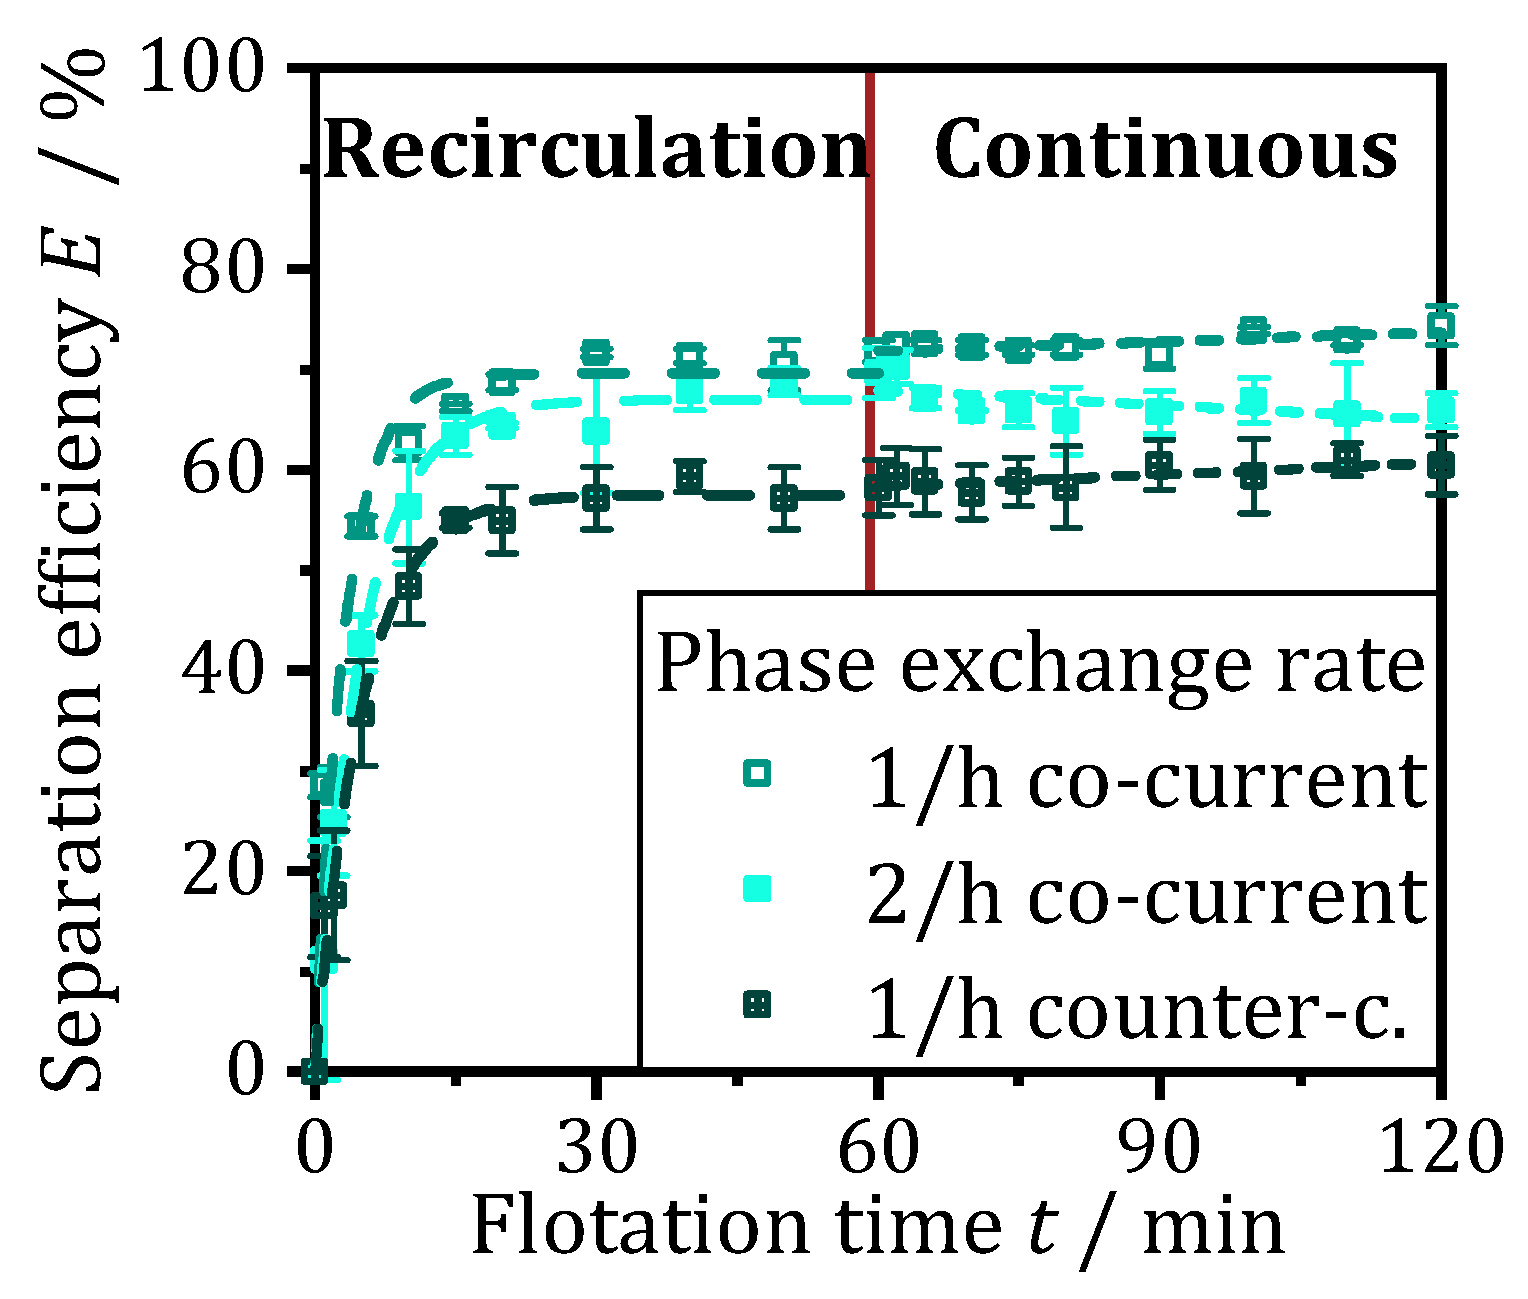
In addition to an ideal gas input, optimal process control is crucial for efficient continuous operation of the ATPF. During the floatation time, as much loaded bottom phase as possible is purified and all enzyme molecules that enter the ATPF apparatus are floated into the top phase. Whether a higher phase throughput is possible while maintaining the separation efficiency constant is shown by an experiment with a higher phase exchange rate with the previously determined preferred gassing combination (30-20-20 ccm).
Figure 9 shows the separation efficiency curve for the gassing combination 30-20-20 ccm and a phase exchange rate of 1/h (already shown in Figure 8a), compared with the curve for an increased throughput with a phase exchange rate of 2/h (filled squares) with the same gassing. During recirculation in the first 60 min of flotation time, the separation efficiency at increased throughput shows a similar trend as at a phase exchange rate of 1/h, but the curve rises slightly less steeply and flattens out earlier at already approx. 68% instead of 70%. However, a greater difference becomes visible during continuous operation. Here, the separation efficiency decreases slightly and amounts to approx. 65% after a total of 120 min flotation time compared to 74% with slower exchange. The phase exchange rate, which is doubled from 1/h to 2/h, reduces the residence time and thus the possibility of an enzyme molecule being transported by a rising gas bubble into the top phase. This results in both a weaker rise of the separation efficiency and a reduction in the equilibrium between the transport into the top phase and back-diffusion. If the phases are no longer recirculated but exchanged continuously, not all the enzyme molecules introduced into the tank can be purified before they are discharged again, and the separation efficiency decreases over time.
The results suggest that an ideal phase exchange rate lies between 1/h and 2/h. However, further experiments to determine this in more detail do not appear useful, as the ideal setting would only be valid for a defined feed. However, in an industrial application, for example in the purification of a fermentation broth from a continuous fermentation, the enzyme concentration in the loaded bottom phase would be subject to fluctuations. These could be countered with online measurement of the enzyme concentration and a suitable control strategy for both, phase throughput and gassing rates. Therefore, it seems more purposeful to validate the hypothesis that phases fed in co-current lead to an increased diffusion into the top phase due to the higher concentration gradient (enriched bottom phase and unloaded top phase) at the inlet of the tank. Conversely, it can be hypothesized that if the bottom phase and top phase are pumped through the tank in a counter-current flow, the undesired back-diffusion at the outlet of the top phase will decrease due to a reduced concentration gradient when enriched bottom phase meets loaded top phase.
The crossed squares in Figure 9 show the course of an ATPF with counter-current flowing phases at an exchange rate of 1/h and the gassing combination 30-20-20 ccm. After a steep increase until 15 min, the separation efficiency flattens out at already 58%. Although an increase in separation efficiency to 60% is observed during continuous operation, the maximum purification is about 14% lower than while the same test in co-current operation. The reduced separation efficiency in both recirculation and continuous discharge indicates reduced diffusion into the top phase, which seems to dominate a reduced back-difussion from the loaded top phase into the enriched bottom phase. The hypothesis to be tested, that co-current pumped phases lead to an increased transfer of the enzymes into the top phase, can thus be confirmed. Therefore, the best results were obtained with a gassing rate of 30-20-20 ccm and a phase exchange rate of 1/h in co-current flow.

5. Conclusions

In the ATPF, the mass transfer of the enzymes from the bottom phase to the top phase occurs by flotation and diffusion. Transport through the rising gas bubbles takes place in one direction only, while diffusion effects can happen both from the bottom to the top phase and in reverse. A high bubble surface area is crucial for the attachment to the gas bubbles. The bubble surface area flux describes the insertion rate of this interface. This can be increased by a suitable gas input, which leads to an increase in the flotation rate constant [22]. Diffusion effects are determined by the aqueous interface between the top or bottom phase. This increases due to phase mixing, induced by a high gas input, or large gas bubbles [22]. In continuous ATPF, both transport mechanisms must be considered. In order to transport as many enzyme molecules as possible quickly into the top phase, it is necessary to adjust the gas input locally to the concentration ratio between top and bottom phase. This is not possible in a vertical flotation cylinder, since enriched and purified bottom phase or unloaded and loaded top phase are not spatially separated [23].
The horizontal flotation tank presented in this work leads to such a spatial separation. The optimized inlet geometry leads to an uniform flow over the cross-section of the tank which guarantees that the enriched bottom phase comes into contact with the three gassing units. Conductivity measurements in the bottom phase allow to characterize the phase mixing due to the turbulence input of the rising gas bubbles. It is shown that it is possible to realize a high gas input near the inlet of the two aqueous phases and to discharge unmixed top and bottom phase thanks to a reduced gas input at the outlet. Of the gassing combinations tested, the 30-20-20 ccm combination results in low phase mixing at the outlet (<10%), high bubble surface area flux (Sb = 4.6 × 1/s), and the highest observed flotation rate constant (k = 31.0 × 10⁻²/min). The consequences are a steep increase of the separation efficiency to about 70% during recirculation of the phases, and a further increase to almost 74% during continuous exchange. At increased throughput (2/h instead of 1/h), however, the separation efficiency decreases slightly in continuous operation. Pumping the phases in co-current is more efficient than in counter-current, since diffusion into the top phase is increased.
Overall, the presented design of the ATPF apparatus is optimal for continuous purification of enzymes. Conductivity measurements allow monitoring of phase mixing, which in combination with online measurement of enzyme concentration would enable control of both, gas input and phase throughput. Further investigations should improve the continuous ATPF process by a suitable control strategy and make it robust against feed fluctuations.

Author Contributions

Conceptualization, L.J.; methodology, L.J. and H.K.B.; validation, L.J., L.G. and H.K.B.; formal analysis, L.J. and H.K.B.; investigation, L.J., L.G. and H.K.B.; resources, H.N.; data curation, L.J., L.G. and H.K.B.; writing—original draft preparation, L.J. and H.K.B.; writing—review and editing, L.J. and H.K.B.; visualization, L.J. and H.K.B.; supervision, H.N.; project administration, H.N.; funding acquisition, H.N. All authors have read and agreed to the published version of the manuscript.

Funding

Parts of this research were accomplished within the IGF project 21007 N, which is funded by the program for the promotion of Industrial Collective Research (IGF) by the Federal Ministry for Economic Affairs and Climate Action (BMWK) based on a resolution by the German Parliament.

Informed Consent Statement

Not applicable.

Data Availability Statement

Not applicable.

Acknowledgments

We acknowledge support by the KIT-Publication Fund of the Karlsruhe Institute of Technology.

Conflicts of Interest

The authors declare no conflict of interest.

References

  1. Bi, P.; Li, D.; Dong, H. A Novel Technique for the Separation and Concentration of Penicillin G from Fermentation Broth: Aqueous Two-Phase Flotation. Sep. Purif. Technol. 2009, 69, 205–209. [Google Scholar] [CrossRef]
  2. Lee, S.Y.; Khoiroh, I.; Ling, T.C.; Show, P.L. Aqueous Two-Phase Flotation for the Recovery of Biomolecules. Sep. Purif. Rev. 2016, 45, 81–92. [Google Scholar] [CrossRef]
  3. Li, M.; Dong, H. The Investigation on the Aqueous Two-Phase Floatation of Lincomycin. Sep. Purif. Technol. 2010, 73, 208–212. [Google Scholar] [CrossRef]
  4. Bi, P.Y.; Chang, L.; Dong, H.R. Separation Behavior of Penicillin in Aqueous Two-Phase Flotation. Fenxi Huaxue/ Chinese J. Anal. Chem. 2011, 39, 425–428. [Google Scholar] [CrossRef]
  5. Bi, P.Y.; Chang, L.; Mu, Y.L.; Liu, J.Y.; Wu, Y.; Geng, X.; Wei, Y. Separation and Concentration of Baicalin from Scutellaria Baicalensis Georgi Extract by Aqueous Two-Phase Flotation. Sep. Purif. Technol. 2013, 116, 454–457. [Google Scholar] [CrossRef]
  6. de Araújo Padilha, C.E.; Dantas, P.V.F.; Júnior, F.C.S.; Júnior, S.D.O.; da Costa Nogueira, C.; de Santana Souza, D.F.; de Oliveira, J.A.; de Macedo, G.R.; dos Santos, E.S. Recovery and Concentration of Ortho-Phenylphenol from Biodesulfurization of 4-Methyl Dibenzothiophene by Aqueous Two-Phase Flotation. Sep. Purif. Technol. 2017, 176, 306–312. [Google Scholar] [CrossRef]
  7. de Araújo Padilha, C.E.; Dantas, P.V.F.; da Costa Nogueira, C.; de Sá Leitão, A.L.; Almeida, H.N.; de Santana Souza, D.F.; de Oliveira, J.A.; de Macedo, G.R.; dos Santos, E.S. Enhancing the Recovery and Concentration of Polyphenols from Camu-Camu (Myrciaria Dubia H.B.K. McVaugh) by Aqueous Two-Phase Flotation and Scale-up Process. Sep. Sci. Technol. 2018, 53, 2126–2135. [Google Scholar] [CrossRef]
  8. Leong, H.Y.; Ooi, C.W.; Law, C.L.; Julkifle, A.L.; Ling, T.C.; Show, P.L. Application of Liquid Biphasic Flotation for Betacyanins Extraction from Peel and Flesh of Hylocereus Polyrhizus and Antioxidant Activity Evaluation. Sep. Purif. Technol. 2018, 201, 156–166. [Google Scholar] [CrossRef]
  9. Khoo, K.S.; Chew, K.W.; Yew, G.Y.; Manickam, S.; Ooi, C.W.; Show, P.L. Integrated Ultrasound-Assisted Liquid Biphasic Flotation for Efficient Extraction of Astaxanthin from Haematococcus Pluvialis. Ultrason. Sonochem. 2020, 67, 105052. [Google Scholar] [CrossRef]
  10. Show, P.L.; Tan, C.P.; Anuar, M.S.; Ariff, A.; Yusof, Y.A.; Chen, S.K.; Ling, T.C. Direct Recovery of Lipase Derived from Burkholderia Cepacia in Recycling Aqueous Two-Phase Flotation. Sep. Purif. Technol. 2011, 80, 577–584. [Google Scholar] [CrossRef]
  11. Tan, J.S.; Abbasiliasi, S.; Lin, Y.K.; Mohamed, M.S.; Kapri, M.R.; Kadkhodaei, S.; Tam, Y.J.; Rahman, R.N.Z.R.A.; Ariff, A.B. Primary Recovery of Thermostable Lipase 42 Derived from Recombinant Escherichia Coli BL21 in Aqueous Two-Phase Flotation. Sep. Purif. Technol. 2014, 133, 328–334. [Google Scholar] [CrossRef]
  12. Pakhale, S.V.; Vetal, M.D.; Rathod, V.K. Separation of Bromelain by Aqueous Two Phase Flotation. Sep. Sci. Technol. 2013, 48, 984–989. [Google Scholar] [CrossRef]
  13. Tan, C.H.; Show, P.L.; Ooi, C.W.; Ng, E.P.; Lan, J.C.W.; Ling, T.C. Novel Lipase Purification Methods—a Review of the Latest Developments. Biotechnol. J. 2015, 10, 31–44. [Google Scholar] [CrossRef]
  14. Lin, Y.K.; Show, P.L.; Yap, Y.J.; Tan, C.P.; Ng, E.P.; Ariff, A.B.; Mohamad Annuar, M.S.B.; Ling, T.C. Direct Recovery of Cyclodextringlycosyltransferase from Bacillus Cereus Using Aqueous Two-Phase Flotation. J. Biosci. Bioeng. 2015, 120, 684–689. [Google Scholar] [CrossRef]
  15. Mathiazakan, P.; Shing, S.Y.; Ying, S.S.; Kek, H.K.; Tang, M.S.Y.; Show, P.L.; Ooi, C.W.; Ling, T.C. Pilot-Scale Aqueous Two-Phase Floatation for Direct Recovery of Lipase Derived from Burkholderia Cepacia Strain ST8. Sep. Purif. Technol. 2016, 171, 206–213. [Google Scholar] [CrossRef]
  16. Phong, W.N.; Show, P.L.; Teh, W.H.; Teh, T.X.; Lim, H.M.Y.; binti Nazri, N.S.; Tan, C.H.; Chang, J.S.; Ling, T.C. Proteins Recovery from Wet Microalgae Using Liquid Biphasic Flotation (LBF). Bioresour. Technol. 2017, 244, 1329–1336. [Google Scholar] [CrossRef] [PubMed]
  17. Sankaran, R.; Show, P.L.; Yap, Y.J.; Tao, Y.; Ling, T.C.; Tomohisa, K. Green Technology of Liquid Biphasic Flotation for Enzyme Recovery Utilizing Recycling Surfactant and Sorbitol. Clean Technol. Environ. Policy 2018, 20, 2001–2012. [Google Scholar] [CrossRef]
  18. Sankaran, R.; Show, P.L.; Cheng, Y.S.; Tao, Y.; Ao, X.; Nguyen, T.D.P.; Van Quyen, D. Integration Process for Protein Extraction from Microalgae Using Liquid Biphasic Electric Flotation (LBEF) System. Mol. Biotechnol. 2018, 60, 749–761. [Google Scholar] [CrossRef]
  19. Sankaran, R.; Show, P.L.; Yap, Y.J.; Lam, H.L.; Ling, T.C.; Pan, G.T.; Yang, T.C.K. Sustainable Approach in Recycling of Phase Components of Large Scale Aqueous Two-Phase Flotation for Lipase Recovery. J. Clean. Prod. 2018, 184, 938–948. [Google Scholar] [CrossRef]
  20. Jiang, B.; Wang, L.; Na, J.; Zhang, X.; Yuan, Y.; Liu, C.; Feng, Z. Environmentally-Friendly Strategy for Separation of α-Lactalbumin from Whey by Aqueous Two Phase Flotation. Arab. J. Chem. 2020, 13, 3391–3402. [Google Scholar] [CrossRef]
  21. Kee, P.E.; Cheah, L.S.; Wan, P.K.; Show, P.L.; Lan, J.C.-W.; Chow, Y.H.; Ng, H.S. Primary Capture of Bacillus Subtilis Xylanase from Crude Feedstock Using Alcohol/Salt Liquid Biphasic Flotation. Biochem. Eng. J. 2021, 165, 107835. [Google Scholar] [CrossRef]
  22. Jakob, L.; Singer, J.; Nirschl, H. Importance of Gas Input in Aqueous Two-Phase Flotation (ATPF). Chem. Eng. Sci. 2021, 233, 116391. [Google Scholar] [CrossRef]
  23. Jakob, L.; Heinzmann, M.; Nirschl, H. Development of a Continuous Aqueous Two-Phase Flotation Process for the Downstream Processing of Biotechnological Products. Sep. Purif. Technol. 2021, 278, 119657. [Google Scholar] [CrossRef]
  24. Mesa, D.; Brito-Parada, P.R. Scale-up in Froth Flotation: A State-of-the-Art Review. Sep. Purif. Technol. 2019, 210, 950–962. [Google Scholar] [CrossRef]
  25. Hirt, C.; Nichols, B. Volume of Fluid (VOF) Method for the Dynamics of Free Boundaries. J. Comput. Phys. 1981, 39, 201–225. [Google Scholar] [CrossRef]
  26. Brackbill, J.; Kothe, D.; Zemach, C. A Continuum Method for Modeling Surface Tension. J. Comput. Phys. 1992, 100, 335–354. [Google Scholar] [CrossRef]
  27. Blasius, H. Grenzschichten in Flussigkeiten Mit Kleiner Reibung. Zeitschrift für Angew. Math. Und Phys. 1908, 56, 1–37. [Google Scholar]
  28. Schlichting, H.; Gersten, K. Boundary-Layer Theory; Springer: Berlin/Heidelberg, Germany, 2017; ISBN 978-3-662-52917-1. [Google Scholar]
  29. Tyler, R.H.; Boyer, T.P.; Minami, T.; Zweng, M.M.; Reagan, J.R. Electrical Conductivity of the Global Ocean. Earth Planets Sp. 2017, 69, 156. [Google Scholar] [CrossRef]
Figure 1. 3D-printed prototype of the continuous ATPF-apparatus.
Separations 10 00511 g001
Figure 2. Different mesh geometries: abrupt expansion of the cross-section (a), continuous expansion of the cross section with a 45° angle (b), final geometry and mesh refinement (c). Furthermore, the final mesh shows the pre-defined phases: the red zone marks the top phase, above is the air-phase, below the bottom phase.
Separations 10 00511 g002
Figure 3. Schematic illustration of the horizontal flotation tank for continuous ATPF.
Separations 10 00511 g003
Figure 4. Inlet area of the flotation tank. Comparison of the flow at abrupt transition and continuous expansion for R e = 10 (a), R e = 25 (b), and R e = 60 (c) related to the pipe flow.
Separations 10 00511 g004
Figure 5. Comparison of simulation (top) and experiment (bottom): temporal flow through the flotation tank. The bottom phase was dyed with red food coloring ( V ˙ = 16   m L / min, view from above).
Separations 10 00511 g005
Figure 6. Characterization of the phase mixing effect by measuring the electrical conductivity: (a) linear decrease of electrical conductivity with increasing mass fraction of top phase mixed into the bottom phase; (b) amount of dispersed top phase during ATPF for two different volume ratios caused by uniform gassing with the three gassing units.
Separations 10 00511 g006
Figure 7. Bubble surface are flux (filled bars) and amount of dispersed top phase (hatched bars) for different gassing combinations in the continuous ATPF-apparatus. The colored bars indicate gassing combinations investigated in flotation tests (see Section 4.4).
Separations 10 00511 g007
Figure 8. Effect of gas input and phase mixing effect on continuous ATPF: (a) Separation efficiency E during flotation time for continuous ATPF with different gassing combinations with 1/h co-current phase exchange; (b) Bubble surface are flux and flotation rate constant for the different tested gassing combinations.
Separations 10 00511 g008
Figure 9. Separation efficiency E during flotation time for continuous ATPF with different phase exchange rates in co-current and counter-current operation with the gassing combination 30-20-20 ccm.
Separations 10 00511 g009
Disclaimer/Publisher’s Note: The statements, opinions and data contained in all publications are solely those of the individual author(s) and contributor(s) and not of MDPI and/or the editor(s). MDPI and/or the editor(s) disclaim responsibility for any injury to people or property resulting from any ideas, methods, instructions or products referred to in the content.

