Abstract
Biogenic residues are a promising feedstock to produce liquid biofuels via chemical looping gasification (CLG), but they form ashes with a high inorganic matter content, thus causing agglomeration and deposition in CLG-fluidized beds made of oxygen carriers (OC). The aim of this work is to develop pretreatments for residual biomasses to prevent this issue. Raw forest pine (as a reference material) and wheat straw residues were considered. The latter were pretreated by torrefaction at 250, 260, or 270 °C and through the washing of torrefied biomasses. Torrefaction encouraged a de-chlorinating effect, while washing allowed the removal of 30–40% of S, 60–70% of K, and 40–50% of P. The analysis of pressure fluctuation signals (standard deviations and dominant frequencies) was utilized to verify the improvement of the performance of treated biomass in fluidized beds: three OCs were, respectively, coupled with ashes from all biomasses, then fluidized from 700 to 1000 °C at two and three times the minimum fluidization velocity. The diagnostic method used to analyze pressure fluctuations was shown to be effective for detecting the incipient fading of bubbling fluidization. This phenomenon was related to the agglomeration or the severe fragmentation of OC particles mixed with ashes, thanks to scanning electron microscopy and particle-size measurements. These characterizations and pressure fluctuations analyses confirmed the general improvement of wheat straw performances after pretreatments.
1. Introduction
The maximum target of a temperature increase of 2 °C above preindustrial levels, proposed by the Paris Agreement [1], is becoming an increasingly urgent issue in the current global scenario [2], requiring the reduction to zero of greenhouse gas (GHG) emissions by the end of this century [1,3]. Five key mitigation options have been proposed in order to achieve this goal, and the use of renewable sources and non-CO2 emissions have the highest shares of these proposals, at 27% and 20%, respectively [4]. The use of biomass brings together these two options, since it is a renewable fuel (i.e., biofuel) and its CO2 emissions can be potentially considered as neutral, owing to the fact that the produced CO2 has previously been removed from the atmosphere in the process of biomass growth. Furthermore, the use of CO2-capture systems coupled with biomass combustion power plants would imply that the generated CO2 would not be emitted. The approach using biomass and carbon-capture systems has been denoted as bio-energy with carbon capture and storage (BECCS) [5]. This allows negative CO2 emissions to be achieved, with an estimated contribution ranging between 2.2 and 12 Gt CO2 of all CO2 sequestrated by CCS (i.e., 4–15 Gt) at the half-way point of the century [6]. Chemical looping technologies are among the most promising BECCS options, since they are considered to bring about the lowest energy and cost penalty for CO2 capture [7]. Among these techniques, the chemical looping gasification (CLG) of biomass has currently aroused great interest in terms of obtaining environmentally friendly liquid biofuels and H2 [8,9].
Nevertheless, issues related to the origins of biomasses should also be taken into account, such as the reduction of forests, the degradation of productive lands, the intensification of energy crop production, and its competition with food and feed [10]. Likewise, the increasing trend in biomass demand will affect procurement prices for the best-quality feedstocks. As a consequence, new feedstocks such as biogenic residues—which do not compete with the food chain—need to be introduced and made competitive in quality and price for proper market uptake [11,12,13]. In this sense, cereal straw is an attractive residual lignocellulosic material for use as fuel for power and heat generation, due to its large availability, which is close to the sum of both forest and non-forest woody residues [14].
The research project CLARA (chemical looping gasification for the sustainable production of biofuels, Horizon 2020 framework program of the EU, G.A. 817841) [15], under which framework this work is produced, suggests that the use of biogenic residues as fuel in CLG should be encouraged. CLARA deals with the CLG of wheat straw to produce liquid fuels via Fischer–Tropsch synthesis and the hydrocracking of resulting waxes. The project aims to develop technologies for a complete residual biomass-to-fuel chain up to the 1 MWth scale in an industrially relevant environment, with a target cold gas efficiency of 82%, carbon conversion of 98%, and level of tar in outlet syngas of lower than 1 mg Sm−3. The project aims to achieve these goals by developing proper operations for biomass pretreatment and syngas cleaning [15].
Currently, CLG technology has been tested at the laboratory scale up to 25 kWth [16]. It combines gasification [17] and chemical looping [18,19,20,21,22] technologies by exploiting a solid oxygen carrier (OC)—a material containing metal oxides working as redox active phase—that brings the oxygen required for the endothermal gasification into the process, avoiding nitrogen dilution from air. CLG technology consists of two interconnected fluidized bed reactors, the fuel and air reactors, with the OC particles circulating between them [15,23]. In the fuel reactor, biomass gasification takes place thanks to steam and/or CO2 supplied as a gasifying and fluidizing agent. Volatile matter and gasification products are partially oxidized to syngas through gas–solid reactions with the OC, which is in a reduced state after having provided oxygen. The reduced OC is transferred to the air reactor, where it is re-oxidized with oxygen from the air, to be made ready for a new cycle inside the fuel reactor [24]. Losses of OC material are expected from either ash purge or fine particles generation owing to chemical and mechanical stresses due to bed circulation in CLG; therefore, the use of low-cost materials such as ores and solid industrial wastes, based essentially on iron and manganese oxides, has been proposed as a common solution for compensating the cost of material reposition [25,26]. In the CLARA project [15], iron- [27,28,29,30] and manganese-based [19] OCs have been considered.
As far as the use of agricultural biogenic residues in CLG-fluidized beds is concerned, one of the main issues is the formation of ashes with high agglomeration and deposition tendencies, because of their important content of inorganic matter [31,32,33]. Agglomeration can significantly increase the average diameter of OC bed particles, changing their fluid dynamic properties and thus affecting their effectiveness in the CLG process [34,35].
In this sense, wheat straw is an even more risky feedstock, because of its high potassium, chlorine, and potassium–aluminum–silicates content. On one hand, species such as alkali metal compounds, phosphorus compounds, and heavy metals have a higher tendency to volatilize, leading to slagging or/and corrosion; on the other hand, potassium–aluminum–silicates in wheat straw make it a more problematic feedstock for the usual gasification temperatures (i.e., 850–950 °C), since these compounds lower the melting temperature of wheat straw ashes [36]—compared with temperatures of quality pine or pine residues—favoring agglomeration phenomena. CLG may be suited for managing fuels with a high content of impurities, such as wheat straw. However, the reducing conditions of the fuel reactor can contribute to interactions between wheat straw and OC particles, by affecting the chemistry of impurities and even driving to issues due to trace elements. Finally, despite CLG flexibility in processing biogenic residues, the low energy density of wheat straw leads to the increase of costs for transport and problems with feeding systems.
For all these reasons, proper pretreatments of biogenic residual feedstock may be needed, in order to limit harmful agglomerative interactions with OCs in fluidized beds and negative effects from trace elements, as well as to increase the energy density of biomass. The aim of the CLARA project is to propose specific pretreatments to improve these qualities in wheat straw residues. Those pretreatments were developed by the National Renewable Energy Centre of Spain (CENER) and are described in this work.
The measurement of pressure in fluidized beds generally allows the evaluation of their fluidization quality [34]. The static pressure measurements are a usual method to monitor operating conditions in industrial fluidized-bed reactors, e.g., the determination of overall bed expansion or the control of elutriated fine particles which return to the bed through the cyclone dip-leg circuit [37]. In addition, the instantaneous pressure fluctuations are strongly related to the intrinsically heterogeneous bubbling state of fluidized beds [34]. For this reason, the detection and analysis of pressure fluctuations is a powerful diagnostic tool in cold-model studies [38,39,40,41], and bench- [42,43] and pilot-scale reactors [44]. It is also scalable up to direct applications in industrial reactors [35,45,46].
Several techniques have been developed so far to analyze signals of dynamic pressure fluctuations, usually classified into three groups: statistical study of pressure time-series (standard deviation) [47], study of dominant frequencies in power spectral density functions (PSDF) [38,39], and attractors comparison (state space analysis applied to the bed chaotic behavior) [40].
The research group of University of L’Aquila (UNIVAQ) has focused for more than twenty-five years on the analysis of dominant frequencies and standard deviations [38,39]; according to their approach, in most cases, the fluidized suspension may be regarded as being in a quasi-stationary state, with the mean values of its physical properties being time-independent over a finite period of time (ergodic signal) [48], so pressure fluctuation signals of finite duration can be studied. For a pressure fluctuation signal from a bubbling fluidized bed:
- The amplitude of pressure fluctuations (i.e., standard deviation of their signal) mainly depends on bed oscillations, which are in turn caused by the eruption of bubbles at the bed upper surface [49] (the larger the bubbles, the higher the standard deviations, with all other properties of the system being equal).
- The dominant frequency of the PSDF, representative of bubbling, is proportional to the number of erupting bubbles [50,51].
These properties of pressure fluctuation signals allow the investigation of the fluctuation quality in bubbling fluidized beds, also in the case of particles agglomeration. Schouten and van den Bleek [45] suggested a method which uses the short-term predictability of local pressure fluctuations to provide a warning signal of incipient agglomeration of the particles, and possible de-fluidization, in high-temperature fluidized bed reactors. Scala [35] reviewed the issue of agglomeration in fluidized beds during the combustion of biomass, due to low melting compounds (typically alkali metals) in this feedstock: at the industrial scale, the “on-line” early detection of particles agglomeration is needed to avoid unscheduled shutdowns. This excludes all methods based on the characterization of biomass ashes, as well as the usual simple monitoring of temperature and pressure at different bed locations, as they both detect significant changes only when de-fluidization has already occurred. In the same review, Scala [35] reports successful applications of agglomeration early detection at the industrial scale, based on the statistical analysis of non-linear time-series of pressure fluctuations (attractor comparison), named early agglomeration recognition system (EARS).
The aim of this study is to apply the analysis of instantaneous pressure fluctuations, both in the frequency and time domains, as a tool to detect de-fluidization phenomena in bubbling fluidized beds made of materials to be used in the CLG of biogenic residues. Pressure fluctuations from these fluidized beds, made of OCs and ashes from biogenic residual biomasses—pretreated or not—were investigated at the lab-scale, as functions of gas flux, temperature, kind of ash, and kind of OC. This work also describes and validates the pretreatments of wheat straw, developed by experimental tests which combined thermal treatment (torrefaction) and washing, to prevent operational issues due to ashes and improve biomass performances in CLG.
2. Materials and Methods
2.1. Production, Pretreatments, and Characterizations of Biomasses
Two biogenic residues were selected for this work, because of their availability and potential for use in Europe and worldwide: wheat straw and raw pine forest residues, both coming from Navarra in the North of Spain. In addition, several batches of wheat straw pellets were pretreated.
Raw and pretreated biomass samples were characterized according to the European reference standards’ specifics for solids biofuels (Table 1). Microwave acid digestion was applied instead of ashing at 550 °C for major elements, prior to the determination by optical emission spectroscopy combined with inductively coupled plasma source (ICP/OES). This option was preferred in order to avoid the volatilization of substances caused by a pretreatment with a muffle furnace. With regard to the study of ash melting behavior, ash samples were produced at 550 °C with a muffle furnace. The same temperature was set to determine ash content, instead of 880 °C.

Table 1.
Reference standard for characterization assays.
Several experimental campaigns on raw biomasses were carried out by the pretreatment unit in the biorefinery and bioenergy center (BIO2C) of CENER (Figure 1). The pretreatment unit gathers several pilot plants, including chipping, chopping, drying, milling, and pelleting, with a productive capacity between 150 and 500 kg h−1. The chopping and chipping units allow decreasing and homogenizing the biomass particles’ size, for either wood-based or fiber-based materials. The drying unit consists of a trommel-type rotary dryer, which decreases the moisture content of biomass. A hammer miller serves as the milling unit: it produces a biomass meal which is suitable as a feedstock in pelleting operation. Finally, the pelleting unit is a 30 kW pellet press, using ring die and rollers. Further information on these pilot plants is given elsewhere [52].
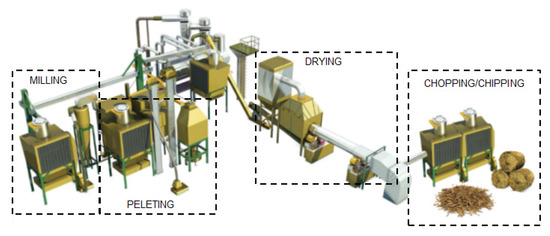
Figure 1.
Scheme of the solid biofuels pretreatment unit at biorefinery and bioenergy centre (BIO2C).
Thermal treatments were applied only to wheat straw, and the related procedures were developed through one experimental campaign, by a lab-scale rotating batch reactor for torrefaction (Figure 2). This reactor was designed and constructed by CENER, under the framework of the CLARA project. It can process up to 10 L of many different materials. It is electrically heated by an independent furnace, which reaches temperatures up to 300 °C. The temperature is measured by three thermocouples located along the reactor.
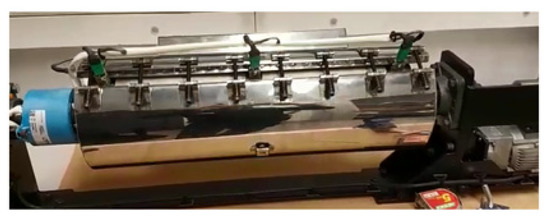
Figure 2.
Torrefaction laboratory rotating batch reactor.
The raw pine forest residues underwent chipping, drying to obtain humidity of ~9.0%, milling, and eventually pelleting.
The raw wheat straw was only chopped before milling and pelleting. Afterwards, different pretreatments were carried out on batches of wheat straw pellets, which consisted of torrefaction or torrefaction followed by washing. Each torrefaction step lasted for 30-40 min while 360 NL h−1 of N2 were continuously fed to avoid the presence of oxygen in the reactor. In order to increase the torrefaction degree, three temperatures were chosen: 250 °C (T1), 260 °C (T2), or 270 °C (T3).
Afterward, the obtained pellets were subjected to the first step of the chemical fractionation procedure [53,54,55,56] and then analyzed to verify the effect of torrefaction degree on the leachability of sulfur, chlorine, and potassium. The potential leachability of inorganic matter is well known for different straws and many other biomasses [57] by the chemical fractionation procedure, but no bibliographic data have been identified yet for torrefied biomasses.
The washing of torrefied samples, about 100 g, consisted of a treatment with de-ionized Milli-Q water for 24 h at room temperature (20 °C), with a solid to liquid ratio of 1:10. The final solid was recovered by filtration and rinsed three times with 100 mL of de-ionized Milli-Q water. Finally, the wet samples were dried overnight at 45 °C, until the moisture became stable.
The obtained samples were named as follows:
- Wheat straw pellets (WSP, i.e., pellets of raw wheat straw)
- Torrefied wheat straw pellets (WSP-T1, WSP-T2, and WSP-T3, i.e., pellets torrefied at 250, 260, or 270 °C).
- Torrefied and then washed wheat straw pellets (WSP-T1W, WSP-T2W, and WSP-T3W, torrefied at 250, 260, and 270 °C).
- Raw pine forest residue pellets (RPR), as a reference material for the comparative study.
2.2. Characterization of Oxygen-Carriers
Three OCs were studied in this work, kindly provided by University of Chalmers (Sweden), a partner of the CLARA project: ilmenite (iron–titanium-based mineral) [58], Sibelco calcined (manganese–iron-based mineral), and LD-slag (iron–manganese–calcium-based material) [59]. From here on, they are respectively named ILM, SIB, LD.
The following physical–chemical properties of these OCs were determined:
- Particle density (), by comparison with granular materials with similar granulometries and known densities.
- Particle size distribution and average particle diameter (), by a Malvern Mastersizer 2000.
- Semi-quantitative elemental composition, by X-ray fluorescence (XRF) carried out with a Spectro Xepos I.
- Morphological-topological aspects, observed by scanning electron microscopy (SEM) with a Zeiss GeminiSEM 500 microscope equipped with energy dispersive X-ray spectrometry (EDS) for elemental analyses (EDS equipment: OXFORD Aztec Energy with a detector INCA X-ACT PELTIER COOLED ADD). Results of EDS analyses are mentioned in the next sections, but only the related SEM micrographs are shown.
2.3. Acqusition and Data Processing of Pressure Fluctuation Signals
Fluidization tests were carried out at UNIVAQ. The signals of dynamic pressure fluctuation were acquired from fluidized beds made of one OC and ashes from one of the available biomasses, at temperatures of interest for CLG, with N2 as the fluidizing medium. All possible OC–ashes couples were tested (three OCs and eight kinds of ash).
For each test, 90 mL of OC particles were mixed with 9 mL of ashes (bulk volumes), so as to: (i) avoid influences from the parameter “bed height” on pressure fluctuation signals [51], and (ii) make the results from different tests comparable to each other. Acquisitions were performed during seven temperature dwells (700, 750, 800, 850, 900, 950, and 1000 °C) while N2 was fluidizing the bed. Two N2 flow rates were set at each temperature, to develop superficial velocities (u) equal to two and three times the minimum fluidization velocity (umf) of the investigated OC, determined as described at the end of this sub-section. Two repeated acquisitions were taken for each u at each temperature, at least. At the end of each temperature dwell, a small sample of the bed was taken for further characterizations.
The test rig (Figure 3) included one fluidized bed quartz reactor (internal diameter of 4.5 cm), fed upward by N2, placed in an electrical furnace, and equipped with a pressure probe submerged in the fluidized bed. That probe was connected to a piezoelectric pressure transducer, which in turn transmitted its signal to an integrated charge-amplifier/digital-converter KISTLER 5165A, interfaced with a PC to store data via the KISTLER Network Setup Wizard. The temperature of the solid inventory was measured independently, by a type-K thermocouple inside the bed, protected by a cylindrical socket made of quartz.
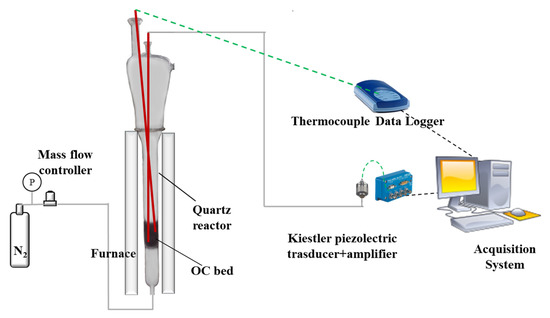
Figure 3.
Scheme of the pressure fluctuations experimental test rig.
Signals were processed by a purposely developed MATLAB® R2020a script, which corrects their drift and calculates standard deviations and PSDF by fast Fourier transform (FFT). The standard deviations of pressure signals were divided by the bed weight per unit of reactor circular cross-section, in order to obtain normalized values and compare results from different tests without fail.
Signals of pressure fluctuation must be made of at least 10,000 points [60], in order to be statistically significant. Thus, considering the requirements of FFT, the number of sampled points per acquisition was set as the equal of 16,384 (214, the first power of 2 higher than 10,000). A sampling frequency of 100 Hz was chosen. It is higher than the typical frequencies of bubbling beds by one order of magnitude, so that requirements of the Nyquist theorem are fulfilled. As a consequence, each acquisition lasted 163.84 s.
Prior to tests:
- Ashes were produced in a muffle furnace: pellets of all biomasses were burnt at 700 °C for 3 h, in such a way that ashes could experience temperatures from 700 to 1000 °C in the presence of OCs for the very first time during fluidization.
- umf of OCs were experimentally determined at the temperatures of pressure fluctuation acquisitions, by fluid-dynamic curves of bed pressure drops vs. superficial velocity [61].
- Experimental values of umf (umf,exp) were compared with: (i) theoretical previsions of umf obtained by Equation (1) (umf,Ergun), which represents the balance of weight, buoyance, and drag forces, with the latter calculated by the Ergun equation (assuming φ = 1 and εmf = 0.4) [34,62], semiempirical previsions of umf obtained by the simplified Ergun equation (Equation (2)) (umf,Grace) [62], assuming the correlation constants C1 = 27.2 and C2 = 0.0408, as suggested by Grace [62,63]. Equations (3) and (4) define the Reynolds number at minimum fluidization conditions () and the Archimedes number (), both dimensionless: N2 density () and dynamic viscosity () were properly evaluated as functions of temperature, and are the OC properties determined experimentally, as described in Section 2.3, and is the gravity acceleration.
3. Results
3.1. Pretreatments of Biomasses
The main effects of the torrefaction temperature are summarized in Table 2, which shows the elemental weight percentage of nitrogen, sulfur, and chlorine in torrefied samples WSP-T1, WSP-T2, and WSP-T3. Table 2 highlights that the higher the torrefaction temperature, the lower the chlorine content. The opposite happened to nitrogen and sulfur, albeit to a lesser extent. This is in agreement with the literature [64], driving to consider the torrefaction as a de-chlorinating unit operation.
Table 2.
Effect of torrefaction temperature on the elemental composition of nitrogen, sulfur, and chlorine, expressed in weight percentage on a dry and ash-free basis, for pellets of raw wheat straw (WSP) and torrefied ones at T1, T2, T3.
Chemical fractionation was operated on the torrefied pellets to determine the content of the most problematic inorganic elements (i.e., sulfur, potassium, and phosphorous). Figure 4 shows the effects of the washing treatment, in terms of leached percentage for these inorganic elements, as a function of the torrefaction temperature. It should be noted that chlorine was not represented, since it was below the detection limit (<0.005 wt% dry and ash-free basis (d.a.f.)). The potassium content was slightly decreased when the torrefaction temperature was increased, and the washing treatment removed 65–70% of potassium from torrefied wheat straw pellets. This range is in agreement with the bibliographic data concerning chemical fractionation [57], since about 40–70% of the potassium in straws is leached with a 24 h treatment in water, at room temperature. A similar behavior was observed for the phosphorous content as a function of the torrefaction temperature, achieving the removal of 45–50% from torrefied wheat straw. These figures do not fully agree with the literature; on the other hand, it should be stressed here that results of phosphorus removal by washing greatly depend on the type of biomass, changing in the literature from 60–70% [57] to 0–4% [56,65]. The values of sulfur removal were in the range 30–40%, but they did not lead to a pattern with the torrefaction temperature. These figures were far from the literature data (about 60–85% reported in References [56,57,65]).
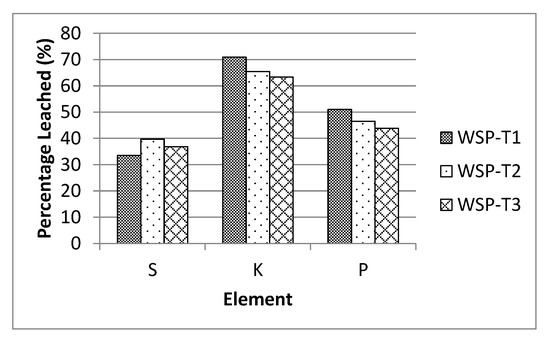
Figure 4.
Inorganic elements leached from torrefied wheat straw pellets by washing.
Ash melting tests (Standard CEN/TS 15370-1) were carried out on all samples deriving from wheat straw. Figure 5 shows values of both initial deformation temperature (IDT) and hemisphere or softening temperature (SOT). IDT is the temperature at which the first signs of fusion occur, and SOT is the temperature at which the sample takes the form of a hemisphere. Notwithstanding the removal of potassium and chlorine by washing, no significant differences were observed between torrefied-washed samples and only torrefied ones. In addition, the wheat straw sample also had similar values to those of torrefied and torrefied-washed series. This means that a clear connection cannot be established between the investigated pretreatments and the ash melting behavior of wheat-based samples.
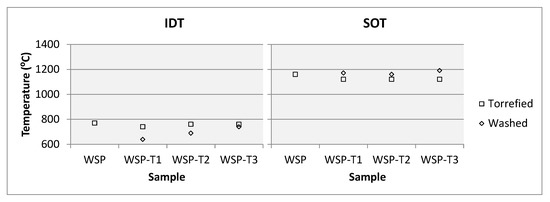
Figure 5.
IDT and SOT for wheat straw samples.
3.2. Preliminary Characterization of OCs
The semi-quantitative elemental composition of the three OCs was measured by XRF (Table 3): the presence of many more elements than the main constituents was attributed to the production of OCs at the industrial scale, and the low content of nickel suggests that these OCs should not promote reforming reactions catalyzed by this element [66,67].
Table 3.
Oxygen carriers (OC): semi-quantitative elemental composition by X-ray fluorescence (XRF) in weight percentage with related absolute error (Abs. Error).
Table 4 summarizes the results from measurements of and of the fresh OCs. These values allowed the determination of generalized Geldart groups [34] to which the three OCs belong at the experimental conditions of pressure fluctuation acquisitions; with N2, at temperatures from 700 to 1000 °C, all fresh OCs belong to Group B (bubbling). Particles which belong to this Group cannot provide homogeneous fluidization, i.e., the minimum fluidization velocity coincides with the bubbling fluidization velocity. From here on, the term “minimum fluidization velocity (umf)” is chosen to define the reference value at which bubbling fluidization begins for the three OCs.
Table 4.
OCs physical properties of fluid-dynamic interest and minimum fluidization velocity as a function of temperature.
The study of umf provided the values in Table 4: a general good agreement between measured and calculated values occurred, and this confirmed the overall reliability of experimental umf values. Those of SIB were systematically higher than their theoretical or semiempirical counterparts. This was attributed to the experimental transition from the fixed bed state to the full bubbling regime: compared to those of ILM and LD, the transition of SIB was found to be much broader. The experimental umf values in Table 4 (umf,exp) were used as a reference to calculate the N2 flow rates to be used in pressure fluctuation acquisitions for the three OCs.
Figure 6, Figure 7 and Figure 8 show SEM micrographs of fresh OCs. In all cases, images qualitatively confirmed the average diameter determined by Malvern Mastersizer 2000 (Table 4). SEM-EDS of fresh ILM found particles made of Fe and Ti, the main constituents of this OC, accompanied by other particles mainly made up of Si, Mg, and Al, also with Ca, Al, Mg, and Na (the analyzed particles are in Figure 6a). SEM-EDS of fresh SIB (Figure 7c,d) identified two main phases in particles: the lighter grains are mainly composed of Fe and Mn, integrated in a darker matrix, which is made up of Si, Al, Ca, and K. SEM-EDS of LD (Figure 8) evidenced a repeatable pattern in the composition of particles: a main matrix based on Si, Ca, and Al, with small included grains, which are made up of Fe and traces of V, Mn, and Ti. The micrographs of fresh LD showed a higher quantity of fine particles at the smallest magnification (Figure 8a) when compared to homologous micrographs of ILM (Figure 6a) and SIB (Figure 7a). In addition, the surface of LD particles appeared dusty in pictures with higher magnifications (Figure 8b–d).
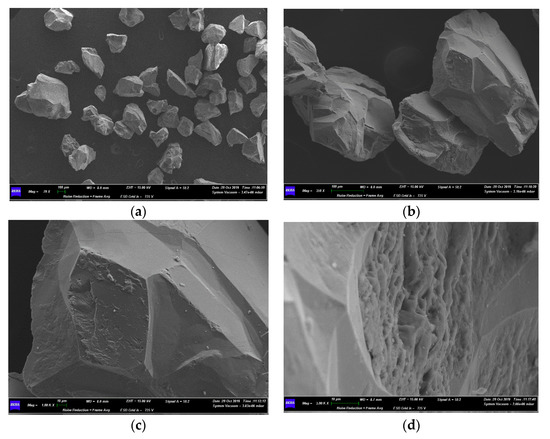
Figure 6.
Scanning electron microscopy (SEM) micrographs of as-received ILM at 79× (a), 350× (b), 1000× (c), and 3000× (d).
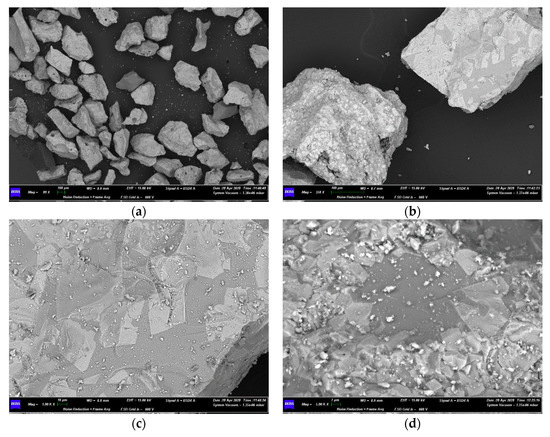
Figure 7.
SEM micrographs of as-received SIB at 80× (a), 350× (b), 1000× (c), and 5000× (d).
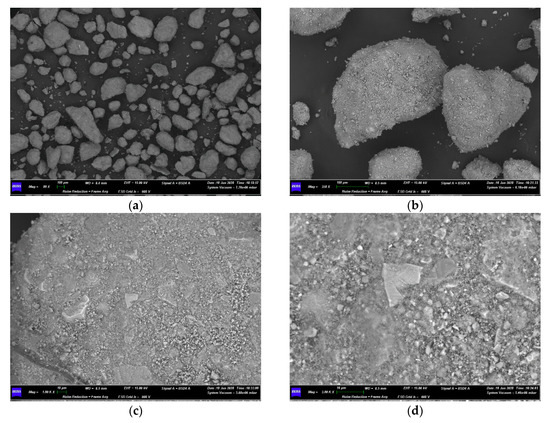
Figure 8.
SEM micrographs of as-received LD at 80× (a), 350× (b), 1000× (c), and 3000× (d).
3.3. Results of Pressure Fluctuations Acquisitions
Figure 9 shows the effects of temperature increase on the quality of bubbling fluidization, in the bed made of ILM and ash from WSP at u = 2umf. This picture serves as an example of the different kinds of pressure fluctuation signals, and related PSDFs, found in this experimental campaign; moreover, it evidences the target phenomenon which the experimental method proposed in this work aims to observe, i.e., changes in fluidization quality.
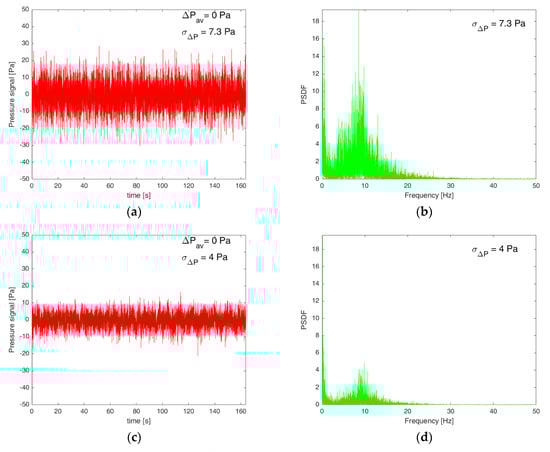
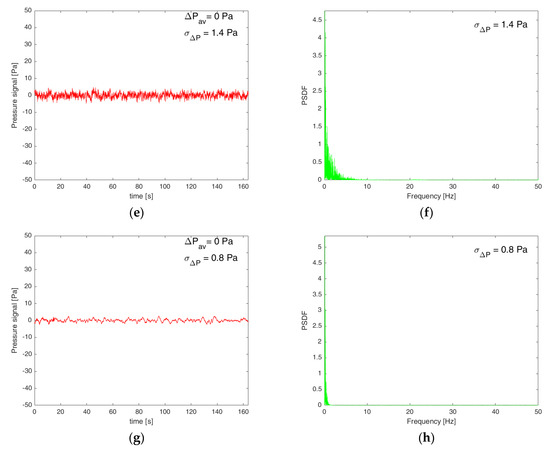
Figure 9.
Pressure fluctuation signals from the fluidized bed made of ILM and ash from WSP with related PSDF (power spectral density functions), at u = 2umf of ilmenite: (a,b) at 750 °C, (c,d) at 850 °C, (e,f) at 900 °C, and (g,h) at 1000 °C.
A signal like the one in Figure 9a (T = 750 °C) corresponds to a fully bubbling bed and the related PSDF in Figure 9b shows a range of dominant frequencies typical of bubbling fluidization (order of magnitude 100–101 Hz [68,69]). Figure 9c,d (T = 850 °C) have the same features of Figure 9a, b respectively, but they have lower standard deviation and PSDF values at around 10 Hz: this reveals a decrease in the bubbles size. Figure 9e (T = 900 °C) describes a barely fluctuating bed: the PSDF (Figure 9f) no longer show the band of locally dominant frequencies centered around 10 Hz, which instead shifted towards lower frequencies and gathered on the limit point of aperiodic phenomena (0 Hz). Figure 9g,h (T = 1000 °C) corresponds to an unfluidized bed, a consequence of the further extremization of trends just described for Figure 9e,f.
It is worth to stress here that these kind of modifications in the bubbling fluidization quality were traced by dominant frequencies of the PSDF (number of bubbles) and standard deviations of their parent signals of pressure fluctuations (dimension of bubbles): the decrease of both these quantities evidenced the disappearing of bubbles. This couple of parameters turned out to be suitable to detect the disappearing of bubbling fluidization (transition from Figure 9a,b to Figure 9g,h).
Figure 10, Figure 11 and Figure 12 graphically summarize these kind of evaluations, performed for the three OCs coupled with all ashes from studied biomasses, at 2umf and 3umf. Figure 10 reports evaluations based on PSDF shape and dominant frequency, in agreement with the just discussed exemplification in Figure 9. Figure 11 and Figure 12 show the experimental values of normalized standard deviations, as functions of temperature. The combined observation of acquired signals and related analyses (standard deviations and PSDF) allowed the determination of a threshold value of the normalized standard deviation, which equals 2.2 × 10⁻³: signals with normalized standard deviations higher than this threshold generally correspond to bubbling fluidized beds (Figure 9a–d). Noticeably, the same normalized value was found for all the OC–ashes combinations. Figure 11 and Figure 12 compare the experimental normalized standard deviations with this threshold.
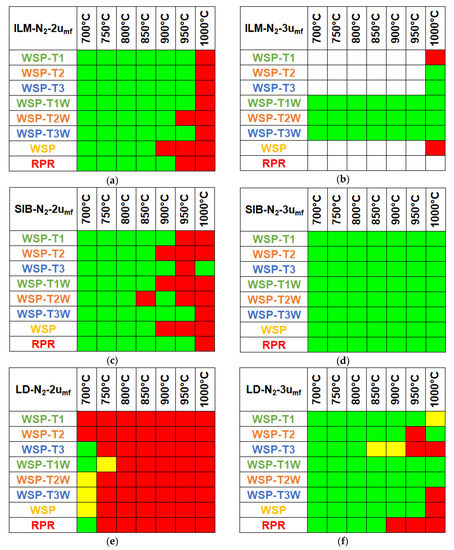
Figure 10.
Evaluation of fluidization quality based on the experimental PSDFs. Legend: green square = bubbling bed (corresponding to the situation described by Figure 9a–d), yellow square = bubbling fluidization fading out (corresponding to the situation described by Figure 9e,f), red square = no bubbling (corresponding to the situation described by Figure 9g,h), and white = not acquired.
Figure 11.
Normalized experimental standard deviations as functions of temperature during fluidization of OCs–ash couples at nominal 2 umf (a,c,e), with respective magnifications (b,d,f).
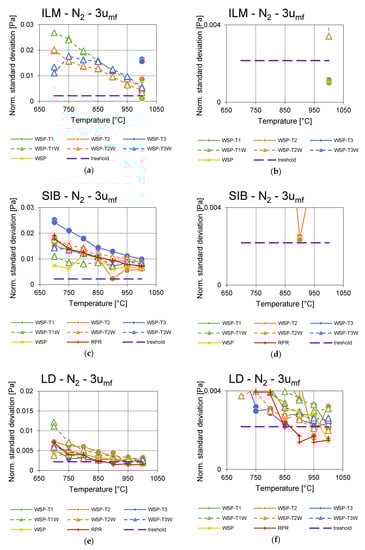
Figure 12.
Normalized experimental standard deviations as functions of temperature during fluidization of OCs–ash couples at nominal 3 umf (a,c,e), with respective magnifications (b,d,f).
As regards ILM at u = 2umf, WSP-T1, WSP-T2, and WSP-T3 performed better than RPR: their PSDFs showed the features of bubbling beds until 950 °C, while RPR resisted until 900 °C (Figure 10a). The corresponding normalized standard deviations were similar to or higher than those of RPR, in the whole explored temperature range (Figure 11a, b). At u = 2umf with ILM, WSP behaved worse than RPR for temperatures above 750 °C (Figure 11a,b). At nominal u = 3umf, only data of washed biomass samples were available on the whole temperature range (Figure 10b and Figure 12a). They generally resulted in trends of acceptable bubbling fluidization quality (Figure 12a,b, normalized standard deviation > 2.2 × 10⁻³), with dominant frequencies in the range 5–10 Hz. This is a good process indication, since it suggests that an increase in superficial velocity can re-fluidize a bed with poorer fluidization quality at lower flow rates (compare Figure 11a,b with Figure 12a,b). With regard to torrefied samples, at u = 3umf, only WSP-T1 did not allow a bubbling fluidization at 1000 °C (Figure 12a,b), as well as WSP.
As for SIB at u = 2umf, all SIB–ash couples had a good fluidization quality until 850 °C, except WSP-T2W (Figure 10c and Figure 11c,d). Most of the SIB–ash couples underwent a worsening of bubbling fluidization quality in the range 850–950 °C (Figure 10c and Figure 11d): this behavior is more likely ascribable to intrinsic properties of this OC, seeing that it occurred with many different ashes. WSP-T3W and RPR ashes, on the contrary, ensured an acceptable quality of bubbling fluidization with SIB up to 950 °C (Figure 10c), respectively equal to and higher than the temperature limits reached with ILM. The differences due to ashes disappeared at u = 3umf, since all SIB–ash couples performed with a good fluidization quality (Figure 10d), with normalized standard deviations sufficiently higher than the 2.2 × 10⁻³ threshold (Figure 12c,d); at this condition, the best performance belonged to SIB with WSP-T3.
Regarding LD at u = 2umf, a general difficulty in obtaining full bubbling fluidization emerged from experiments with all ashes (Figure 10e and Figure 11e,f). At u = 3umf, an overall improvement occurred (Figure 10f), even though the intensities of bubbling fluidization were significantly lower than those of other OCs (Figure 12e,f); in other words, LD developed smaller bubbles than other OCs, all other conditions being equal. With WSP-T1W and WSP-T2W, LD kept dominant frequencies in the representative range of bubbling fluidization from 700 to 1000 °C (Figure 10f), but the associated normalized standard deviations of WSP-T2W became very close to 2.2 × 10⁻³ at 950 and 1000 °C (Figure 12f). LD behaved quite differently from the other OCs, hindering a clear classification, under the normalized standard deviation, of bubbling or non-bubbling beds. The correct diagnosis had to be obtained from a combined observation of normalized standard deviation and PSDF dominant frequency.
3.4. Characterization of Samples after Tests
Figure 13, Figure 14 and Figure 15 show SEM micrographs of some OC samples after fluidization tests. For the sake of clarity and brevity, only WSP and WSP-T3 are considered in these Figures, representative of the main features which were observed by SEM-EDS analyses.
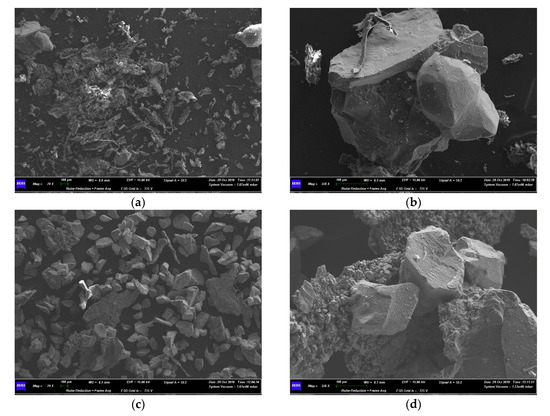
Figure 13.
SEM micrographs of ILM after fluidization tests at 1000 °C: with WSP ash at 79× (a) and 350× (b), and with WSP-T3 ash at 79× (c) and 1000× (d).
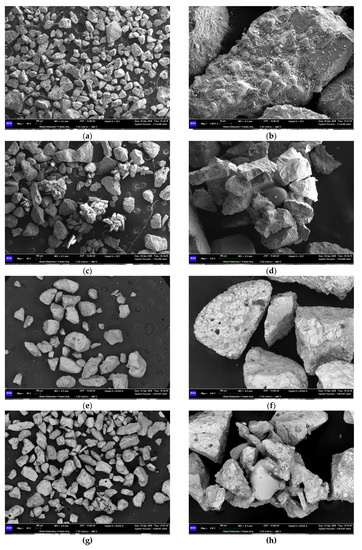
Figure 14.
SEM micrographs of SIB after fluidization steps: with WSP ash after the step at 700 °C at 80× (a) and 1000× (b), with WSP ash after the step at 1000 °C at 80× (c) and 350× (d), with WSP-T3 ash after the step at 700 °C at 80× (e) and 350× (f), and with WSP-T3 ash after the step at 1000 °C at 80× (g) and 1000× (h).
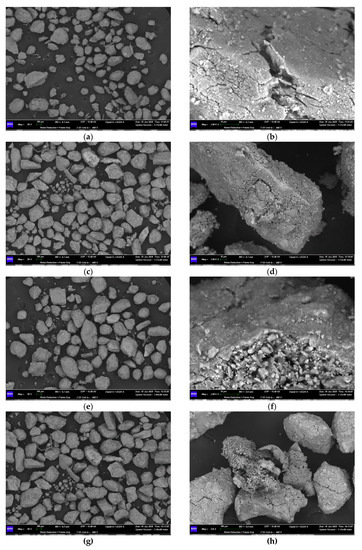
Figure 15.
SEM micrographs of LD after fluidization steps: with WSP ash after the step at 700 °C at 80× (a) and 3000× (b), with WSP ash after the step at 1000 °C at 80× (c) and 1000× (d), with WSP-T3 ash after the step at 700 °C at 80× (e) and 3000× (f), and with WSP-T3 ash after the step at 1000 °C at 80× (g) and 350× (h).
After the 1000 °C fluidization step with WSP ash (Figure 13a), ILM underwent agglomeration around its particles made up of Si, Mg, and Al (see Section 3.2), as evidenced in Figure 13b: the EDS of this agglomerate found that the central darker particle is none other than an ILM particle based on Si, sealed with the upper plaquette and the lighter grain on the right side, which both contain Fe, Ti, Si, Mg, Ca, and K. The presence of K suggests that agglomeration might be due to interactions between ILM and the WSP ash. After the 1000 °C fluidization step with WSP-T3 ash, the original ILM seems to have undergone fragmentation, followed by conglomeration of the fines which had just formed (compare Figure 6a with Figure 13c): the EDS of these agglomerates (an example in Figure 13d) revealed that the granular bridges which keep them together mainly contain Ni, S, and Al, but not Ti. In the light of these findings, the formation of these agglomerates was not related to direct interactions between ILM and ash, but rather to the stainless-steel pressure probe in use during the test. Only that probe could have brought an important amount of Ni in the system; actually, after that test, the pressure probe was slightly corroded only in the part submerged in the ILM bed, empirically confirming that it released the Ni of the agglomerates, thus promoting their formation. This is a remarkable piece of information, so as to choose proper materials at the industrial scale, able to prevent harmful chemical interactions with OC beds. Consequently, after these tests (the fourth out of twenty-four), the steel pressure probe was substituted with a quartz one for the rest of the experimental campaign.
Figure 14 shows samples of SIB mixed with WSP or WSP-T3 ashes, after fluidization steps at 700 and 1000 °C. With WSP ash at 700 °C, agglomeration did not occur (Figure 14a), but a new layer appeared on the OC particles (Figure 14b). This layer mainly contains Na and S, with traces of Ca and K, as determined by EDS. It was associated to the presence of WSP ashes, seeing that it is made up of trace elements typical of living matter (e.g., S in Table 2). With WSP ashes at 1000 °C, agglomeration of smaller SIB particles of about 100 μm occurred frequently (Figure 14c), thanks to the formation of smooth bridges (Figure 14d). EDS of those bridges found Si and K, very often accompanied by Pb, Cu, and Na. With WSP-T3 ashes at 700 °C (Figure 14e,f), SIB particles seem quite similar to their fresh version (Figure 7). At 1000 °C (Figure 14g,h), a lower occurrence of agglomeration was noted for WSP-T3, in comparison to the SIB–WSP couple (Figure 14c,d), due to Si-K-Pb-Cu-Na bridges also in this case.
Figure 15 shows LD micrographs of samples after fluidization at 700 and 1000 °C with WSP or WSP-T3. In all cases, LD particles did not agglomerate as ILM and SIB did, but other peculiar phenomena emerged: (i) LD particles resulted as more cracked than their fresh counterpart (Figure 8), (ii) fragmentation of LD particles occurred, forming fines with diameters lower than 100 μm, and (iii) on LD particles, a very thin layer (1–2 μm) with a melted aspect formed, made up of Na, P, and S (trace elements ascribable to biogenic substances, as ashes). In this last regard, Figure 15b,f located this layer, while Figure 15h shows a shell of this kind, detached from an LD particle.
Figure 16a shows the average diameters of the three fresh OCs, compared with those of some samples after the fluidization tests at 1000°C. Treatments in bubbling fluidized bed, up to 1000 °C with ashes, engendered different kinds of modifications of the OC bed particles. Ashes from WSP caused the highest variations of OC average diameters (+14% for ILM, +25% for SIB, −42% for LD). All pretreated wheat straw pellets produced smaller variations than WSP (see data in Figure 16a): in the ranges from −3% to +7% for ILM, from +8% to +21% for SIB (always increasing), and from −8% to −34% for LD (always decreasing).
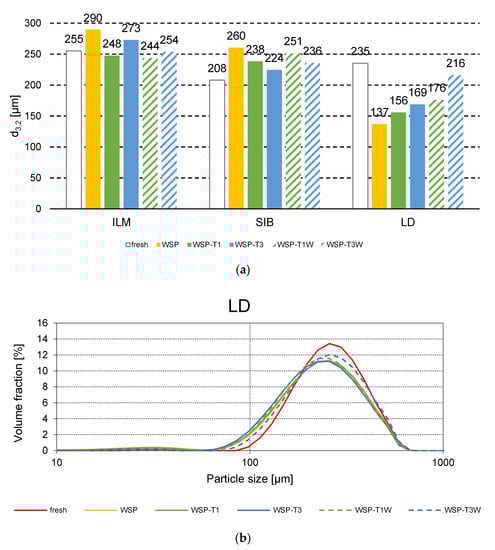
Figure 16.
Malvern measurements on fresh OCs and samples after tests with ashes from WSP, WSP-T1, WSP-T3, WSP-T1W, and WSP-T3W: comparisons of average particle diameters (a) and particle size distributions of LD samples (b).
As far as LD is considered, all after-test samples underwent a quantitatively important decrease of particle sizes: the particle size distributions shifted towards smaller values, and a new secondary bell appeared between 10 and 100 μm, absent in the fresh LD.
4. Discussion
With regard to the chemical consequences of pretreatments on WSP, clear effects were detected as regards N, S, and Cl (Table 2). The same was observed as for the leachability of K and P, which is slightly decreased as the torrefaction degree is increased (Figure 4). On the other hand, similar values of IDT and SOT were obtained when comparing wheat straw ashes with torrefied and torrefied-washed series (Figure 5).
Pressure fluctuation tests highlighted some peculiarities as for each OC, independently from the ash with which they were coupled, e.g., the agglomerative effect of trace elements (Pb and Cu) in SIB or the tendency to fragment of LD particles. This feature of LD requires it to be evaluated separately, while SIB and ILM can be more easily compared one to another.
The ratings of pressure fluctuations signals allowed an assessment of influences from ashes on OCs in fluidized beds. WSP behaved worse than RPR at 2umf (the lowest fluidization velocity) with both ILM and SIB (Figure 10a,c). With regard to ILM (Figure 10a), the pretreatments on WSP improved the bubbling bed performances in comparison with RPR ones. An analogous trend is not so evident for SIB (Figure 10c); therefore, the alterations in its fluidization quality, as temperature was increased, were correlated with intrinsic features of this OC. On the other hand, at 3umf, ILM with torrefied and torrefied-washed samples (Figure 10b) ensured a fluidization in the bubbling regime in the whole explored temperature range (700–1000 °C), and SIB did the same with all ashes (Figure 10d). This confirms the usefulness of the wheat straw pretreatments purposely developed in this work. It is worth to stress here that tests on ILM with ashes from WSP, RPR, WSP-T1, and WSP-T3 were affected by the presence of the stainless-steel pressure probe. Nevertheless, the couple ILM/WSP-T3 at 1000 °C and 3umf was in full bubbling fluidization regime.
The increase of superficial gas velocity from 2umf to 3umf (Figure 10a–d) generally improved the bubbling fluidization quality in both ILM and SIB beds. This indicates that ILM and SIB can be employed in CLG with pretreated or untreated biogenic residues, since this process uses gas flow rates so high to cause bed circulation. Nonetheless, it is crucial to avoid severe sintering/agglomeration phenomena, in order to ensure the smooth operation of the whole CLG plant, especially in its parts which work at the highest temperature and the lowest gas velocities. For ILM and SIB, SEM micrographs allowed observing that the agglomeration mainly involved fine particles, which probably formed because of attrition during fluidization tests. The dimensions of produced agglomerates were comparable to those of fresh OCs particles, even in the worst case of untreated WSP. The inferences from pressure fluctuation analyses, summarized just above for ILM and SIB, found confirmation in the characterization of after-test samples: ILM with ashes from pretreated wheat straw had more limited variations of average diameters, when compared to the ILM–WSP couple (Figure 16a). SIB showed an increase of average diameter for all analyzed after-test samples (Figure 16a). SEM-EDS highlighted the significant agglomeration tendency of SIB (Figure 7) and connected it to the combined presence of Pb and Cu and low-melting elements (Si, K, Ca, Na). Pb and Cu seem to be unexpected originators of agglomeration, as they are neither main components of biogenic residues nor of the investigated OC. However, XRF helped to explain the SEM-EDS results: traces of Pb and Cu in SIB are higher than those in ILM and LD, by two orders of magnitude for Pb, and by at least one order of magnitude for Cu (Table 3). SEM-EDS analyses only found the smooth sealing bridges based on Pb-Cu in those SIB samples which underwent the fluidizations at 1000 °C (Figure 14). No Pb or Cu were detected by SEM-EDS in SIB samples in fresh state or after fluidizations at 700 °C. This suggests that the traces of Pb and Cu—already present in the fresh SIB solid bulk (see XRF in Table 3)—acquired the sufficient mobility to form the bridges only above a temperature threshold between 700 and 1000 °C. In addition to Pb and Cu, the bridges contain Si, K, Ca, and Na, thus the low melting elements—brought by ashes or already included in SIB (e.g., Si, K, Ca)—are also involved in this process.
A significant formation of fines during the fluidization of LD samples was found by measurements of particle size distributions (Figure 16b) and SEM-EDS analyses (Figure 15). It can explain the ambiguous fluid-dynamic behavior of LD (Figure 10e,f, Figure 11e,f, and Figure 12e,f): the decrease of average particle size makes the bed inventory of LD and ashes straddle Groups A (homogeneous fluidization) and B (bubbling) of generalized Geldart map [34].
In most of the OC–ash couples, a non-linear, decreasing trend was observed for standard deviations as the temperature is increased (Figure 11a,c,e and Figure 12a,c,e). According to the “two-phase theory” for bubbling beds, the formation of bubbles is related to the excess surface gas velocity (u - umf) [61,70]: this quantity, for our case of study, has quasi-linear decreasing trends as the temperature is increased between 700 and 1000 °C (calculation based on Table 4), thus the influence of experimental temperature on the performances of OC–ash beds cannot be uniquely associated to the lower absolute values of u at higher temperatures. Rapagnà et al. [71] found that the standard deviation of the pressure fluctuations in the bubbling regime is not appreciably affected by temperature in the case of a moderate-size particle system, whereas with small particles (≤100 μm), its value reduces noticeably as the temperature is increased from ambient to 850 °C, over a wide range of gas velocities. This last consideration matches with the observed behavior of LD (Figure 11e,f and Figure 12e,f), and the detection of significant fragmentation by SEM (Figure 15) and variations of particle size distributions by Malvern Mastersizer 2000 (Figure 16b).
Remarkably, for all the OCs, a unique threshold value of the normalized standard deviation was found (2.2 × 10⁻³), which discriminates between bubbling and non-bubbling beds. This represents a considerable corroboration of the approach used in this work to analyze data from the fluidization tests, since it was applied without the need of specific adaptations for the investigated bed material.
Overall, none of the ashes showed a definitively better behavior than the others, meaning that the quality of bubbling fluidization greatly depends on the couple OC–biomass (Figure 10, Figure 11 and Figure 12). Therefore, the choices of solid fuel feedstock and fluidized bed material are mutually influenced and, in turn, are affected by the specific operating conditions of the chemical conversion to be performed. When considering industrial-scale processes, as the CLG hypothesized in the CLARA project, an important operating condition to be carefully evaluated is the accumulation of biomass ashes in the circulating bed, i.e., the ash to OC ratio. This factor could increase the occurrence of agglomeration phenomena, incipiently observed in this work with a constant bulk volume ratio between ash and OCs.
An additional remarkable issue at industrial scale is the choice of equipment and reactor materials, as evidenced by bad interactions intervened between ILM and the stainless-steel pressure probe in the first fluidization experiments.
5. Conclusions
Pretreatments of wheat straw biomass, based on torrefaction and washing, were developed and validated for CLG applications, in the framework of the European research project CLARA. Torrefaction was effective for removing Cl. This allows torrefaction to be considered as a de-chlorinating process, which prevents the formation of related pollutants and the accelerated corrosion in thermochemical processes. The washing pretreatment, carried out on torrefied wheat straw pellets, removed 30–40% of S, 60–70% of K, and 40–50% of P, with potential beneficial effects in limiting agglomeration phenomena, as far as their use in fluidized bed is concerned. The leachability of K and P is slightly decreased as the torrefaction degree is increased.
The study of standard deviations and dominant frequencies from pressure fluctuation signals turned out to be a suitable tool to detect incipient modifications of the bubbling fluidization regime. The case of study of OCs, mixed with ashes from different biogenic residues for CLG, evidenced that this method can promptly detect the fading of bubbling fluidization, due to particles agglomeration or important particle fragmentation. This was confirmed by cross-checking the evaluations from fluidization tests and the results from the characterization of after-tests samples. Moreover, the evaluations of pressure fluctuation signals were uniquely carried out on the basis of general fluid-dynamic considerations. Therefore, the analysis method proposed in this work, founded on the study of standard deviation and PSDF, is a tool with a good potential for the “online” monitoring of bubbling fluidization quality at the industrial scale. In addition, this method can be used at the laboratory scale to perform the screening of solid feedstock and bed particles, in order to choose in advance those materials which can prevent the scaled-up reactor from de-fluidization.
As far as wheat straw pretreatments are concerned (torrefaction and torrefaction-washing), their effectiveness in preventing agglomeration also depends on the nature of the OC. In several cases, the fluidization quality of a given OC was better with ashes from pretreated wheat straw pellets than with ashes from raw wheat straw and pine forest residues. The most evident improvements, in comparison with raw wheat straw, were generally obtained by torrefaction, while the washing seemed less determinant. As regards the torrefaction degree, no clear dependencies can be inferred. Generally, pretreatments of wheat straw seem desirable to improve the biomass-to-fuel chain by CLG hypothesized in the CLARA research project.
With regard to materials choices for CLG of biomasses, it is worth mentioning that the investigated OCs contain Si, Ca, Al, and K, which can give place to low-melting systems; therefore, they can mitigate the beneficial action of washing. This can explain why this treatment resulted as not so determinant in this work. In addition, trace elements of OCs (e.g., Pb and Cu in SIB) may also bring to agglomeration when these low-melting elements are present at CLG process conditions. The serendipity concerning ILM interactions with stainless-steel highlights the need of a careful choice of building materials for the CLG equipment.
Author Contributions
Conceptualization, A.D.G., I.F., and K.G.; methodology, A.D.G., I.F., R.P.-V., and K.G.; software, A.D.G. and K.G.; validation, A.D.G., I.F., R.P.-V., J.G., and K.G.; formal analysis, A.D.G., I.F., R.P.-V., J.G., and K.G.; investigation, A.D.G., I.F., R.P.-V., and K.G.; resources, J.G. and K.G.; data curation, A.D.G., I.F., R.P.-V., and K.G.; writing—original draft preparation, A.D.G., I.F., R.P.-V., and K.G.; writing—review and editing, A.D.G., I.F., R.P.-V., J.G., and K.G.; visualization, A.D.G. and I.F.; supervision, J.G. and K.G.; project administration, I.F., J.G., and K.G.; funding acquisition, I.F. and K.G. All authors have read and agreed to the published version of the manuscript.
Funding
This research and the APC were funded by the Horizon 2020 Framework program of the European Union, CLARA project, G.A. 817841.
Acknowledgments
The authors warmly thank Fabiola Ferrante for XRF managing, Giampaolo Antonelli for Malvern Mastersizer 2000 managing, Lorenzo Arrizza and Maria Giammatteo for SEM-EDS managing, Leonardo Zennaro for his assistance in fluidization experiments, and Eva Petri for running washing process and managing samples’ shipment.
Conflicts of Interest
The authors declare no conflict of interest. The funders had no role in the design of the study; in the collection, analyses, or interpretation of data; in the writing of the manuscript, or in the decision to publish the results.
References
- United Nations Paris Agreement, 21st Conf. Parties. Available online: https://treaties.un.org/doc/Treaties/2016/02/2016021506-03PM/Ch_XXVII-7-d.pdf (accessed on 30 October 2019).
- Marris, E. Why young climate activists have captured the world’s attention. Nature 2019, 573, 471–472. [Google Scholar] [CrossRef] [PubMed]
- COP24-COP 24 Katowice 2018. Available online: https://cop24.gov.pl/ (accessed on 19 April 2019).
- Keramidas, K.; Tchung-Ming, S.; Diaz-Vazquez, A.R.; Weitzel, M.; Vandyck, T.; Després, J.; Schmitz, A.; Rey Los Santos, L.; Wojtowicz, K.; Schade, B.; et al. Global Energy and Climate Outlook 2018: Sectoral Mitigation Options towards a Low-Emissions Economy Global Context to the EU Strategy for Long-Term Greenhouse Gas Emissions Reduction; Publications Office of the European Union: Luxembourg, 2018. [Google Scholar]
- Creutzig, F.; Ravindranath, N.; Berndes, G.; Bolwig, S. Bioenergy and climate change mitigation: An assessment. GCB Bioenergy 2015, 7, 916–944. [Google Scholar] [CrossRef]
- Selosse, S. Bioenergy with carbon capture and storage: How carbon storage and biomass resources potentials can impact the development of the BECCS. In Bioenergy with Carbon Capture and Storage: Using Natural Resources for Sustainable Development; Magalhaes Pires, J.C., da Cunha Goncalves, A.L., Eds.; Elsevier: London, UK, 2019; pp. 237–256. ISBN 9780128162293. [Google Scholar]
- Mendiara, T.; Gayán, P.; García-Labiano, F.; De Diego, L.F.; Pérez-Astray, A.; Izquierdo, M.T.; Abad, A.; Adánez, J. Chemical Looping Combustion of Biomass: An Approach to BECCS. Energy Procedia 2017, 114, 6021–6029. [Google Scholar] [CrossRef]
- Mendiara, T.; García-Labiano, F.; Abad, A.; Gayán, P.; de Diego, L.F.; Izquierdo, M.T.; Adánez, J. Negative CO2 emissions through the use of biofuels in chemical looping technology: A review. Appl. Energy 2018, 232, 657–684. [Google Scholar] [CrossRef]
- Weber, G.; Di Giuliano, A.; Rauch, R.; Hofbauer, H. Developing a simulation model for a mixed alcohol synthesis reactor and validation of experimental data in IPSEpro. Fuel Process. Technol. 2016, 141, 167–176. [Google Scholar] [CrossRef]
- Pour, N. Status of bioenergy with carbon capture and storage-potential and challenges. In Bioenergy with Carbon Capture and Storage: Using Natural Resources for Sustainable Development; Magalhaes Pires, J.C., da Cunha Goncalves, A.L., Eds.; Elsevier: London, UK, 2019; pp. 85–107. ISBN 9780128162293. [Google Scholar]
- Cazzaniga, N.E.; Jonsson, R.; Palermo, D. Sankey Diagrams of Woody Biomass Flows in the EU-28 Year 2009 EU-28; Publications Office of the European Union: Luxembourg, 2019. [Google Scholar]
- S2Biom Project -Deliverable 8.2. Available online: https://www.s2biom.eu/images/Publications/D8.2_S2Biom_Vision_for_1_billion_tonnes_biomass_2030.pdf (accessed on 1 July 2019).
- IRENA Solid Biomass Supply for Heat and Power: Technology Brief, International Renewable Energy Agency; International Renewable Energy Agency: Abu Dahbi, UAE, 2019; ISBN 9789292601072.
- Transport & Environment; BirdLife International How Much Sustainable Biomass Does Europe Have in 2030? Available online: https://www.transportenvironment.org/sites/te/files/publications/Howmuchsustainablebiomassavailablein2030_FINAL.pdf (accessed on 18 July 2020).
- CLARA—Chemical Looping Gasification for Sustainable Production of Biofuels. Available online: https://clara-h2020.eu/ (accessed on 7 July 2020).
- Ge, H.; Guo, W.; Shen, L.; Song, T.; Xiao, J. Biomass gasification using chemical looping in a 25kWth reactor with natural hematite as oxygen carrier. Chem. Eng. J. 2016, 286, 174–183. [Google Scholar] [CrossRef]
- Higman, C.; van der Burgt, M. Gasification, 2nd ed.; Elsevier: Burlington, NJ, USA, 2008; ISBN 9780750685283. [Google Scholar]
- Ohlemüller, P.; Ströhle, J.; Epple, B. Chemical looping combustion of hard coal and torrefied biomass in a 1 MWth pilot plant. Int. J. Greenh. Gas Control 2017, 65, 149–159. [Google Scholar] [CrossRef]
- Adanez, J.; Abad, A.; Garcia-Labiano, F.; Gayan, P.; De Diego, L.F. Progress in chemical-looping combustion and reforming technologies. Prog. Energy Combust. Sci. 2012, 38, 215–282. [Google Scholar] [CrossRef]
- Berguerand, N.; Lyngfelt, A. Design and operation of a 10 kWth chemical-looping combustor for solid fuels—Testing with South African coal. Fuel 2008, 87, 2713–2726. [Google Scholar] [CrossRef]
- Leion, H.; Mattisson, T.; Lyngfelt, A. Solid fuels in chemical-looping combustion. Int. J. Greenh. Gas Control 2008, 2, 180–193. [Google Scholar] [CrossRef]
- Ströhle, J.; Orth, M.; Epple, B. Chemical looping combustion of hard coal in a 1 MWthpilot plant using ilmenite as oxygen carrier. Appl. Energy 2015, 157, 288–294. [Google Scholar] [CrossRef]
- Ge, H.; Guo, W.; Shen, L.; Song, T.; Xiao, J. Experimental investigation on biomass gasification using chemical looping in a batch reactor and a continuous dual reactor. Chem. Eng. J. 2016, 286, 689–700. [Google Scholar] [CrossRef]
- Pérez-Vega, R.; Abad, A.; García-Labiano, F.; Gayán, P.; de Diego, L.F.; Izquierdo, M.T.; Adánez, J. Chemical Looping Combustion of gaseous and solid fuels with manganese-iron mixed oxide as oxygen carrier. Energy Convers. Manag. 2018, 159, 221–231. [Google Scholar] [CrossRef]
- Mendiara, T.; Pérez, R.; Abad, A.; De Diego, L.F.; García-Labiano, F.; Gayán, P.; Adánez, J. Low-cost Fe-based oxygen carrier materials for the iG-CLC process with coal. 1. Ind. Eng. Chem. Res. 2012, 51, 16216–16229. [Google Scholar] [CrossRef]
- Matzen, M.; Pinkerton, J.; Wang, X.; Demirel, Y. Use of natural ores as oxygen carriers in chemical looping combustion: A review. Int. J. Greenh. Gas Control 2017, 65, 1–14. [Google Scholar] [CrossRef]
- Wei, G.; He, F.; Huang, Z.; Zheng, A.; Zhao, K.; Li, H. Continuous operation of a 10 kWth chemical looping integrated fluidized bed reactor for gasifying biomass using an iron-based oxygen carrier. Energy Fuels 2015, 29, 233–241. [Google Scholar] [CrossRef]
- Huang, Z.; He, F.; Zhao, K.; Feng, Y.; Zheng, A.; Chang, S.; Zhao, Z.; Li, H. Natural iron ore as an oxygen carrier for biomass chemical looping gasification in a fluidized bed reactor. J. Therm. Anal. Calorim. 2014, 116, 1315–1324. [Google Scholar] [CrossRef]
- Huang, Z.; He, F.; Zhu, H.; Chen, D.; Zhao, K.; Wei, G.; Feng, Y.; Zheng, A.; Zhao, Z.; Li, H. Thermodynamic analysis and thermogravimetric investigation on chemical looping gasification of biomass char under different atmospheres with Fe2O3 oxygen carrier. Appl. Energy 2015, 157, 546–553. [Google Scholar] [CrossRef]
- Guo, Q.; Cheng, Y.; Liu, Y.; Jia, W.; Ryu, H.J. Coal chemical looping gasification for syngas generation using an iron-based oxygen carrier. Ind. Eng. Chem. Res. 2014, 53, 78–86. [Google Scholar] [CrossRef]
- Coulson, M.; Dahl, J.; Gansekoele, E.; Bridgwater, A.V.; Obernberger, I.; van de Beld, L. Ash characteristics of perennial energy crops and their influence on thermal processing. In Proceedings of the 2nd World Conference on Biomass for Energy, Industry and Climate Protection; ETA: Rome, Italy, 2004; pp. 359–362. [Google Scholar]
- Demirbas, A. Combustion characteristics of different biomass fuels. Prog. Energy Combust. Sci. 2004, 30, 219–230. [Google Scholar] [CrossRef]
- Jenkins, B.M.; Baxter, L.L.; Miles, T.R.; Miles, T.R. Combustion properties of biomass. Fuel Process. Technol. 1998, 54, 17–46. [Google Scholar] [CrossRef]
- Gibilaro, L.G. Fluidization Dynamics, 1st ed.; Butterworth-Heinemann: Oxford, UK, 2010. [Google Scholar]
- Scala, F. Particle agglomeration during fluidized bed combustion: Mechanisms, early detection and possible countermeasures. Fuel Process. Technol. 2018, 171, 31–38. [Google Scholar] [CrossRef]
- Phyllis2 - Database for the Physico-Chemical Composition of (Treated) Lignocellulosic Biomass, Micro- and Macroalgae, Various Feedstocks for Biogas Production and Biochar. Available online: https://phyllis.nl/ (accessed on 18 July 2020).
- Romano, A.; Di Giuliano, A.; Gallucci, K.; Foscolo, P.U.; Cortelli, C.; Gori, S.; Novelli, M. Simulation of an industrial turbulent fluidized bed reactor for n-butane partial oxidation to maleic anhydride. Chem. Eng. Res. Des. 2016, 114. [Google Scholar] [CrossRef]
- Gallucci, K.; Jand, N.; Foscolo, P.U.; Santini, M. Cold model characterisation of a fluidised bed catalytic reactor by means of instantaneous pressure measurements. Chem. Eng. J. 2002, 87, 61–71. [Google Scholar] [CrossRef]
- Gallucci, K.; Gibilaro, L.G. Dimensional Cold-Modeling Criteria for Fluidization Quality. ACS Publ. 2005, 44, 5152–5158. [Google Scholar] [CrossRef]
- Llop, M.F.; Jand, N.; Gallucci, K.; Llauró, F.X. Characterizing gas-solid fluidization by nonlinear tools: Chaotic invariants and dynamic moments. Chem. Eng. Sci. 2012, 71, 252–263. [Google Scholar] [CrossRef]
- Johnsson, F.; Zijerveld, R.C.; Schouten, J.C.; Van Den Bleek, C.M.; Leckner, B. Characterization of fluidization regimes by time-series analysis of pressure fluctuations. Int. J. Multiph. Flow 2000, 26, 663–715. [Google Scholar] [CrossRef]
- Gómez-Hernández, J.; Serrano, D.; Soria-Verdugo, A.; Sánchez-Delgado, S. Agglomeration detection by pressure fluctuation analysis during Cynara cardunculus L. gasification in a fluidized bed. Chem. Eng. J. 2016, 284, 640–649. [Google Scholar] [CrossRef]
- Fiorentino, M.; Marzocchella, A.; Salatino, P. Segregation of fuel particles and volatile matter during devolatilization in a fluidized bed reactor-II. Experimental. Chem. Eng. Sci. 1997, 52, 1909–1922. [Google Scholar] [CrossRef]
- Chirone, R.; Miccio, F.; Scala, F. Mechanism and prediction of bed agglomeration during fluidized bed combustion of a biomass fuel: Effect of the reactor scale. Chem. Eng. J. 2006, 123, 71–80. [Google Scholar] [CrossRef]
- Schouten, J.C.; van den Bleek, C.M. Monitoring the quality of fluidization using the short-term predictability of pressure fluctuations. AIChE J. 1998, 44, 48–60. [Google Scholar] [CrossRef]
- Nijenhuis, J.; Korbee, R.; Lensselink, J.; Kiel, J.H.A.; van Ommen, J.R. A method for agglomeration detection and control in full-scale biomass fired fluidized beds. Chem. Eng. Sci. 2007, 62, 644–654. [Google Scholar] [CrossRef]
- Van Ommen, J.R.; Sasic, S.; Van der Schaaf, J.; Gheorghiu, S.; Johnsson, F.; Coppens, M.O. Time-series analysis of pressure fluctuations in gas-solid fluidized beds—A review. Int. J. Multiph. Flow 2011, 37, 403–428. [Google Scholar] [CrossRef]
- Luise, M.; Vitetta, M.; Bacci, G.; Zuccardi Merli, F. Teoria dei Segnali; Terza ediz.; The McGraw-Hill Companies: New York, NY, USA, 2009. [Google Scholar]
- Xiang, J.; Li, Q.; Wang, A.; Zhang, Y. Mathematical analysis of characteristic pressure fluctuations in a bubbling fluidized bed. Powder Technol. 2018, 333, 167–179. [Google Scholar] [CrossRef]
- Fan, L.T.; Ho, T.-C.; Hiraoka, S.; Walawender, W.P. Pressure fluctuations in a fluidized bed. AIChE J. 1981, 27, 388–396. [Google Scholar] [CrossRef]
- Van Der Schaaf, J.; Schouten, J.C.; Van Den Bleek, C.M. Origin, propagation and attenuation of pressure waves in gas-solid fluidized beds. Powder Technol. 1998, 95, 220–233. [Google Scholar] [CrossRef]
- Unidad de Pretratamiento-Cener BIO2C. Available online: https://www.bio2c.es/es/unidad-de-pretratamiento/ (accessed on 19 July 2020).
- Teixeira, P.; Lopes, H.; Gulyurtlu, I.; Lapa, N. Use of chemical fractionation to understand partitioning of biomass ash constituents during co-firing in fluidized bed combustion. Fuel 2012, 101, 215–227. [Google Scholar] [CrossRef]
- Pöykiö, R.; Nurmesniemi, H.; Dahl, O.; Mäkelä, M. Chemical fractionation method for characterization of biomass-based bottom and fly ash fractions from large-sized power plant of an integrated pulp and paper mill complex. Trans. Nonferrous Met. Soc. China (English Ed.) 2014, 24, 588–596. [Google Scholar] [CrossRef]
- Zevenhoven-Onderwater, M.; Blomquist, J.P.; Skrifvars, B.J.; Backman, R.; Hupa, M. Prediction of behaviour of ashes from five different solid fuels in fluidised bed combustion. Fuel 2000, 79, 1353–1361. [Google Scholar] [CrossRef]
- Nutalapati, D.; Gupta, R.; Moghtaderi, B.; Wall, T.F. Assessing slagging and fouling during biomass combustion: A thermodynamic approach allowing for alkali/ash reactions. Fuel Process. Technol. 2007, 88, 1044–1052. [Google Scholar] [CrossRef]
- Zevenhoven, M.; Yrjas, P.; Skrifvars, B.J.; Hupa, M. Characterization of ash-forming matter in various solid fuels by selective leaching and its implications for fluidized-bed combustion. Energy Fuels 2012, 26, 6366–6386. [Google Scholar] [CrossRef]
- Larsson, A.; Israelsson, M.; Lind, F.; Seemann, M.; Thunman, H. Using ilmenite to reduce the tar yield in a dual fluidized bed gasification system. Energy Fuels 2014, 28, 2632–2644. [Google Scholar] [CrossRef]
- Mattison, T.; Hildor, F.; Li, Y.; Linderholm, C. Negative emissions of carbon dioxide through chemical-looping combustion (CLC) and gasification (CLG) using oxygen carriers based on manganese and iron. Mitig. Adapt. Strateg. Glob. Chang. 2020, 25, 497–517. [Google Scholar] [CrossRef]
- Wilkinson, D. Determination of minimum fluidization velocity by pressure fluctuation measurement. Can. J. Chem. Eng. 1995, 73, 562–565. [Google Scholar] [CrossRef]
- Kunii, D.; Levenspiel, O. Fluidization Engineering; II.; Butterworth—Heinemann: Newton, MA, USA, 1991. [Google Scholar]
- Yang, W. Handbook of Fluidization and Fluid-Particle Systems; Marcel Dekker Inc.: New York, NY, USA, 2003. [Google Scholar]
- Grace, R.J. Fluidized Bed Hydrodynamics. In Handbook Multiphase Systems; Hemisphere Publishing: London, UK, 1982; Volume 8. [Google Scholar]
- Saleh, S.B.; Flensborg, J.P.; Shoulaifar, T.K.; Sárossy, Z.; Hansen, B.B.; Egsgaard, H.; Demartini, N.; Jensen, P.A.; Glarborg, P.; Dam-Johansen, K. Release of chlorine and sulfur during biomass torrefaction and pyrolysis. Energy Fuels 2014, 28, 3738–3746. [Google Scholar] [CrossRef]
- Tortosa Masiá, A.A.; Buhre, B.J.P.; Gupta, R.P.; Wall, T.F. Characterising ash of biomass and waste. Fuel Process. Technol. 2007, 88, 1071–1081. [Google Scholar] [CrossRef]
- Di Giuliano, A.; Giancaterino, F.; Gallucci, K.; Foscolo, P.U.; Courson, C. Catalytic and sorbent materials based on mayenite for sorption enhanced steam methane reforming with different packed-bed configurations. Int. J. Hydrogen Energy 2018, 43, 21279–21289. [Google Scholar] [CrossRef]
- Di Giuliano, A.; Gallucci, K.; Kazi, S.S.; Giancaterino, F.; Di Carlo, A.; Courson, C.; Meyer, J.; Di Felice, L. Development of Ni- and CaO-based mono- and bi-functional catalyst and sorbent materials for Sorption Enhanced Steam Methane Reforming: Performance over 200 cycles and attrition tests. Fuel Process. Technol. 2019, 195, 106160. [Google Scholar] [CrossRef]
- Savuto, E.; Di Carlo, A.; Gallucci, K.; Di Giuliano, A.; Rapagnà, S. Steam gasification of lignite and solid recovered fuel (SRF) in a bench scale fluidized bed gasifier. Waste Manag. 2020, 114, 341–350. [Google Scholar] [CrossRef]
- Savuto, E.; May, J.; Di Carlo, A.; Gallucci, K.; Di Giuliano, A.; Rapagnà, S. Steam gasification of lignite in a bench-scale fluidized-bed gasifier using olivine as bed material. Appl. Sci. 2020, 10, 2931. [Google Scholar] [CrossRef]
- Grace, J.R.; Clift, R. On the two-phase theory of fluidization. Chem. Eng. Sci. 1974, 29, 327–334. [Google Scholar] [CrossRef]
- Rapagna, S.; Foscolo, P.U.; Gibilaro, L.G. The influence of temperature on the quality of gas fluidization. Int. J. Multiph. Flow 1994, 20, 305–313. [Google Scholar] [CrossRef]
© 2020 by the authors. Licensee MDPI, Basel, Switzerland. This article is an open access article distributed under the terms and conditions of the Creative Commons Attribution (CC BY) license (http://creativecommons.org/licenses/by/4.0/).