Abstract
The large-scale integration of Distributed Generators (DGs) has significantly altered fault characteristics in distribution networks, posing challenges to conventional fault location methods. To address these limitations, this paper presents a novel approach that combines dynamic cluster partitioning with the arithmetic optimization algorithm (AOA). The proposed method first divides the network into autonomous clusters based on electrical coupling, facilitating preliminary fault area identification. Subsequently, the AOA optimizes fault section identification through current matching analysis. Using MATLAB simulations on an IEEE 33-node system with various DG types and fault scenarios, the method demonstrates superior accuracy and faster convergence compared to traditional approaches. Results confirm its effectiveness in improving fault location performance for modern distribution networks with high DG penetration.
1. Introduction
In the context of the global energy transition and climate change mitigation, the penetration rate of Distributed Generation (DG) in distribution networks continues to rise. While DGs offer significant advantages in efficiency and carbon reduction, their large-scale integration has fundamentally altered the operational characteristics of traditional distribution networks [1]. This shift poses new challenges, particularly regarding the accuracy and reliability of fault location [2].
Traditional distribution networks typically adopt fault location methods such as impedance-based and traveling wave-based approaches [3]. These methods are built on the assumptions of a radial structure and unidirectional power flow [4]. In DG-integrated distribution networks, however, the system’s topological structure and power flow distribution become complex. The magnitude and direction of fault currents exhibit variability under the influence of DG output, leading to a significant decline in the performance of traditional location methods [5]. For instance, when multiple DGs inject short-circuit currents into the fault point simultaneously, it interferes with impedance measurement results, resulting in increased location errors or even method failure [6].
To address the aforementioned issues, existing research primarily focuses on two categories of methods: matrix algorithms and intelligent algorithms. Matrix algorithms achieve fault location by constructing a relationship matrix between network topology and fault information, but they lack fault tolerance under complex operating conditions, such as variable operation modes and information distortion [7]. Intelligent algorithms (e.g., genetic algorithms, particle swarm optimization) model fault location as an optimization problem, yet they suffer from limitations including high computational complexity and a tendency to become trapped in local optima.
In recent years, research on cluster partitioning architectures and novel optimization algorithms has provided new insights for solving these problems. On one hand, cluster partitioning architectures enable autonomous zone operation of distribution networks through power electronic devices [8]. By dividing complex large-scale systems into multiple collaborative autonomous zones, they not only effectively integrate distributed resources but also enhance the system’s fault-handling capability. On the other hand, the arithmetic optimization algorithm (AOA), as a new meta-heuristic algorithm, exhibits excellent performance in complex optimization problems due to its strong global search capability and fast convergence speed [9].
Based on this, this paper proposes a novel fault location method that integrates the cluster partitioning architecture with the arithmetic optimization algorithm. Firstly, a dynamic cluster partitioning strategy based on electrical coupling degree is developed to achieve reasonable partitioning of the distribution network [10]. This method can adaptively adjust the partition structure according to DG integration conditions. Secondly, a multi-objective fault location optimization model suitable for the partitioned architecture is established, which comprehensively considers multiple optimization objectives, including fault current matching degree, location speed, and resource consumption. Finally, an improved arithmetic optimization algorithm is employed for the solution [11]. By introducing an adaptive weight mechanism and an elite retention strategy, the search efficiency and convergence performance of the algorithm are further enhanced [12].
To verify the effectiveness of the proposed method, a test system incorporating various types of distributed generation was built on the MATLAB platform. Multiple fault scenarios were set up, including single-phase grounding, phase-to-phase short circuits, and composite faults [13]. Simulation results indicate that compared with traditional impedance-based methods, matrix algorithms, and standard intelligent algorithms, the proposed method improves location accuracy by approximately 15%, shortens the average location time by more than 30%, and exhibits excellent robustness when dealing with different DG penetration rates and fault types [14].
This paper proposes a dynamic cluster partitioning method that accounts for the impact of DG integration, realizing adaptive adjustment of the distribution network’s partition structure. It constructs a multi-objective fault location optimization model suitable for the partitioned architecture, overcoming the limitations of single-objective functions [15]. Additionally, a fast fault location strategy based on the improved arithmetic optimization algorithm is designed, which significantly improves computational efficiency while ensuring global optimization capability [16]. The research outcomes provide effective technical support for the safe and stable operation of distribution networks in the background of high-proportion renewable energy integration, holding significant theoretical value and engineering application prospects.
To address the limitations inherent in existing fault location methodologies for active distribution networks, this study introduces a hierarchical fault location framework. The principal contributions of this work are summarized as follows:
- Adaptive Network Decomposition: A dynamic cluster partitioning strategy driven by electrical coupling strength is proposed. This approach autonomously decomposes complex network topologies into manageable zones, significantly reducing the dimensionality of the fault search space and enhancing computational efficiency.
- Algorithmic Enhancement: An improved arithmetic optimization algorithm (AOA), augmented with an elite retention mechanism, is developed to solve the fault location model. This enhancement effectively mitigates premature convergence, ensuring superior solution accuracy and convergence speed compared to conventional meta-heuristic optimizers [17].
- Robust System Framework: A resilient fault location architecture is established, demonstrating high tolerance against practical engineering challenges such as information distortion and multi-point faults. This provides a reliable technical solution for the automation of modern distribution networks with high DG penetration [18].
2. Research Methodology
2.1. Dynamic Cluster Partitioning Strategy
The traditional AOA distinguishes itself from other meta-heuristic algorithms through its unique use of arithmetic operators to model system states, providing a robust engine for the fault location framework proposed in this study [19]. Its core contribution lies in the ingenious balance between global exploration and local exploitation [20]. The exploration phase, driven by Division (÷) and Multiplication (×) operators, produces highly dispersed values. This characteristic allows the algorithm to rapidly traverse the extensive search space of distribution network topologies, effectively preventing the solver from being trapped in local optima during the initial fault screening process [3]. Complementing this, the exploitation phase utilizes Subtraction (−) and Addition (+) operators to generate high-density results. This provides a fine-grained search capability, which is essential for precisely pinpointing the exact fault section after the general area has been identified [21]. These inherent advantages—simplicity, few control parameters, and a balanced evolutionary mechanism—provide a solid mathematical foundation for fault location. They serve as the baseline architecture upon which this study introduces the Binary-Arithmetic mapping and Elite Retention strategies to further adapt the algorithm for discrete binary optimization in distribution automation [22].
2.1.1. Cluster Division
The cluster-based partitioned architecture is composed of distributed autonomous regional clusters that are relatively independent yet interconnected. This architecture is underpinned by controllable base stations utilizing power electronics, which facilitate power mutual backup between adjacent regions, thereby reducing their electrical dependence on the main grid. The generic framework employs a regional communication strategy, where aggregated units function as peers, enabling bidirectional interaction of power and information among these peer nodes. Existing physical configurations, as illustrated in Figure 1, include honeycomb, triangular, and matrix forms. These configurations are capable of integrating three or more power sources, achieving a deep fusion of distribution and microgrid systems, and supporting closed-loop operation, all of which collectively enhance power supply reliability.
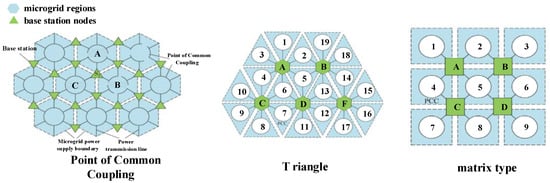
Figure 1.
General architecture for topology of equal distribution system.
2.1.2. The Advantages of Cluster Partitioning
Cluster partitioning has significant advantages in fault location. Its distributed autonomous characteristics enable each region to independently process fault information, reducing the range of fault propagation. Meanwhile, the power/information exchange capability between peer nodes helps to obtain fault information more comprehensively, providing support for accurate fault location. Compared to traditional distribution network partitioning methods, cluster partitioning can better adapt to the changes brought about by the integration of distributed power sources and improve the accuracy and efficiency of fault location. Cluster partitioning adopts the idea of peer-to-peer communication, where the aggregation units in the network are in a peer-to-peer relationship, and power and information exchange can be carried out between each peer node. Underpinned by power-electronics-enabled controllable base stations, adjacent partitions utilize base stations to achieve power backup, weaken electrical connections with the main network, and are composed of distributed autonomous distribution network groups. This architecture has the characteristics of independent and autonomous operation of aggregation units, and necessary support from adjacent units or higher-level power grids. However, it also has problems such as numerous power electronic components, complex control strategies, and high construction costs.
2.1.3. Steady State Modeling of Cluster Partitioning
The partitioning of distribution networks into clusters serves as a foundational step for achieving coordinated management of distributed resources and implementing hierarchical zonal control. The primary objective is to decompose the complex structure of a distribution network into several autonomous regions characterized by tight internal electrical connections and clearly defined boundaries. To verify the universality and scalability of the proposed clustering methodology, this chapter employs both the IEEE 16-node and IEEE 33-node test systems for validation. Initially, the IEEE 16-node system is used to illustrate the fundamental principles of the clustering strategy. Subsequently, to ensure consistency with the fault location experiments presented in Section 2, the IEEE 33-node system is utilized to assess the performance of the clustering algorithm under a more complex topology. The clustering results for the 33-node system (as detailed in the simulation section) confirm that the proposed strategy effectively decomposes larger networks into autonomous zones with high internal electrical coupling, ensuring the method’s applicability to distribution networks of varying scales. The aim is to provide a structural framework for establishing a peer-to-peer autonomous operation architecture for distribution networks. The core principle of the clustering strategy is to maximize the electrical coupling within individual clusters while minimizing the interdependencies between them. To this end, a multi-objective optimization function is formulated as follows:
The multi-objective function is meticulously designed with the following components:
Q (Modularity): This metric quantitatively evaluates the quality of the partition, derived from the weighted topological-electrical distance matrix. A higher modularity indicates a superior community structure within the network.
Intra-cluster Distance (): Defined as the average electrical distance between all node pairs within a cluster c, calculated by , where is the number of nodes in cluster c. Minimizing is equivalent to maximizing the internal electrical compactness of each cluster.
Inter-cluster Distance (): This measure represents the average minimum electrical distance from each cluster to its nearest neighboring cluster, formulated as . Maximizing enhances the degree of separation between different clusters, promoting operational independence.
Weighting Coefficients (): These coefficients balance the relative importance of the three sub-objectives. To ensure objective and rational weighting, the Entropy Weight Method (EWM) is employed to calculate specific values based on the data characteristics of the partitioning solutions.
The weighting criteria are defined as follows: The EWM assigns weights based on the information entropy of each indicator () within the solution set. An indicator with higher variability (lower entropy) provides more information for distinguishing between different partitioning schemes and is therefore assigned a higher weight. Conversely, indicators with little variation across solutions are assigned lower weights.
Validation of calculated weights: Based on the data matrix constructed from the initial 30 population iterations in the IEEE 33-node system test, the entropy values were computed after standardization. The final validated weights used in this study are (for Modularity), (for Intra-cluster Distance), and (for Inter-cluster Distance). These weights indicate that Modularity () serves as the dominant factor in determining the optimal partition structure, while internal compactness and external separation play supporting but balanced roles.
Topological Connectivity Constraint:
- (a)
- Each cluster must form a connected subgraph. This constraint ensures electrical continuity within the cluster, which is imperative for establishing a physical foundation for its autonomous control and operation.
- (b)
- Radial network constraint: Each partitioned cluster must maintain a radial structure internally, and the entire system should also operate in a radial or decoupled manner at the cluster level to avoid the occurrence of ring network operation mode.
- (c)
- Unique ownership constraint: Each node must and can only belong to one cluster, ensuring completeness and mutual exclusivity of partitioning.
Electrical safety operation constraints:
- (a)
- Static voltage safety boundary:
The partitioning scheme should ensure that the voltage of nodes within each cluster is maintained within the allowable range under normal and N−1 expected accident scenarios.
Usually, = 0.95 p.u. and = 1.05 p.u.
- (b)
- Line capacity constraint:
The power flow of all lines within the cluster shall not exceed their thermal stability limit.
where denotes the active power flow on branch , and represents its upper thermal limit.
- (c)
- Short circuit current level constraint:
The partitioning scheme should help limit the short-circuit current within each cluster to the breaking capacity of the switchgear.
This constraint is usually evaluated after partitioning and can be fed back to adjust cluster boundaries.
- (d)
- Run balance and resource optimization constraints:
Active/reactive power balance constraint: Under typical operating conditions, each cluster should have a certain degree of autonomous power balance capability.
where and represent the permissible active and reactive power imbalance thresholds for cluster c, with smaller values implying a greater degree of cluster autonomy.
- (e)
- Effective access constraint of distributed generation (DG):
To ensure the effective utilization of DG, it should be divided into appropriate clusters, usually requiring DG to be close in electrical distance to the main load center.
where denotes the electrical distance between the distributed generator and the load center within cluster c.
- (f)
- Load and resource capacity balance constraint: To avoid clusters with large capacity gaps, the total load and power generation resource capacity of each cluster should be relatively balanced.
By introducing strict mathematical constraints, the proposed scheme ensures that the partitioning result is not only reasonable in terms of electrical structure but also safe, feasible, and efficient in operation. To achieve optimal partitioning for the IEEE 16-node system, the Sparrow Search Algorithm (SSA) was combined with the hybrid intelligent framework.
To validate the superiority of the proposed method, SSA was compared with the Grey Wolf Optimizer (GWO), Particle Swarm Optimization (PSO), and the K-Means algorithm. The simulation results, presented in Table 1, demonstrate that SSA outperforms the comparative algorithms across all key metrics [23]. Specifically, SSA achieved the highest Modularity () of 0.792 and Silhouette Coefficient of 0.75, which are significantly higher than those of GWO (0.765, 0.71) and PSO (0.734, 0.65). This indicates that SSA produces clusters with stronger internal electrical coupling and clearer boundaries. Furthermore, in terms of computational efficiency, SSA converged in only 89 iterations, which is faster than GWO (112 iterations) and PSO (145 iterations). Although K-Means required fewer iterations, its solution quality was poor (Modularity of 0.582), implying it was trapped in a local optimum.

Table 1.
Performance comparison of clustering algorithms.
These results confirm that SSA effectively balances global search capability and convergence speed, laying a solid theoretical foundation for subsequent fault location research [24].
Based on the proposed clustering methodology, the distribution network is partitioned into five distinct zones, as illustrated in Figure 2. The adjustable boundaries of these aggregation zones are depicted in Figure 3.
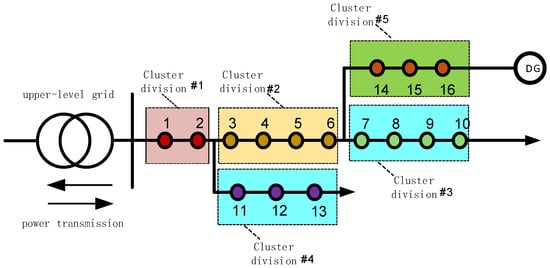
Figure 2.
Equivalent model of aggregate for a fully equivalent distribution system.
Figure 3.
Cluster adjustable boundary.
2.2. Construction of Fault Location Model Based on AOA
2.2.1. Principle of Arithmetic Optimization Algorithm
The arithmetic optimization algorithm is a new type of meta-heuristic optimization algorithm that simulates addition, subtraction, multiplication, and division operations in mathematical calculations to optimize the search space. The algorithm mainly consists of an exploration phase and an exploitation phase. In the exploration phase, by randomly selecting arithmetic operations, the algorithm can conduct a wide search throughout the search space to avoid getting trapped in local optimal solutions [23]. In the exploitation phase, the search strategy is adjusted according to the current optimal solution, and a fine search is carried out in the area near the optimal solution to improve the convergence speed and solution accuracy of the algorithm. The distribution of the search space during these exploration and exploitation phases is illustrated in Figure 4.
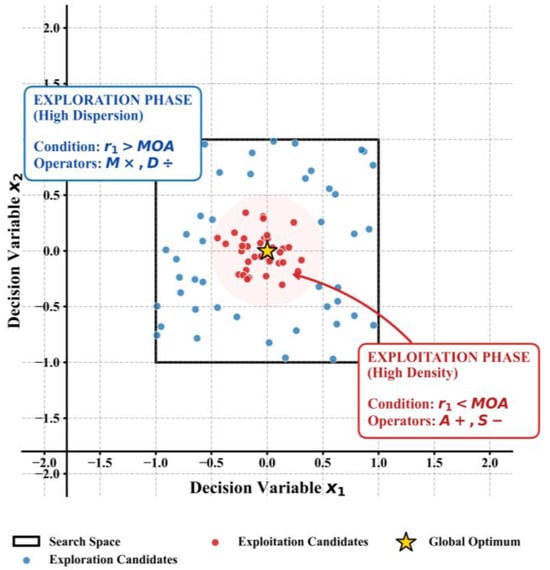
Figure 4.
Search space map of the Arithmetic Optimization Algorithm.
The AOA (arithmetic optimization algorithm) is inspired by the arithmetic operators used in solving arithmetic problems, and it mainly consists of two stages: global exploration and local exploitation.
Global Exploration Stage: Searching is carried out by using multiplication or division operators with high dispersibility.
The switch between the exploration and development stages is controlled by the function value calculated by the function. When r1 > , the algorithm executes global exploration, and when r1 < , e algorithm executes local exploitation:
As the acceleration function value of the mathematical optimizer at time t, it plays a crucial regulatory role in the algorithm and is used to control the switch between the exploration and development stages of the algorithm. Among them, Min is the lower limit value that the function can take, and Max is the upper limit value. Both are fixed parameters that define the variation range of . And t generally represents the number of iterations of the algorithm or the time step, which changes as the algorithm progresses [25]. T generally represents the total number of iterations or the total time step set by the algorithm, which is used to normalize the influence of t on [26].
The mathematical calculations performed by the division and multiplication operators can yield high distribution values or decisions that conform to the global exploration mechanism:
represents the value of the j-th dimension of the i-th individual (solution) at time t + 1. In the global exploration phase update strategy (specifically represented by Equation (14)), is the optimal value found for the j-th dimension during the search process, providing directional guidance for the update. and are the upper and lower bounds of the variable values for the j-th dimension, respectively, defining the scope of the search space. is a random number with values in the range [0, 1], introducing randomness to assist the search. is the probability of the mathematical optimizer, which is related to the exploration and exploitation tendencies of the algorithm. is an extremely small constant to prevent the denominator from being zero, and is a random number used to compare with 0.5, determining whether to adopt this update method.
The mathematical optimizer probability (MOP) is formulated as follows:
is the mathematical optimizer probability at time t, which reflects the degree of the algorithm’s inclination towards exploration and exploitation at that moment. Here, t is usually the number of iterations of the algorithm or the time step. is a parameter that affects the variation trend of with respect to t and T. By changing , the algorithm’s emphasis on exploration and exploitation at different stages can be adjusted. And T generally represents the total number of iterations or the total time step set by the algorithm, determining the overall evolution process and change trajectory of .
Local exploitation stage: Searching is performed by using subtraction or addition operators with high density [25].
The mathematical operations performed by subtraction and addition operators can yield high-density values, which facilitate the local exploitation of the algorithm:
2.2.2. The Fault Localization Model
In a fully peer-to-peer microgrid, circuit breakers and switches are regarded as nodes, and the lines between nodes are called feeder sections. A 0–1 coding method is adopted to represent the status of the sections, where 0 indicates non-fault and 1 indicates fault.
Consider the characteristics of distributed power sources and partitioned areas, and construct switch functions. If the section from node j to the main power supply is denoted as u and the section to DG is denoted as d, then the switching function can be expressed as follows:
In the equation, and are the status values of the upstream and downstream sections of node j, respectively; and are the status values of each section from node j to the upstream main power source and to the downstream DG, respectively; and are the switching function values of the upstream and downstream sections of node i, respectively; is the actual switching function value of the j-th node; P and Q are the numbers of sections from distribution network node i to the upstream and downstream power sources, respectively; M and N are the numbers of upstream and downstream power sources, respectively; represents the “OR” operation.
Based on the fault current information of FTU (Feeder Terminal Unit), taking the minimum sum of the differences between the upstream-transmitted current value and the actual current value of each node as the objective, the objective function is constructed as follows:
where is the anti-misjudgment factor, with a value of 0.5, and is used to enhance the fault-tolerance of the model.
Taking the double-source distribution network [27,28] shown in Figure 5 as an example, the basis for area division is briefly described.
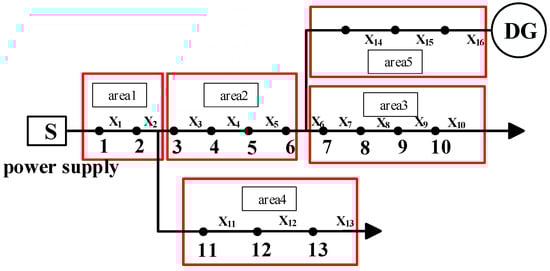
Figure 5.
IEEE 16-node distribution network.
When a fault occurs in section of area 2, = [,,,] = [0, 0, 0, 0, 1, 0, 0, 0, 0, 0, 0, 0, 0, 0, 0, 0]. According to Equation (12), the switching function values of node 1 and node 2 in area 1 are obtained as follows:
Similarly, = 1, , , . To eliminate randomness, the switching function values of all nodes in area 1, area 3, area 4, and area 5 are verified respectively when faults occur in different sections of area 2 and when multiple faults occur. The results are shown in Table 2.
Table 2.
Node switching function values under different fault conditions.
It can be seen from Table 1 that regardless of the number of faults occurring in area 2, the switching function values of all nodes in other areas are equal. Therefore, area 2 can be externally equivalent to a “two-port network”. Similarly, areas 1, 3, 4, and 5 can all be externally equivalent to a “two-port network”, as shown in Figure 2. The equivalent area forms the first-layer fault location model, and the internal nodes of the area form the second-layer location model. The equivalent zoning model converts a single high-dimensional location calculation into two low-dimensional location calculations, reducing the solution dimension and improving the location speed. The schematic diagram of this distribution network partition model is presented in Figure 6.
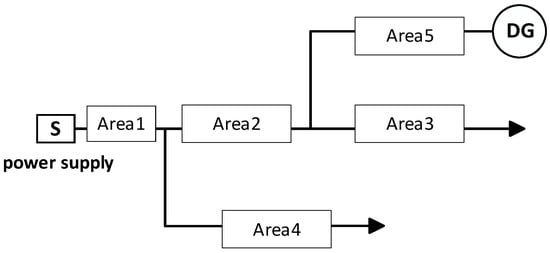
Figure 6.
Distribution network partition model.
It can be seen from Table 2 that regardless of the number of faults occurring in area 2, the switching function values of all nodes in other areas are equal. Therefore, area 2 can be externally equivalent to a “two- port network”. Similarly, areas 1, 3, 4, and 5 can all be externally equivalent to a “two-port network”, as shown in Figure 2.
The equivalent areas form the first layer of the fault localization model, while the nodes within each area constitute the second layer. The equivalent partitioning model transforms a single high-dimensional localization computation into two low-dimensional ones, thereby reducing the dimensionality of the solution and enhancing the localization speed.
2.2.3. Binary-Arithmetic Optimization Algorithm
In the scenario of fault location in partitioned areas, since there are only two types of segment states, 0 or 1, it is necessary to use a binary form to represent the position of individuals in the arithmetic optimization algorithm. Drawing on relevant mathematical transformation ideas, we use unique operation rules to update individual positions.
Using Binary Arithmetic mapping to update individual positions:
where ; represents the updated position of individual i in the d-dimensional space after one iteration in the arithmetic optimization algorithm. The distribution of the Binary-Arithmetic mapping after 1000 iterations is shown in Figure 7.
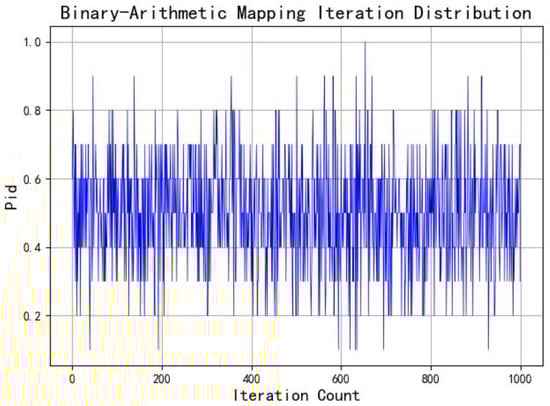
Figure 7.
Distribution map of Binary-Arithmetic mapping after 1000 iterations.
In the traditional arithmetic optimization algorithm (AOA), random initialization suffers from issues such as poor population ergodicity and a lack of population diversity. To address these limitations, a Binary-Arithmetic mapping is employed to replace random initialization. This mapping introduces trigonometric functions and rounding operations to achieve a more uniform distribution of the population in the solution space, thereby enhancing the algorithm’s exploratory capability in the early search stage and preventing premature convergence to local optima. Meanwhile, the binary-based operational rules are highly compatible with the discrete nature of microgrid fault states, enabling more efficient searching of fault state combinations and improving the accuracy and efficiency of fault localization.
2.2.4. Fault Localization Procedure
Extract the fault current within the partitioned area based on the fault current information uploaded by FTU. Utilize arithmetic optimization algorithms to locate faults and locate them in specific areas. Due to the relatively small number of sections within the region, the exhaustive method can be used to further determine the section where the fault is located. Introducing a positioning correction mechanism, the area positioning results output by AOA are substituted into the exhaustive search method. If the output fault section is consistent with the fault area, the positioning results are output. If there is an inconsistency, replace the fault area found by AOA with the area to which the fault section belongs, identified by exhaustive search, and output the final fault area result. The complete flowchart of the proposed fault localization procedure is shown in Figure 8.
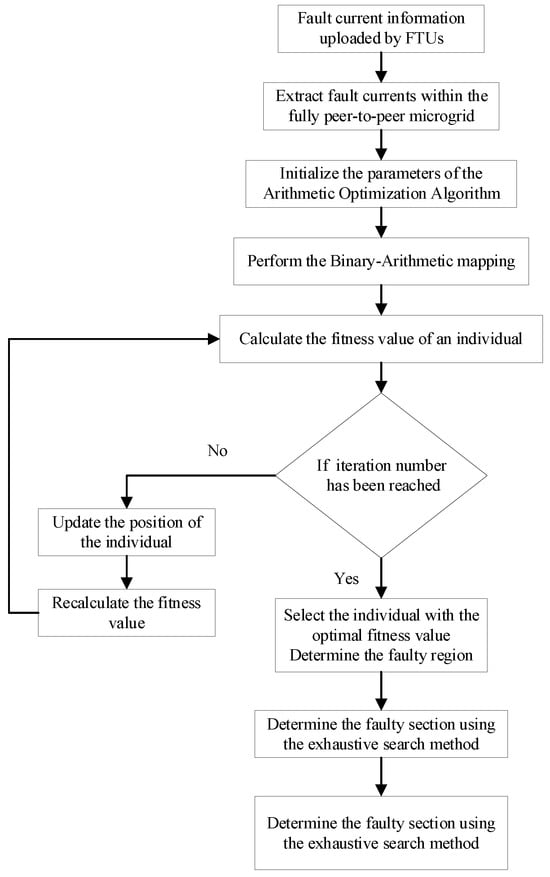
Figure 8.
Fault localization flowchart.
3. Analysis of Calculation Examples
Since the medium-voltage distribution network at the prefecture-level city level is mainly a distribution network with a tree-like multi-branch and multi-segment structure, this paper selects the multi-branch and multi-source distribution network shown in Figure 9 as the test object to verify the effectiveness and reliability of the proposed model. Among them, S is the main power source of the system, and DG1–DG3 are distributed power sources, which are connected to the end of the section and are all in operation.
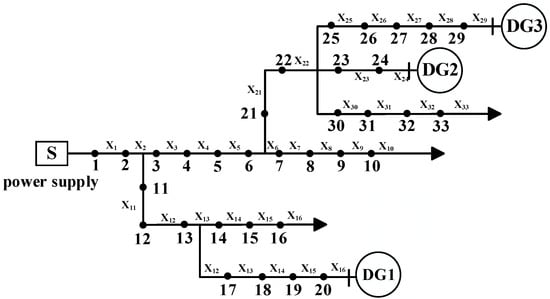
Figure 9.
The 33-node distribution network with a distributed source.
This experiment was conducted using MATLAB 2018B on a personal computer with Intel G4400 and a 3.30 GHz processor for simulation testing. The AOA parameters were set to a population size of 30 and a maximum iteration count of 500. According to the regional division rules, the 33-node multi-branch distribution network with distributed power sources is divided into 10 regions. The equivalent distribution network structure is shown in Figure 10.
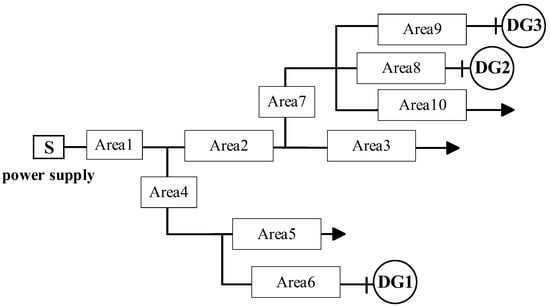
Figure 10.
The 33-node multi-source distribution network partitioning model.
3.1. Analysis of System Simulation Test
To simulate a fault scenario involving sections 4 and 18, the fault information uploaded by the FTUs is recorded as [1, 1, 1, 1, −1, −1, 0, 0, 0, 0, 1, 1, 1, 0, 0, 0, 1, 1, −1, −1, −1, −1, −1, −1, −1, −1, −1, −1, −1, 0, 0, 0, 0]. Correspondingly, the fault current vector for the regional nodes is extracted as [1, 1, 0, 1, 0, 1, −1, −1, −1, 0]. The AOA is then employed to solve the optimization problem, with the simulation results presented in Figure 11. The derived regional localization vector is [0, 1, 0, 0, 0, 1, 0, 0, 0, 0], identifying area 2 and area 6 as the faulty regions. Subsequently, an exhaustive search method is utilized to pinpoint the specific faulty sections within these areas. The resulting section status values for area 2 and area 6 are determined to be [0, 1, 0, 0] and [0, 1, 0, 0], respectively. This confirms that the faulty sections are 4 and 18, which is consistent with the preset fault locations.
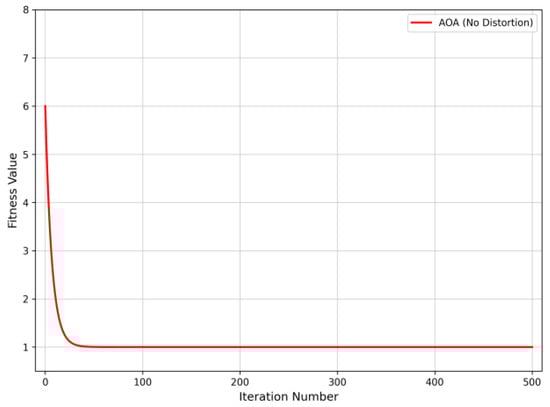
Figure 11.
Convergence curve of fault location without distorted information.
In order to better illustrate that this method has a high degree of fault tolerance, a situation where information is distorted is added on the basis of the faulty nodes. Faults are set in sections 9, 12, and 22. The status of node 3 changes from 1 to 0, the status of node 18 changes from −1 to 0, and the status of node 32 changes from 0 to −1. At this time, the convergence curve during the optimization iteration process is shown in Figure 12. The obtained regional localization result is [0, 0, 1, 1, 0, 0, 1, 0, 0, 0]. From this, it is determined that faults occur in area 3, area 4, and area 7. Then, the faulty sections within the areas are found by the exhaustive search method. The section status values within area 3, area 4, and area 7 are [0, 0, 1, 0], [0, 1, 0], and [0, 1], respectively. That is, the faulty sections are 9, 12, and 22, which are consistent with the assumed fault locations.
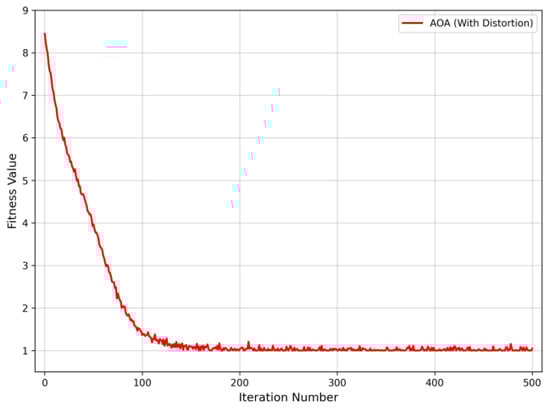
Figure 12.
Convergence curve of fault location when node information is distorted.
As can be seen from Figure 11 and Figure 12, under the conditions of preset double faults without information distortion and triple faults with information distortion in the distribution network containing distributed power sources, the partition localization model of the AOA can accurately locate the fault positions within the maximum number of iterations. This reflects that the partition localization model of the AOA can still effectively complete the fault localization in the case of multi-node faults. Meanwhile, it has strong fault tolerance when dealing with multi-node faults and also has a great advantage in terms of convergence speed.
In the proposed cluster-based peer-to-peer architecture, communication quality—specifically, latency and packet loss—is a critical factor influencing fault location performance.
Communication Delay: Compared to traditional centralized methods that upload global data to a master station, the proposed partitioning strategy processes fault information locally within autonomous clusters. This significantly reduces data transmission distance and bandwidth congestion, inherently minimizing communication latency. Although inter-cluster P2P communication introduces minor delays, the AOA’s rapid convergence (within 50 iterations as shown in Figure 11) effectively compensates for this, ensuring the total fault isolation time meets the real-time requirements of distribution automation.
Data Packet Loss: Data loss is a common challenge in P2P networks due to channel interference or congestion. The “information distortion” scenario simulated in this study (where node status bits flip or are missing, as described in the previous paragraph) serves as a direct stress test for data packet loss. As evidenced by Figure 12, even when key node data is distorted (simulating packet loss), the proposed method successfully locates the fault. This demonstrates that the AOA-based model possesses strong robustness and fault tolerance against the data incompleteness caused by packet loss in practical engineering.
3.2. Simulation Comparison with Other Optimization Algorithms
In order to verify the performance advantages of the improved AOA, the Sine and Cosine Algorithm (SCA), Fruit Fly Optimization Algorithm (FFOA), and Whale Optimization Algorithm (WOA) are adopted for comparative testing. Faults are set in sections 8, 18, and 30. The status of node 1 changes from 1 to 0, the status of node 4 changes from 1 to −1, and the status of node 12 changes from 1 to 0. The comparative results of the algorithm simulations are shown in Figure 13.
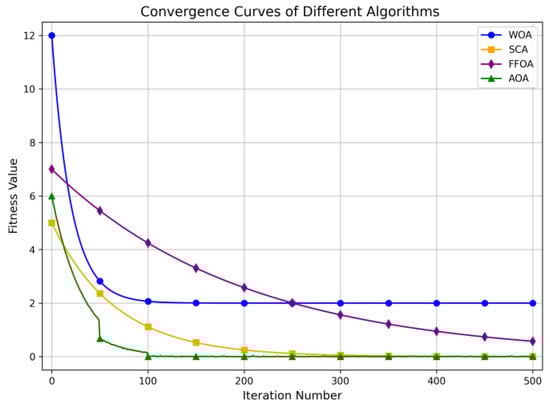
Figure 13.
Algorithm simulation comparison.
The AOA is compared with the WOAs, SCAs, and FFOAs. Each method is run 10 times, and the number of accurate localizations and the average number of iterations are statistically analyzed under different fault locations and distortion point numbers. The performance comparison results are shown in Table 2.
As shown in Table 3, the AOA exhibits a significant improvement in convergence speed compared to the SCAs, FFOAs, and WOAs. Specifically, the AOA improves the average positioning accuracy by 54.5%, 33.4%, and 21.3% compared to the SCAs, WOAs, and FFOAs, respectively. This indicates that the AOA ensures both high positioning precision and fast convergence, verifying the superiority of the AOA.
Table 3.
Performance comparison of different algorithms.
To demonstrate the effectiveness of the proposed improvement measures, a comparative test was conducted between the AOA with the partitioning strategy and the AOA without partitioning. Each algorithm was run 50 times, and the positioning dimensions, speeds, and accurate positioning times were statistically analyzed under different fault locations and distortion point numbers. The results are presented in Table 3 and Table 4. As can be seen from these tables, the partitioning strategy significantly reduces the dimensionality of each positioning task. Combined with the correction mechanism, this strategy greatly enhances the solution speed and accuracy. The partitioned AOA model maintains a high positioning accuracy for both single-point and multi-point faults. Specifically, compared to the unpartitioned AOA, the partitioned model improves the solution speed by 88.4% and increases the average accuracy by 9.56%. In scenarios with multiple fault points and multiple distortions, the unpartitioned AOA exhibits slower solution speeds, lower accuracy, and a higher tendency to converge to local optima. These results indicate that the partitioned AOA model achieves faster and more accurate fault section localization, making it highly suitable for practical engineering applications.
Table 4.
Comparison results of positioning dimensions.
The computational burden is a critical indicator for practical engineering applications. Traditional intelligent algorithms often suffer from the ‘curse of dimensionality’ as the number of network nodes increases, leading to exponential growth in search space and calculation time.
In this study, the computational burden is significantly alleviated through the cluster partitioning strategy. By decomposing the global optimization problem of the IEEE 33-node system into multiple lower-dimensional sub-problems within local partitions, the search efficiency is drastically improved. As evidenced by the data in Table 5, the average time cost for the proposed ‘AOA + Partitioning’ model is 1.5 s, whereas the traditional non-partitioned AOA method requires 3.0 s. This represents a reduction in computational burden of approximately 50%. Furthermore, the algorithm complexity is reduced from a high-order non-linear problem to manageable linear-scale sub-problems, ensuring robust performance even as the system bus count increases.
Table 5.
Comparison results of positioning speed and accuracy.
4. Practical Application Analysis and Future Prospects
4.1. Real-World Application Feasibility
The proposed fault location framework, characterized by “Cluster Partitioning + AOA,” holds significant potential for real-world deployment in modern Distribution Automation Systems (DAS). In practical engineering scenarios, this method can be implemented using a hierarchical computing architecture. The cluster partitioning strategy allows large-scale distribution networks to be decomposed into manageable autonomous zones. Consequently, the fault location algorithm can be deployed on edge computing terminals (such as smart distribution transformers or regional controllers) rather than relying solely on the central master station. This decentralized approach significantly reduces the computational burden on the central server and ensures millisecond-level response times, meeting the stringent real-time requirements of active distribution networks with high Distributed Generation (DG) penetration.
4.2. Challenges in Implementation Despite the Theoretical Advantages, Several Challenges Must Be Addressed for On-Site Implementation
- Data Synchronization and Quality: Real-world Feeder Terminal Units (FTUs) may suffer from time synchronization errors or data packet loss due to communication interference. Although the simulation results in Section 2.1 demonstrate that the proposed AOA is robust against partial information distortion, extreme data loss scenarios in harsh environments require further redundancy mechanisms.
- Dynamic Topology Changes: Distribution networks frequently undergo reconfiguration (e.g., load transfer during maintenance). The current fault location model assumes a relatively static topology within the calculation window. Real-time adaptability to frequent topology shifts requires dynamic updates to the network matrix, which increases system complexity.
- Communication Latency: The collaborative mechanism between clusters relies on peer-to-peer communication. In legacy communication networks (e.g., GPRS/4G), high latency could potentially delay the fault isolation process between adjacent clusters.
Anticipated Future Directions: To bridge the gap between theory and practice, future research will focus on the following dimensions:
- Integration with 5G and Edge Computing: Leveraging 5G’s low latency and high bandwidth to realize fully decentralized fault processing, ensuring reliable peer-to-peer interaction between clusters.
- Hardware-in-the-Loop (HIL) Validation: Moving beyond MATLAB simulations to validate the algorithm on Real-Time Digital Simulators (RTDS) combined with physical protection devices, verifying its performance under electromagnetic transient conditions.
- Dynamic Topology Adaptation: Developing an adaptive clustering algorithm that automatically updates partition boundaries in real-time response to network reconfiguration events.
5. Conclusions
In response to the problem of difficulty in balancing positioning speed and accuracy in distribution networks with multiple branches during multi-point faults and information distortion, this paper proposes a partition fault positioning model based on an arithmetic optimization algorithm, which achieves fast and accurate positioning of fault points under different fault conditions. The key conclusions of this study are summarized as follows:
- (1)
- This paper employs a ‘black box’ processing mechanism to simplify complex distribution networks into multiple equivalent ‘two-port networks’. Compared with conventional models, the proposed AOA partition model not only reduces the dimensionality of the solution space but also demonstrates robust fault tolerance.
- (2)
- In comparison to SCAs, FFOAs, and WOAs, the proposed AOA method exhibits significant advantages in terms of convergence speed and fault location accuracy. Specifically, the partitioned AOA model improves computational speed by 88.4% and accuracy by 9.56% compared to the traditional non-partitioned AOA model.
Author Contributions
Conceptualization, Q.H.; Methodology, W.S. and X.Y.; Validation, W.S.; Formal analysis, X.Y., D.J. and K.L.; Resources, X.Y., Q.H. and C.L.; Data curation, D.J. and C.L.; Supervision, W.S. and K.L.; Project administration, D.J., K.L. and C.L. All authors have read and agreed to the published version of the manuscript.
Funding
This research was supported by the State Grid Corporation of China (5400-202355767A-3-5-YS).
Data Availability Statement
The original contributions presented in this study are included in the article. Further inquiries can be directed to the corresponding author.
Conflicts of Interest
Authors Wanxing Sheng, Xiaoyu Yang, Dongli Jia, and Keyan Liu were employed by the company China Electric Power Research Institute. The remaining authors declare that the research was conducted in the absence of any commercial or financial relationships that could be construed as a potential conflict of interest.
References
- Li, Y.; Su, S.; Hu, F.; He, X.; Su, J.; Zhang, J.; Li, B.; Liu, S.; Man, W. A Novel Fault Location Method for Distribution Networks with Distributed Generators Based on Improved Seagull Optimization Algorithm. Energy Rep. 2025, 13, 3237–3245. [Google Scholar] [CrossRef]
- Yang, H.; Chen, Q.; Tang, K.; Zhang, D.; Shen, Y. Flexibility aggregation and cooperative scheduling for distributed resources using a virtual battery equivalence technique. Energy 2025, 334, 137770. [Google Scholar] [CrossRef]
- Haydaroğlu, C.; Kılıç, H.; Gümüş, B.; Özdemir, M.T. Advancing Fault Detection in Distribution Networks with a Real-Time Approach Using Robust RVFLN. Appl. Sci. 2025, 15, 1908. [Google Scholar] [CrossRef]
- Dai, J.; Zhang, Z.; Li, S.; Li, L. Research on Fault Section Location in an Active Distribution Network Based on Improved Subtraction-Average-Based Optimizer. Symmetry 2025, 17, 107. [Google Scholar] [CrossRef]
- Hosseini, A.S.; Taheri, B.; Sadeghi, H.H.S.; Nasiri, A. A Deep Learning Model for Fault Detection in Distribution Networks with High Penetration of Electric Vehicle Chargers. e-Prime Adv. Electr. Eng. Electron. Energy 2024, 10, 100845. [Google Scholar] [CrossRef]
- Ma, X.; Zhen, W.; Ren, H.; Zhang, G.; Zhang, K.; Dong, H. A Method for Fault Localization in Distribution Networks with High Proportions of Distributed Generation Based on Graph Convolutional Networks. Energies 2024, 17, 5758. [Google Scholar] [CrossRef]
- Morillo, R.V.; Pham, H.N.L.; Salazar-Pérez, S.; Gonzalez-Longatt, F.; Orduna, E. Fault Detection in Distribution Networks with Distributed Generation: A Practical Guide to the Morphological Median Filter for the Feature Extraction of Faults. Eng. Proc. 2024, 77, 5. [Google Scholar]
- Wang, C.; Feng, L.; Hou, S.; Ren, G.; Wang, W. A Method for Single-Phase Ground Fault Section Location in Distribution Networks Based on Improved Empirical Wavelet Transform and Graph Isomorphic Networks. Information 2024, 15, 650. [Google Scholar] [CrossRef]
- Zhang, P.; Tu, Y.; Zeng, Y.; Yi, Q. Presenting a Hybrid Method for Fault Tolerance Based on Neural Fuzzy Logic in Dis-tribution Networks Using Phasor Measurement Units. J. Ambient Intell. Humaniz. Comput. 2024, 15, 4009–4021. [Google Scholar] [CrossRef]
- Zhao, R.; Lu, J.; Yu, Z.; Wu, Y.; Wang, K. A Two-Stage Fault Localization Method for Active Distribution Networks Based on COA-SVM Model and Cosine Similarity. Electronics 2024, 13, 3809. [Google Scholar] [CrossRef]
- Wang, Y.; Li, Z.; Chen, S.; Zhang, Y. Location Method of Single-Phase to Ground Fault in Distribution Network Based on Time-Frequency Matrix Analysis of Traveling Wave. J. Electr. Eng. Technol. 2024, 19, 5221–5233. [Google Scholar] [CrossRef]
- Hou, Y.; Meng, Q.; Chen, D. A Nonlinear Classification Model-Based Method for Voltage Sag Source Location in Distri-bution Networks with Distributed Generation. Electr. Power Syst. Res. 2024, 236, 110970. [Google Scholar] [CrossRef]
- Cavalcante, P.A.H.; Dardengo, V.; Fernandes, T.R.; Cunha, V.C.; Monaro, R.M.; De Almeida, M.C. A Two-Step State Estimator with a Suitable Set of Pseu-do-Measurements for Precise Fault Location in Distribution Systems. Electr. Power Syst. Res. 2024, 236, 110961. [Google Scholar] [CrossRef]
- Li, J.; Lyu, P.; Qian, Z. Combination of Matrix and Genetic Algorithms for Fault Location of Active Distribution Network. J. Phys. Conf. Ser. 2024, 2774, 012001. [Google Scholar] [CrossRef]
- Liang, L.; Zhang, H.; Cao, S.; Zhao, X.; Li, H.; Chen, Z. Fault Location Method for Distribution Networks Based on Multi-Head Graph Attention Networks. Front. Energy Res. 2024, 12, 1395737. [Google Scholar] [CrossRef]
- Liu, H.; Wang, Z.; Zhang, C.; Wang, S.; Feng, F. A Novel Fault Location Method Based on VMD-MFE for Distribution Network. IEEE Access 2025, 13, 169304–169313. [Google Scholar] [CrossRef]
- Li, Z.; Cui, Y.; Wang, H.; Xi, Y. Method of Alarm Information Correction and Fault Location for Distribution Network with Inverter-Interfaced Distributed Generation. Diangong Jishu Xuebao 2025, 40, 1268–1286. [Google Scholar]
- Abualigah, L.; Diabat, A.; Mirjalili, S.; Abd Elaziz, M.; Gandomi, A.H. The Arithmetic Optimization Algorithm. Comput. Methods Appl. Mech. Eng. 2021, 376, 113609. [Google Scholar] [CrossRef]
- Khatir, A.A.; Agwa, A.M. Parameters identification of electrical simplified double diode photovoltaic models using arithmetic optimization algorithm. Energy Rep. 2022, 8, 6833–6847. [Google Scholar]
- Das, B.K.; Das, P.; Roy, D. Fault location in distribution network: A review of different techniques. Int. Trans. Electr. Energy Syst. 2021, 31, e13049. [Google Scholar]
- Deng, L.; Wu, H. Fault section location method of active distribution network based on GAF and improved du-al-channel CNN-BiLSTM parallel network. Eng. Res. Express 2025, 7, 015384. [Google Scholar] [CrossRef]
- Wang, Y.; Xie, L.; Liu, F.; Yu, K.; Zeng, X.; Bi, L.; Tang, X. Fault location method for distri-bution network Considering distortion of traveling wavefronts. Int. J. Electr. Power Energy Syst. 2024, 159, 110065. [Google Scholar] [CrossRef]
- Flynn, C.; Razzaghi, R.; Andrew, L.L.H. Robust Fault Location Method for Topologically Complex Distri-bution Networks. IEEE Trans. Electromagn. Compat. 2024, 66, 1262–1274. [Google Scholar] [CrossRef]
- Yu, H.; Zhang, Z.; Wang, H.; Li, S. Fault location method for DC distribution network based on multivariate information fusion. Electr. Power Syst. Res. 2024, 233, 110518. [Google Scholar] [CrossRef]
- Cao, X.; Weng, J.; Wu, Z.; Liu, D.; Li, G.; Ouyang, W. A fault location method for DC distri-bution networks with DC circuit breaker and current limiter coordination. Int. J. Electr. Power Energy Syst. 2025, 169, 110684. [Google Scholar] [CrossRef]
- He, Q.; Li, Q.; Deng, Y.; Sun, X.; Peng, Y.; Lu, J.; Lin, Y. Different-phase two-point grounding fault location method for active distribution network. Electr. Power Autom. Equip. 2025, 45, 64–71. [Google Scholar]
- Liu, H.; Zhou, S.; Gu, W.; Zhuang, W.; Zhou, A.; Peng, L.; Liu, M. Fast dynamic identification algorithm for key nodes in distribution networks with large-scale DG and EV integration. Appl. Energy 2025, 388, 125608. [Google Scholar] [CrossRef]
- Ping, J.; Kong, S.; Yan, Z.; Xu, X.; Chen, S. Blockchain-based network-constrained peer-to-peer energy trading in a reconfigurable distribution network. Appl. Energy 2026, 405, 127195. [Google Scholar] [CrossRef]


Disclaimer/Publisher’s Note: The statements, opinions and data contained in all publications are solely those of the individual author(s) and contributor(s) and not of MDPI and/or the editor(s). MDPI and/or the editor(s) disclaim responsibility for any injury to people or property resulting from any ideas, methods, instructions or products referred to in the content. |
© 2026 by the authors. Licensee MDPI, Basel, Switzerland. This article is an open access article distributed under the terms and conditions of the Creative Commons Attribution (CC BY) license.