Abstract
The high proportion of renewable energy introduces significant operation risks to the system’s flexibility balance due to its volatility and randomness. Traditional regulation methods struggle to meet the urgent demand for flexible resources. Utilizing wind turbines (WTs) under load shedding operation can provide additional reserve capacity, thereby reducing the risk of insufficient system flexibility. However, since wind speed and turbine output exhibit a cubic relationship, minor fluctuations in wind speed can lead to significant variations in output and reserve capacity. This increases the uncertainty in the supply of flexible resources from WTs, posing challenges to power system flexibility assessment. This paper investigates a method for assessing power system flexibility considering the uncertainty of flexible resources supported by WT under load shedding operation. Firstly, according to the flexibility supply control model of WT under shedding operation, the analytical relationship between output, flexible resources, and wind speed under a specific wind energy conversion coefficient is constructed; secondly, combined with the probabilistic model of wind speed based on the nonparametric kernel density estimation, the wind turbine flexible resource uncertainty model is constructed; thirdly, the Monte Carlo simulation is used to obtain the sampled wind speed data, and the operational flexibility assessment method of the power system considering the flexibility uncertainty of WT under load shedding operation is proposed. Finally, through case studies, the validity of the proposed model and method were verified. The analysis concludes that load shedding operation of WTs can enhance the system’s flexible resources to a certain extent but cannot provide stable bi-directional regulation capabilities.
1. Introduction
With the transformation of the global energy structure, the proportion of renewable energy resources such as wind power in the power system is increasing recently, and its large-scale access has brought clean and low-carbon energy supply to the power system, but its volatility and randomness have brought unprecedented challenges to the flexibility balance of the system [1], and traditional adjustment methods are struggling to meet the urgent needs of the system for flexible resources. Against this background, wind turbine load shedding operation [2,3,4], as an emerging flexibility regulation method, can provide additional reserve capacity, reducing the risk of system flexibility insufficiency.
In recent years, scholars have mainly divided the analysis and evaluation methods of power system flexibility into deterministic methods and stochastic methods. The deterministic approach assumes that the load demand, renewable energy output, failure scenarios, etc., are fixed or known, and analyzes them by setting typical or extreme scenarios. Ref. [5] focuses on the characteristics of a single generator set, and establishes an intuitive quantitative evaluation framework for flexibility by proposing three flexibility indicators: unit ramp-up rate, power output capacity, and energy storage capacity. Ref. [6] proposes flexible interval indicators from the perspective of wind power and load, which provides a decision-making basis for the flexible operation of the system. Ref. [7] constructs an intrinsic flexibility index system to track the evolution of the power supply side’s flexible regulation ability and reflect the power supply flexibility of the power system. Ref. [8] establishes deterministic flexibility indicators to assess the overall flexibility of the system by taking the resources of each component as a whole. A multi-dimensional scoring mechanism [9] was established to score various flexibility resources and flexibility requirements of the system, and the final score was weighted by the various scores to reflect the flexibility of the system. Ref. [10] evaluated the operational flexibility of distributed power grids and incorporated it into the energy storage planning for distribution networks. Ref. [11] analyzes the improvement in distribution network operational flexibility brought about by electric vehicle scheduling, primarily utilizing an aggregation method for electric vehicle flexibility. Although deterministic methods can utilize predetermined fluctuation scenarios for renewable energy and load to assess the operational flexibility of power systems and quantify the risk of insufficient flexibility resources, they face significant limitations in new power systems with large-scale renewable integration. The inherent randomness and volatility of renewable energy introduces uncertainties in flexible resource demand [12], making it difficult for deterministic approaches to accurately evaluate the complex and dynamically changing flexibility requirements during power system operation [13].
The stochastic method can be used to consider the randomness of parameters, such as the wind power output, load prediction error, etc., and describe the uncertainty of the flexibility through probability models or fuzzy mathematics [14,15]. Ref. [16] proposes quantitative indicators of unit flexibility and traditional power source flexibility of the power system, describes the random fluctuation of renewable energy with normal distribution, and calculates the proposed flexibility index to evaluate the new energy acceptance capacity of the system. Ref. [17] addresses the issue of insufficient system regulation capacity by constructing a model of inadequate ramping capability expectations to quantify system flexibility across multiple timescales and directions. Ref. [18] models the start-up flexibility and capacity flexibility of thermal power plants, evaluating system operational flexibility through stochastic production simulations. Ref. [19] establishes a probabilistic distribution model for system flexibility margins to enable quantitative analysis of various flexibility resources within the system. Ref. [20] proposes a flexibility index based on margin distribution by modeling the flexibility demand and flexibility resources of the system. Ref. [21] presents a virtual energy storage system (VESS) scheduling method that integrates fixed and dynamic energy storage (ES) solutions to optimize energy management in commercial buildings. Fixed ES, such as batteries, provides stable flexibility but is expensive and can be inefficiently operated.
Stochastic methods for flexibility assessment can effectively quantify the impact of the randomness and volatility of renewable energy on power system flexibility. However, existing research focuses on the Maximum Power Point Tracking (MPPT) mode of renewable energy [22] and lacks quantification of the schedulable flexibility resources provided by wind turbines under deloaded operation. Furthermore, the stochastic methods for flexibility assessment only consider the uncertainty of power output fluctuations from generating units. In reality, wind speed and wind turbine output exhibit a cubic relationship, where minor fluctuations in wind speed can lead to significant changes in unit output and reserve capacity. The volatility and randomness of wind speed not only affect the turbine’s output but also significantly impact the flexible resource supply capacity under deloaded operation [23], posing severe challenges to power system operational risk assessment. In the near future, to enhance the operational security of power systems with high penetration of renewable energy and improve the grid-friendliness of renewable energy integration, utilizing wind turbines under load shedding operation to provide flexible resources will become an important trend in the development of renewable energy power systems.
In light of the above analysis, this paper investigates the flexibility assessment method for power systems considering the uncertainty of flexible resources under wind turbine load shedding operation, the threefold contributions of this paper are as follows:
- (1)
- Based on the flexibility supply control model under wind turbine load shedding operation, the fundamental principles of flexibility supply under such conditions are clarified, the analytical relationship between output, flexible resources, and wind speed under a specific wind energy conversion coefficient is established.
- (2)
- The nonparametric kernel density estimation method is used to determine the wind speed probability model. Combined with the analytical relationship between wind speed and flexible resource capacity of wind turbines, the uncertainty model of flexibility resources supported by WTs considering wind speed uncertainty is constructed.
- (3)
- The Monte Carlo simulation method is employed to sample wind speed data for wind farms, and a flexibility assessment method for power systems considering uncertainty of flexible resources supported by wind turbines under load shedding operation is proposed.
The paper is organized as follows. In Section 2, the analytical relationship of wind power output and flexible resources with operating parameters is presented; Section 3 develops the uncertainty model of flexibility resources supported by wind turbines; Section 4 presents operational flexibility assessment of power systems considering the uncertainty of flexible resources supported by wind turbines under load shedding operation; and Section 5 is the case studies for validating the effectiveness of the proposed model and method. Finally, Section 6 provides a summary of the paper.
2. Relation of Wind Power Output and Flexible Resources with Operating Parameters
The output of the wind turbine is related to the wind speed, rotor speed, and pitch angle, which is a complex and high-dimensional nonlinear expression. In order to clarify the influence of wind speed changes on wind power output, this section analyzes the analytical relationship between wind power output and operating parameters, aiming to provide an analytical model of wind power output concerning wind speed.
This paper takes the Doubly Fed Induction Generator (DFIG) as the research object, referred to as the wind turbine hereinafter. The DFIG is a high-efficiency generator widely used in wind power generation systems, in which the stator windings are directly connected to the power grid, the speed is decoupled from the system frequency, and the rotor windings are connected to the grid through back-to-back converters, so as to achieve flexible adjustment of the rotor speed and efficient operation [24]. In order to meet the growing demand for flexible resources in the power system, DFIGs can actively reduce the output power through load shedding operation, aiming to obtain a certain amount of flexible resources.
The core of load shedding operation lies in keeping the wind turbine running in sub-MPPT mode through a control strategy, and the main ways of doing this are overspeed load shedding and pitch angle control load shedding. Overspeed load shedding reduces wind energy capture efficiency by adjusting the rotor speed to deviate from the optimal blade tip speed ratio (TSR). This method has a short response time, but increasing the rotor speed may cause the mechanical components to be subjected to greater dynamic loads, increasing the risk of fatigue damage and requiring precise adjustment of the rotor speed and generator torque, resulting in a high degree of control complexity. Pitch angle control load shedding reduces wind energy absorption by adjusting the pitch angle of the blades. Although this mode is not as fast as overspeed load shedding to release standby power, its response speed can meet the time requirement for flexible resources of primary frequency modulation, the stress influence on the mechanical parts of the wind turbine (such as gear box, bearing) is small, the control logic is simple, and the wind condition scene that can be applied is wider than for the overspeed load shedding method. Therefore, this section studies the operation model of doubly fed fans with pitch angle control as the load reduction method.
According to aerodynamics, the wind energy capture formula for wind turbines is as follows in Equation (1):
where is the mechanical power captured by the wind turbine, is the air density, is the rotor blade radius, is the wind speed, and is the power coefficient, which is a function of tip speed ratio and pitch angle . Its empirical formula is given by Equation (2):
where λ is the blade tip speed ratio, β is the pitch angle, ω is the fan blade speed, and λi is the intermediate variable.
In order to improve the utilization rate of wind energy, wind turbines are usually operated in MPPT mode. Combined with Equation (1), the parameters such as air density, wind speed of fan blade radius, and wind speed in the actual scene cannot be artificially changed, and the only way to capture wind energy as much as possible is to increase the value of the wind energy utilization coefficient CP. β is the angle between the wind turbine blades and the plane of rotation; below the rated wind speed, the pitch angle is usually kept at an optimal value of 0° to maximize the efficiency of wind energy capture. Setting the pitch angle to 0° and the wind turbine blade radius to 50 m, Figure 1 shows the relationship between the power coefficient, wind speed, and rotor speed.
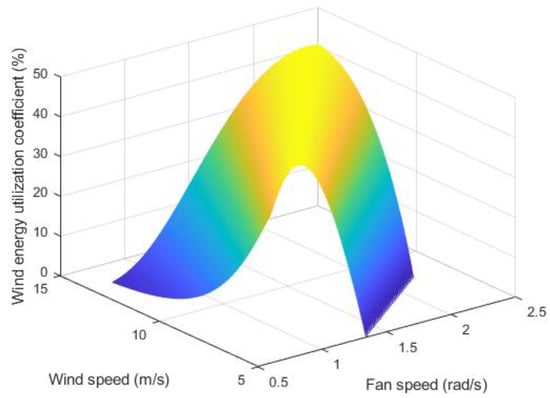
Figure 1.
Diagram of the relationship between wind power utilization coefficient, wind speed, and rotational speed.
As shown in Figure 1, the relationship between the wind energy utilization coefficient, the wind speed, and the wind turbine speed is ridge-shaped. In order to obtain the maximum wind energy utilization coefficient, there is only one wind turbine optimal speed corresponding to each wind speed. When the turbine is running at the optimal speed, increasing or decreasing the speed of the wind turbine will cause a decrease in the utilization rate of wind energy. Based on this empirical formula, the relationship between the wind energy utilization coefficient and the wind speed is only observed from the perspective of the rotating image, and it can be seen that the maximum wind energy utilization coefficient is 48% when operating below the rated wind speed. When the wind speed exceeds the rated wind speed, the fan keeps the rated power running through a certain control mechanism to avoid overload and damage to the equipment. When the wind speed exceeds the cut-out wind speed, the fan enters the standby state and no longer generates electricity. Therefore, after ignoring the energy losses such as mechanical transmission and generator efficiency, the MPPT operation model of the wind turbine can be expressed as the following:
where is the output coefficient of the turbine, which is uniquely determined when the turbine type remains unchanged, so that the output of the turbine under MPPT operation is only term related to the wind speed. is the rated power of the fan, is the rated wind speed of the turbine, is the cutting wind speed, and is the cut-out wind speed of the turbine.
In order to analyze the analytical relationship between the operation of the fan and the pitch angle, the speed of the fan is controlled and follows the optimal speed when the maximum wind energy utilization coefficient is obtained, and the size of the pitch angle is adjusted to suit. The relationship between the wind energy conversion coefficient and the pitch angle is shown in Figure 2.
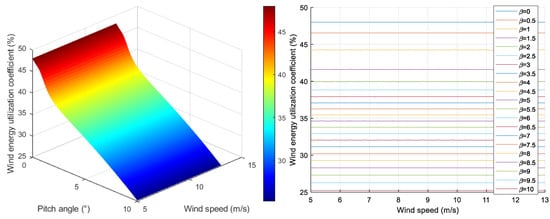
Figure 2.
Diagram of the relationship between wind power utilization coefficient and pitch angle.
As shown in Figure 2, with the increase in the pitch angle, the wind energy utilization coefficient shows a downward trend, and the decreasing speed increases in the range of 0~1.5°, decreases in the range of 1.5~3°, and tends to remain unchanged in the range of 3~10°. After the pitch angle is determined, the wind speed and the wind energy utilization coefficient are a straight line parallel to the horizontal axis, and the wind speed change does not affect the value of the wind energy utilization coefficient. Therefore, regardless of the wind speed in the scene, in order to realize the load shedding operation of the wind turbine, there is a unique number of pitch angles corresponding to the load shedding ratio. After determining the load shedding ratio, the load shedding operation model of the turbine can be expressed as follows:
where is the load shedding output of the wind turbine, is the load reduction ratio of the wind turbine, and is the maximum load shedding ratio of the wind turbine, which is usually 20–30% in most wind farms, and is determined by the design and control system of the unit.
3. Uncertainty Model of Flexibility Resources Supported by Wind Turbines
3.1. Probabilistic Model of Wind Speed
Wind turbine output is closely related to wind speed; in order to study the uncertainty of wind turbine flexibility resources and quantify the impact of wind speed fluctuation on the flexibility margin of the system, this subsection proposes a wind speed fluctuation scenario generation method. This subsection takes one year’s wind speed data of a certain place as a sample, analyses the fluctuation data of wind speed, and constructs the fluctuation model of wind speed in a certain time. Figure 3 shows the distribution image of wind speed for one year in this place, and Figure 4 shows the distribution image of fluctuation within one hour under the wind speed of 8 m/s in this place.
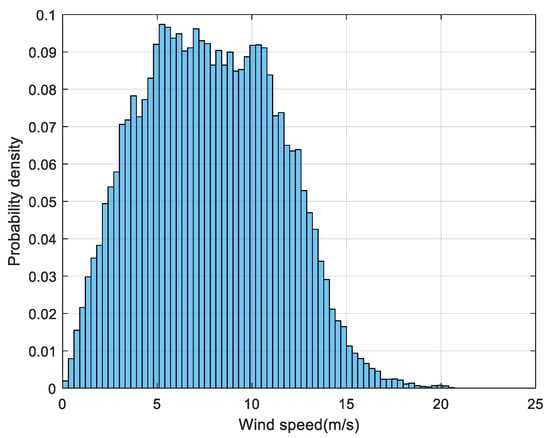
Figure 3.
Diagram of wind speeds for one year at one location.
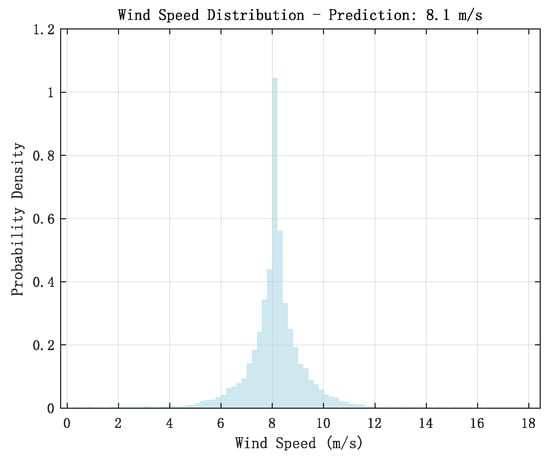
Figure 4.
Histogram of fluctuations in wind speed of 8.1 m/s in one hour at one location.
As shown in Figure 3, the one-year distribution of wind speed is “right-skewed”, that is, the probability density is higher in the smaller wind speed range, and gradually decreases in the larger wind speed range, forming a long-tail distribution, satisfying the Weibull distribution [25]. While, in Figure 4, the fluctuation sample data of wind speed within one hour at 8 m/s shows a “herringbone pattern”, which cannot be fitted by the conventional Weibull distribution and normal distribution models.
Nonparametric kernel density estimation (NKDE) is a common method for estimating the probability density function of a random variable, which does not need to assume that the data obeys a particular distribution, but is directly based on the observed data for the smoothing estimation [26]. Compared with traditional parametric distributions (such as normal or Weibull distribution), NKDE can capture the actual distribution shape of the data more flexibly and is suitable for datasets with complex structures. Considering the strong geographical nature of wind speed fluctuations around the world, this study considers estimating the probability density function based on the historical data through the nonparametric kernel density estimation method to construct a probability distribution model for the fluctuations of the wind speed over a certain period of time in the following steps:
- (1)
- Traverse the wind speed data to find the target wind speed point, set the interval to exclude the similar data in the data, and record the wind speed samples within a certain time after the appearance of each target wind speed.
- (2)
- Calculate the bandwidth by the Silverman rule. The formula is shown in Equation (5):
- (3)
- For each estimated point x, calculate the density value with the formula given in Equation (6):
- (4)
- Repeat the calculation to obtain the probability density function curve for the entire wind speed fluctuating over a certain period of time.
3.2. Flexibility Resource Model for WTs with Variable Wind Speeds
In order to tap the flexibility resources and enhance the flexibility margin of system operation, the wind turbine leaves a certain amount of power regulation margin by pitch angle control load shedding operation, so as to change the power output quickly when the grid frequency fluctuates. The pitch angle control speed of the wind turbine is fast, usually in the range of 5°–10°/s. When the pitch angle is set to 6°, the calculated value of wind energy utilization coefficient is 0.3289, which is 31.48% lower than the original 0.48, that is, the load shedding ratio of the wind turbine is 31.48%. Considering the process of monitoring and control delays, the time taken by the wind turbine to achieve power regulation through pitch angle control is generally in the order of a few seconds to a dozen seconds, which is in line with the time requirements of the primary frequency regulation process of the power system.
Since wind turbine output is a function of wind speed, the wind turbine flexibility resource model is related to wind turbine output, and there is uncertainty in the size of the wind turbine flexibility resource when wind speed fluctuates. Normally, the flexibility resources obtained by the wind turbine through load shedding are available, and the wind turbine flexibility resource model is as shown in Equation (7):
where is the amount of upward flexibility resource of the WTG at moment t and is the amount of downward flexibility resource of the WTG at moment t. refers to the fluctuation value of wind speed at moment t, which satisfies the probability distribution curve for the fluctuation of wind speed predicted at moment t.
4. Operational Flexibility Assessment of Power Systems
In order to construct the wind power system operation flexibility assessment model, this section firstly studies the flexibility balance of the wind power system, modeling the system flexibility resource demand and dispatchable flexibility resource (e.g., thermal units, hydro, potentially shared energy storage [27]) respectively, and substituting the wind speed fluctuation value to establish a link between the system flexibility assessment and the wind speed fluctuation. Secondly, it constructs the flexibility assessment process of the wind power system, and calculates the flexibility assessment of each time node based on the Monte Carlo simulation method [28]. Thirdly, the flexibility assessment process of the wind power system is constructed, and the flexibility risk of the system is calculated at each time point based on Monte Carlo simulation [28], so as to realize the scientific assessment of the operational flexibility of the wind power system. This risk quantification is critical as deficits in operational flexibility can precipitate cascading failures during contingencies [29].
4.1. Resource Balancing Study of Wind Power Electric System Flexibility
Flexibility resource requirement is generally defined as the difference between the deviation of the actual value of the load from the forecast and the deviation of the actual value of the wind power output from the planned value, see Equation (8):
where is the flexibility resource demand of the system at time t, denotes all operating WTGs, is the actual value of load at time t, is the forecast value of load at time t, is the actual value of wind power output at time t, and is the planned value of wind power output at time t. For the wind speed fluctuation scenario, the wind power output actual value and planned value expressions are shown in Equation (9):
where denotes the predicted wind speed at moment t.
When the flexibility resource requirement is positive, the system needs a sufficient amount of up-scheduled flexibility resources. When the flexibility resource requirement is negative, the system requires a sufficient amount of downward scheduling flexibility resources. The amount of upward and downward scheduling flexibility resources is shown in Equation (10):
where G denotes all operating thermal units, is the maximum output of thermal unit g, is the minimum output of thermal unit g, is the output of thermal unit g at moment t, is the upward climb rate of thermal unit g, is the downward climb rate of thermal unit g, and is the time interval.
4.2. Flexibility Assessment Process for Wind Power Electricity Systems
In order to quantify the risk of insufficient flexibility of the power system containing large-scale wind farms, the system flexibility assessment process is set up as follows, and the assessment process is shown in Figure 5.
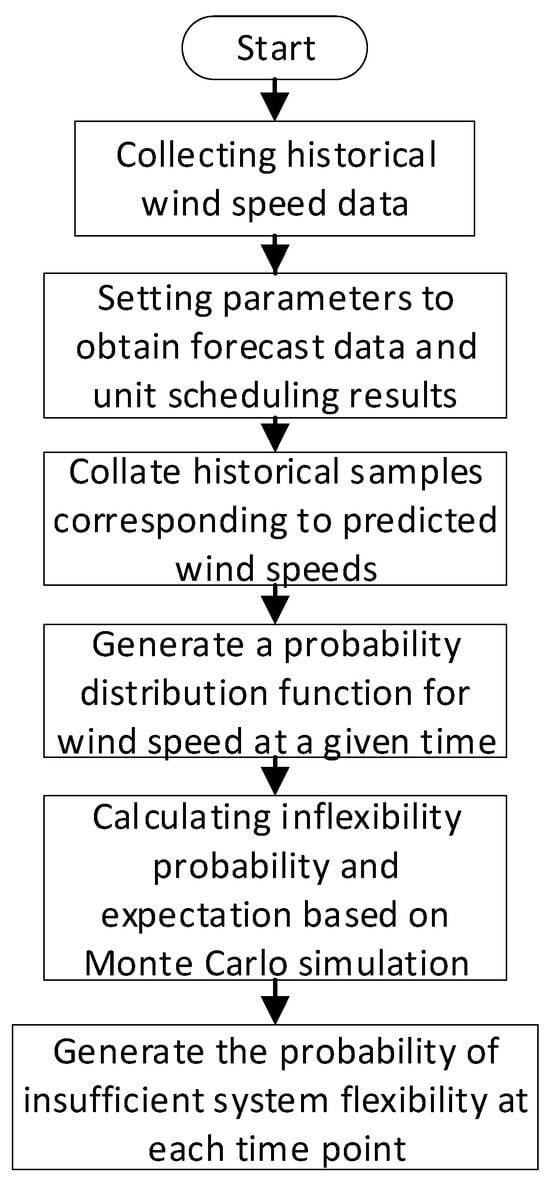
Figure 5.
Flowchart of system flexibility assessment.
Step 1: Collect historical wind speed data.
Step 2: Set the time interval, thermal power, and wind turbine parameters to obtain the forecast data of wind speed and load and turbine operation data.
Step 3: Compile samples of wind speed fluctuations within one hour of the predicted wind speed for the wind speed prediction data.
Step 4: Based on the historical wind speed samples, generate the probability distribution function of wind speed within a certain period of time.
Step 5: Based on the Monte Carlo simulation, carry out N sampling of wind speed at each time node, determine whether its flexibility resources meet the demand, and calculate the probability and expectation of wind abandonment and load cutting. See Equations (11) and (12):
where is the system wind abandonment probability at moment t, is the number of times the up-scheduled flexibility resource does not meet the system demand in the Monte Carlo simulation at moment t; is the system load shedding probability at moment t, is the number of times the down-scheduled flexibility resource does not meet the system demand in the Monte Carlo simulation at moment t.
Step 6: Generate the probability and expectation of insufficient flexibility of the system under each time node.
5. Simulation Analysis
5.1. Scene Setting
In order to verify the validity and reasonableness of the proposed power system flexibility resource assessment model, the set up of the example system consists of thermal power units and wind turbines, the rated wind speed of the wind turbines is 13 m/s, the cut-in wind speed is 3 m/s, the cut-out wind speed is 25 m/s, the turbine’s fixed load shedding ratio is 10%, the maximum load shedding ratio is 20%, the unit’s capacity parameter is shown in Table 1, and the predicted values of wind speed and load are shown in Figure 6. The wind speed fluctuates according to the distribution of historical wind speed data, and the load is evenly distributed and fluctuated within ±5% of the predicted value.

Table 1.
Parameters of the case study system.
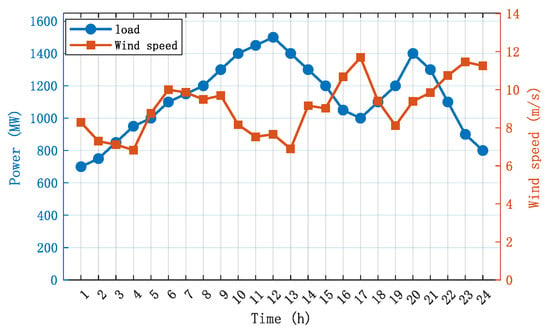
Figure 6.
Load and wind speed forecast chart.
5.2. Model Validation Analysis
The wind speed and load are sampled 1000 times under each time node, respectively, and the passive wind abandonment and load cutting probabilities and expectations of the system for 24 h are calculated as shown in Figure 7 and Figure 8.
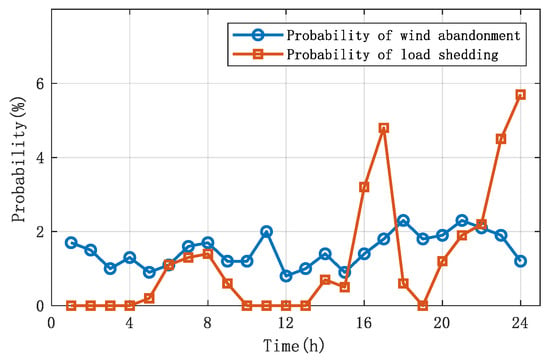
Figure 7.
Diagram of system wind abandonment and load shedding probability.
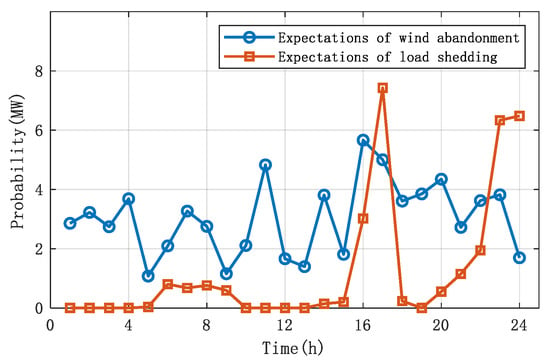
Figure 8.
Diagram of system wind abandonment and load shedding expectation.
From Figure 7 and Figure 8, it can be seen that the trends of wind abandonment probability and wind abandonment expectation are close to each other, and the trends of load shedding probability and load shedding expectation are also close to each other, and that high inflexibility probability tends to imply high inflexibility expectation in most cases.
Comparing the change in wind abandonment probability and cut-load probability, it can be seen that the wind abandonment probability exists in the system in the time period of 1~24 h, fluctuating around 1%~2%, while the cut-load probability occurs in the time periods of 6~9 h, 14~18 h, and 20~24 h, and combining with the predicted value of the wind speed, the cut-load probability under the moments when the predicted value of the wind speed is higher than 10.5 m/s is higher except for the moments when the predicted value of the wind speed is higher than 10.5 m/s at the time periods of 16~17 h and 22~24 h. The rest of the moments are lower than the probability of wind abandonment. The reason for this is that load shedding is usually caused by the actual value of the load being higher than the predicted value and the actual value of wind speed being lower than the predicted value, while wind abandonment occurs for the opposite reason to load shedding.
The maximum output of the wind turbine is a cubic function of the wind speed, and for the same amount of fluctuation, the power deviation caused by a larger wind speed is higher than that caused by a smaller wind speed, so the probability of abandoning the wind is higher than the probability of load shedding in most moments. However, when the wind speed is too high, the probability of increase in wind speed fluctuation is much smaller than the probability of decrease, which is in line with the “long-tailed” feature of the Weibull distribution of wind speed. This leads to the fact that when the predicted wind speed is high, the number of cut-loads in the sample is higher than the number of abandoned winds, so that the cut-load probability is higher than the abandoned wind probability in some of the high wind speed sections in the image.
Combined with Figure 6, the cut-load probability and expectation is very similar to the variation in the predicted wind speed when the wind speed is higher than 8.3 m/s. In the 1~4 h, 10~13 h, and 19 h times when the wind speed is lower than 8.3 m/s, there is no load shedding probability in the system because the predicted wind speed is not high enough. When the wind speed is within 8.3~10.5 m/s, the wind speed fluctuation distribution is nearly symmetrical, and the higher the wind speed is, the higher the probability of system load cutting is. When the wind speed is higher than 10.5 m/s, the probability of decreasing wind speed fluctuation is much higher than the probability of increasing wind speed fluctuation, which further improves the probability and expectation of system load shedding. At 12 h when the predicted load value is the largest, due to the lower predicted wind speed, the power deviation caused by the decrease in wind speed fluctuation is smaller, and the system load shedding probability is zero only because the load fluctuation is not enough to exhaust the system dispatchable flexibility resources.
The wind abandonment probability and expected changes in the wind speed range of 6~12 m/s are different from the predicted wind speed change trend. In the time period when the wind speed is 6~8.3 m/s, although the reduced fluctuation of wind speed does not cause load cutting probability, the power deficit caused by the increased fluctuation of wind speed is larger, which makes the system have a certain probability of wind abandonment. When the wind speed is above 8.3 m/s, due to the right skewness of the wind speed distribution, although the increase in wind speed will lead to a gradual expansion of the power deficit, the probability of increasing fluctuations in wind speed gradually becomes smaller and almost cancels out the effect of the increase in wind speed, so the probability of abandoning the wind and the expectation of abandoning the wind do not show a large difference between the high wind speed and the low wind speed on the graph.
5.3. Impact Analysis of Wind Turbine Derating Ratio Settings on System Flexibility
In order to analyze the impact of fan operation load shedding ratio setting on the risk of system load cutting, the fan operation load shedding ratio was set to 5%, 8%, 11%, 14%, 17%, and 20%, respectively, and the data of the 24 h with the highest load cutting probability and the 17 h with the highest load cutting expectation were taken, and Figure 9 shows the change in the system load cutting indicator data.
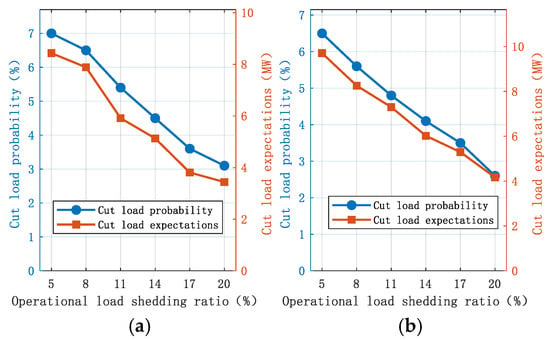
Figure 9.
Diagram of the impact of turbine operating load shedding ratio on system load shedding risk. (a) Probability of System Load Reduction and Changes in Expected Index Values Under 24-h Load Reduction Rate. (b) Probability of System Load Reduction and Changes in Expected Index Values Under 17-h Load Reduction Rate.
Figure 9a shows the variation in system load shedding probability and expectation index value with operating load reduction ratio at 24 h, and Figure 9b shows the variation in system load shedding probability and expectation index value with operating load reduction ratio at 17 h. With the increase in load shedding ratio, the system load shedding probability and expectation both show a decreasing trend, and after the increase in operating load shedding ratio to the maximum load shedding ratio, the system load shedding probability of 24 h is 3.1%, and the system load shedding expectation of 17 h is 4.168 MW. Only adjusting the wind turbine operating load shedding ratio cannot eliminate the risk of system load shedding, and the system needs to increase the standby power of the upward scheduling flexible resources through other ways. The system needs to improve the upper dispatch flexible resource standby power through other ways.
To analyze the impact of the turbine operation load shedding ratio setting on the system load shedding risk, take the 18 h data with the highest passive wind abandonment probability and the 16 h data with the highest passive wind abandonment expectation, and Figure 10 shows the change in the system passive wind abandonment index data. Figure 10a shows the variation in the system passive wind abandonment probability and expectation index value with the operating load shedding ratio for 18 h, and Figure 10b shows the variation in the system passive wind abandonment probability and expectation index value with the operating load shedding ratio for 16 h. As shown in the figure, with the increase in load shedding ratio, the system passive wind abandonment probability and expectation both show an upward trend, and when the operation load shedding ratio is 5%, the system passive wind abandonment probability of 18 h is 3.1%, and the system passive wind abandonment expectation of 16 h is 7.227 MW. Only adjusting the turbine operation load shedding ratio can not eliminate the risk of system passive wind abandonment, and the system needs to increase the standby power of the under-scheduling flexible resources through other ways. The system flexibility index within 18 h is shown in Table 2.
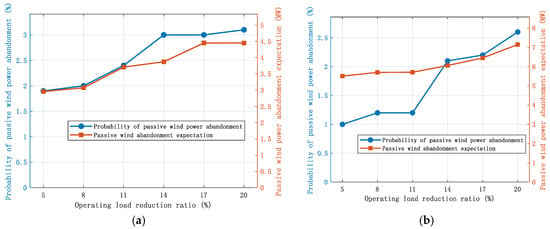
Figure 10.
Diagram of the impact of turbine operating load shedding ratio on passive wind abandonment risk. (a) Changes in the probability of passive wind power curtailment and the expected index value under an 18-h operational load reduction rate. (b) Changes in the probability of passive wind power curtailment and the expected index value under a 16-h operational load reduction rate.

Table 2.
Within 18 h, system flexibility index.
In addition, it can be seen that the turbine load shedding operation can not take into account the upper scheduling flexible resources and lower scheduling flexible resources, and in the process of adjusting the turbine load shedding ratio, the reduction in the wind abandonment risk will definitely cause an increase in the risk of load shedding. Wind turbine load shedding operation can improve the system’s flexible resource reserve to a certain extent, but can not be like thermal power. At the same time, energy storage has a stable two-way regulation ability, can not replace the traditional frequency control unit’s flexible reserve status, and needs to reasonably dispatch thermal power units to meet the system’s flexible resource demand.
Data sourced from the North Dakota Agricultural Weather Network [30].
6. Conclusions
The high penetration of variable renewables poses significant challenges to power system flexibility. To enhance the operational security of power systems with high penetration of renewable energy and improve the grid-friendliness of renewable energy integration, utilizing wind turbines under load shedding operation to provide flexible resources will become an important trend in the development of renewable energy power systems. This paper investigates the flexibility assessment method for power systems considering the uncertainty of flexible resources of wind turbines under deloaded operation. Firstly, according to the flexibility supply control model of WTs under load shedding operation, the analytical relationship between turbine output, flexible resources, and wind speed under a specific wind energy conversion coefficient is constructed. Secondly, combined with the probabilistic wind speed model based on the nonparametric kernel density estimation, the uncertainty model of wind turbine flexible resources is constructed according to the analytical relationship between wind turbine flexible resources and wind speed. Thirdly, the Monte Carlo simulation is used to obtain the sampling of wind speed, and a power system flexibility assessment method is proposed to consider the uncertainty of flexible resources under wind turbine load shedding operation. Finally, the validity and reasonableness of the proposed method is verified through case studies, and it is analyzed that the wind turbine load shedding operation can enhance the system’s flexible resource backup to a certain degree, but it cannot have a stable bi-directional regulation capability like thermal power and energy storage at the same time.
7. Practical Significance
Strategic Planning for Renewable Integration: For system planners, our findings offer a data-driven basis for long-term flexibility resource allocation. The model clarifies the role and limits of wind deloading, demonstrating that it is a valuable but non-firm and unidirectional resource. This insight is critical for determining the optimal portfolio of flexibility resources (e.g., the necessary capacity of fast-ramping gas units, energy storage, or demand response) required to complement wind power and ensure resource adequacy, thereby guiding cost-effective grid evolution.
Foundation for Market and Regulatory Innovation: By quantifying the flexibility service from deloaded wind turbines, our work lays the groundwork for integrating wind power into ancillary service markets. Regulators and market designers can use this methodology to develop fair compensation mechanisms for these services, incentivizing wind farms to transition from pure energy producers to active grid participants, ultimately enhancing overall system resilience and renewable hosting capacity.
Author Contributions
Methodology, G.J., J.X. and Y.M.; software, Y.S. and P.F.; validation, H.Y. and X.G.; data curation, Y.C., M.C. and M.W.; writing—original draft preparation, M.C., M.W. and Y.M. All authors have read and agreed to the published version of the manuscript.
Funding
This work was supported by the Science and Technology Project of State Grid Anhui Electric Power Co., Ltd. (No. B31209240009).
Data Availability Statement
The data that support the findings of this study are available from the corresponding author upon reasonable request.
Conflicts of Interest
Authors Guifen Jiang, Jiayin Xu, Yuming Shen, Peiru Feng, Hao Yang, Xu Gui were employed by the company Economic and Technology Research Institute of State Grid Anhui Electric Power Co., Ltd. The remaining authors declare that the research was conducted in the absence of any commercial or financial relationships that could be construed as a potential conflict of interest.
References
- Ma, Y.-H.; Liu, C.; Wei, M.; Shen, Y.-M.; Xie, W.; Yang, H.-J.; Zhang, D.-B.; Dong, J.-Z. Research on power system flexibility enhancement method based on pre-selection of structure adjustment strategy. Int. J. Electr. Power Energy Syst. 2024, 157, 109759. [Google Scholar] [CrossRef]
- Feng, P.-R.; Xu, J.-Y.; Gui, X.; Liu, H.; Jiang, G.-F.; Ma, Y.-H.; Rui, C.-H. Rolling planning model for high proportion renewable energy generation power system considering frequency security constraints. AIP Adv. 2024, 14, 105202. [Google Scholar] [CrossRef]
- Pan, C.-C.; Shao, C.-Z.; Hu, B.; Xie, K.-G.; Li, C.-Y.; Ding, J.-F. Modeling the reserve capacity of wind power and the inherent decision-dependent uncertainty in the power system economic dispatch. IEEE Trans. Power Syst. 2023, 38, 4404–4417. [Google Scholar] [CrossRef]
- Vidyanandan, K.V.; Senroy, N. Closure to discussion on “primary frequency regulation by deloaded wind turbines using variable droop”. IEEE Trans. Power Syst. 2014, 29, 414–415. [Google Scholar] [CrossRef]
- Ulbig, A.; Andersson, G. Analyzing operational flexibility of electric power systems. Int. J. Electr. Power Energy Syst. 2015, 72, 155–164. [Google Scholar] [CrossRef]
- Zhao, J.-Y.; Zheng, T.-X.; Litvinov, E. A unified frame work for defining and measuring flexibility in power system. IEEE Trans. Power Syst. 2016, 31, 339–347. [Google Scholar] [CrossRef]
- Xiao, D.-Y.; Wang, C.-M.; Zeng, P.-L.; Sun, W.-Q. Power source flexibility evaluation considering renewable energy generation uncertainty. Electr. Power Autom. Equip. 2015, 35, 120–125. [Google Scholar]
- Zhang, Y.-Y.; Zhao, H.-R.; Qi, Z.; Li, B.-K. A two-stage low-carbon economic coordinated dispatching model for generation-load-storage resources considering flexible supply-demand balance. Appl. Energy 2024, 373, 123981. [Google Scholar] [CrossRef]
- Ma, J.; Silva, V.; Belhomme, R.; Kirschen, D.S.; Ochoa, L.S. Evaluating and planning flexibility in sustainable power systems. IEEE Trans. Sustain. Energy 2013, 4, 200–209. [Google Scholar] [CrossRef]
- Jiang, S.-Q.; Ma, L.; Pei, W.; Xiao, H. Energy storage configuration in transactive distribution systems incorporating integrated network flexibility. Appl. Energy 2025, 402, 126818. [Google Scholar] [CrossRef]
- Lee, S.; Jung, J. Improving distribution system flexibility using electric vehicles under the distributed energy resource management system framework. Renew. Sustain. Energy Rev. 2025, 226, 116292. [Google Scholar] [CrossRef]
- Li, X.; Xie, K.-G.; Shao, C.-Z.; Hu, B.; Huang, W.; Pan, C.-C. A Sensitivity-Based Rolling Operational Reliability Evaluation Method Following the Changing Available Generation Capacity of Renewable Energies. IEEE Trans. Power Syst. 2024, 40, 166–177. [Google Scholar] [CrossRef]
- Ma, Y.-H.; Liu, C.; Yang, H.-J.; Zhang, D.-B. Robust optimization of unit commitment with wind power considering composite flexibility constraints. Int. J. Electr. Power Energy Syst. 2023, 151, 109146. [Google Scholar] [CrossRef]
- Nukic, E.; Levi, V.; Cetenovic, D.; Vojnovic, N. Probabilistic Flexibility Assessment of Shared Charging Stations for Electric Vehicles. Sustain. Energy Grids Netw. 2025, 44, 102014. [Google Scholar] [CrossRef]
- Li, J.-H.; Yu, Z.-B.; Mu, G.; Li, B.-J.; Zhou, J.-X.; Yan, G.-G.; Zhu, X.-X.; Li, C.-P. An assessment methodology for the flexibility capacity of new power system based on two-stage robust optimization. Appl. Energy 2024, 376, 124291. [Google Scholar] [CrossRef]
- Wang, Y.; Lin, Y.-K.; Lan, X.-M.; Zhao, H.-S. Flexibility Analysis of Conventional Generation with Random Fluctuation Renewable Energy. Electr. Power Constr. 2017, 38, 131–137. [Google Scholar]
- Lannoye, E.; Flynn, D.; O’ Malley, M. Evaluation of power system flexibility. IEEE Trans. Power Syst. 2012, 27, 922–931. [Google Scholar] [CrossRef]
- Ma, J.-J.; Zhang, S.-H.; Li, X.; Zhou, B. Stochastic Assessment of Adequacy and Flexibility of Power Generation Systems. Power Syst. Technol. 2019, 43, 3867–3874. [Google Scholar]
- Lu, Z.-X.; Li, H.-B.; Qiao, Y. Flexibility Evaluation and Supply/Demand Balance Principle of Power System With High-penetration Renewable Electricity. Proc. CSEE 2017, 37, 9–19. [Google Scholar]
- Lu, Z.-X.; Li, H.-B.; Qiao, Y. Probabilistic flexibility evaluation for power system planning considering its association with renewable power curtailment. IEEE Trans. Power Syst. 2018, 33, 3285–3295. [Google Scholar] [CrossRef]
- Brhane, G.Y.; Oh, E.; Son, S.Y. Virtual Energy Storage System Scheduling for Commercial Buildings with Fixed and Dynamic Energy Storage. Energies 2024, 17, 3292. [Google Scholar] [CrossRef]
- El Archi, C.Z.; Nasser, T.; Essadki, A.; Alvarado, J. Real Power Control: MPPT and Pitch Control in a DFIG Based Wind Turbine. In Proceedings of the 3rd International Conference on Advanced Communication Technologies and Networking (CommNet), Marrakesh, Morocco, 4–6 September 2020; pp. 1–6. [Google Scholar]
- Tun, Z.M.; Seangwong, P.; Fernando, N.; Siritaratiwat, A.; Khunkitti, P. Power Generation Enhancement of Surface-Mounted Permanent Magnet Wind Generators Using Eccentric Halbach Array Permanent Magnets. Sustainability 2025, 17, 5893. [Google Scholar] [CrossRef]
- Ding, L.Y.; Ke, S.; Yang, J.; Shi, X.Y.; Fan, P.X.; Crisostomi, E. A heuristic-fuzzy improved virtual synchronous generator control strategy for charging station frequency regulation Author links open overlay panel. J. Energy Storage 2024, 99, 113411. [Google Scholar] [CrossRef]
- Ma, Y.-H.; Xie, K.-G.; Zhao, Y.-N.; Yang, H.-J.; Zhang, D.-B. Bi-objective Layout Optimization for Multiple Wind Farms Considering Sequential Fluctuation of Wind Power Using Uniform Design. CSEE J. Power Energy Syst. 2022, 8, 1623–1635. [Google Scholar]
- Xin, P.-Z.; Liu, Y.; Yang, N.; Song, X.-K.; Huang, Y. Probability distribution of wind power volatility based on the moving average method and improved nonparametric kernel density estimation. Glob. Energy Interconnect. 2020, 3, 247–258. [Google Scholar] [CrossRef]
- He, Y.; Wu, H.-B.; Wu, A.Y.; Li, P.; Ding, M. Optimized shared energy storage in a peer-to-peer energy trading market: Two-stage strategic model regards bargaining and evolutionary game theory. Renew. Energy 2024, 224, 120190. [Google Scholar] [CrossRef]
- Han, X.-Q.; Qu, Y.; Wang, P.; Yang, J.-H. Four-Dimensional Wind Speed Model for Adequacy Assessment of Power Systems With Wind Farms. IEEE Trans. Power Syst. 2013, 28, 2978–2985. [Google Scholar] [CrossRef]
- Ma, Y.-H.; Huang, R.-S.; Yang, H.-J.; Sun, L.; Zhang, D.-B.; Dong, J.-Z.; Yang, X.-D.; Shen, Y.-M. Security constrained unit commitment with multi-stage corrective control of hybrid AC/DC power systems with VSC-MTDC. Energy 2025, 318, 134871. [Google Scholar] [CrossRef]
- North Dakota Agricultural Weather Network. Weather Data. Available online: https://ndawn.info/index.html (accessed on 1 June 2025).
Disclaimer/Publisher’s Note: The statements, opinions and data contained in all publications are solely those of the individual author(s) and contributor(s) and not of MDPI and/or the editor(s). MDPI and/or the editor(s) disclaim responsibility for any injury to people or property resulting from any ideas, methods, instructions or products referred to in the content. |
© 2025 by the authors. Licensee MDPI, Basel, Switzerland. This article is an open access article distributed under the terms and conditions of the Creative Commons Attribution (CC BY) license (https://creativecommons.org/licenses/by/4.0/).