Abstract
This study investigates how pulsatile injection influences two-phase displacement efficiency in a pore-scale micromodel, with emphasis on the roles of porosity, amplitude, and frequency. Simulations were performed using a conservative level-set formulation in COMSOL Multiphysics across three porosity levels (φ ≈ 0.75, 0.50, 0.30) and a range of amplitudes (25–75%) and frequencies (0–200 Hz), with fixed fluid properties and wettability. In the baseline (non-pulsed) regime, residual saturation decreased with increasing inlet velocity but reached a plateau, indicating a velocity-limited mobilization. Superimposing sinusoidal pulsations led to improved displacement only within finite frequency bands. For each porosity, a “working window” emerged, where residual saturation reached a minimum: this optimum shifted toward lower frequencies and higher amplitudes with decreasing φ. These trends were quantified using the normalized residual saturation and linked to the dimensionless Strouhal number , defined via the capillary time scale. Phase maps and velocity fields confirmed that at optimal conditions, pulsations activated transverse throats and suppressed capillary bridges, while excessive frequencies led to inefficient re-entrapment. A fixed observation time was used to enable consistent comparison across regimes. The findings delineate the parameter ranges under which pulsations yield tangible benefit and suggest practical guidance for tuning flow modulation based on pore structure.
1. Introduction
Pulsatile injection at the pore scale is treated as a controlled way to periodically modulate velocity and pressure fields in order to weaken capillary barriers and mobilize trapped volumes of the displaced phase. At the microscale, the system response is fundamentally nonlinear: efficiency depends not only on the baseline flow velocity but also on the parameters of the external modulation—amplitude and frequency—within which an “operating window” emerges [1,2]. In microchannels, inertial effects (flow focusing), dynamic interfacial curvature, and resonant responses are observed; together they define characteristic frequency ranges beyond which oscillations are screened by viscosity and the benefit vanishes [3,4,5]. At larger scales, periodic injection reduces the apparent flow resistance through an inertial “rocking” of capillary traps [6].
The geometry of the pore space substantially reshapes the displacement behavior. Disorder and the distribution of pore throats govern the morphology of the advancing front and the residual saturation, while the transition from capillary-controlled to viscosity-dominated flow is accompanied by interfacial reorganization and pressure pulsations [7,8,9]. For capillary drainage at the pore scale, the roles of gravity and pore–network connectivity have also been demonstrated [10]. Micromodel methodologies and modern imaging (optical/µCT) enable a direct linkage between phase maps and macroscopic efficiency metrics and have therefore become standard in two-phase microfluidic studies [11,12].
From the computational standpoint, the volumetric interface-capturing approaches—VOF and the conservative level-set—provide the most reliable reproduction of interfacial dynamics, with proper treatment of surface tension and wettability [13,14,15,16]. Their applicability in microchannels has been confirmed by comparative studies, while modern CFD formulations augment these methods with refined interface compression schemes and adaptive time integration [15,16,17]. In parallel, high-velocity 4D tomography is advancing, enabling validation of simulations on real samples of porous materials [18].
The practical relevance of pulsation regimes is reinforced by applications in gas storage/transfer and enhanced oil recovery (EOR). For partially saturated media, the sensitivity of air flow to the pore–network structure has been demonstrated [19]; for CO2 systems, numerical validation and the search for optimal frequency ranges at the pore scale have been reported [20]; and at the macroscopic level, models of periodic injection–withdrawal cycles have been developed, reaching a quasi-steady balance after several cycles [21]. For pressure pulses, attenuation laws for low-frequency pressure and the conditions for “useful” penetration into the bulk have been established [22]; reviews on oscillatory flows in porous media and on modern microfluidic methods have also been published, providing a methodological framework for comparing experiment and numerical modeling [23,24]. We also highlight pore-scale maps of displacement regimes and the regularities of front pattern transitions, which provide a solid basis for interpreting the frequency–amplitude–porosity relationships [25].
In this work, baseline (non-pulsed) and pulsatile displacement regimes are systematically compared in a pore-scale micromodel at three porosity levels (≈0.75, 0.50, 0.30) under identical fluid properties and wettability conditions. At a selected baseline velocity, a frequency–amplitude map is constructed; the mobilization amplitude threshold, frequency intervals of minimum residual saturation, and their shift with decreasing porosity are identified. The numerical setup is based on a two-dimensional laminar two-phase model with a conservative level-set formulation and a volumetric implementation of surface tension; the parameter choices are validated against a canonical drop formation/pinch-off problem.
Dimensional Framework. To generalize the findings beyond our specific setup, we introduce key dimensionless groups: the Capillary number (viscous vs. capillary forces), the Reynolds number (inertia vs. viscosity), and the Strouhal number (dimensionless frequency). Here, is the baseline inlet velocity, the pulsation frequency, a characteristic length (channel length), and are viscosity and density of the displacing phase, and is interfacial tension. These groups allow us to interpret the observed working window (finite ranges of frequency and amplitude that minimize residual saturation) in a system-independent manner.
2. Materials and Methods
2.1. Geometry Model and Boundary Condition
The study is conducted on a planar pore-scale micromodel represented by a rectangular channel of size L × W (2.5 × 1 mm) with a system of impermeable spherical particles (“grains”) forming a network of pores and throats (Figure 1) [26]. A geometry with porosity φ ≈ 0.75 used as the baseline. To assess the influence of pore–space architecture, additional configurations with φ ≈ 0.50 and φ ≈ 0.30 are constructed while keeping the outer dimensions of the domain unchanged (Figure 2). The porosity is computed as the ratio of the void area to the area of the computational domain. The grains are treated as a solid phase. This set enables a stepwise separation of the geometric effect (changes in connectivity and throat width) from the kinematic effect (pulsation amplitude and frequency).
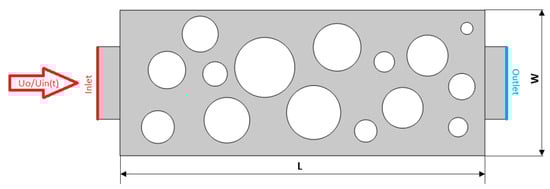
Figure 1.
Geometry and boundary conditions: Inlet = ; Outlet—; walls and grains—no-slip, wetted.
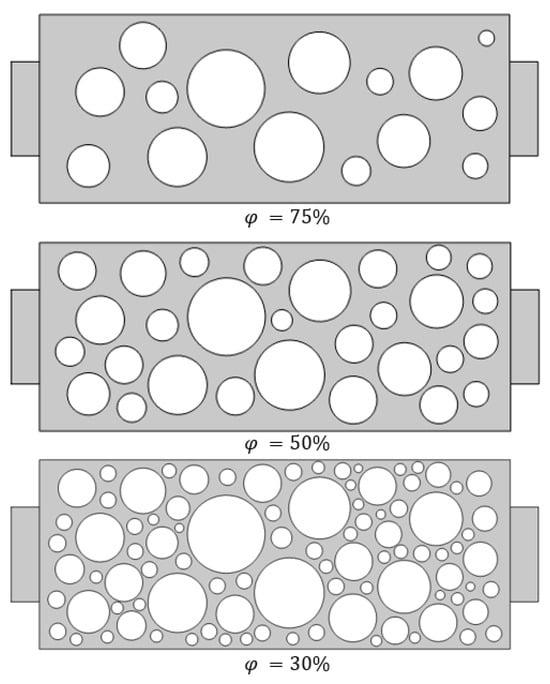
Figure 2.
Micromodel geometry variants with different porosities.
The displaced phase is a liquid with properties and . The displacing liquid has and . The interfacial tension is taken constant, . Channel walls and grain surfaces are specified as wetted (wetted wall) with a static contact angle θ ≈ 135° gravity is neglected due to the microscale. Velocity is prescribed at the inlet and zero gauge pressure at the outlet (Figure 1).
2.2. Numerical Setup
Two-phase microfluidic flow is described by the incompressible Navier–Stokes equations for laminar conditions, coupled with an interface-tracking equation. Accordingly, the system comprises the momentum and continuity equations for a Newtonian fluid together with a level-set transport equation that governs the evolution of the phase interface [27].
To account for the moving liquid–liquid interface, we employ the mass-conserving variant of the level-set method as implemented in COMSOL’s two-phase flow interface. The method introduces an auxiliary scalar field , on a fixed Eulerian mesh that labels the phases: in one liquid and in the other, while within a thin interfacial region ϕ varies smoothly from 0 to 1 [28].
In our simulations, the level-set function ϕ satisfies a convection–diffusion equation coupled to the velocity field. The level-set transport can be written in a conservative form [27]:
Here, is the local fluid velocity, and the right-hand side contains two numerical stabilization terms [29]. The parameter ε sets the thickness of the diffuse interfacial layer and is typically chosen on the order of the mesh size [10]. The first term, , adds a small isotropic artificial diffusion that smooths the interface and suppresses spurious oscillations and excessively steep gradients [27]. The second term, , is compressive (often interpreted as reinitialization/stabilization): it sharpens the front, steepens the transition, and counteracts numerical smearing of the interface [27]. The coefficient is a reinitialization parameter that controls the balance between diffusive smoothing and compressive sharpening; it is tuned so that the interfacial profile remains stable and sharp without altering the physical motion of the interface [30].
2.3. Pulsatile Injection
The influence of pulsations was investigated superimposed on a common baseline flow with an inlet velocity:
The amplitude was prescribed as a fraction of (25, 50, 75%), and the frequency covered , where corresponds to the non-pulsed regime. Immediately before the pulsation sweeps, for each geometry a baseline non-pulsed series was run.
In all pulsation series, the residual saturation was evaluated at a fixed injection time (identical for all ). Accordingly, the frequency trends can be interpreted as an “early-time residual” after the same injection duration.
To ensure consistent comparison across all parametric variations, the residual saturation was evaluated at a fixed observation time of . While a breakthrough-based or steady-state reference might more directly reflect ultimate displacement efficiency, such a criterion is difficult to apply uniformly—especially in oscillatory regimes where breakthrough can be intermittent or delayed, and where the phase front may evolve non-monotonically. By selecting a common snapshot time, we maintain a controlled basis for quantifying the relative impact of frequency and amplitude across different porosities and flow conditions. Notably, in the non-pulsed baseline at , the breakthrough time was approximately , ensuring that the chosen observation time captures post-breakthrough saturation for all cases. While this approach may slightly underrepresent long-term mobilization, it provides a consistent and conservative framework for comparing relative trends.
2.4. Dimensional Framework
To generalize the findings beyond the specific setup, we introduce key dimensionless groups that govern the dynamics of pulsating two-phase displacement:
Here, is the baseline inlet velocity, the pulsation frequency, and a characteristic length (the channel length in this study). The viscosity and density refer to the displacing phase, while is the interfacial tension between the fluids. The characteristic throat radius defines the capillary timescale , which serves as a scaling parameter for pulsation frequency.
These groups quantify the competition between viscous, capillary, and inertial effects and allow us to interpret the observed working window (finite ranges of frequency and amplitude minimizing residual saturation) in a system-independent manner. They are further summarized in Table 1, and their numerical ranges used in this study are provided for clarity.

Table 1.
Dimensionless groups and characteristic parameters used in the pulsatile displacement analysis.
The characteristic radius was estimated directly from the micromodel geometry (L = 2.5 mm, W = 1 mm) as half of the narrowest gap between adjacent grains: 30 µm (φ = 0.75), 20 µm (φ = 0.50), and 12 µm (φ = 0.30). These values correspond to capillary entry pressures of , providing a physically consistent basis for nondimensionalization.
2.5. Validation
To verify the numerical setup, we reproduced the benchmark problem from Bashir et al. [27]: formation of dispersed-phase droplets in a T-junction microchannel at various contact angles and viscosity ratios. The simulation was performed in an unsteady formulation using the level-set method. Velocity boundary conditions were matched to the reference. The primary metric was the droplet pinch-off time; additionally, we compared the interfacial morphology at neck rupture and the shape of the formed droplet. Our pinch-off time of 27 ms falls within the ranges reported by Bashir et al. [27], and the characteristic frames at pinch-off and of the stabilized droplet are visually reproduced (Figure 3). This confirms the correct balance of viscous–capillary forces, the proper treatment of wettability, and numerical stability of the scheme at the chosen mesh and time-step settings, enabling confident transfer of the model to pulsatile displacement in porous geometries.
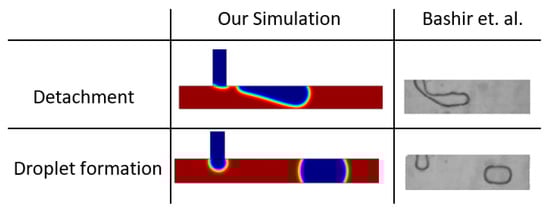
Figure 3.
Validation of the numerical setup on the droplet formation problem in a T-junction microchannel [27].
While the T-junction benchmark verifies interface tracking (pinch-off timing and morphology), it does not replicate oscillatory two-phase invasion in narrow throats with capillary trapping. Thus, our validation confirms numerical stability and wettability handling, but oscillatory entry dynamics remain to be experimentally validated.
2.6. Mesh Sensitivity Analysis
To assess the influence of mesh resolution on simulation results, a mesh sensitivity study was conducted. Three levels of mesh refinement were tested: Coarse (5571 elements), Fine (7063 elements), and Extra Fine (10,224 elements). The residual saturation was evaluated at a fixed simulation time for each case.
As summarized in Table 2, the computed value of varies modestly across mesh types. The difference between the Fine and Extra Fine meshes is only 0.2%, while the Coarse mesh yields a 2.6% lower value. This indicates that the solution is mesh-independent within an acceptable tolerance. Accordingly, the fine mesh was used in all simulations presented in the main results to balance accuracy and computational cost.
Table 2.
Mesh sensitivity analysis for residual saturation.
3. Results and Discussion
It is investigated how pulsations affect the residual saturation in a porous medium model. For clarity, the results are grouped by porosity and amplitude, while the frequency is varied over the same discrete set. The non-pulsed baseline serves as a reference point. The lower the residual saturation, the more effective the displacement.
3.1. Baseline Regime
To establish a reference point, we first evaluate non-pulsed steady flow at different inlet velocities. These simulations reveal a clear relationship between the baseline capillary number and the resulting residual saturation , as shown in Figure 4. At low velocities (e.g., ), the displacement is dominated by capillary forces, resulting in early breakthrough and limited sweep efficiency. The non-wetting phase progresses primarily through large, well-connected pores, bypassing tighter regions and leaving behind trapped ganglia.
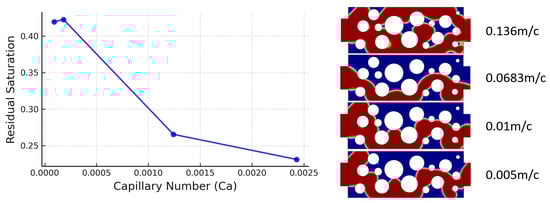
Figure 4.
Effect of baseline velocity on residual saturation (left) and corresponding phase distributions (right). The displacing phase is shown in red, the displaced phase in blue. Increasing leads to lower , but the benefit saturates at higher velocities. Capillary numbers correspond to , with from bottom to top.
As the inlet velocity increases to intermediate levels (), the advancing interface becomes more stable, and transverse expansion allows the displacing fluid to enter previously uninvaded areas. This corresponds to a sharp decrease in , dropping from ~0.41 to ~0.27. The effect gradually saturates; further velocity increases yield diminishing returns, with only dropping slightly from ~0.27 to ~0.24 between and . This plateau suggests that increasing baseline velocity alone cannot fully eliminate trapped clusters once the dominant flow paths are established.
The corresponding phase maps in Figure 4 (right) visualize the evolution of displacement structure. At low , the front is finger-like and poorly connected. At intermediate velocities, the interface becomes more laterally extended and smoother, indicating enhanced pore-scale mobilization. At high , the interface no longer shows significant structural change, reinforcing the idea of a velocity limit in the absence of pulsing. These observations serve as a benchmark for evaluating the added benefit of oscillatory injection in the following sections.
3.2. Effect of Amplitude and Frequency at Different Porosity Levels
We examine how the oscillation amplitude A and frequency affect displacement efficiency at different porosities. Across all series, the fluid pair, wettability, and baseline velocity were kept fixed. The non-pulsed regime served as a reference. Efficiency was evaluated by the residual saturation. For each geometry we ran frequency sweeps on a common frequency grid at three amplitudes, A = 25, 50, 75% of the baseline velocity. Comparing the results reveals a “working window” of frequencies within which the residual saturation reaches a minimum, as well as an amplitude threshold required to mobilize trapped clusters of the displaced phase. Here we define the working window as the frequency range (for a given amplitude) where the residual saturation is significantly below the non-pulsed baseline. Operationally, window edges can be taken where returns to within ~95–100% of the baseline value. This definition is reproducible and consistent across our frequency sweeps. When the frequency departs from this window—especially toward higher values—the efficiency deteriorates, which we attribute to insufficient time for flow reorganization within the pore network.
To investigate the influence of vibration frequency on displacement efficiency, we analyze the variation in normalized residual saturation as a function of the dimensionless Strouhal number for three porosities: 0.75, 0.50, and 0.30 (Figure 5, Figure 6 and Figure 7). These plots include multiple vibration amplitudes , where is expressed as a fraction of the baseline velocity. The reference saturation corresponds to the non-vibrated case (, i.e., ) for each amplitude.
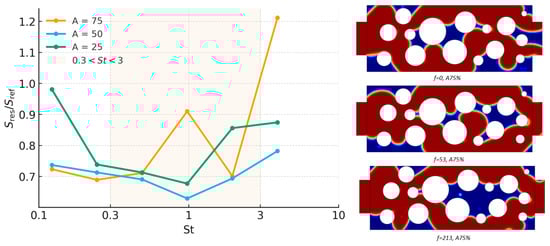
Figure 5.
Residual saturation as a function of Strouhal number for porosity (left); curves correspond to amplitudes . Phase distributions for at , , and are shown (right). Red—displacing phase; blue—displaced phase.
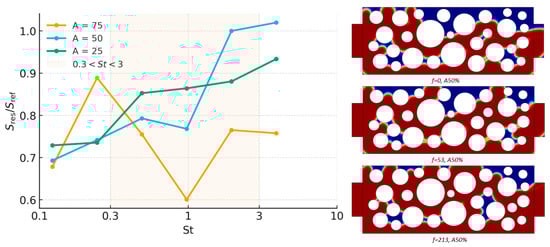
Figure 6.
Residual saturation as a function of Strouhal number for porosity (left); curves correspond to amplitudes . Phase distributions for at , , and are shown (right). Red—displacing phase; blue—displaced phase.
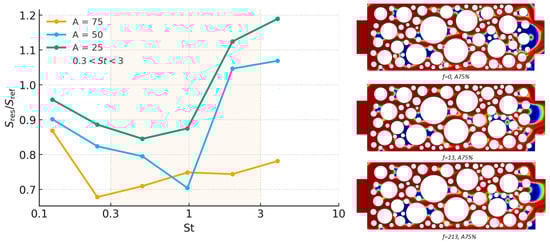
Figure 7.
Residual saturation as a function of Strouhal number for porosity (left); curves correspond to amplitudes . Phase distributions for at , , and are shown (right). Red—displacing phase; blue—displaced phase.
At high porosity (φ = 0.75), the normalized residual saturation reveals a strong dependence on the Strouhal number , particularly under strong pulsations (A = 75%). The trend is clearly non-monotonic: saturation decreases to a minimum near , followed by a sharp increase for . This minimum identifies a frequency regime where the applied pulsations most effectively mobilize the trapped phase.
The minimum around signifies an optimal coupling between the vibration frequency and the characteristic capillary drainage time of the medium. At this point, pulsations help overcome local capillary barriers—acting similarly to mechanical depinning—and support the reorganization of fluid pathways, especially in confined pore throats. This is particularly effective at high amplitudes (A = 75%), where the vibrational energy is sufficient to deform and displace the interface from capillary traps. The increasing trend for suggests diminishing returns: fast oscillations do not allow sufficient time for the interface to reorganize, resulting in inefficient displacement and renewed trapping.
For : The optimum lies at mid frequencies and higher amplitude, consistent with moderate entry thresholds; dimensionless frequency falls in the same narrow band across amplitudes.
At lower porosities (φ = 0.50 and φ = 0.30; Figure 6 and Figure 7), the response of residual saturation to oscillatory forcing exhibits markedly different patterns compared to φ = 0.75. For φ = 0.50 (Figure 6), a shallow minimum in is observed for A = 75% at around St ≈ 1, indicating a moderate resonance effect. However, the benefit is not as pronounced as at higher porosity. For lower amplitudes (A = 25%, 50%), the saturation actually increases monotonically with St, suggesting that the frequency-induced mobilization is insufficient to overcome trapping, and inertial effects begin to dominate sooner.
The corresponding phase maps (Figure 6, right) provide insight into the pore-scale dynamics. At f = 0 Hz, multiple disconnected blue clusters persist, particularly in constricted regions. At f ≈ 53 Hz, a clearer central pathway forms, but narrow throats still contain isolated displaced phase. By f = 213 Hz, the front becomes increasingly fragmented, with no coherent drainage path. This supports the hypothesis that moderate vibration frequencies assist partial remobilization, but the topology of the pore space and reduced connectivity at φ = 0.50 limit full drainage.
For : The optimum remains near ~50 Hz but shifts to mid amplitude (50%), indicating that capillary thresholds increase while the time per cycle is still adequate.
For φ = 0.30 (Figure 7), the influence of vibration becomes even more constrained. The curves for A = 50% and A = 25% show a steep increase in with St, indicating worsening displacement. The high-amplitude case (A = 75%) still exhibits a weak minimum at St ≈ 1, but with much smaller benefit. This implies that as porosity decreases, inertial entrapment and disconnectedness dominate over resonance-induced remobilization.
The phase maps (Figure 7, right) corroborate this interpretation. At f = 0 Hz, a fragmented front is already apparent. At f ≈ 53 Hz, minor improvement is visible in some pore channels, but most of the displaced phase remains locked in corners and constrictions. By f = 213 Hz, the interface is strongly fragmented, and pressure gradients fail to generate coherent movement of the trapped phase. Notably, higher confinement at low φ magnifies the impact of pore structure irregularities, and vibrational forcing cannot compensate for poor connectivity.
For : The optimum shifts to lower frequencies (~8–12 Hz) and higher amplitude (75%), consistent with tighter throats requiring larger pressure swings and longer periods.
Across all porosities, a consistent physical picture emerges linking oscillatory forcing to improved mobilization. As porosity decreases, the network becomes more tortuous and entry capillaries narrower, increasing the capillary entry thresholds. Overcoming them requires (i) a sufficient amplitude of oscillation to depin menisci and (ii) enough time per cycle for interface rearrangement. These conditions define a “working window” in the frequency-amplitude plane, which shifts toward lower frequencies and higher amplitudes as φ decreases.
The phase maps (Figure 5, Figure 6 and Figure 7, right) visualize these dynamics. In the baseline, displacement follows preferential paths with large residual pockets. Near optimal conditions (St ≈ 1), transverse channels are activated, cluster size reduces, and the front becomes smoother and more continuous. At high frequency, the effect is lost—oscillations are too fast to reorganize the interface, and the pattern reverts to disconnected pockets.
Quantitative metrics extracted from the phase maps (e.g., trapped volume, number of disconnected clusters) confirm this transition. These metrics show a distinct minimum at intermediate St, consistent with the Sres/Sref curves. As porosity drops from 0.75 to 0.30, the minimum shifts and becomes shallower—signaling reduced efficiency of dynamic forcing in tight networks.
A mechanistic view is that narrower throats require a larger capillary entry pressure, , with the local throat radius and the contact angle. As porosity decreases, shrinks and rises; therefore, (i) amplitude must be high enough for the oscillatory pressure swing to exceed in a meaningful fraction of throats (mobilization threshold), and (ii) frequency must be low enough to provide time within each cycle for reorganization and drainage of newly opened paths. If frequency is too high, viscous screening prevents the pressure perturbation from penetrating the network; if amplitude is too low, the perturbation is felt but remains sub-threshold. Hence a finite working window emerges.
In dimensionless terms, the effective band corresponds to a narrow range of Strouhal numbers (and, equivalently, a small with using a representative throat radius ). Outside this range, oscillations are either too slow to alter interface dynamics within the observation time, or too fast to overcome viscous screening.
3.3. Velocity Fields and Flow Reorganization
To further elucidate the underlying mechanisms behind the observed recovery trends in Figure 5 and the corresponding morphological patterns in Figure 7, we conducted a detailed comparison of flow dynamics at two distinct porosity levels: high porosity (ϕ = 0.75) and low porosity (ϕ = 0.30). These cases were chosen to represent contrasting pore architectures—one with spacious and well-connected voids, and the other with narrow constrictions and higher capillary entry pressures. The goal was to directly visualize how oscillatory injection modifies internal flow pathways across different regimes and to validate the emergence of a “working window” in both geometries.
Figure 8 presents velocity magnitude distributions (left column) and the corresponding phase maps (right column) for a representative amplitude of A = 75% at three frequencies: non-oscillatory baseline (f = 0 Hz), an intermediate frequency (f = 53 Hz), and a high frequency (f = 213 Hz). In both porosity levels, the f = 0 case reveals highly channelized flow, with preferential paths skirting around large grains and leaving behind significant volumes of trapped fluid. At f = 53 Hz, however, the enhanced pressure pulsation penetrates deeper into the porous matrix, activating transverse throats and promoting reconnection of disconnected clusters. This results in more uniform velocity fields and a substantial reduction in trapped ganglia, as previously quantified in Figure 5 (/ drops to a minimum at this frequency).
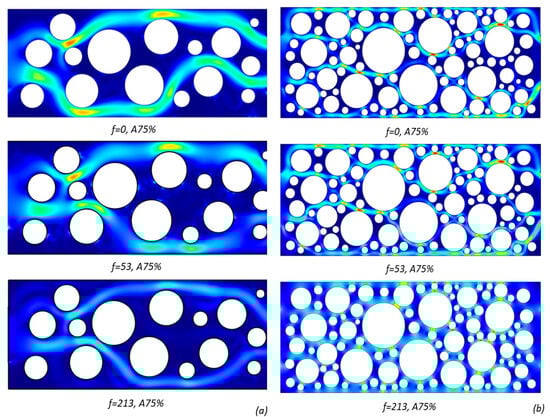
Figure 8.
Instantaneous velocity magnitude fields at three pulsation frequencies for two porosity levels at (a) ; (b) . Rows correspond to , , and (top to bottom). Higher porosity systems (a) exhibit broader, smoother channels and more uniform flow; lower porosity media (b) reveal tighter constrictions and localized velocity intensification.
Comparing the velocity maps directly between the two porosity levels, we observe that the higher porosity system allows for broader, more distributed flow, while the tighter ϕ = 0.30 structure channels flow through narrower, more localized paths. Nonetheless, both geometries show a similar qualitative response to oscillation frequency—namely, an initial improvement in displacement at intermediate frequencies followed by performance decline at high frequencies. At f = 213 Hz, viscous damping becomes dominant: although velocity fields remain intense near inlets and major throats, the pressure oscillations fail to propagate throughout the domain. As a result, the displacement front fragments again, and capillary re-entrapment re-emerges, as shown by the increasingly disconnected invaded regions in both phase maps and declining recovery values in Figure 7.
This comparison confirms that while the optimal frequency range may shift depending on pore structure, the underlying mechanism of frequency-amplitude interplay remains consistent. Velocity and phase data together support the interpretation that effective recovery requires not only sufficient forcing amplitude to depin interfaces but also enough time per cycle for the interface to explore and occupy available paths. The joint analysis across porosities strengthens the physical interpretation of the “working window” and reinforces the robustness of oscillation-assisted displacement in heterogeneous porous media.
4. Conclusions
This study examined the efficiency of two-phase displacement in a pore-scale micromodel under both steady and pulsatile injection. In the non-pulsed baseline, increasing the inlet velocity reduced residual saturation but only up to a saturation plateau, beyond which further gains diminished. This “velocity limit” was used as a benchmark for evaluating the added benefit of pulsation.
Superimposing sinusoidal pulsations introduced an additional mechanism of mobilization, effective only within a finite range of frequency and amplitude. Across all porosities, the lowest normalized saturation was consistently observed near a dimensionless frequency , confirming that the Strouhal number—built from the capillary time scale—governs the window of improvement. Outside this range, either insufficient energy (low amplitude) or insufficient time for reorganization (high frequency) limited the effectiveness.
For high porosity (), optimal displacement occurred at mid frequencies (50–60 Hz) and large amplitude (75%), where residual saturation dropped from 0.231 to ~0.17. At medium porosity (), the optimal amplitude decreased to 50%, with residual saturation improving from 0.284 to ~0.145. For low porosity (), the working window shifted to lower frequencies (8–12 Hz) and required maximum amplitude (75%) to achieve a modest reduction from 0.199 to ~0.134. These shifts reflect the increasing capillary entry thresholds and decreasing pore connectivity.
Flow field snapshots confirmed that optimal regimes activate secondary throats and reorganize flow patterns. In contrast, overly high frequencies failed to modify internal paths due to viscous screening. The resulting trends in were consistent with interface morphology and velocity maps.
Residual saturation was evaluated at a fixed observation time , which corresponded to post-breakthrough conditions for all geometries at the chosen velocity. While not equivalent to a steady-state or final saturation, this criterion enabled consistent comparison across cases, including scenarios where oscillations delay or modify breakthrough. This approach was selected to avoid ambiguity in time-varying regimes and ensure reproducibility.
Overall, pulsatile injection enhances displacement relative to steady flow, but only when frequency and amplitude are appropriately tuned to the geometric and capillary characteristics of the pore space. The observed trends and the dimensionless framework (based on , , and ) offer a transferable basis for predicting performance in similar microfluidic or porous systems.
While this study provides insight into pore-scale mobilization mechanisms under oscillatory flow, several aspects remain open for future exploration. Incorporating wettability heterogeneity (e.g., mixed-wet conditions) and three-dimensional geometries could improve generalizability. Quantitative front-tracking metrics or velocity field descriptors may strengthen the analysis of phase redistribution. Furthermore, comparison to steady-state or breakthrough-based saturation could refine the interpretation of displacement efficiency. Although experimental validation lies beyond the present scope, extending the framework to physical micromodels or upscaled models could bridge the gap toward practical implementation in enhanced oil recovery.
Author Contributions
Conceptualization, D.B. and A.K.; methodology, D.B. and A.K.; software, D.B.; validation, D.B., K.U. and Z.Z.; formal analysis, D.B.; investigation, D.B. and K.U.; resources, K.U. and Z.Z.; data curation, D.B.; writing—original draft preparation, D.B.; writing—review and editing, A.K., K.U. and Z.Z.; visualization, D.B.; supervision, A.K. and Z.Z.; project administration, A.K.; funding acquisition, A.K. All authors have read and agreed to the published version of the manuscript.
Funding
This research was funded by the Science Committee of the Ministry of Science and Higher Education of the Republic of Kazakhstan (Grant No. AP19676964). “APC was funded by Grant No. AP19676964”.
Data Availability Statement
The necessary data are available from the corresponding author upon reasonable request.
Conflicts of Interest
The authors declare no conflicts of interest.
References
- Dincau, B.; Savin, T.; Sauret, A. Pulsatile flow in microfluidic systems. Small 2020, 16, 1904032. [Google Scholar] [CrossRef]
- Mudugamuwa, A.; Roshan, U.; Hettiarachchi, S.; Cha, H.; Musharaf, H.; Kang, X.; Trinh, Q.T.; Xia, H.M.; Nguyen, N.T.; Zhang, J. Periodic flows in microfluidics. Small 2024, 20, e2404685. [Google Scholar] [CrossRef]
- Mutlu, B.R.; Edd, J.F.; Toner, M. Oscillatory inertial focusing in infinite microchannels. Proc. Natl. Acad. Sci. USA 2018, 115, 7682–7687. [Google Scholar] [CrossRef]
- Vázquez–Vergara, P.; Torres-Herrera, U.; Olguin, L.F.; Poiré, E.C. Singular behavior of microfluidic pulsatile flow due to dynamic curving of air–fluid interfaces. Phys. Rev. Fluids 2021, 6, 024003. [Google Scholar] [CrossRef]
- Tan, Y.; Zhang, Y.; Hui, C.; Yu, C.; Tian, S.; Wang, T.; Wang, F. Resonance-enhanced pulsing water injection for improved oil recovery: Micromodel experiments and analysis. Processes 2023, 11, 957. [Google Scholar] [CrossRef]
- Ji, B.; He, Y.; Tang, Y.; Yang, S. Inertial property of oscillatory flow for pulse injection in porous media. Energy Explor. Exploit. 2021, 39, 1184–1194. [Google Scholar] [CrossRef]
- Holtzman, R. Effects of pore-scale disorder on fluid displacement in partially-wettable porous media. Sci. Rep. 2016, 6, 36221. [Google Scholar] [CrossRef] [PubMed]
- Wang, Z.; Chauhan, K.; Pereira, J.–M.; Gan, Y. Disorder characterization of porous media and its effect on fluid displacement. Phys. Rev. Fluids 2019, 4, 034305. [Google Scholar] [CrossRef]
- Wu, D.S.; Hu, R.; Lan, T.; Chen, Y. Role of pore-scale disorder in fluid displacement. Water Resour. Res. 2021, 57, e2020WR028004. [Google Scholar] [CrossRef]
- Yiotis, A.; Karadimitriou, N.K.; Zarikos, I.; Steeb, H. Pore-scale effects during the transition from capillary- to viscosity-dominated flow dynamics within microfluidic porous-like domains. Sci. Rep. 2021, 11, 3891. [Google Scholar] [CrossRef] [PubMed]
- Jahanbakhsh, A.; Wlodarczyk, K.L.; Hand, D.P.; Maier, R.R.J.; Maroto-Valer, M.M. Review of microfluidic devices and imaging techniques for fluid flow study in porous geomaterials. Sensors 2020, 20, 4030. [Google Scholar] [CrossRef]
- Massimiani, A.; Panini, F.; Marasso, S.L.; Cocuzza, M.; Quaglio, M.; Pirri, C.F.; Verga, F.; Viberti, D. 2D microfluidic devices for pore-scale phenomena investigation: A review. Water 2023, 15, 1222. [Google Scholar] [CrossRef]
- Olsson, E.; Kreiss, G. A conservative level set method for two–phase flow. J. Comput. Phys. 2005, 210, 225–246. [Google Scholar] [CrossRef]
- Olsson, E.; Kreiss, G. A conservative level set method for two–phase flow. II. J. Comput. Phys. 2007, 225, 785–807. [Google Scholar] [CrossRef]
- Cifani, P.; Kuerten, J.G.M.; van der Vegt, J.J.W. A comparison between the surface-compression method and an interface reconstruction method for VOF. Comput. Fluids 2016, 136, 421–435. [Google Scholar] [CrossRef]
- Boniou, V.; Schmitt, T.; Vié, A. Comparison of interface-capturing methods for two-phase flow in a unified low-Mach framework. Int. J. Multiph. Flow 2022, 149, 103957. [Google Scholar] [CrossRef]
- Amini, Y.; Ghazanfari, V.; Heydari, M.; Shadman, M.M.; Khamseh, A.G.; Khani, M.H.; Hassanvand, A. Computational fluid dynamics simulation of two-phase flow patterns in a serpentine microfluidic device. Sci. Rep. 2023, 13, 9483. [Google Scholar] [CrossRef]
- Tekseth, K.R.; Breiby, D.W. 4D imaging of two-phase flow in porous media using laboratory-based micro-computed tomography. Water Resour. Res. 2024, 60, e2023WR036514. [Google Scholar] [CrossRef]
- Ben-Noah, I.; Friedman, S.P.; Berkowitz, B. Dynamics of air flow in partially water-saturated porous media. Rev. Geophys. 2023, 61, e2022RG000798. [Google Scholar] [CrossRef]
- Kuljabekov, A.; Segalini, A.; Wang, L.; Monaco, E.; Royer, J.-J.; Rojas-Solórzano, L.R. Isothermal CO2 injection into water–saturated porous media: Lattice–Boltzmann modelling of pulsatile flow with porosity, tortuosity and optimal–frequency characterization. Petroleum 2023, 43, 101949. [Google Scholar] [CrossRef]
- Whelan, B.K.; Woods, A.W. The periodic injection and extraction of fluid in a porous medium for hydrogen storage. J. Fluid Mech. 2025, 1002, R2. [Google Scholar] [CrossRef]
- Liu, C.; Chen, T.; Yu, Z.; Yang, Z.; Yin, J. Pressure attenuation law of low-frequency pulse pressure flooding and its influence on oil recovery. ACS Omega 2021, 6, 35272–35283. [Google Scholar] [CrossRef]
- Unglehrt, L.; Manhart, M. Assessment of models for nonlinear oscillatory flow through a hexagonal sphere pack. Transp. Porous Media 2024, 151, 2183–2213. [Google Scholar] [CrossRef]
- Yao, C.; Zhao, Y.; Ma, H.; Liu, Y.; Zhao, Q.; Chen, G. Two–Phase flow and mass transfer in microchannels: A review from local mechanism to global models. Chem. Eng. Sci. 2021, 229, 116017. [Google Scholar] [CrossRef]
- Zacharoudiou, I.; Boek, E.S.; Crawshaw, J. Pore-scale modeling of drainage displacement patterns in association with geological sequestration of CO2. Water Resour. Res. 2020, 56, e2019WR026332. [Google Scholar] [CrossRef]
- Kunz, P.; Zarikos, I.M.; Karadimitriou, N.K.; Huber, M.; Nieken, U.; Hassanizadeh, S.M. Study of multi-phase flow in porous media: Comparison of SPH simulations with micro-model experiments. Transp. Porous Media 2016, 114, 581–600. [Google Scholar] [CrossRef]
- Bashir, S.; Rees, J.M.; Zimmerman, W.B.J. Simulations of microfluidic droplet formation using the two–phase level set method. Chem. Eng. Sci. 2011, 66, 4733–4741. [Google Scholar] [CrossRef]
- COMSOL AB. Two–Phase Flow Modeling Guidelines. COMSOL Learning Center. Available online: https://www.comsol.com/support/learning-center/article/Two-Phase-Flow-Modeling-Guidelines-46471 (accessed on 5 October 2025).
- COMSOL AB. Level Set and Phase Field Equations. COMSOL Multiphysics® v6.0 Documentation. Available online: https://doc.comsol.com/6.0/doc/com.comsol.help.cfd/cfd_ug_fluidflow_multi.09.122.html (accessed on 5 October 2025).
- COMSOL AB. The Wetted Wall Coupling Feature. COMSOL Multiphysics® v6.0 Documentation. Available online: https://doc.comsol.com/6.0/doc/com.comsol.help.cfd/cfd_ug_fluidflow_multi.09.011.html (accessed on 5 October 2025).


Disclaimer/Publisher’s Note: The statements, opinions and data contained in all publications are solely those of the individual author(s) and contributor(s) and not of MDPI and/or the editor(s). MDPI and/or the editor(s) disclaim responsibility for any injury to people or property resulting from any ideas, methods, instructions or products referred to in the content. |
© 2025 by the authors. Licensee MDPI, Basel, Switzerland. This article is an open access article distributed under the terms and conditions of the Creative Commons Attribution (CC BY) license (https://creativecommons.org/licenses/by/4.0/).