Abstract
Solid–liquid two-phase centrifugal pumps are important fluid transport components in production and life. Most of the studies about the influence of solid-phase parameters on fluid transport mostly focus on single-component solid particles. In this work, two kinds of glass beads with particle sizes of 2 mm and 0.4 mm were used to study the effect of the binary mixed particle volume concentration on the internal flow and wear characteristics of a centrifugal pump. The flow distribution of the binary mixed particles in a centrifugal pump and the interactions between the particles and flow components at different volume concentrations (Cv = 5%, Cv = 7.5%, Cv = 10%, Cv = 12.5%, Cv = 15%) were studied using a Computational Fluid Dynamics-Discrete Element Method (CFD-DEM). The research results show that with the increase in particle volume concentration, the head and efficiency of the pump decrease. Additionally, the distributions of the particles with different concentrations in the impeller flow passage were obtained. Moreover, the coupling force of the flow field acting on the particles decreases with the increase in particle concentration and the time it takes to convey small particles decreases with the increase in concentration, while that of large particles decreases first and then increases. Furthermore, the contact force between the particles and the blade changes periodically with time, and the wear of the centrifugal pump is mainly concentrated on the pressure surface of the blade and the wall of the volute outlet side; the wear rate increases as the particle concentration increases.
1. Introduction
The centrifugal pump is an important device for conveying solid–liquid mixtures, and its application fields include chemical production, deep sea mining, river dredging, and many other fields. During its operation, the particles collide with the centrifugal pump, resulting in the loss of the surface material and wear to the centrifugal pump. Wear seriously affects the normal use of the centrifugal pump and shortens the service life of the centrifugal pump. At the same time, there is an interaction between the particles and the flow field, and the presence of particles will also lead to changes in the flow field inside the centrifugal pump. At present, many researchers are using a variety of methods to study the impacts of particles on centrifugal pumps.
In the process of conveying a solid–liquid mixture using a centrifugal pump, due to the interaction between the particles and flow field, the particles will cause great changes in the flow field inside the centrifugal pump, so it is important to study the changes of different particle parameters on the flow fields inside the centrifugal pump. Zhang et al. [1] applied the RNG k-ε turbulence model to study the influence of particle parameters on a centrifugal pump, and the results show that the efficiency and head of the centrifugal pump decreased with the increase in particle size and concentration. Wang et al. [2] applied the four-way coupling Euler–Lagrangian method to study the influence of the particle size on the internal flow field of a centrifugal pump, and the results show that the vortex inside the centrifugal pump becomes more broken with the increase in particle size and the flow field of the centrifugal pump becoming more complex. Wang et al. [3] used the CFD-DEM method to study the influence of particle size on the eddy current inside a centrifugal pump, and the results show that the increase in particle size promoted the formation and development of the eddy current in the flow field inside the centrifugal pump. Rahul Tarodiya et al. [4] used the Eulerian–Eulerian multiphase model to study the influence of particle size on the external characteristics of a centrifugal pump, and the results show that the head of the centrifugal pump decreased with the increase in particle size, and the particles of high specific gravity have little influence on the external characteristics of the centrifugal pump. Wang et al. [5] designed a new centrifugal pump experiment to study the effects of the particle concentration on the external characteristics of a centrifugal pump, and the results show that the presence of particles leads to a reduction in the shaft power of the centrifugal pump, whereby the higher the particle concentration, the lower the shaft power of the centrifugal pump. Zhao et al. [6] applied the SST k-ω turbulence model and uniform equilibrium model (HEM) to study the influence of particle parameters on the internal flow of a centrifugal pump, and the results show that the turbulent kinetic energy of the centrifugal pump changed more significantly with the increase in particle concentration. Wang et al. [7] conducted a numerical simulation of a centrifugal pump to study the effects of particle concentration on the external characteristics of the centrifugal pump, and the results show that with an increase in particle volume concentration, the eddy current intensity in the flow field of the centrifugal pump increases, which leads to a decrease in the efficiency of the centrifugal pump. Li et al. [8] used numerical simulation and experiments to verify the influence of particle concentration and particle size on the performance of a centrifugal pump and found that the influence of particle concentration on the centrifugal pump was greater than that of particle size. Gao et al. [9] used the CFD-DEM coupling model to study the movement of particles in a swirl pump, and the results show that there was a rotating region of particles at the inlet of the pump. Additionally, the accuracy of the CFD-DEM coupling model was proved by comparing the experimental results with the simulation results. Liu et al. [10] simulated the movement of particles inside a centrifugal pump, and the results show that the higher the solid phase volume concentration of the suction surface and the larger the particle size, the closer the particles were to the suction surface. Tarodiya [11] used the Euler–Euler model to simulate mixed fluids of different particle sizes transported by centrifugal pumps. The results show that with an increase in volume concentration for large particles, the head and efficiency decrease. Conversely, an increase in the volume concentration of small particles promotes the uniform distribution of particles in the flow field inside the centrifugal pump.
In the process of transporting solid–liquid mixed fluids using a centrifugal pump, there will be a collision between the centrifugal pump’s components and the particles, and the occurrence of a collision will lead to mass loss on the surface of the centrifugal pump, which is one of the main reasons for the wear of the centrifugal pump. At present, there are three main factors affecting the wear of centrifugal pumps: (1) particle parameters (density, diameter, concentration, etc.); (2) pump body material (hardness, surface morphology, etc.); and (3) flow parameters (impingement angle, flow velocity, pressure, etc.) [12]. Peng et al. [13] adopted the Euler–Euler method to analyze the influence of particle concentration on centrifugal pump wear, and the results show that the wear of the centrifugal pump would be aggravated by an increase in particle concentration. Bandi et al. [14] adopted the Euler–Euler method to study the effect of a mixed particle concentration on the wear of a centrifugal pump, and found that the wear rate of the impeller and volute uniformly increased with the increase in particle concentration. Chen et al. [15] used the Euler–Lagrange coupling model to study the factors affecting particle collision inside the centrifugal pump, and the results show that the collision velocity between particles and centrifugal pump components was affected by the fluid surrounding the particles. At the same time, with the increase in fluid velocity in the centrifugal pump, the impact velocity of particles on the blade also increases. Wu et al. [16] used the RNG k-ε turbulence model and sliding grid technology to study the relationship between particle wear and centrifugal pump wear and concluded that blade trailing edge wear rate is proportional to particle velocity. Sunil et al. [17] conducted wear experiments on bronze and steel centrifugal pumps. By analyzing the changes in weight before and after the experiment, it was found that the wear of centrifugal pumps was linearly correlated with particle concentration.
In the study of solid–liquid two-phase flow in a centrifugal pump, particle concentration has always been an unavoidable research object. However, most scholars mainly tend to study the effect of particle concentration of single particle size on the centrifugal pump, while there are relatively few studies on multi-particle size mixed fluids, especially the distribution of mixed particles in the centrifugal pump and the interaction between particles and flowing components. However, in practical engineering, especially in the field of deep-sea mining, the change of mixed particle concentration will lead to changes in wear characteristics and external characteristics of the centrifugal pump. Therefore, CFD-EDEM numerical simulation and experimental research methods are adopted in this paper to study the changes in external characteristics of centrifugal pumps through experiments and to analyze particle movement and wear of centrifugal pumps through numerical simulation, hoping to promote the research on the influence of mixed particle size on the performance of centrifugal pumps.
2. Simulation and Experimental Design
2.1. CFD-DEM Coupling Model
The CFD-DEM coupling model exemplifies a typical Euler–Lagrange model, the liquid phase is treated as a continuous phase, with it derived from solving the Navier-Stokes equations, whereas the solid phase is considered discrete. Particle motion is governed by Newton’s second law, and the coupling solution is achieved through the API program. The advantages of the coupling model include: (1) consideration of collisions between particles and between particles and the centrifugal pump; (2) accurate calculation of the fluid forces acting on the particles; and (3) ability to simulate particle aggregation and separation.
2.2. Control Equation
(1) Liquid phase
Mass conservation equation:
where is the fluid density; is the fluid velocity; t is the time.
Momentum conservation equation:
where is the viscous stress tensor; is the pressure; is the interaction force between fluid and particles; is the external vibration acceleration.
(2) Solid phase:
where is particle mass; is solid velocity; is the contact force; is the drag force; is the Magnus force; is the virtual mass force; is the pressure gradient force; is the moment of inertia; is the angular velocity; t is time; is contact torque; is the torque induced by the fluid.
(3) Archard wear model
By comparing the wear experiment and simulation results of pipelines, Li et al. [18] proved that the Archard wear model could accurately describe the wear position and wear intensity of components. The expression of Archard wear is as follows:
where Q is the loss of material quality; W is the wear constant; is the normal pressure; is the particle movement distance.
Q = WPds
2.3. Modeling and Meshing
Figure 1 is the hydraulic model of the experimental pump in 3D. The design specifications include a flow rate of 16 m3/h, a head of 12 m, and a rotational speed of 1450 r/min. The grid is generated using ICEM software under ANSYS 19.2, with the grid model shown in Figure 2. A structured grid is applied to the inlet and outlet, while an unstructured grid is applied to the impeller and volute. To ensure the convergence of the calculation results, the mesh size must be larger than the particle size [19], and the Element Quality should exceed 0.3.
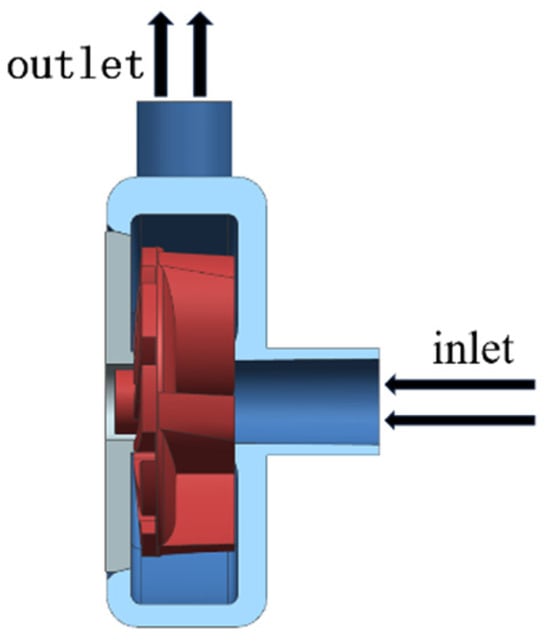
Figure 1.
Centrifugal pump model.
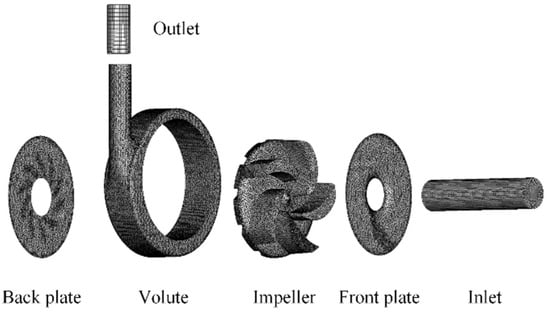
Figure 2.
Centrifugal pump model drawing.
In order to avoid the influence of the grid configuration on simulation results, seven sets of grids were evaluated to confirm grid independence. The simulation was conducted under clean water conditions. As shown in Figure 3, the head curve derived from the 4th set of grids approaches a straight line, with a head of approximately 12.8 m. With comprehensive considering of the overall reliability of the numerical simulation and computational efficiency, the fifth grid set, consisting of 2,191,997 nodes, was selected for further simulations.
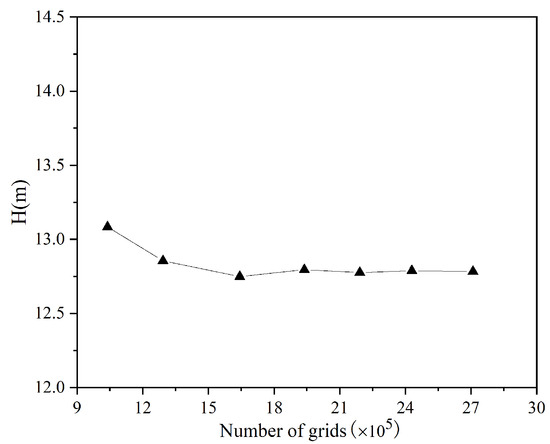
Figure 3.
Grid-independent validation.
2.4. Boundary Conditions
Fluent software under ANSYS 19.2 was used for the liquid phase calculations and EDEM software 2020.2 was used for the solid phase calculations.
Fluent settings are as follows:
(1) The liquid phase flow rate is 16 m3/h, resulting in an inlet velocity of the liquid phase of the centrifugal pump is 2.26 m/s; and the outlet of the centrifugal pump is defined as outflow;
(2) Liquid medium is water with a density of 998.2 kg/m3 and a viscosity of 0.001006 Pa·s;
(3) According to Zhang’s research [1], the RNG k-ε turbulence model was chosen to account for the eddy currents in the flow field, ensuring calculation accuracy. The coupling algorithm for velocity and pressure is SIMPLE algorithm;
(4) The impeller operates at a speed of 1450 r/min. The impeller is rotated about 1° as the time step [19], that is, 1.15 × 10⁻⁴ s, the convergence criterion is set to 1 × 10⁻⁶, and the maximum number of iterations is set to 40;
The EDEM settings are as follows:
(1) The material parameters of the centrifugal pump and particles are shown in Table 1. The particles are modeled as a single spherical model, with the large particles having a diameter of 2 mm and the small particles having a diameter of 0.4 mm.

Table 1.
EDEM Setting Factor.
(2) Considering that particles will produce rolling friction on the surface of materials during the collision, Hertz–Mindlin (no slip) with RVD Rolling Friction was chosen as the contact model.
(3) To ensure sufficient particle generation space, two-particle factories were set up as shown in Figure 4 [19]. Based on varying concentrations, the different incidence amounts of particles were adjusted at the entrance of the straight tube, and the initial velocity was set at 1 m/s.
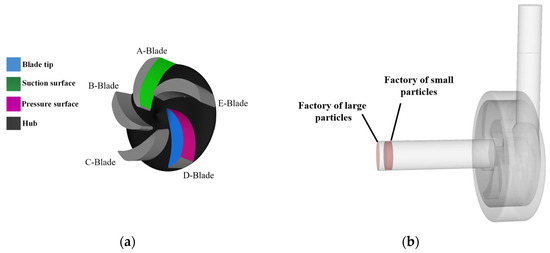
Figure 4.
Physical model of centrifugal pump. (a) Impeller. (b) Factory of particles.
(4) To maintain consistency between the liquid phase and solid phase calculation time, the time step in the FLUENT software under ANSYS 19.2 should be greater than that in the EDEM software 2020.2 and divisible evenly. Additionally, for the accuracy and efficiency of particle calculation, it is recommended to set the time Step to 10~30% of the Rayleigh Time Step. Consequently, the time step in EDEM was ultimately set to 1.15 × 10⁻⁵ s.
2.5. Time-Independent Analysis
To ensure the reliability of the numerical simulation analysis, it is essential to assess the time independence of the centrifugal pump. A numerical simulation was conducted under the condition of a 1:1 particle volume ratio and 10% volume concentration to calculate the variation in number of two types of particles within the centrifugal pump over time. The result, shown in Figure 5, reveals that after 0.36 s, the number of small particles in the pump transitions from a rising curve to an oscillatory pattern. The oscillation occurs because the particles inside the pump do not disappear uniformly. Due to the poorer following behavior of large particles compared to small particles, the number of large particles oscillates after 0.38 s. It was deduced that particle movement in the pump stabilizes after 0.38 s, facilitating the analysis of the internal flow field of the centrifugal pump under varying concentration conditions.
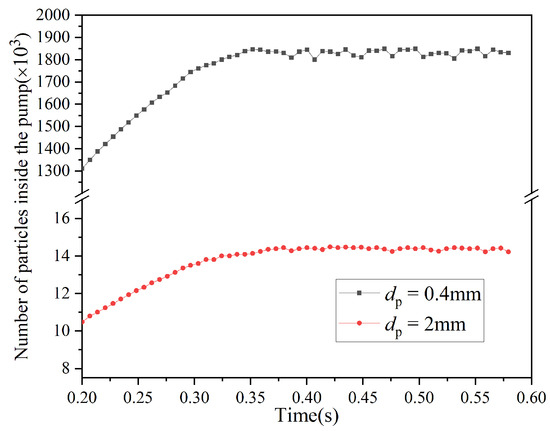
Figure 5.
Time-independent analysis.
2.6. Experimental Design
The specific parameters of the experiment are as follows: the particle material is glass, with diameters of 0.4 mm and 2 mm, and the mixing ratio is 1:1. The experimental volume concentrations are 5%, 7.5%, 10%, 12.5%, and 15%. The details of the experimental equipment are shown in Table 2. The schematic diagram of the experimental setup is shown in Figure 6. The experimental process is as follows:
Table 2.
Experimental device parameters.
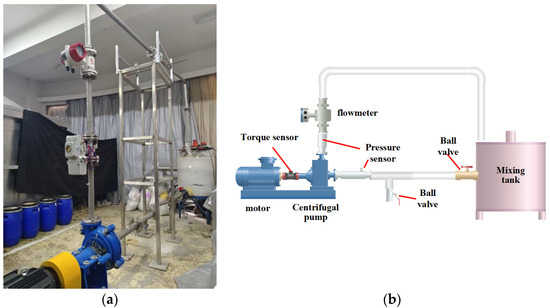
Figure 6.
Lab bench: (a) schematic of the site; (b) schematic diagram of experimental setup.
(1) The mass of the mixed particles is computed and then they were added to the mixing tank.
(2) After ensuring that the particles are fully suspended in the mixing tank, the centrifugal pump is activated to initiate the experiment.
(3) Once the centrifugal pump operates steadily, pressure gauges are used to measure the inlet and outlet pressure of the centrifugal pump, while the torque meter is utilized to determine the shaft power of the motor.
(4) The recorded pressure values are utilized to calculate the experimental head of the centrifugal pump. The centrifugal pump efficiency is calculated using the torque sensor (head measurement uncertainty of ±1.27% and efficiency measurement uncertainty of ±1.34%).
3. Results and Discussion
3.1. External Characterization and Particle Motion Analysis
(1) Analysis of External Properties
Figure 7 shows the trend of the experimental and simulated external characteristics of the centrifugal pump at different volume concentrations. It is observed that as the volume concentration increases, both the head and efficiency of the experimental and simulation results decrease. This decrease is attributed to the increased particle concentration in the fluid, leading to greater energy loss due to particle collisions. Although the experimental results are lower than the simulation results, they exhibit a more consistent trend. The specific changes in the head and efficiency data are detailed in Table 3 and Table 4. Notably, the largest amplitude of change occurs when the volume fraction increases from 5% to 7.5%, resulting in a 5.9% decrease in simulation efficiency and a 4.56% decrease in experimental efficiency. Additionally, the simulation head decreases by 0.87 m, and the experimental head decreases by 0.66 m. Furthermore, when the volume concentration increases from 7.5% to 10%, the efficiency of the centrifugal pump experiences the least decline.
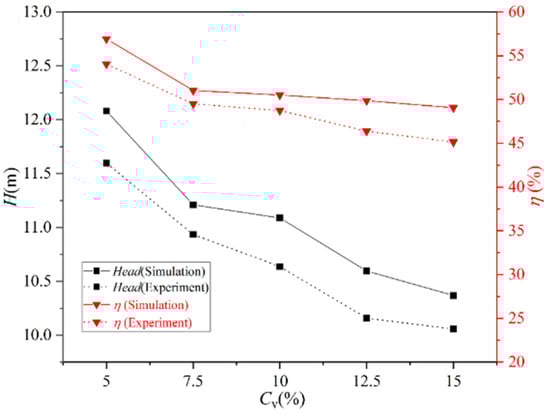
Figure 7.
External characteristic curves of centrifugal pumps at different volume concentrations.
Table 3.
Variation of the head with concentration.
Table 4.
Variation of efficiency with concentration.
(2) Particle Motion in the Flow Field
Figure 8 shows the particle distribution inside the centrifugal pump at different volume concentrations. It is found that most particles migrate along the pressure surface towards the volute flow field and along the volute wall towards the centrifugal pump outlet. Additionally, the velocity distribution of particles within the flow field is similar, with the maximum velocity occurring at the impeller outlet. Analyzing volume concentration below 12.5% (Figure 8a–d), it is evident that the large particles predominantly follow the pressure surface of the impeller, whereas small particles tend to deviate from the wall near the outlet of the impeller and aggregate near the outlet of the impeller flow field. Specifically, at a volume concentration is 5% (Figure 8a), particles travel a longer distance along the pressure surface. Conversely, at 15% volume concentration (Figure 8e), particle distribution within the centrifugal pump appears more regular compared to other conditions. Small particles tend to move along the leaf tip, exhibiting a more singular trajectory, with a more pronounced particle agglomeration phenomenon. Furthermore, the distribution of small particles at the impeller outlet with a volume concentration of 7.5% (Figure 8b) is more dispersed than that at the impeller with a volume concentration of 10% (Figure 8c).
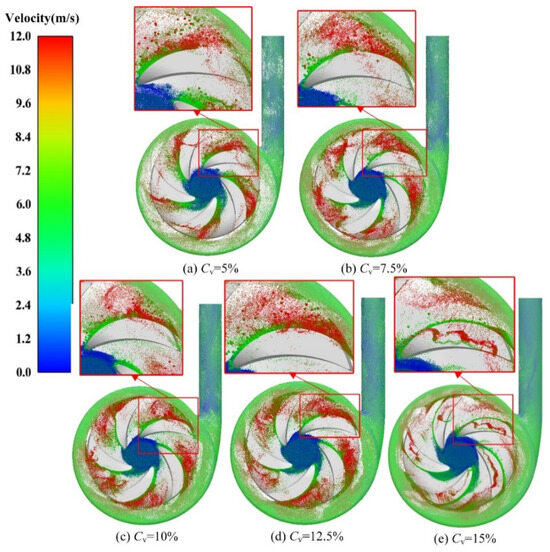
Figure 8.
Particle distribution inside the centrifugal pump at different volume concentrations.
Figure 9 shows the time required to transport mixed particles with different volume concentrations using the centrifugal pump. The conveying time of small particles decreases as the concentration increases, whereas the transport time of large particles decreases first and then increases. This phenomenon may be attributed to the fact that the number of small particles increases more rapidly than that of large particles with concentration. Regarding conveying time, the larger distribution area of small particles compared to large particles at the same concentration results in greater fluid force acting on small particles, leading to a reduction in their transport time. Within a certain concentration range, the distribution of large particles is more dispersed, and the flow field has a greater impact on them. However, as the particle concentration increases, the number of large particles also increases, leading to particle agglomeration and a decrease in the influence of the flow field on large particles. Therefore, the transport time of large particles first decreases and then increases.
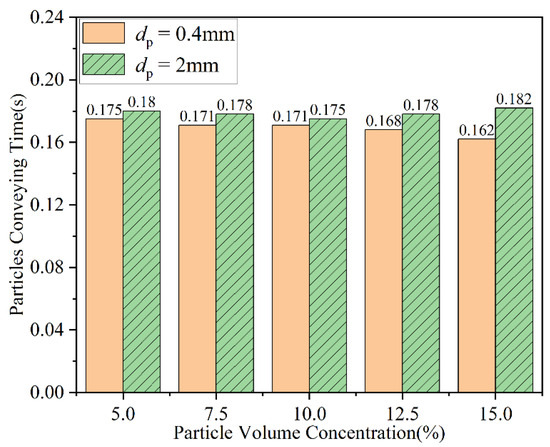
Figure 9.
Time taken by centrifugal pumps to convey the particles of different volume concentrations.
Figure 10 shows the force curve of mixed particles with different volume concentrations over time, highlighting that the collision force surpasses the coupling force. As shown in Figure 10a, the change in compressive force for large particles is significantly smaller than that for small particles across different volume concentrations. With an increase in volume concentration, the overall compressive force exerted by small particles rises. Notably, at a volume concentration of 15%, the compressive force of small particles is the largest, exhibiting significant fluctuation, with the maximum peak value appears at 0.375 s. Furthermore, as depicted in Figure 10b, the coupling force of small particles remains greater than that of large particles, and the coupling force of both large and small particles decreases with the increase in volume concentration.
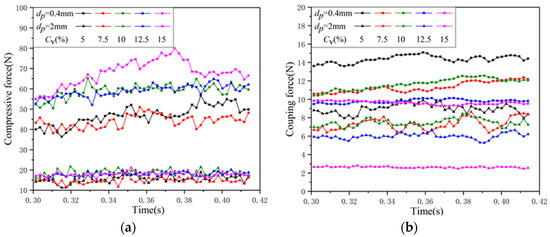
Figure 10.
Variation of force with time for mixed particles with different volume concentrations: (a) compressive forces; (b) coupling forces.
3.2. Wear Characteristic Analysis of Centrifugal Pump
(1) Wear Analysis of Volute
Figure 11 shows the distribution of the volute wear under different particle volume concentrations. Additionally, it is evident from Figure 11 that the higher the particle volume concentration, the more severe the volute wear becomes. The wear predominantly occurs on the circular wall surface near the inlet side of the volute (Refer to Areas 1 and 2 in Figure 11). The wear distribution of the volute is not uniform, with two primary wear patterns observed:
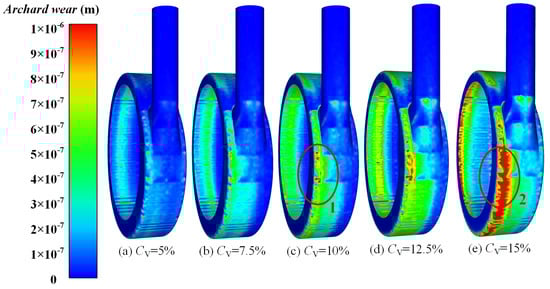
Figure 11.
Wear distribution of volute at different volume concentrations.
(1) Through analysis of the volute wear distribution at particle volume concentrations of 5%, 7.5% and 12.5% (Figure 11a,b,d), it can be found that the high-wear area of the volute gradually approaches the front cover along the direction of fluid flow.
(2) Analysis of the volute at particle volume concentrations of 10% and 15% (Figure 11c,e) reveals that the high wear area of the volute consistently remains near the side of the front cover.
Figure 12 shows the contact force of particles with 1% concentration on the volute under different working conditions. It is evident that the normal contact force between particles and the volute wall exceeds the tangential contact force under the same concentration condition. Additionally, the contact force between large particles and volute is slightly smaller than that of small particles, indicating a similar wear effect of large and small particles on the volute. As the concentration increases, the contact force gradually rises. When the concentration is 5%, the contact force curve of the particles fluctuates significantly. The tangential contact force between the large particles and the volute becomes 0 N at a certain time due to the low particle volume concentration in the volute, resulting in unstable contact between the particle and the wall.
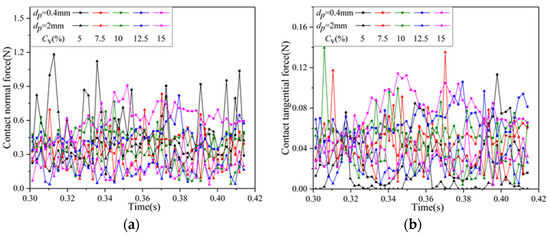
Figure 12.
Variation of particle–wall contact force with time for different volume concentrations: (a) normal contact force; (b) tangential contact force.
(2) Wear Analyses of Impeller
Figure 13 shows the wear at different positions on the impeller surface. It is evident that the higher the particle volume concentration, the more severe the wear of the impeller becomes, and the wear patterns are relatively consistent and closely related to the distribution of particle movement. Particularly, wear is more pronounced on the pressure surface of the blade, the inlet of the blade and the area of the wheel hub near the pressure surface. Additionally, the tip of the impeller with a 15% volume concentration (Figure 13e) exhibits slight wear, attributable to the particle distribution with a 15% volume concentration (Figure 8e), which indicates that some small particles move at the tip of the blade.
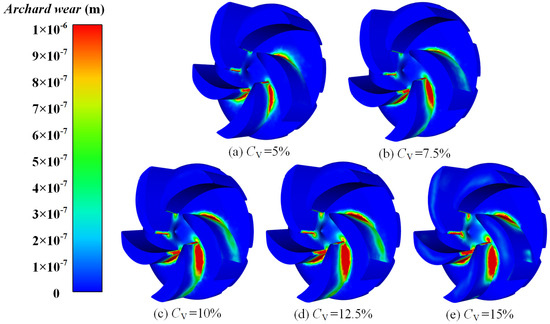
Figure 13.
Wear distribution of impeller at different volume concentrations.
Figure 14 shows the wear of different blades of the centrifugal pump under different particle volume concentrations. Predominantly, wear is concentrated in the front section of the impeller near the hub side, with minimal wear observed at the back end of the impeller. At the volume concentration of 5%, the wear exhibits a thin strip shape, while for concentrations exceeding 7.5%, the wear shape is semi-elliptical. This phenomenon is attributed to the absence of particle accumulation at the impeller inlet when the concentration is 5%. As the volume concentration transitions from 5% to 12.5%, the area of severe wear increases, corresponding to the elevated number of particles and their increased collision probability and area with the pressure surface. However, from 12.5% to 15%, there is a slight reduction in the wear area on the front side of the pressure surface, indicating the presence of a maximum collision probability and area between particles and the pressure surface with increasing particle concentration. Additionally, the wear area on the back side of the pressure surface is also reduced, as the small particles with a 15% volume concentration exhibit flocculent distribution, resulting in a low probability of collision with the back side of the pressure surface. Conversely, small particles at other concentrations demonstrate a clumpy distribution at the impeller outlet, leading to a high probability of collision with the back side of the pressure surface.
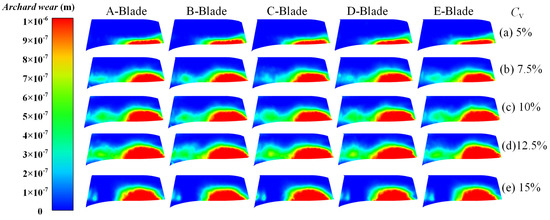
Figure 14.
Wear distribution of blade pressure surfaces at different volume concentrations.
Figure 15 shows the contact force of particles with 1% concentration on the pressure surface under different working conditions. Notably, the normal contact force remains greater than the tangential contact force. Specifically, the normal contact force between small particles and the pressure surface fluctuates between 1 N and 1.6 N, while the normal contact force between large particles and the pressure surface fluctuates between 0 N and 0.6 N, with small particles predominantly contributing to the wear of the pressure surface. Overall, the contact force of particles decreases with increasing concentration. This decrease is attributed to the sharp rise in the number of particles due to the concentration increase and the limited number of particles in contact with the pressure surface due to the presence of the particle layer. At the concentration of 15%, the fluctuation curve of the contact force between the small particles and the pressure surface closely resembles periodic changes, with one period corresponding precisely to the time it takes for the impeller to complete one rotation.
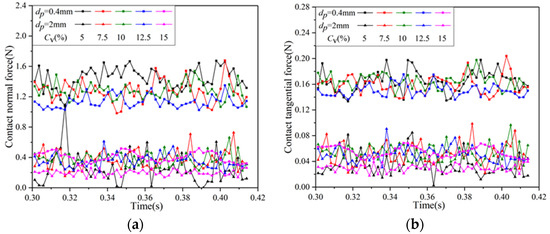
Figure 15.
Variation of particle-pressure surface contact force with time for different volume: (a) normal contact force; (b) tangential contact force.
(3) Analysis of wear rates on different wall surfaces
Figure 16 shows the curves of the average and maximum wear rates of the walls of different parts of the centrifugal pump under different volume concentrations. The analyzed components encompass the volute, impeller pressure surface, impeller suction surface, impeller tip and impeller hub, which are the primary sites of wear. It is evident from Figure 16 that no matter the average wear rate or the maximum wear rate, the wear rate of the suction surface is the lowest, and the wear rate of the pressure surface and volute is maintained at a high level. The average wear rate of the pressure surface increases with the increase in volume concentration and reaches the maximum value when the volume concentration is 12.5%, and the average wear rate at 15% concentration drops to about the same as the average wear rate at 7.5% concentration. The average rate of the volute is proportional to the volume concentration, and the average wear rate of the volute is only lower than the average wear rate of the pressure surface until the volume concentration of 15% is approximately equal to the wear rate of the pressure surface. The average wear rate curve of the wheel hub is relatively stable, and the influence of the change of volume concentration is low. When the volume concentration increases from 12.5% to 15%, the average wear rate of the blade tip and suction surface increases significantly.
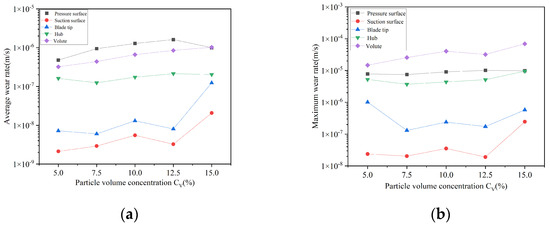
Figure 16.
Wear rate curves of different components of centrifugal pumps at different volume: (a) Average wear rate; (b) Maximum wear rate.
Regarding maximum wear rate, the volute exhibits a higher value than the pressure surface, because the area of the pressure surface is significantly smaller than that of the volute. Consequently, the overall wear on the volute is greater than that on the blade, though the average wear rate per unit area of the volute remains low. The overall maximum wear rate of both the volute and wheel hub is proportional to the volume concentration. The maximum wear rate curve of the pressure surface is relatively flat, maintaining a stable value at 8 × 10⁻⁶ m/s. The maximum wear rate of the tip is highest at a volume concentration of 5%, likely due to the faster increases in the speed of small particles at this concentration, leading to more concentrated application points on the tip of the blade.
4. Conclusions
In this paper, the influence of the change in the concentration of mixed particles on the centrifugal pump in the process of transporting solid–liquid mixtures containing two different particle sizes was studied. The process was numerically simulated using a CFD-DEM coupling model, and the wear caused by particles on the main components, such as the blades, was analyzed using the Archard model. The effect of particle volume concentration on the centrifugal pump was summarized through an analysis of simulation results, providing a theoretical basis for extending the service life and improving the efficiency of the centrifugal pump. The main conclusions are as follows:
(1) The particle concentration affects the external characteristics of the centrifugal pump; higher particle volume concentration results in lower pump head and efficiency. Additionally, when the volume concentration is below 12.5%, the particles exhibit a clumpy distribution at the outlet of the pressure surface. At a concentration of 15%, some particles display a flocculent distribution at the tip of the blade, with no clumping at the outlet of the pressure surface. The transport time of small particles decreases as volume concentration increases, whereas the transport time of large particles first decreases and then increases. The coupling force of both large and small particles decreases as volume concentration rises.
(2) The volute wear mainly manifests on the volute wall near the front plate at the outlet. As the volume concentration increases, the wear becomes more severe. The contact force between particles and the volute wall exhibits irregular fluctuations, with larger amplitude at lower concentrations. The difference in contact force between large small particles on the volute is minimal under identical operating conditions.
(3) Severe wear was observed on the front side of the pressure surface and the junction area between the wheel hub and the pressure surface. As the volume concentration increases, wear becomes more serious, with small particles exerting greater contact force compared to large particles. Increasing particle concentration results in more orderly particle movement. While the regular movement of particles reduces wear on the pressure surface area of the blade, it leads to increased local wear. At a concentration of 15%, the contact force curve between small particles and the pressure surface exhibits periodic fluctuations, with each period aligning with the impeller’s rotation cycle.
The centrifugal pump is a kind of mechanical equipment with broad development prospects, in the future, the centrifugal pump will become an important part of production and life. While this paper primarily examines centrifugal pumps in the context of two-particle mixed fluids, real-world applications—particularly in deep-sea mining—involve solid–liquid mixtures with diverse particle sizes. Hence, building upon the findings of this paper, further investigation into the behavior of centrifugal pumps under more intricate operational scenarios using the CFD-DEM coupling model holds significant practical importance.
Author Contributions
Conceptualization, Y.W. and T.H.; methodology, Y.Z. and X.D.; software, T.H.; validation, Y.Z.; formal analysis, Y.W. and T.H.; writing—original draft preparation, Y.Z.; writing—review and editing, Y.Z.; supervision, Y.L.; funding acquisition, Y.L. and Y.W. All authors have read and agreed to the published version of the manuscript.
Funding
This research was funded by National Key Research and Development Program of China, grant number 2022YFE0126600, Major Science and Technology Projects of Zhejiang Province, grant number 2021AA002 and National Natural Science Foundation of China, grant number 51676174.
Data Availability Statement
The data that support the findings of this study are available on request from the corresponding author.
Conflicts of Interest
The authors declare no conflicts of interest.
References
- Zhang, Y.; Li, Y.; Cui, B.; Zhu, Z.; Dou, H. Numerical simulation and analysis of solid-liquid two-phase flow in centrifugal pump. Chin. J. Mech. Eng. 2013, 26, 53–60. [Google Scholar] [CrossRef]
- Wang, K.; Liu, H.; Wang, L.; Guo, P.; Wang, Y.; Yang, J. Effect of particle size on vortex structure and erosion behavior of semi-open centrifugal pump. Energy 2024, 293, 130576. [Google Scholar] [CrossRef]
- Wang, R.; Guan, Y.; Jin, X.; Tang, Z.; Zhu, Z.; Su, X. Impact of particle sizes on flow characteristics of slurry pump for deep-sea mining. Shock Vib. 2021, 2021, 6684944. [Google Scholar] [CrossRef]
- Tarodiya, R.; Gandhi, B.K. Numerical simulation of a centrifugal slurry pump handling solid-liquid mixture: Effect of solids on flow field and performance. Adv. Powder Technol. 2019, 30, 2225–2239. [Google Scholar] [CrossRef]
- Wang, Z.; Qian, Z. Effects of concentration and size of silt particles on the performance of a double-suction centrifugal pump. Energy 2017, 123, 36–46. [Google Scholar] [CrossRef]
- Zhao, W.; Zhao, G. Numerical investigation on the transient characteristics of sediment-laden two-phase flow in a centrifugal pump. J. Mech. Sci. Technol. 2018, 32, 167–176. [Google Scholar] [CrossRef]
- Wang, P.; Zhao, J.; Zou, W.; Hu, S. Experimental study and numerical simulation of the solid-phase particles’ influence on outside characteristics of slurry pump. IOP Conf. Ser. Earth Environ. Sci. 2012, 15, 062057. [Google Scholar] [CrossRef]
- Li, Y.; Zhu, Z.; He, W.; He, Z. Numerical simulation and experimental research on the influence of solid-phase characteristics on centrifugal pump performance. Chin. J. Mech. Eng. 2012, 25, 1184–1189. [Google Scholar] [CrossRef]
- Gao, X.; Shi, W.; Shi, Y.; Chang, H.; Zhao, T. DEM-CFD simulation and experiments on the flow characteristics of particles in vortex pumps. Water 2020, 12, 2444. [Google Scholar] [CrossRef]
- Liu, Y.; Jiang, Y.; Han, Z. Research on the pattern of solid-liquid two-phase distribution in chemical process pump. IOP Conf. Ser. Earth Environ. Sci. 2012, 15, 072009. [Google Scholar] [CrossRef]
- Tarodiya, R.; Gandhi, B.K. K. Effect of particle size distribution on performance and particle kinetics in a centrifugal slurry pump handling multi-size particulate slurry. Adv. Powder Technol. 2020, 31, 4751–4767. [Google Scholar] [CrossRef]
- Serrano, R.O.P.; Santos, L.P.; de Faria Viana, E.M.; Pinto, M.; Martinez, C.B. Case study: Effects of sediment concentration on the wear of fluvial water pump impellers on Brazil’s Acre River. Wear 2018, 408, 131–137. [Google Scholar] [CrossRef]
- Peng, G.; Huang, X.; Zhou, L.; Zhou, G. Solid-liquid two-phase flow and wear analysis in a large-scale centrifugal slurry pump. Eng. Fail. Anal. 2020, 114, 104602. [Google Scholar] [CrossRef]
- Bandi, S.; Banka, J.; Kumar, A.; Rai, A.K. Effects of sediment properties on abrasive erosion of a centrifugal pump. Chem. Eng. Sci. 2023, 277, 118873. [Google Scholar] [CrossRef]
- Chen, M.; Tan, L.; Fan, H.; Wang, C.; Liu, D. Solid-liquid multiphase flow and erosion characteristics of a centrifugal pump in the energy storage pump station. J. Energy Storage 2022, 56, 105916. [Google Scholar] [CrossRef]
- Wu, B.; Wang, X.-L.; Liu, H.; Xu, H.-L. Numerical simulation and analysis of solid-liquid two-phase three-dimensional unsteady flow in centrifugal slurry pump. J. Cent. South Univ. 2015, 22, 3008–3016. [Google Scholar] [CrossRef]
- Sunil, C.; Namita, S.; Seshadri, V. Experimental study of erosion wear in a centrifugal slurry pump using coriolis wear test rig. Part. Sci. Technol. 2012, 30, 179–195. [Google Scholar] [CrossRef]
- Li, Y.; Zhang, H.; Lin, Z.; He, Z.; Xiang, J.; Su, X. Relationship between wear formation and large-particle motion in a pipe bend. R. Soc. Open Sci. 2019, 6, 181254. [Google Scholar] [CrossRef]
- Wang, Y.; He, T.; Ding, Q.; Gao, P.; Tao, R.; Zhu, Z. Analysis of internal flow and wear characteristics of binary mixture particles in centrifugal pump based on CFD-DEM. Processes 2022, 10, 681. [Google Scholar] [CrossRef]
Disclaimer/Publisher’s Note: The statements, opinions and data contained in all publications are solely those of the individual author(s) and contributor(s) and not of MDPI and/or the editor(s). MDPI and/or the editor(s) disclaim responsibility for any injury to people or property resulting from any ideas, methods, instructions or products referred to in the content. |
© 2024 by the authors. Licensee MDPI, Basel, Switzerland. This article is an open access article distributed under the terms and conditions of the Creative Commons Attribution (CC BY) license (https://creativecommons.org/licenses/by/4.0/).