Abstract
The variability of the material properties of steel from different suppliers causes problems in achieving the required surface quality after turning. Therefore, the manufacturer needs to estimate the resulting quality before starting production, especially if it is an expensive, small-batch production from stainless steel. Predictive models will make it possible to estimate the surface roughness from the mechanical properties of steel and thus support decision making about supplier selection or acceptance of a material supply. This research presents a step-by-step decision-making procedure, which enables the trained staff to make quick decisions based on commonly available information in the Mill Test Certificate (MTC). A new multivariate second-order polynomial model and feedforward backpropagation artificial neural network (ANN) models have been developed using input variables from the MTC: Tensile Strength, Yield Strength, Elongation, and Hardness. Models were used to enhance the methodological robustness in formulating the decision if the predicted surface roughness is outside the required range, even before accepting the delivery. Both models can accurately predict surface roughness, while the ANN model is more accurate than the polynomial model; however, the predictive model is sensitive to the accuracy of the input data, and the model’s prediction is valid only under precisely defined conditions.
1. Introduction
The selection and evaluation of suppliers are two of the most critical activities of a company and significantly affect the quality of the final products. Today, there are several tools to support decision making in the selection of suppliers and to predict the responses of machining processes, which combine traditional methods with the technological advances of Industry 4.0. Küpper et al. [1] found that the Boston Consulting Group study participants identified predictive analytics, sensors and tracking, and electronic feedback loops as the most impactful technologies. Data analytics has started gathering the interest of quality researchers and practitioners who investigate approaches, algorithms, and methods for supporting manufacturing quality procedures in the context of Industry 4.0 [2]. Predictive quality prevents defects by forecasting the quality of process results in real time using artificial intelligence [3].
Considering the Industry 4.0 requirements, the supplier’s selection is essential in promoting collaborative strategies between suppliers and manufacturers [4]. Industry 4.0 affects all industry sectors, and the steel supply chain is no exception. There are many opportunities that the steel industry can benefit from adopting a Quality 4.0 approach [5]. For example, quality control enables complete and instant data traceability using technologies such as blockchain. Each step in the supply chain can then be traced and checked against quality specifications. Quality 4.0 tools guarantee that no data in the system can be changed unless all parties agree, thus ensuring transparency throughout the supply chain. This means that no more fake Mill Test Certificates (MTC) or signatures can be made [6]. Therefore, collaboration across the supply chain is essential [7].
The possibility to rely on the MTC is important for the customer as the certificate credibility significantly influences the decision-making process and, according to [8], has a significant effect on machining cost as it is measured as an index of quality. When purchasing steel round bars from different suppliers without a long-term contractual relationship, customers cannot always be sure that the same product quality will be made from the supplied steel belonging to the declared grade.
The motivation for the research was the request of an organization producing precision components for the food industry from AISI 304 and AISI 304L stainless steel to ensure that surface roughness after finishing turning is within the specification limit. The surface roughness can be affected by various factors, including the material properties, machining process, and machine setup [8]. The variability of the properties of the input material was identified as the reason for non-compliance with quality. Compensating material variability by changing the machine setup for each new steel supply is impossible because production is single piece or small batch, which takes a long time. Therefore, there was a requirement to determine the decision-making process when choosing a supplier or a specific batch of material that will ensure the required quality of finishing turning in advance. Predicting surface roughness quality using an appropriate model can be the answer.
Tercan and Meisen [9] conducted a systematic review on predictive quality in manufacturing. According to [9], the general approach to predictive quality involves three main steps: the collection and aggregation of process and quality data, the training of a predictive model, and the use of the model for real-time predictions as a basis for decisions on measures to be taken in the process. Predictive quality in decision making is described in Bushmann, Schulze, Enslin, Schmitta, 2022 [10], and Singh et al., 2006 [11] presented a predictive quality model for decision making about surface roughness after finish turning in [11]. Here, Singh studied the effects of cutting conditions and tool geometry on the surface roughness in the finish hard turning of the bearing steel AISI 52100 and stated that the first-order surface roughness prediction model represents the hard turning process very well and would help select the tool geometry and cut conditions for the required surface quality.
Modeling methods for surface roughness prediction after fine-tuning depend on many factors, use various analytical and empirical models, and are intended for different purposes. According to [12,13], the factors are divided into four main categories: (1) factors due to machining parameters, such as the feed rate, the cutting speed, and the depth of cut; (2) factors due to cutting tool parameters, such as tool wear, tool geometry, tool material, and tool coating; (3) factors due to machining and machine tool conditions, such as dry or wet turning, type of cutting fluid, method of fluid application, machine tool rigidity, and chatter vibration; and (4) factors due to workpiece material properties, such as hardness, microstructure, grain size, and inclusions.
In the literature, it is possible to find different types of models, of which the following are often used: (1) a second-order polynomial model [13,14,15,16,17,18], (2) an artificial neural network [15,16,17,19,20,21,22], (3) an exponential model [14,23,24], and (4) a support vector regression model [16,20,23].
Models are used for various purposes: (1) cutting parameter optimization [18,24,25,26], (2) analysis of the importance of cutting factors [23], (3) selecting the tool geometry [11], and (4) finding the best predictive model [20].
From the literature survey, we concluded that few authors use the surface roughness model for decision making, and some authors do not even explicitly state the purpose of the developed models. We did not find research about accepting or rejecting a supplier or a specific batch of material based on MTC data. The second but fundamental finding is the fact that the presented models have input factor machining parameters, cutting tool type, type of cutting fluid, etc., and only a few models [14,18,24] use hardness. No model was found that uses mechanical properties such as Tensile Strength, Yield Strength Rp0.2, or Elongation, available from the MTC. Therefore, the prediction model that results from our research differs from the models published so far, and its purpose is also different.
The research aims to propose a surface roughness prediction model and methodology for deciding whether to accept or reject a specific supply of AISI 304 and AISI 304L stainless steel round bars based on the mechanical properties specified in the MTC.
The MTC is available even before the steel is ordered, so the decision-making process based on the data from the MTC is simple and helps companies without an established quality management system according to ISO 9001:2015 [27] or without an agreement with the supplier on supply acceptance sampling according to ISO 28598-1:2017 [28] and ISO 3951-2:2013 [29] to decide whether to purchase steel from the new, unverified supplier.
2. Context of This Study
The research was carried out in an organization producing equipment for the food industry in single pieces or small batches. In our case, AISI 304 and AISI 304L stainless steel cylinder shafts are the working samples for hard and finish turning operations. Cylinders are one of the most important and expensive components of produced equipment. Cylinders consist of a tube, side flange and shaft, machined by turning on the CNC center MAZAK QTN 350. A coated cemented carbide cutting tool (CVD TICN + AL2O3 + TIN), manufactured by Sandvik, Sweden, and Zubora 65 H Extra cooling lubricant, is used for finish turning. The new cutting tool plates are used for each workpiece. The cutting speed is 110 mm/s, the feed rate is 0.1 mm/rev, and the depth of cut is 0.5 mm.
The product volume is approximately 1800 pcs per year in 271 design variants. The common feature of variants is the same grade of steel, machined on the same CNC center, using the same cutting fluid, cutting tool and measuring instrument. Large pieces are machined in one clamping during two or three shifts. We can consider this production as a small batch as each step starts and finishes before proceeding to the next one as defined in ISO 7870-8, 2017 [30,31]. The resulting Critical-to-Quality (CTQ) characteristic is the shaft’s surface roughness Ra, with a specification of 0.6 for small shafts and 1.1 µm for large shafts, measured after finish turning of stainless steel bars by the portable Mitutoyo surface roughness tester SURFTEST SJ-410.
The organization has difficulty maintaining the required surface roughness after finish turning in the case of some deliveries of AISI 304 and AISI 304L grades. The organization is not certified according to ISO 9001:2015 and chooses steel suppliers based on previous experience or the lowest price offered in the surrounding market. Even if the steel is of the same grade as from other suppliers, the resulting roughness may be out of tolerance due to the variability of the chemical composition and mechanical properties of the steel within the grade. Changing the machine setup for each new material is out of the question, as it is a long and expensive process.
3. The Proposed Decision-Making Procedure with a Roughness Prediction Model
This section describes a procedure for making decisions about the acceptance or rejection of a steel supplier or supply using a roughness prediction model. The decision-making flow chart is shown in Figure 1. The decision is based on data from the MTC that must be available from potential steel suppliers. Not all MTCs contain all the required data (see Section 5.2). The next step is to check whether the input data are within the valid range of the model. A decision can then be made to accept or reject a particular batch of steel from the supplier.
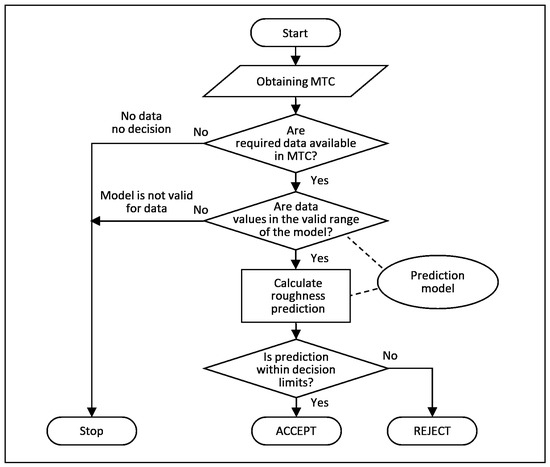
Figure 1.
Decision-making procedure acceptance or rejection of a steel supplier.
The presented decision-making procedure requires the surface roughness prediction model. The model is created from measured data for a specific machine and its setup, which is optimized for the used steel grade. The model cannot be used for another type of CNC machine or for another setup, cutting tool, etc., because these factors are not part of the presented model. Based on our experience, obtaining at least 20 data samples to calculate the model and cover a sufficient range of steel types is necessary [32]. Figure 2 illustrates the process of maintaining a prediction model after it has been created. The learning loop with the machine learning algorithm regularly updates the model. This is performed after each new roughness measurement, and it is necessary to investigate the cause of the deviation of the prediction from reality. The cause of the deviation can be:
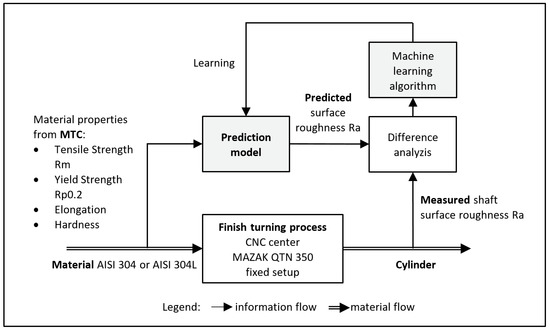
Figure 2.
Process of maintaining a prediction model.
- Incorrect input data—either measurement of surface roughness or the MTC;
- A change in the turning process that is not part of the model;
- The model does not give accurate results for the given steel—our research has shown that the model can be updated or extended while remaining consistent with older measurements.
Section 5.3 explains the procedure and different use cases in more detail.
4. Materials and Methods
4.1. Materials
Austenitic chromium-nickel steel AISI 304 (EN 1.4301) (X5CrNi18-10) is the most widely used type of stainless steel with good corrosion resistance, cold formability and weldability. It is resistant to water, water vapor, air humidity, edible acids, and weak organic and inorganic acids. It is well polishable and malleable by deep drawing, bending and rounding. AISI 304 stainless steel is a typical difficult-to-machine material [33], so the cutting parameters should be selected reasonably [34]. When machining, it is necessary to work with sharp tools made of high-alloy, high-speed steel, carbide, or carbide alloys due to the tendency to hardening. It is used in the engineering and nuclear industry, architecture, transport equipment, the food industry, the pharmaceutical and cosmetic industry, the construction of chemical apparatus and motor vehicles, the production of surgical instruments, sanitary equipment, objects and devices for the household and objects of art.
Austenitic chromium-nickel steel AISI 304L EN 1.4307 (X2CrNi18-9) has increased resistance to intercrystalline corrosion (extremely low carbon content). The material is weldable, very well polished and well cold formable. Machining conditions are similar to AISI 304. Temperature stress is up to 400 °C. It is used similarly to the AISI 304 material, but the possibility of cold processing is better.
Table A1 in the Appendix A contains the chemical composition and mechanical properties of the steels that were included in this research. Data are from the Mill Test Certificates. Despite the fact that each batch of steel is grade AISI 304 or AISI 304 L, their properties differ.
4.2. Methods
4.2.1. Surface Roughness Measurement
Surface roughness Ra is the arithmetical mean of the absolute values of the profile deviations from the mean line of the roughness profile according to ISO 4287:1997 [35].
The finish turned shafts’ surface was measured using the contact stylus instrument Mitutoyo surface roughness tester SURFTEST SJ-410 with standard stylus 12AAE882 (60°/1 μm) and the valid calibration list. Roughness measurement Ra is the average of measurements in three positions. Table 1 contains the instrument settings.

Table 1.
SURFTEST SJ-410 parameter settings.
4.2.2. Prediction Models
Mathematical modeling is used to describe the relationship between steel material properties and the roughness of a surface after finish turning. We selected two models, namely multivariate second-order polynomial and artificial neural network models. These types of models are the most common models in the literature we have studied.
The polynomial model has long been used in many areas of science and technology. We have also used it with success in our previous research [38,39]. The second-order model for n input variables takes the form:
where y is the output variable (Roughness Ra), n is the number of input variables, b is the polynomial model coefficients to be estimated, and ε represents the noise or error observed in the response y. The coefficients of the model were determined using the ordinary least squares method. Model input variables x are mechanical properties Tensile Strength, Yield Strength Rp0.2, Elongation, and Hardness available from the MTC.
Artificial neural network models are machine learning models that approximate complex functions by learning from data. We use a feedforward neural network with a Levenberg–Marquardt backpropagation learning algorithm with ten neurons in the hidden layer, as was recommended in our previous research [38].
We can consider the polynomial model and the artificial neural network as backbox models that do not require prior knowledge about modelled data. The residual values calculated after model fitting serve for the identification of possible outliers in analyzed data, and the following metrics were used for model accuracy comparison:
- The coefficient of determination (R2),
- Mean absolute error (MAE),
- Maximum absolute error (MaAE), and
- Root mean square error (RMSE).
5. Results and Discussion
The presented research follows on from our previous work [38], where a surface roughness prediction model with only three input variables was presented based on a limited group of data that were available at that time.
5.1. Model Validity Check
The multivariate polynomial and ANN model from our previous work reasonably accurately predicted the surface roughness from the material properties listed in the MTC, namely Yield Strength Rp0.2, Elongation, and Hardness. The accuracy of the prediction was verified using samples omitted from the model calculation. However, models must be able to predict roughness for other products in the future. Therefore, we proceeded to verify the correctness of the model on other samples that were produced later. Material properties, measured roughness and polynomial and ANN model predictions for three new samples are presented in Table 2. It is clear from the table that the predictions are wrong, especially for the polynomial model. Finding the reasons for this result was the subject of the analysis presented below.
Table 2.
Sample data, measured roughness, and predicted roughness by polynomial and ANN models.
Figure 3 shows the space of input variables of the model, where the value of Yield Strength Rp0.2 is on the x-axis, the Elongation value is on the y-axis, and the Hardness value is on the z-axis. The figure shows the training set of samples (Model Training Set) from [38] and the set of new samples (New Samples). It is clear from the figure that the input variable space of new samples 2 and 3 is far from the training set of samples. The value of the Yield Strength of the new samples is twice, and the value of Elongation is half that of the samples from the training set. With the new sample 1, there will probably be another reason why the models are unable to predict the roughness. Upon further investigation, it was found that sample 1 was produced with machine setup values for the feed rate and the depth of cut different from the training set.
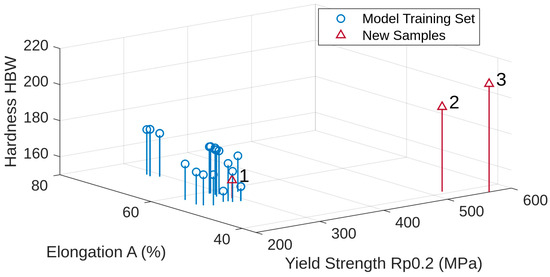
Figure 3.
Model input space for samples used for model calculation (Model Training Set) and new samples no 1, 2, and 3 from Table 2.
The presented results of the analysis show:
- The polynomial and ANN models cannot predict values for samples that are very far from the training set of samples (new samples 2 and 3).
- It is crucial to ensure the accuracy and reliability of the data collected during production, as the models only apply to the defined machining parameters (new sample 1).
Based on the conclusions from the analysis, we examined both the original and new samples and for further investigation of the use of prediction models, we excluded samples where:
- The MTC does not have the required data, especially Tensile Strength Rm, and Hardness, or steel-producing company name,
- The CNC center has a different setup for finish turning.
5.2. Prediction Models Calculated from Revised and New Data
After revising the original and new samples, a data set of 26 samples was created (AppendixA Table A1). The value of Tensile Strength Rm was added to the input variables because sources [40,41] state that none of the values of Rm and Rp0.2 alone are sufficiently informative. Multivariate polynomial models and ANN models were created for the new data set. Polynomial models had three input variables (Yield Strength Rp0.2, Elongation, and Hardness) as in [38] and four inputs (Tensile Strength Rm, Yield Strength Rp0.2, Elongation, and Hardness). The other two models are ANNs with four inputs. Calculating coefficients of polynomial models takes approximately 10 s, and the training time of ANN is approximately 2.5 min in Matlab Cloud service.
Table 3 contains model performance expressed as R2, MAE, MaAE, and RMSE values for four polynomial models and two ANN models. Models 1, 3, and 5 were trained with all samples. Then, the sample with a maximum value of residual was excluded from the training set for models 2, 4, and 6. Figure 4 shows Roughness measurement, prediction and residuals for polynomial models 2 and 4 and ANN model number 6.
Table 3.
Model performance R2, MAE, MaAE, and RMSE.
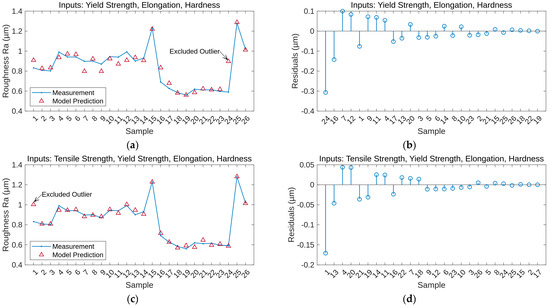
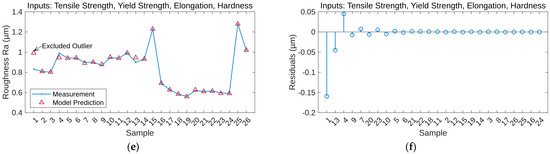
Figure 4.
Roughnes Ra measurement, prediction and residuals for model numbers 2 (a,b), 4 (c,d), and 6 (e,f).
From Table 3, we can see that models with four inputs outperform models with three inputs. Their value of the coefficient of determination R2 is greater, and the errors are smaller than for the three input models. Even model 3, without excluding the outlier sample, is better than the most accurate three-input model 2 with excluded sample 24. However, the most reliable is ANN model 6 with excluded outlier 1. Figure 5 compares predictions of the best ANN model and the best polynomial model.
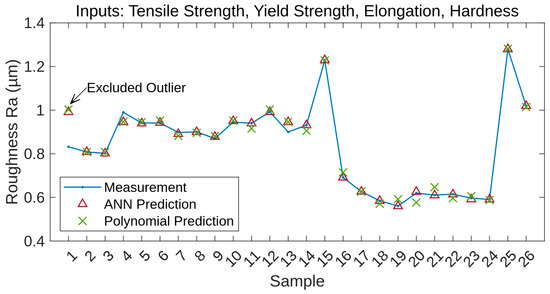
Figure 5.
Comparison of best ANN and polynomial model predictions.
A graphical comparison of the ANN and the polynomial model is shown in Figure 6. The ANN model is significantly better in the mean absolute error (MAE) and root mean square error (RMSE) values. The maximum absolute error (MaAE) of the ANN model and the polynomial model is almost the same, but the ANN model is slightly better.
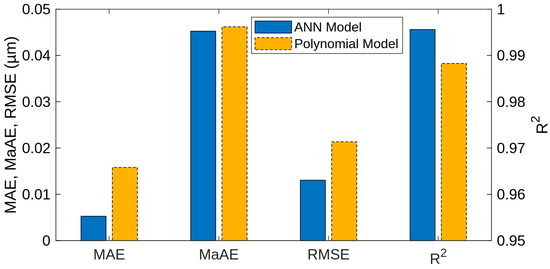
Figure 6.
Comparison of the coefficients mean absolute error (MAE), maximum absolute error (MaAE), root mean square error (RMSE), and the coefficient of determination (R2) for best ANN and polynomial models.
We compared the performance of the proposed prediction models with several similar models from the literature (Table 4). The table is incomplete because different authors give different coefficients. The coefficients of the proposed models are comparable to those from the literature.
Table 4.
Comparison of performance of presented prediction models and models from the literature.
Table 5 contains the advantages and disadvantages of the presented ANN and polynomial models and a recommendation for dealing with the disadvantages.
Table 5.
Advantages and disadvantages of using presented prediction models.
5.3. Using a Prediction Model
The presented roughness prediction models can be used in different ways. Table 6 lists four of them. The first case applies to the choice of a new supplier. The second is for the case when a material is regularly purchased from one supplier that comes from different manufacturers or one manufacturer but from different batches of steel. The third case concerns corrective action if the steel has already been purchased. The prediction model signals that we cannot maintain the resulting quality. However, experts can change the machine setup to avoid the production of a non-conforming product. The fourth case can arise when the prediction deviates from reality, and there is no other explanation than the data in the MTC being incorrect and the steel having different properties than expected.
Table 6.
Use case of the prediction model.
Table 7 describes the application of the general decision-making procedure from Figure 1 for use case No 2 from Table 6: Acceptance or rejection of a particular steel shipment. First of all, the MTC with relevant data must exist. Then, procedures for assessing whether input data are within the model validity range and how to determine decision limits must be known.
Table 7.
The decision-making procedure using a predictive model.
Even though the presented procedure looks simple and straightforward, its implementation has limitations, which must be taken into account:
- Data-driven decision making strongly depends on the trustworthiness and accuracy of data.
- Model validity range needs to be exactly defined for decision making.
- Decision making is not formulated as statistical hypothesis testing, so the probability of a wrong decision as well as its relation to the decision limits, is unknown.
- There are no simple guidelines to analyze and determine the cause of a discrepancy between prediction and measurement if it occurs.
6. Conclusions
Supplier selection and evaluation methods are crucial for ensuring quality, cost, and delivery performance in the context of stainless steel material purchasing. Predictive quality prevents defects by predicting the quality of process results and can be used for supplier selection.
The purpose of the research was to propose a surface roughness prediction model together with the methodology for deciding whether to accept or reject the specific supply based on the mechanical properties of steel specified in the Mill Test Certificate. This paper describes:
- The decision-making procedure for accepting or rejecting a steel supplier or a particular steel bar batch using a quality prediction model.
- Multivariate second-order polynomial and ANN prediction models for determining surface roughness after finish turning from steel mechanical properties listed in the MTC.
The step-by-step decision-making procedure will allow trained personnel to make quick decisions that will prevent problems with the quality, which is especially important for single-piece or small-batch production that takes a long time. The procedure itself is simple and straightforward, but it depends on the accuracy of the prediction model. Furthermore, the procedure does not allow for determining the probability of a wrong decision because it is not formulated as statistical hypothesis testing.
Generally, the decision-making procedure is independent of the type of prediction model. In this research, new polynomial and ANN models have been developed using four input variables from the MTC, namely Tensile Strength, Yield Strength, Elongation, and Hardness. These models can accurately predict surface roughness, while the ANN model is more accurate (R2 = 0.9956) than the polynomial one (R2 = 0.9883). Since both models are sensitive to the accuracy of the input data, it is essential to follow a well-defined procedure when creating and using them. This includes checking the accuracy of the measured roughness data and the reliability of the MTC from which the input data comes. The model’s prediction is valid under precisely defined conditions. The existing model is tied to the type of machining center, the machine setup and the cutting tools used.
The inputs of the models are only the mechanical properties of steel. Therefore, models can not predict surface roughness for different machine setup or the cutting tool. Expanding the number of inputs by the speed or the feed rate is possible. However, any increase in the number of inputs requires increasing the number of samples to train the model.
Author Contributions
Conceptualization, K.Z. and P.B.; methodology, P.B.; software, P.B.; validation, K.Z., P.B. and M.Č.; investigation, M.Č.; resources, M.Č., M.M. and J.B.; data curation, M.Č., J.B. and M.M.; writing—original draft preparation, K.Z. and P.B.; writing—review and editing, P.B. and K.Z.; supervision, P.B. All authors have read and agreed to the published version of the manuscript.
Funding
This research received no external funding.
Data Availability Statement
Data supporting the results of this study are available from the corresponding authors upon request.
Conflicts of Interest
The authors declare no conflict of interest.
Appendix A
Table A1.
Inputs, measured hardness, and predicted hardness from models 4 and 6.
Table A1.
Inputs, measured hardness, and predicted hardness from models 4 and 6.
| Sample | Tensile Strength Rm (MPa) | Yield Strength Rp0.2 (MPa) | Elongation A (%) | Hardness HBW | Roughness Ra (µm) | Prediction Ra (µm) | |
|---|---|---|---|---|---|---|---|
| Polynom. Model 4 | ANN Model 6 | ||||||
| 1 | 585 | 235 | 55 | 168 | 0.832 | 1.0028 | 0.9914 |
| 2 | 583.62 | 276.05 | 54 | 158 | 0.808 | 0.8079 | 0.8086 |
| 3 | 573.58 | 270.13 | 54 | 156 | 0.802 | 0.8077 | 0.8016 |
| 4 | 581 | 292 | 58 | 174 | 0.99 | 0.9462 | 0.9453 |
| 5 | 580 | 284 | 57 | 176 | 0.941 | 0.9451 | 0.9393 |
| 6 | 584 | 286 | 59 | 176 | 0.941 | 0.9517 | 0.9423 |
| 7 | 579.15 | 290.53 | 53 | 158 | 0.898 | 0.8820 | 0.8909 |
| 8 | 586 | 286 | 73 | 175 | 0.90 | 0.8960 | 0.8997 |
| 9 | 579.45 | 290.53 | 53 | 158 | 0.87 | 0.8813 | 0.8775 |
| 10 | 580 | 284 | 72 | 176 | 0.945 | 0.9519 | 0.9500 |
| 11 | 608 | 318 | 57.5 | 170 | 0.94 | 0.9155 | 0.9394 |
| 12 | 585 | 235 | 55 | 168 | 0.992 | 1.0028 | 0.9914 |
| 13 | 581 | 292 | 58 | 174 | 0.90 | 0.9462 | 0.9453 |
| 14 | 573 | 239 | 58 | 167 | 0.931 | 0.9057 | 0.9315 |
| 15 | 707 | 565 | 37 | 210 | 1.229 | 1.2280 | 1.2295 |
| 16 | 608 | 291 | 55 | 160 | 0.691 | 0.7147 | 0.6912 |
| 17 | 635 | 332 | 48 | 165 | 0.6262 | 0.6262 | 0.6265 |
| 18 | 634 | 320 | 43 | 163 | 0.5848 | 0.5707 | 0.5840 |
| 19 | 630 | 328 | 44 | 161 | 0.5604 | 0.5917 | 0.5599 |
| 20 | 628 | 325 | 46 | 156 | 0.6196 | 0.5765 | 0.6257 |
| 21 | 630 | 332 | 47 | 161 | 0.6106 | 0.6469 | 0.6096 |
| 22 | 630 | 325 | 46 | 161 | 0.6146 | 0.5965 | 0.6137 |
| 23 | 625 | 322 | 47 | 155 | 0.5966 | 0.6059 | 0.5912 |
| 24 | 608 | 270 | 58.5 | 160 | 0.5906 | 0.5879 | 0.5906 |
| 25 | 729 | 607 | 41 | 216 | 1.28 | 1.2815 | 1.2798 |
| 26 | 637 | 397 | 49 | 188 | 1.019 | 1.0140 | 1.0192 |
References
- Küpper, D.; Knizek, C.; Ryeson, D.; Noecker, J. Quality 4.0 Takes More Than Technology. Available online: https://www.bcg.com/publications/2019/quality-4.0-takes-more-than-technology (accessed on 20 August 2019).
- Bousdekis, A.; Lepenioti, K.; Apostolou, D.; Mentzas, G. Decision Making in Predictive Maintenance: Literature Review and Research Agenda for Industry 4.0. IFAC-Pap. 2019, 52, 607–612. [Google Scholar] [CrossRef]
- Open Technologies Home Page, Predictive Quality. Available online: https://oden.io/solutions/predictive-quality-manufacturing/ (accessed on 24 August 2023).
- Resende, C.; Geraldes, C.; Lima, F.R. Decision Models for Supplier Selection in Industry 4.0 Era: A Systematic Literature Review. Procedia Manuf. 2021, 55, 492–499. [Google Scholar] [CrossRef]
- Santos, G.; Sá, J.C.; Félix, M.J.; Barreto, L.; Carvalho, F.; Doiro, M.; Zgodavová, K.; Stefanović, M. New Needed Quality Management Skills for Quality Managers 4.0. Sustainability 2021, 13, 6149. [Google Scholar] [CrossRef]
- Andreatti, A. Quality 4.0 Opportunities in the Steel Supply Chain. SteelTrace. Available online: https://steeltrace.co/quality4_opportunities/ (accessed on 20 October 2023).
- Kauppila, O.; Välikangas, K.; Majava, J. Improving supply chain transparency between a manufacturer and suppliers: A triadic case study. Manag. Prod. Eng. Rev. 2020, 11, 84–91. [Google Scholar] [CrossRef]
- Dubey, V.; Sharma, A.K.; Pimenov, D.Y. Prediction of Surface Roughness Using Machine Learning Approach in MQL Turning of AISI 304 Steel by Varying Nanoparticle Size in the Cutting Fluid. Lubricants 2022, 10, 81. [Google Scholar] [CrossRef]
- Tercan, H.; Meisen, T. Machine learning and deep learning based predictive quality in manufacturing: A systematic review. J. Intell. Manuf. 2022, 33, 1879–1905. [Google Scholar] [CrossRef]
- Buschmann, D.; Schulze, T.; Enslin, C.; Schmitt, R.H. Interpretation Framework of Predictive Quality Models for Process- and Product-oriented Decision Support. Procedia CIRP 2023, 118, 1066–1071. [Google Scholar] [CrossRef]
- Singh, D.; Rao, P.V. A surface roughness prediction model for hard turning process. Int. J. Adv. Manuf. Technol. 2007, 32, 1115–1124. [Google Scholar] [CrossRef]
- Ratnam, M.M. 1.1 Factors Affecting Surface Roughness in Finish Turning. In Comprehensive Materials Finishing; Hashmi, M.S.J., Ed.; Elsevier: Amsterdam, The Netherlands, 2017; pp. 1–25. ISBN 9780128032497. [Google Scholar] [CrossRef]
- Routara, B.C.; Bandyopadhyay, A.; Sahoo, P. Roughness modeling and optimization in CNC end milling using response surface method: Effect of workpiece material variation. Int. J. Adv. Manuf. Technol. 2009, 40, 1166–1180. [Google Scholar] [CrossRef]
- Wang, X.; Feng, C.X. Development of Empirical Models for Surface Roughness Prediction in Finish Turning. Int. J. Adv. Manuf. Technol. 2002, 20, 348–356. [Google Scholar] [CrossRef]
- Vasanth, X.A.; Paul, P.S.; Varadarajan, A.S. A neural network model to predict surface roughness during turning of hardened SS410 steel. Int. J. Syst. Assur. Eng. Manag. 2020, 11, 704–715. [Google Scholar] [CrossRef]
- Cica, D.; Sredanovic, B.; Tesic, S.; Kramar, D. Predictive modeling of turning operations under different cooling/lubricating conditions for sustainable manufacturing with machine learning techniques. Appl. Comput. Inform. 2020, 20, 162–180. [Google Scholar] [CrossRef]
- Abhang, L.B.; Hameedullah, M. Modeling and Analysis of Surface Roughness in Steel Turning Using Regression and Neural Networks. In Proceedings of the IEEE-International Conference on Advances in Engineering, Science and Management (lCAESM-2012), Nagapattinam, India, 30–31 March 2012; pp. 317–322. [Google Scholar]
- Aouici, H.; Yallese, M.A.; Chaoui, K.; Mabrouki, T.; Rigal, J.-F. Analysis of surface roughness and cutting force components in hard turning with CBN tool: Prediction model and cutting conditions optimization. Measurement 2012, 45, 344–353. [Google Scholar] [CrossRef]
- Pal, S.K.; Chakraborty, D. Surface roughness prediction in turning using artificial neural network. Neural. Comput. Applic. 2005, 14, 319–324. [Google Scholar] [CrossRef]
- Çaydaş, U.; Ekici, S. Support vector machines models for surface roughness prediction in CNC turning of AISI 304 austenitic stainless steel. J. Intell. Manuf. 2012, 23, 639–650. [Google Scholar] [CrossRef]
- Bilgic, H.H.; Guvenc, M.A.; Cakir, M.; Mistikoglu, S. A Study on prediction of surface roughness and cutting tool temperature after turning for S235JR STEEL. Konjes 2019, 7, 966–974. [Google Scholar] [CrossRef]
- Vrabeľ, M.; Mankova, I.; Beno, J.; Tuharský, J. Surface Roughness Prediction using Artificial Neural Networks when Drilling Udimet 720. Procedia Eng. 2012, 48, 693–700. [Google Scholar] [CrossRef]
- Wang, X.; Kang, M.; Fu, X.; Li, C. Predictive modeling of surface roughness in lenses precision turning using regression and support vector machines. Int. J. Adv. Manuf. Technol. 2013, 87, 1273–1281. [Google Scholar] [CrossRef]
- Muñoz-Escalona, P.; Cassier, Z. Influence of the critical cutting speed on the surface finish of turned steel. Wear 1998, 218, 103–109. [Google Scholar] [CrossRef]
- Zhou, T.; He, L.; Wu, J.; Du, F.; Zou, Z. Prediction of Surface Roughness of 304 Stainless Steel and Multi-Objective Optimization of Cutting Parameters Based on GA-GBRT. Appl. Sci. 2019, 9, 3684. [Google Scholar] [CrossRef]
- Abbas, A.T.; Pimenov, D.Y.; Erdakov, I.N.; Taha, M.A.; Soliman, M.S.; El Rayes, M.M. ANN Surface Roughness Optimization of AZ61 Magnesium Alloy Finish Turning: Minimum Machining Times at Prime Machining Costs. Materials 2018, 11, 808. [Google Scholar] [CrossRef]
- ISO 9001:2015; Quality Management Systems. Requirements. ISO: Geneva, Switzerland, 2015.
- ISO 28598-1:2017; Acceptance Sampling Procedures Based on the Allocation of Priorities Principle (APP) Part 1: Guidelines for the APP Approach. ISO: Geneva, Switzerland, 2017.
- ISO 3951-2:2013; Sampling Procedures for Inspection by Variables Part 2: General Specification for Single Sampling Plans Indexed by Acceptance Quality Limit (AQL) for Lot-by-Lot Inspection of Independent Quality Characteristics. ISO: Geneva, Switzerland, 2013.
- ISO 7870-8, 2017; Control Charts Part 8: Charting Techniques for Short Runs and Small Mixed Batches. ISO: Geneva, Switzerland, 2017.
- Khair, R. Small Batch Production: Pros, Cons, & Everything You Need to Know. Available online: https://ventrify.ca/design/small-batch-production/ (accessed on 4 November 2021).
- Balki, I.; Amirabadi, A.; Levman, J.; Martel, A.L.; Emersic, Z.; Meden, B.; Tyrrell, P.N. Sample-size determination methodologies for machine learning in medical imaging research: A systematic review. Can. Assoc. Radiol. J. 2019, 70, 344–353. [Google Scholar] [CrossRef]
- Sansmachining. Turning Of AISI304 Stainless Steel. SANS Machining. Available online: https://www.sansmachining.com/turning-of-aisi304-stainless-steel (accessed on 25 October 2023).
- Dubovská, R.; Majerík, J. Experimental Investigation and Analysis of Cutting Forces When Machining X5CrNi18-10 Stainless Steel. Manuf. Technol. 2015, 15, 322–329. [Google Scholar] [CrossRef]
- ISO 4287:1997; Geometrical Product Specifications (GPS) Surface Texture: Profile Method Rules and Procedures for the Assessment of Surface Texture. ISO: Geneva, Switzerland, 1997.
- ISO 3274:1996; Geometrical Product Specifications (GPS)—Surface texture: Profile method—Nominal characteristics of contact (stylus) instruments. ISO: Geneva, Switzerland, 1996.
- ISO 11562:1996/Cor 1:1998; Geometrical Product Specifications (GPS)—Surface texture: Profile method—Metrological characteristics of phase correct filters. ISO: Geneva, Switzerland, 1998.
- Zgodavova, K.; Bober, P.; Majstorovic, V.; Monkova, K.; Santos, G.; Juhaszova, D. Innovative Methods for Small Mixed Batches Production System Improvement: The Case of a Bakery Machine Manufacturer. Sustainability 2020, 12, 6266. [Google Scholar] [CrossRef]
- Mihaliková, M.; Zgodavová, K.; Bober, P.; Sütőová, A. Prediction of Bake Hardening Behavior of Selected Advanced High Strength Automotive Steels and Hailstone Failure Discussion. Metals 2019, 9, 1016. [Google Scholar] [CrossRef]
- Cliftonsteel. Tensile Strength of Steel vs. Yield Strength of Steel. Clifton Steel. Available online: https://www.cliftonsteel.com/education/tensile-and-yield-strength (accessed on 21 October 2023).
- ZwickRoell. Yield Strength and Offset Yield Rp 0.2. ZwickRoell. 2023. Available online: https://www.zwickroell.com/industries/materials-testing/tensile-test/yield-point/ (accessed on 20 October 2023).
Disclaimer/Publisher’s Note: The statements, opinions and data contained in all publications are solely those of the individual author(s) and contributor(s) and not of MDPI and/or the editor(s). MDPI and/or the editor(s) disclaim responsibility for any injury to people or property resulting from any ideas, methods, instructions or products referred to in the content. |
© 2024 by the authors. Licensee MDPI, Basel, Switzerland. This article is an open access article distributed under the terms and conditions of the Creative Commons Attribution (CC BY) license (https://creativecommons.org/licenses/by/4.0/).