1. Introduction
As a multifunctional antimicrobial agent, triclosan is often included in the composition of some household products for personal hygiene—toothpastes, detergents, shampoos, body washes, deodorants, soaps, etc. [
1,
2]. Triclosan is used together with chlorhexidine and alcohol in surgical scrubs [
3]. Its widespread application leads to easy release of this compound in water and air. Its presence has been established in waste water from treatment plants, as well as in surface and ground waters [
3,
4].
The physico-chemical properties of the triclosan are a precondition for bio-accumulation and persistent presence in the environment. There is growing concern for possible negative effects of triclosan on human and animal health. Triclosan could cause microbial resistance, dermatites, endocrine disruptions, allergies, and tumors [
5,
6,
7].
There are also data that triclosan is toxic to certain aquatic organisms [
8,
9]. Another danger is the possibility of conversion of triclosan into dioxins and other harmful chemicals [
10].
Unfortunately, conventional waste water treatment processes do not attain complete removal of triclosan, and formation of toxic intermediates is possible. Therefore, new methods for its elimination from waste and drinking waters should be developed. Possible procedures for its extraction are adsorption methods using different adsorbents. An adsorption process is suitable for both batch and continuous processes; it is relatively simple and allows the possibility for regeneration, etc. [
11]. Triclosan is a chlorinated phenoxyphenol with a pKa of 8.14. Although a hydroxyl functional group is present, it is still relatively hydrophobic with log Kow of 4.76 [
12]. Due to its extreme hydrophobic nature, triclosan remains highly hydrophobic even in an ionization state [
13]. The relatively high octanol–water partition coefficient of this compound leads to increased sorption affinity [
14].
Zeolites and membranes can be used for water purification [
15,
16]; however, the most effective are the carbon adsorbents, which are appropriate for uptake of metal cations and organic molecules [
16,
17,
18], which is determined by their porous texture, resistance to chemical and thermal treatment, and chemical character of the surface. The chemical nature of the surface, and especially the presence of oxygen-containing functional groups, are of essential importance for interaction with the adsorbate molecules and significantly influence the adsorption capacity and the mechanism of adsorption [
19]. Moreover, used activated carbons can be regenerated and applied as adsorbents again several times. Because of the relatively high cost of activated carbons, extensive work should be conducted on expanding the raw material base with cheap materials, such as plant and household waste, as well as on reducing the energy consumption for their production.
The main aim of the paper is assessment of adsorption capacity towards triclosan of four carbon adsorbents, obtained on the base of plant and household waste (RDF), provided by Sofia Waste Plant, as well as investigation of the effect of some parameters on triclosan adsorption process.
2. Materials and Methods
2.1. Carbon Adsorbents
Adsorbent A was obtained by flash pyrolysis of RDF at a temperature of 800 °C. Adsorbent B was obtained from adsorbent A after oxidation with 12% nitric acid. Adsorbent C was obtained by flash pyrolysis of plant waste at a temperature of 800 °C. Adsorbent D is carbon foam synthesized from plant waste treatment products [
13] and subjected to hydro-pyrolysis at 850 °C for 1 h.
After synthesis, carbon adsorbents are washed with water in order to remove fine dust and other impurities, dried at 120 °C overnight, and then kept in a desiccator.
2.2. Nanotexture of the Carbon Adsorbents
Nanotexture of the carbon adsorbents used was characterized by N
2 (Porosimeter Autosorb iQ-MP) adsorption isotherms at −196 °C. Before the experiments, the samples were outgassed under vacuum (ca. 10
−3 Torr) at 300 °C. The isotherms were used to calculate the specific surface area, S
BET, total pore volume (at p/p
0 ~ 0.99), micropore volumes using t-plot method and mesopore volumes using DFT [
14].
2.3. Elemental Analysis
Elemental analysis (C, H, N, and S) was carried out by Elementar Vario MACRO cube apparatus. The amount of oxygen in the sample was calculated by the difference.
2.4. Determination of Amount of Oxygen Surface Groups
The content of oxygen surface groups was assessed by Boehm titration method, using water solutions with different base strength (sodium bicarbonate, sodium carbonate, sodium hydroxide, and sodium ethoxide) [
13]. The samples were stirred for 16 h with four 0.05 M base solutions. The content of remaining OH- anions is detected by using back titration with HCl solution. The amount of basic groups was assessed with titration with 0.05 M HCl solution [
19].
2.5. Preparation of the Triclosan Solution
Triclosan (99%) provided by Thermo Scientific was used. Triclosan stock solution was made by dissolving 50 mg triclosan in 1000 mL 20% ethanol solution in water.
The solutions used for adsorption experiments are made by adding of 20% ethanol solutions in water to stock solution, in order to achieve the desired concentrations.
2.6. Triclosan Adsorption Experiments
Removal of triclosan using carbon adsorbents was performed in batch adsorption conditions, whereas a 50 mL aqueous solution of triclosan solution was added to a portion of 0.1 g carbon adsorbent at 20 °C under continuous stirring. All samples were filtered through 1.2 µm filter in order to separate the solution from the adsorbent.
The residual triclosan was determined by Pharo 300 UV spectrometer at a wavelength of 320 nm. The maximal amount of adsorbed triclosan for 1 g adsorbent, Q
0 (mg/g), was evaluated by the equation:
where V (L) is the volume of solution used, C
o (mg/L) is the detected initial concentration of adsorbate solution, whereas C
e (mg/L) is concentration of the solute in bulk phase at equilibrium, and M (g) is the weighted mass of adsorbent.
The kinetic experiments were performed as the reaction time was varied (10–120 min), with an initial triclosan concentration 40 mg L−1.
2.7. Determination of the pH Value of the Solution
The pH dependence of the triclosan adsorption was determined. In order to adjust the pH from 3.39 to 9.2, 0.1 M water solutions of sodium hydroxide and hydrochloric acid were used. The value of pH was measured using pH meter JENWAY 3310.
2.8. Determination of pH of Carbon Adsorbents
A total of 100 mL water and 4.0 g carbon were put together in a 250 mL beaker, covered with a glass cover, and then boiled for five minutes. The decanted portion was cooled down to 25 °C and the value of pH was measured using pH meter JENWAY 3310.
3. Results and Discussion
3.1. Characterization of the Adsorbents
Table 1 presents the results from the chemical composition of the adsorbents used. The obtained data show a big difference, especially in the ash content, mineral substances, and the oxygen content, in the composition of the adsorbents used, which could affect their adsorption capacity towards triclosan. The oxygen content is important, as it is related to the surface oxygen-containing groups, which, to a significant extent, determine the surface chemical characteristics and possibility of chemisorption [
19]. To establish the presence of centers, where chemical adsorption of triclosan can take place, the content of oxygen groups with different character on adsorbent surface is detected and presented in
Table 2.
The content of surface oxygen atoms in adsorbents is essential for the chemical adsorption of triclosan molecule, which contains a hydroxyl group, which can react with surface oxygen groups.
The results presented in
Table 2 show that adsorbent B obtained by oxidative treatment of adsorbent A with nitric acid has a significantly higher amount of oxygen groups with a more pronounced acid character (carboxylic and lactonic). The content of oxygen-containing groups in the remaining adsorbents is determined by the presence of oxygen atoms in the raw material used for its production.
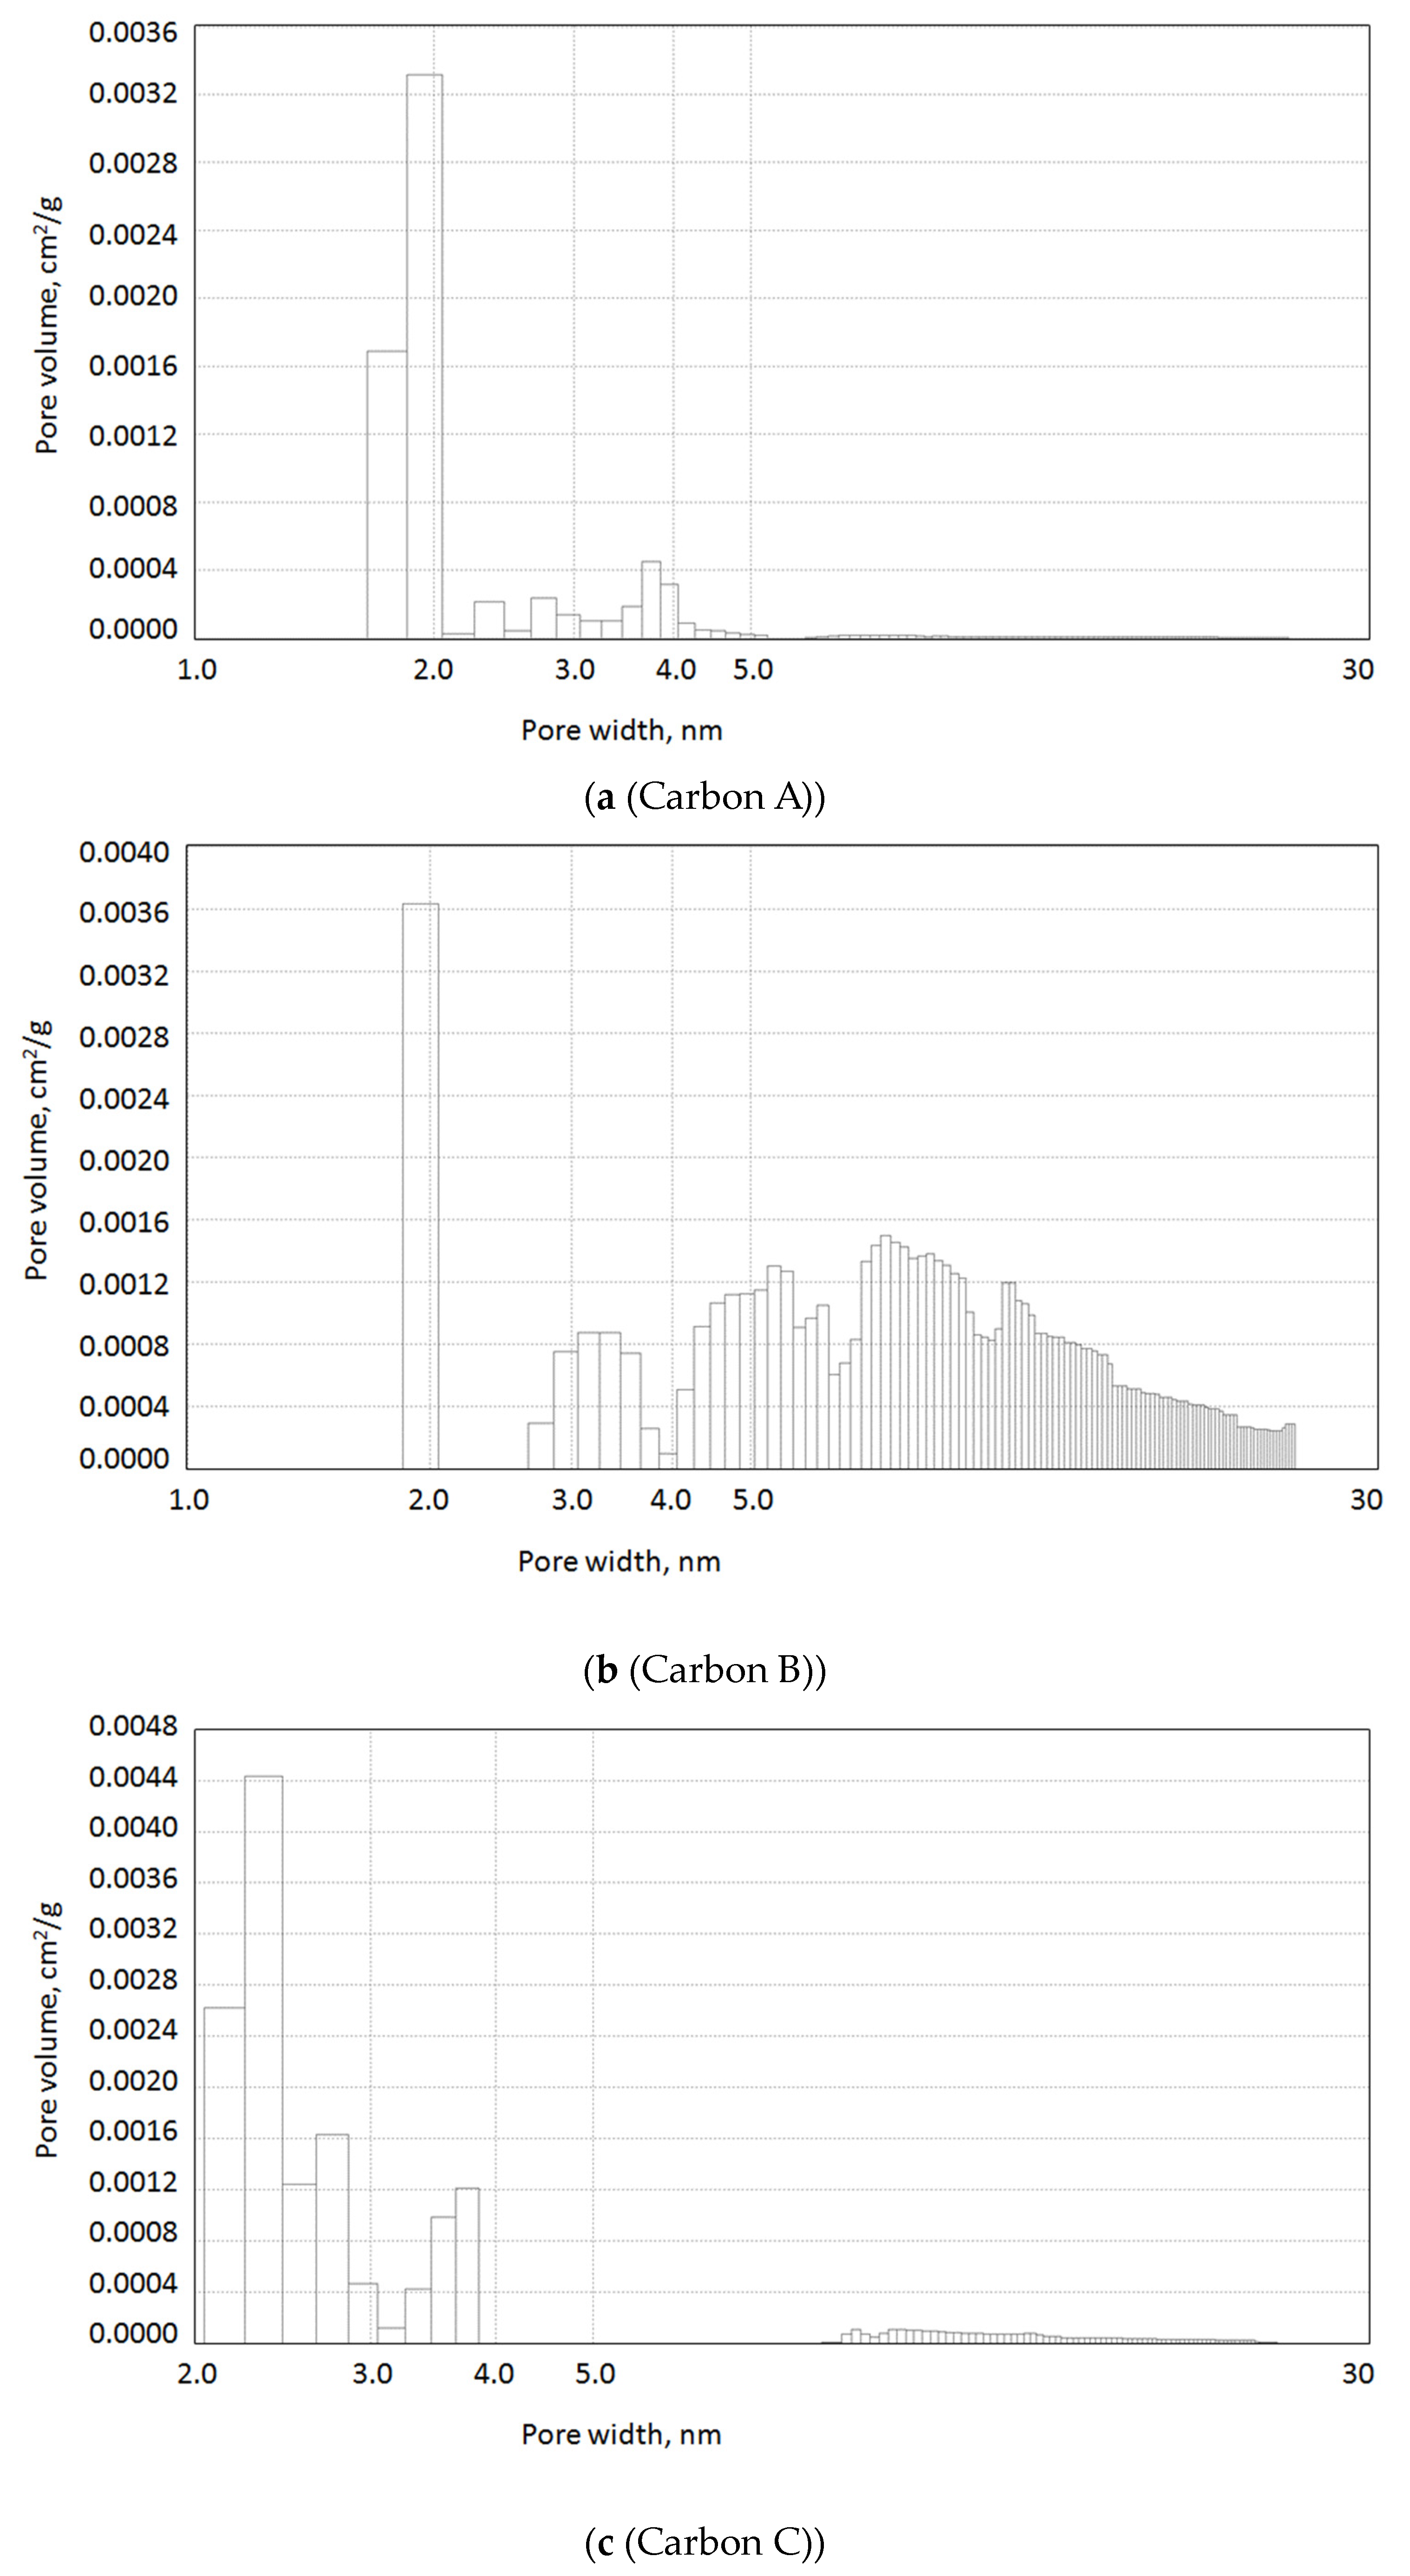
Data in
Table 3 and
Figure 1 show that satisfactory results are obtained for the surface porous texture and pore size distribution of the carbon adsorbents, obtained by flash pyrolysis. All the samples are characterized by moderate surface area (300–750 m
2/g) and presence of micro- and meso-pores. Due to the specific character of carbon foam synthesis, it was necessary to use water vapor activation (hydro-pyrolysis) to form micro- and meso-pores and higher surface area. A decrease in the pore volume and specific surface area of the carbon obtained from the RDF fuel after oxidation treatment with HNO
3 is observed. This is also confirmed by the iodine number value. This is due to the spatial interference of oxygen-containing groups formed on the surface of the material as a result of oxidation with nitric acid.
Carbon adsorbents show significant differences in their physicochemical properties. This will allow conclusions to be drawn about the degree of influence of their characteristics, which are important for the adsorption process, such as surface area, porous texture, chemical nature of the surface, and the amount of oxygen groups of different character, ash content, etc., on their adsorption capacity towards triclosan. It should be noted that the only adsorbent that has undergone physical activation with water vapor (hydro-pyrolysis) is carbon foam. All the others were obtained after heat treatment of the precursor under heat shock mode. The purpose of this treatment is the formation of more pores and to increase the surface area after rapid processes of thermal destruction and evolving volatile substances.
3.2. Kinetic Adsorption of Triclosan by the Carbon Adsorbents
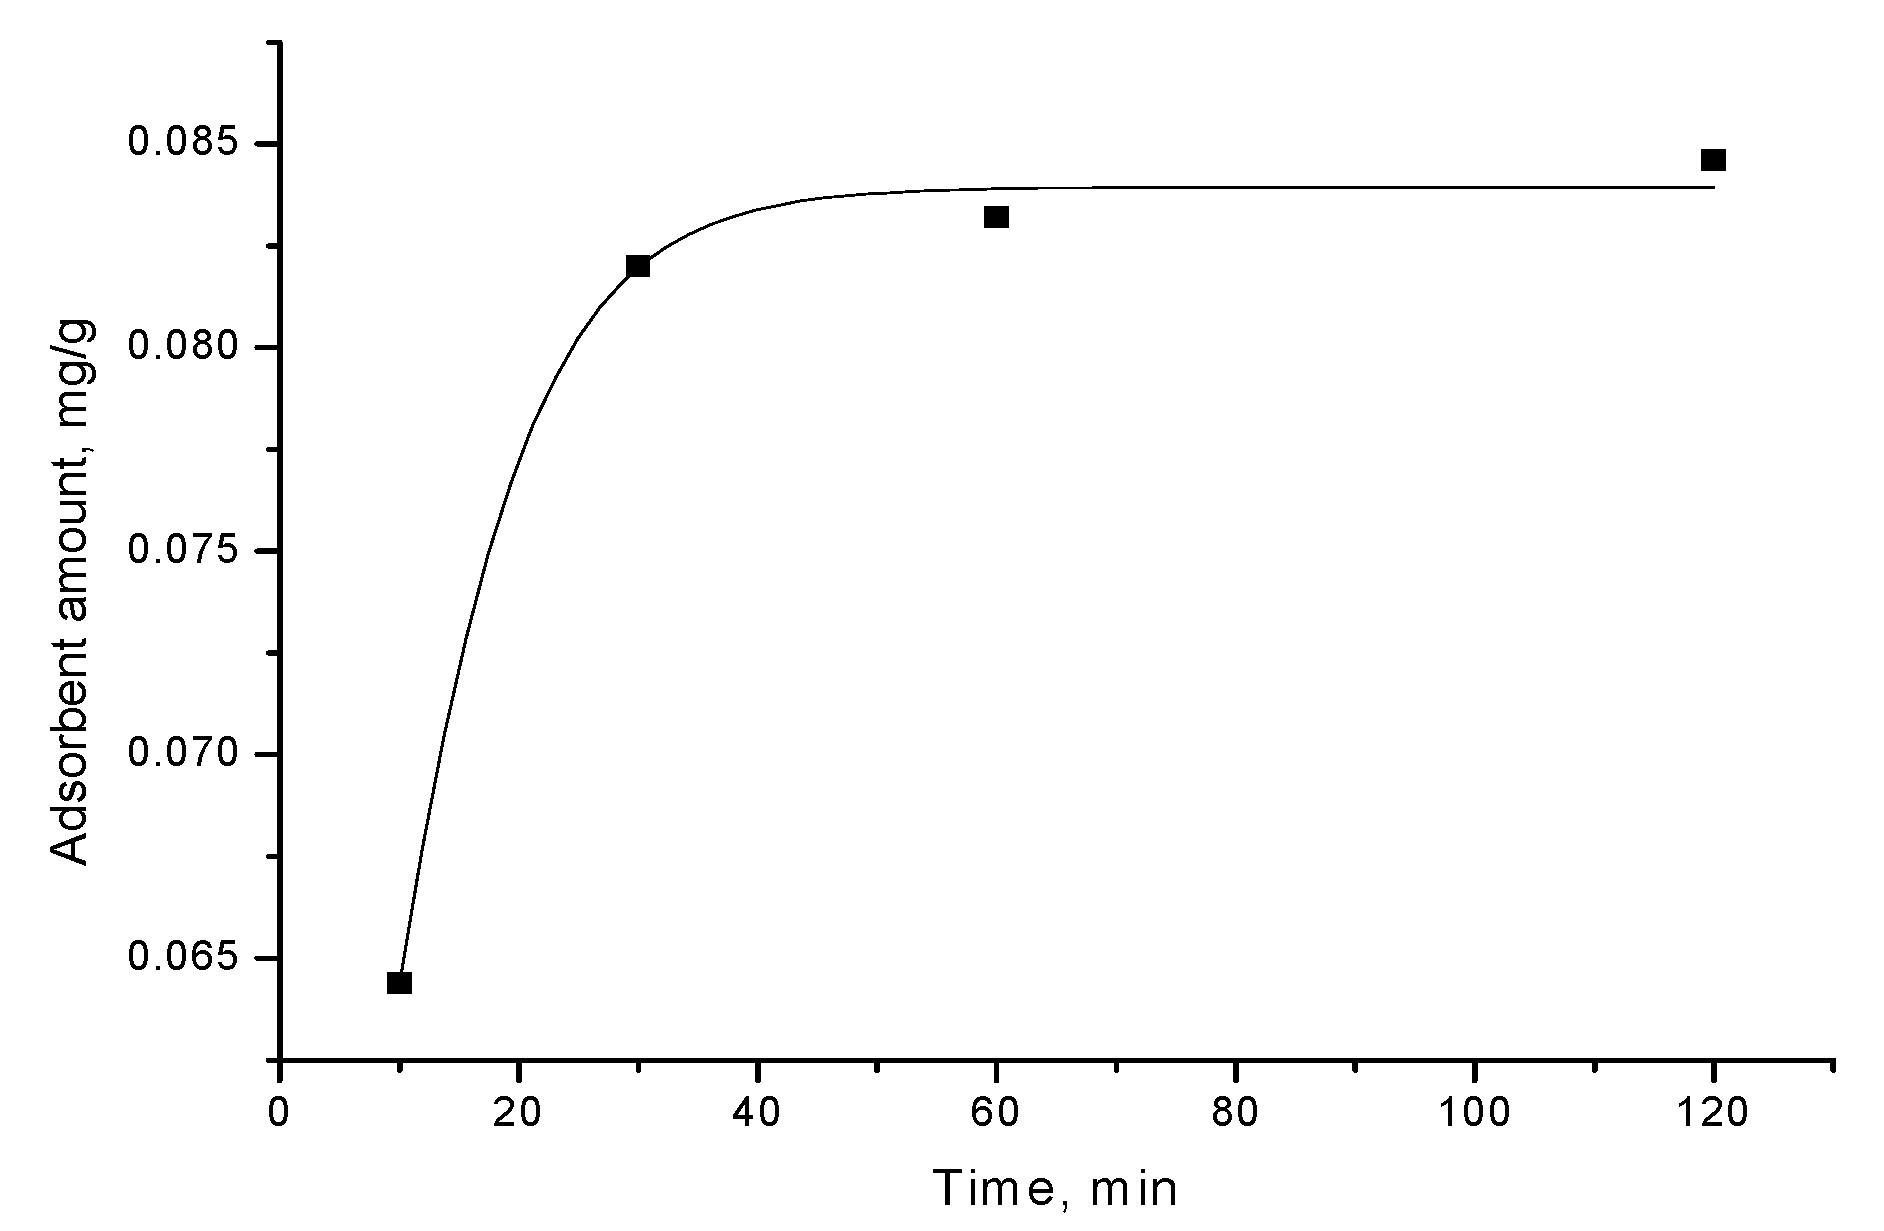
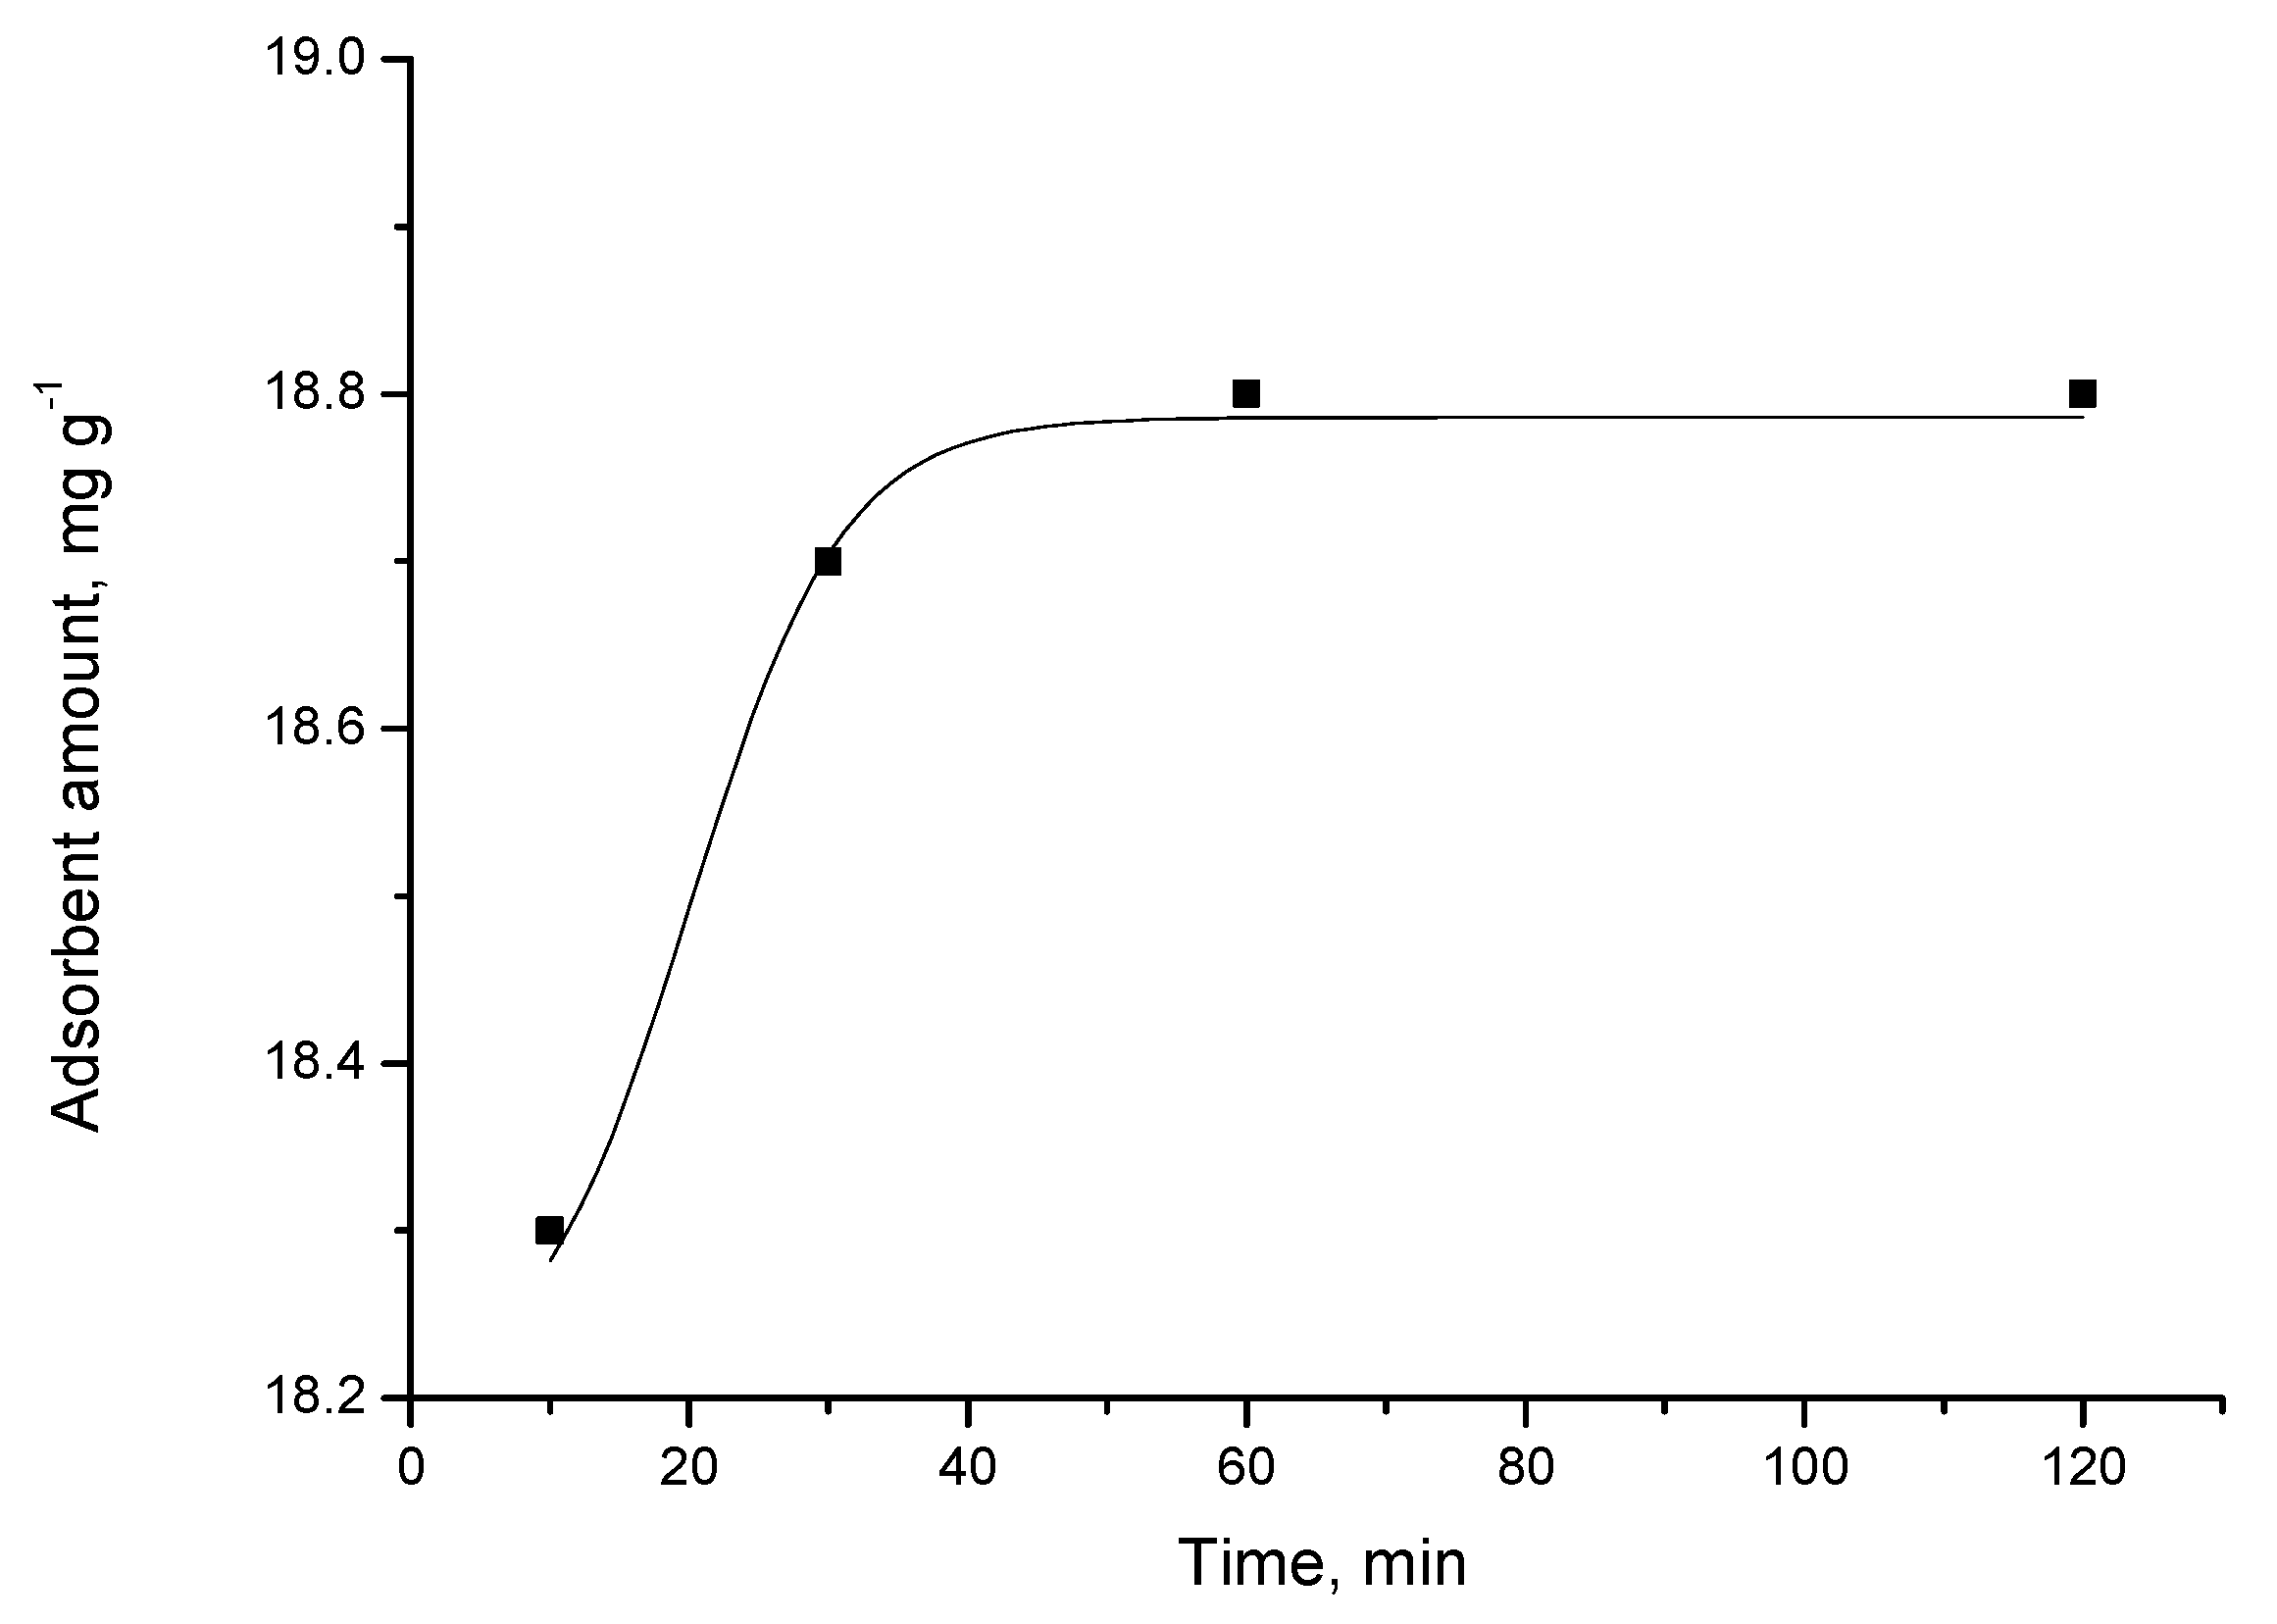
The kinetic curve, presented in
Figure 2, shows triclosan adsorption from aqueous solution, at concentration 40 mg/L, on adsorbent A, obtained by flash pyrolysis of RDF at a temperature of 800 °C. The kinetic data disclose that triclosan adsorption process sharply increases and, after that, gradually slows down and further remains constant.
The obtained results can be explained by the relative decrease in the amount of the number of unoccupied sites on the surface of carbon adsorbent during adsorption process. The plot shows saturation of the quantity of adsorbed triclosan, which forms triclosan monolayer on the adsorbent surface (
Figure 2).
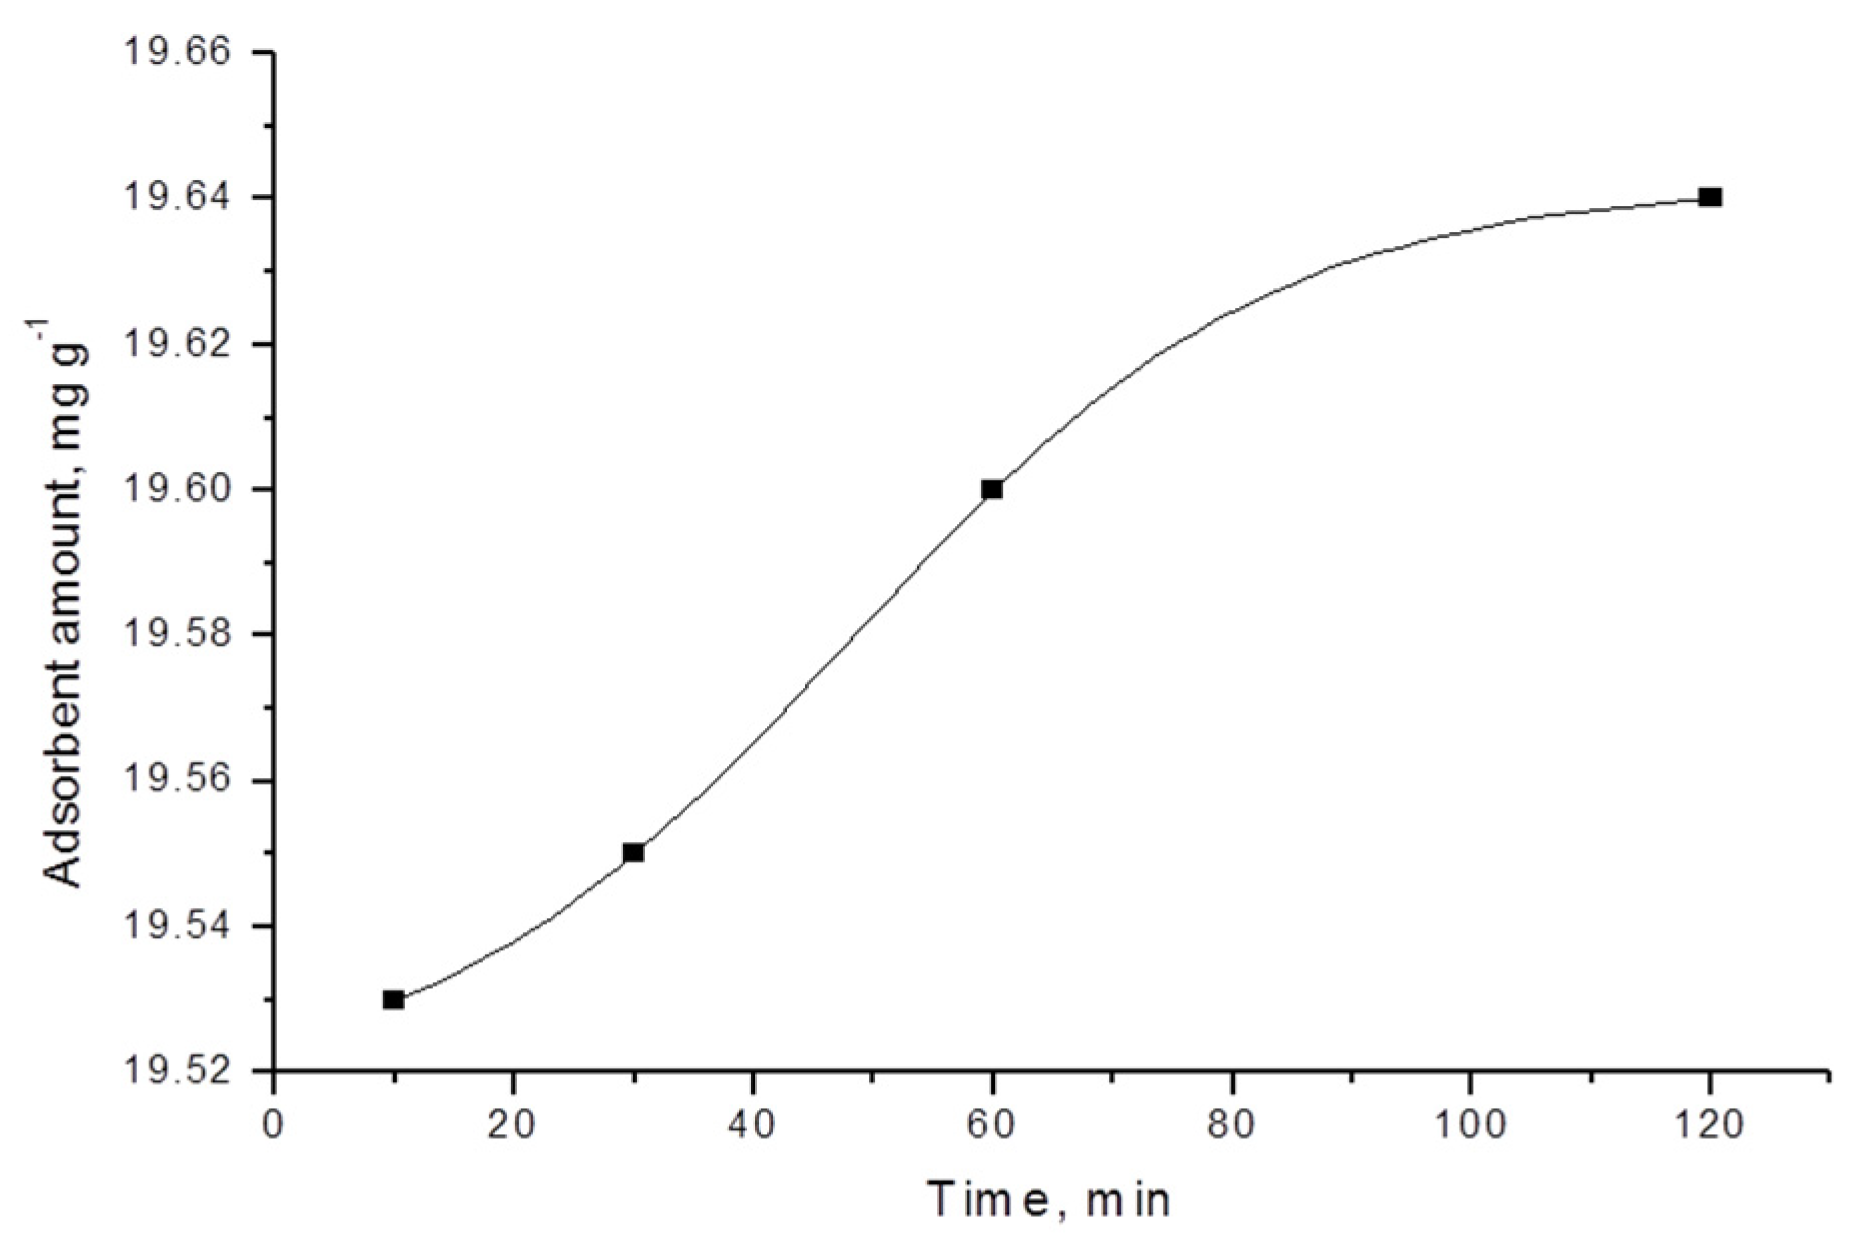
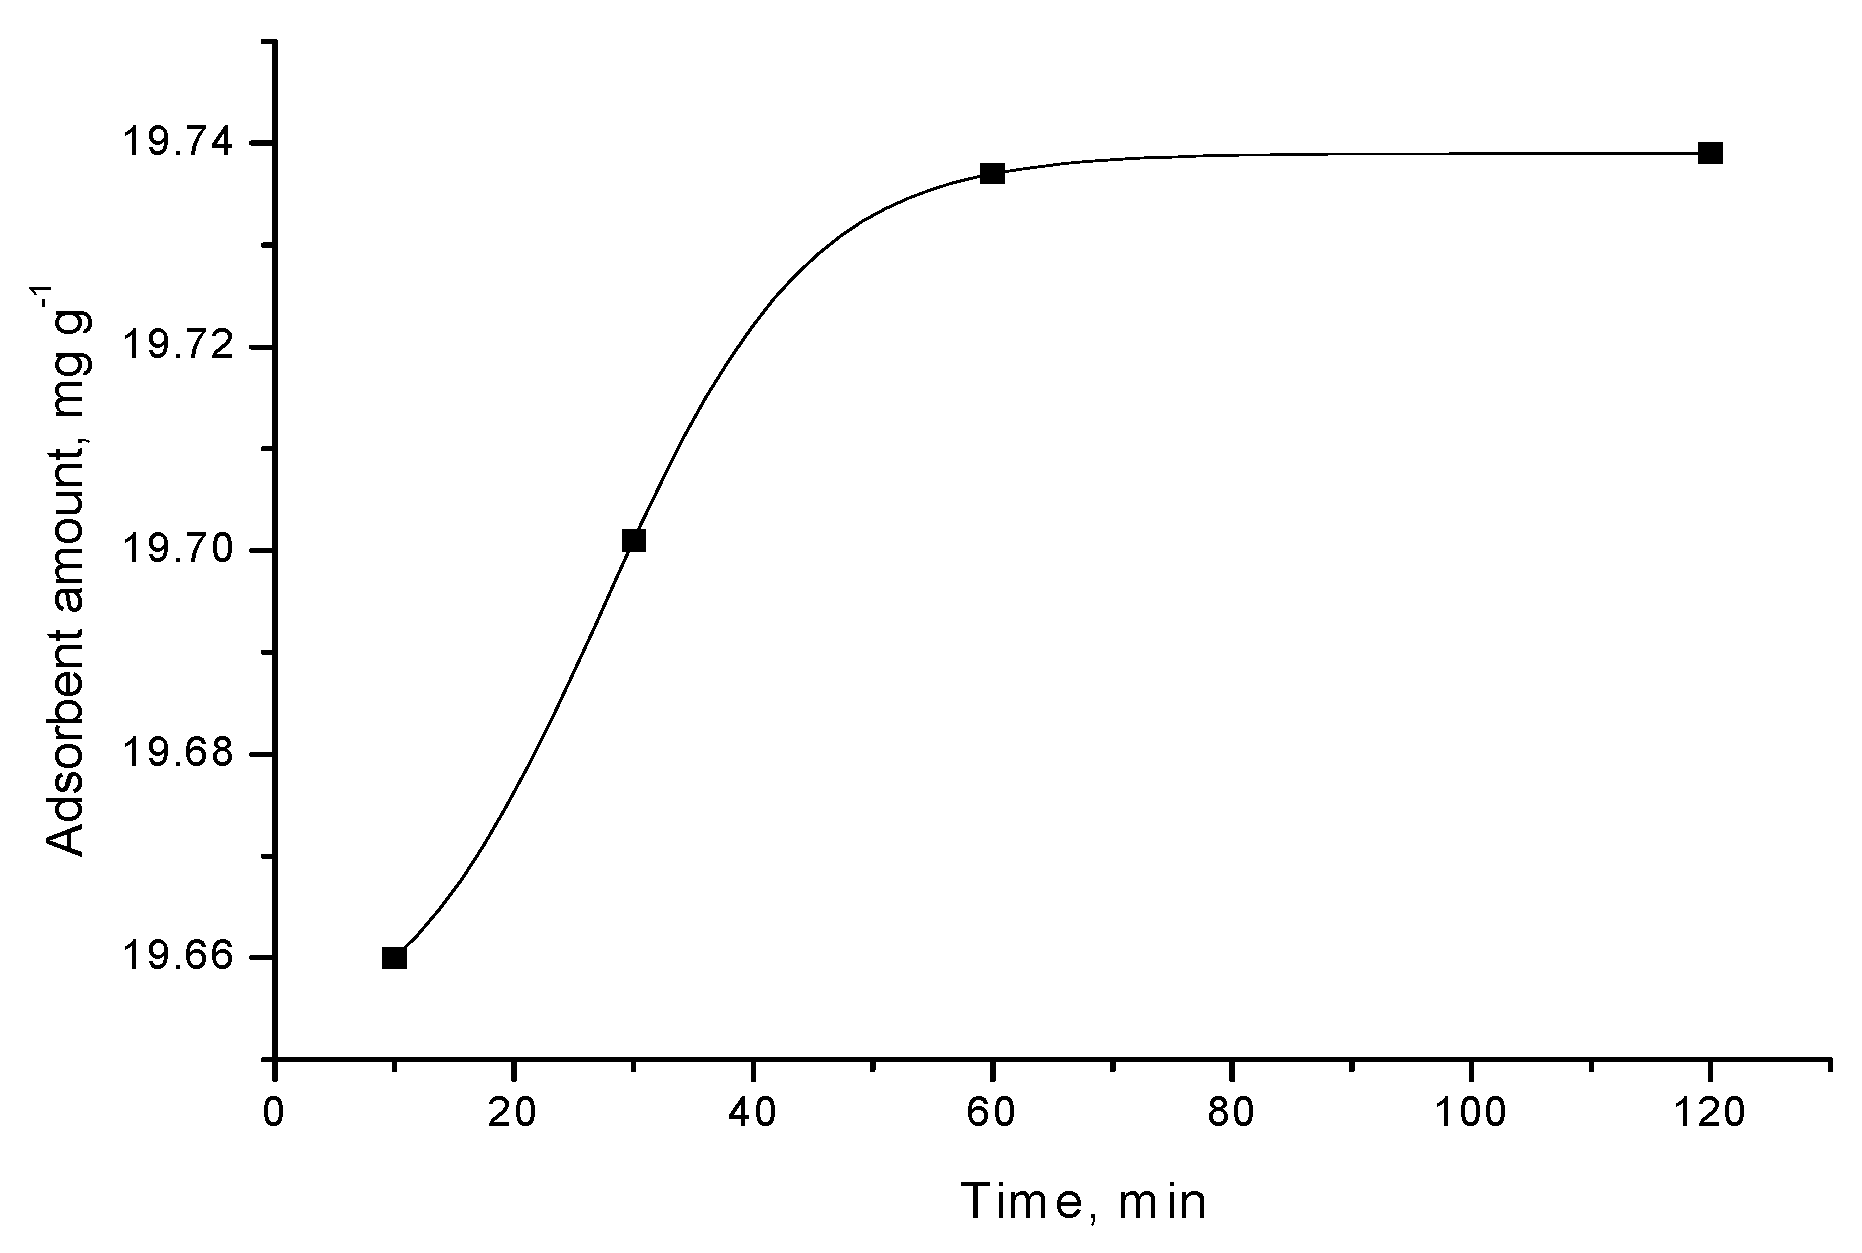
Various kinetic models can be used to understand the dominant mechanism of the adsorption processes and to predict adsorption behavior with time [
20]. The results from the kinetic studies of the adsorption of triclosan by carbon adsorbents demonstrate that the kinetic curves are of pseudo-first order (
Figure 2,
Figure 3,
Figure 4 and
Figure 5).
For most carbon adsorbent, the adsorption equilibrium is attained relatively quickly, after 30–60 min. The exception is activated carbon foam, where the equilibrium occurs after 120 min. When examining the differences in the characteristics of the adsorbents used, it could be concluded that more time is required for reaching the equilibrium when using activated carbon foam. This is probably affected by significantly larger surface area and dominantly microporous structure in this case; thus, more time is needed for the triclosan molecules to reach all the active centers on the surface.
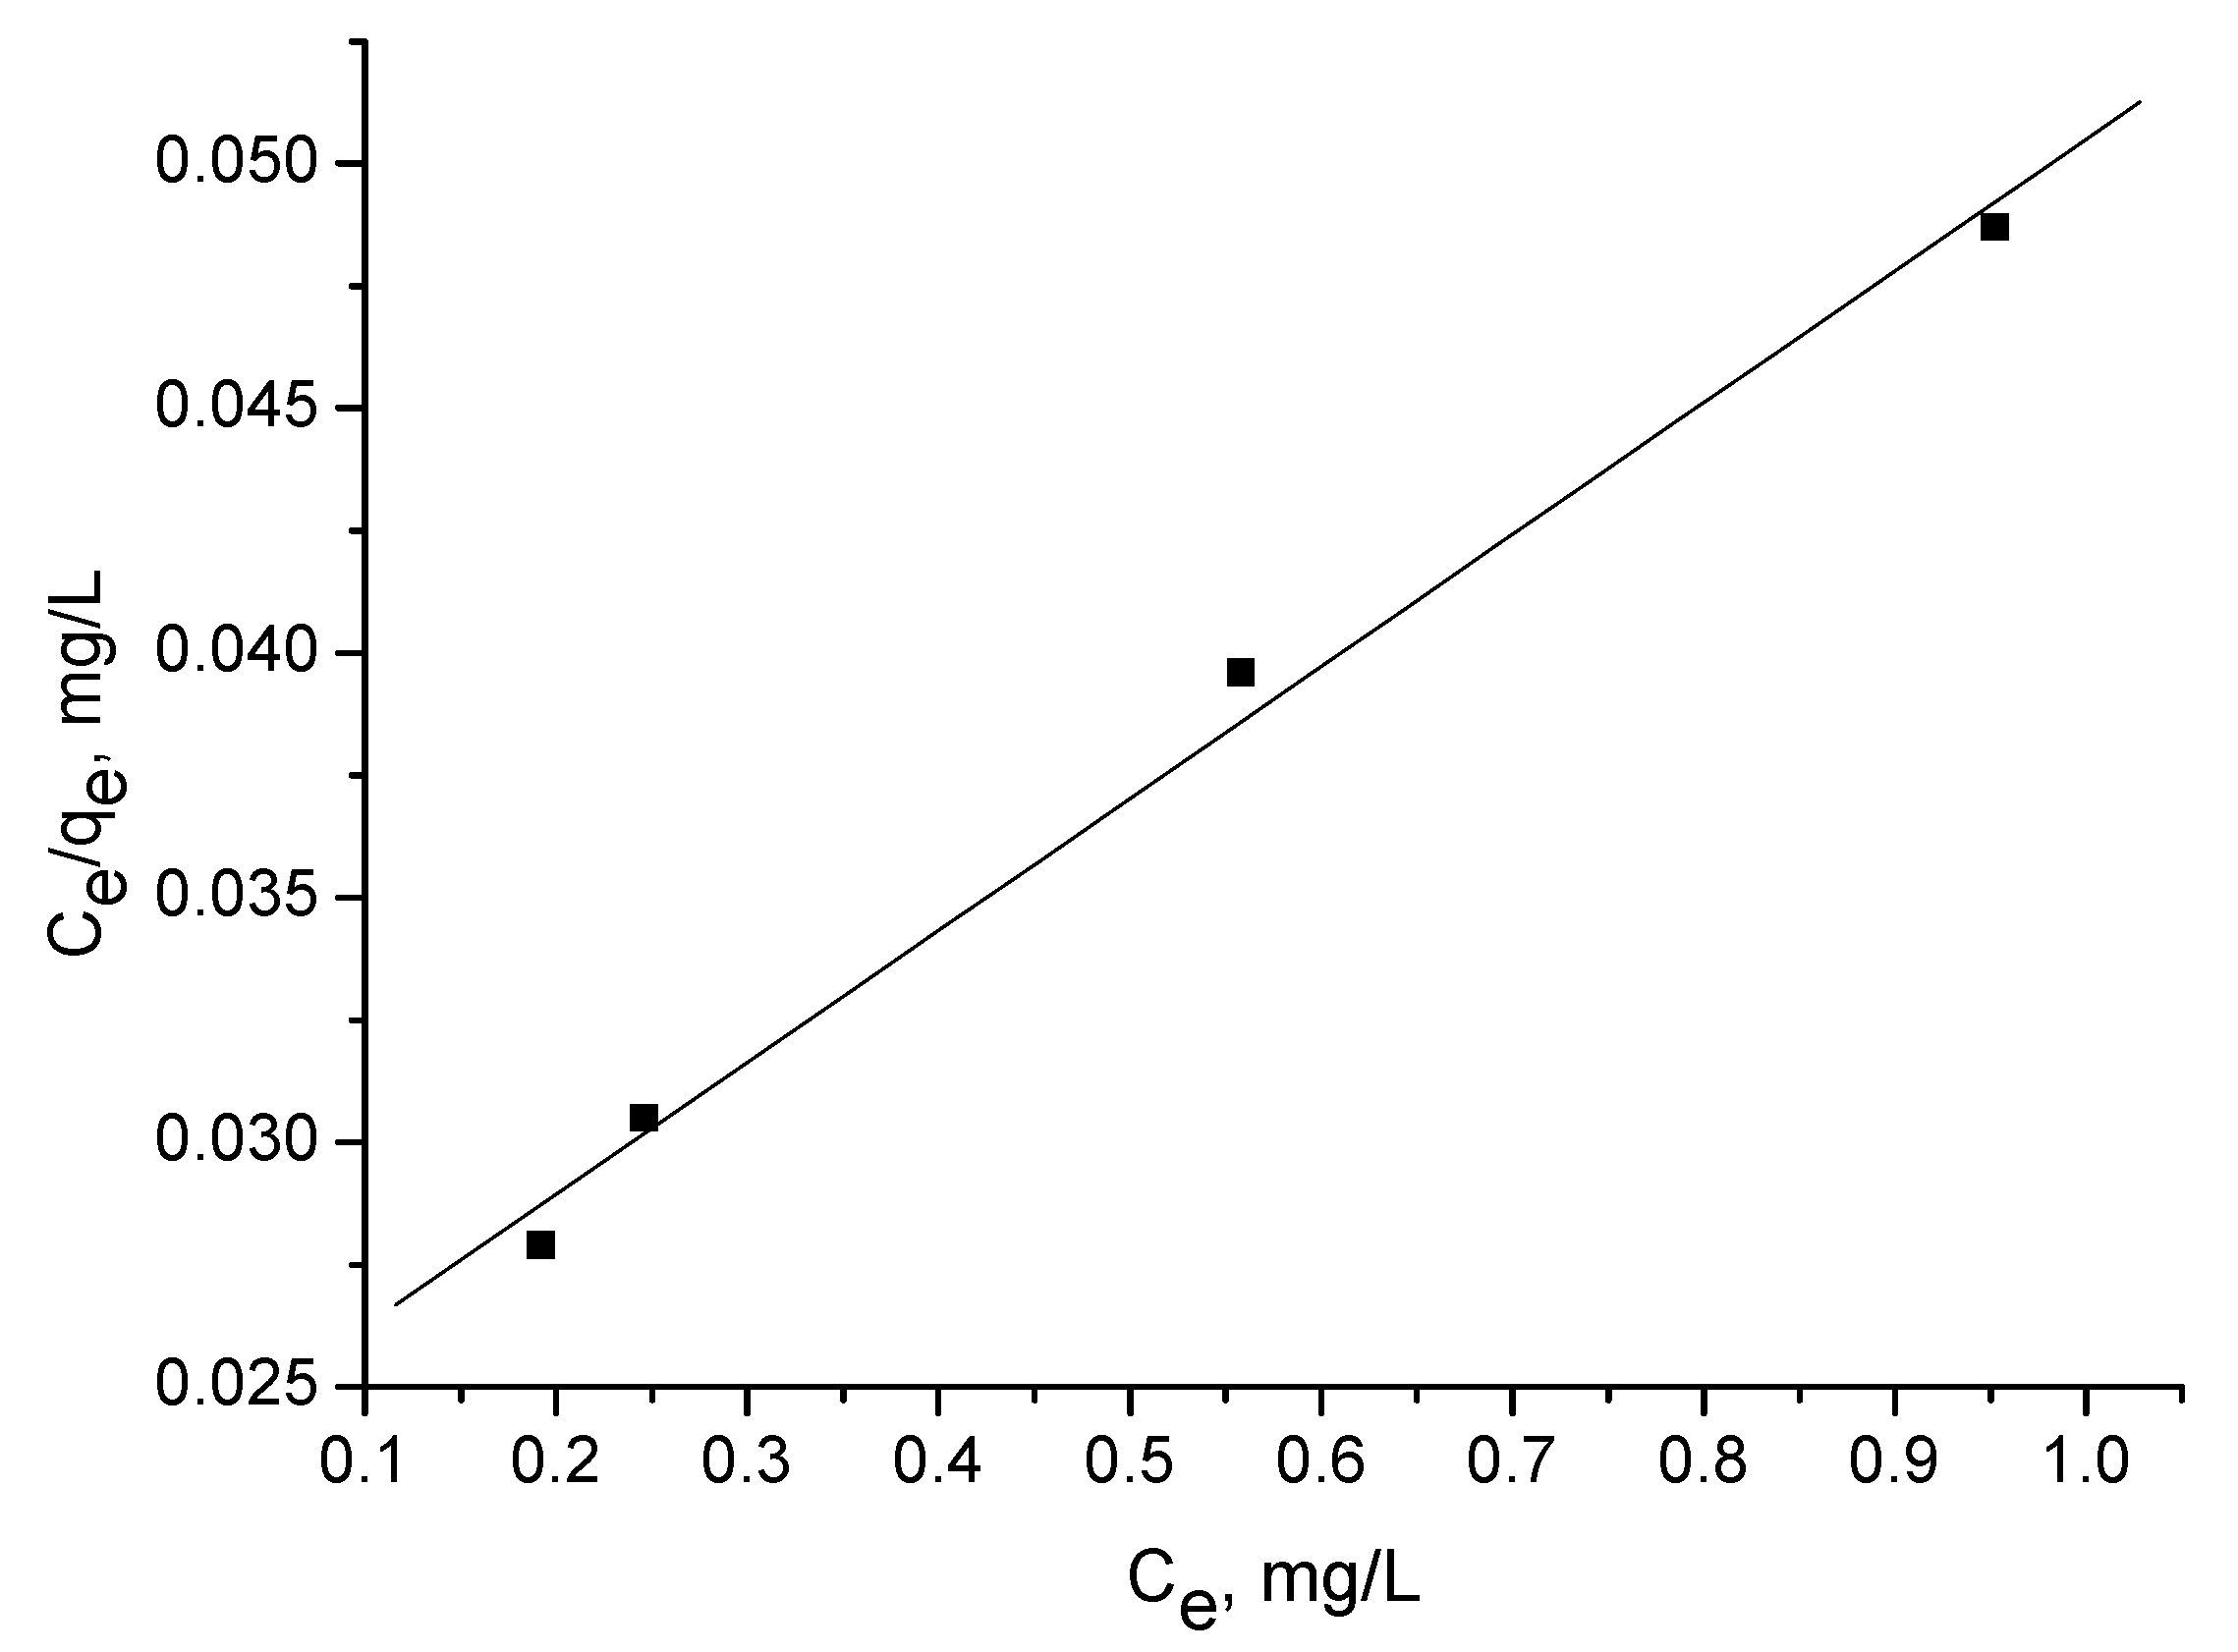
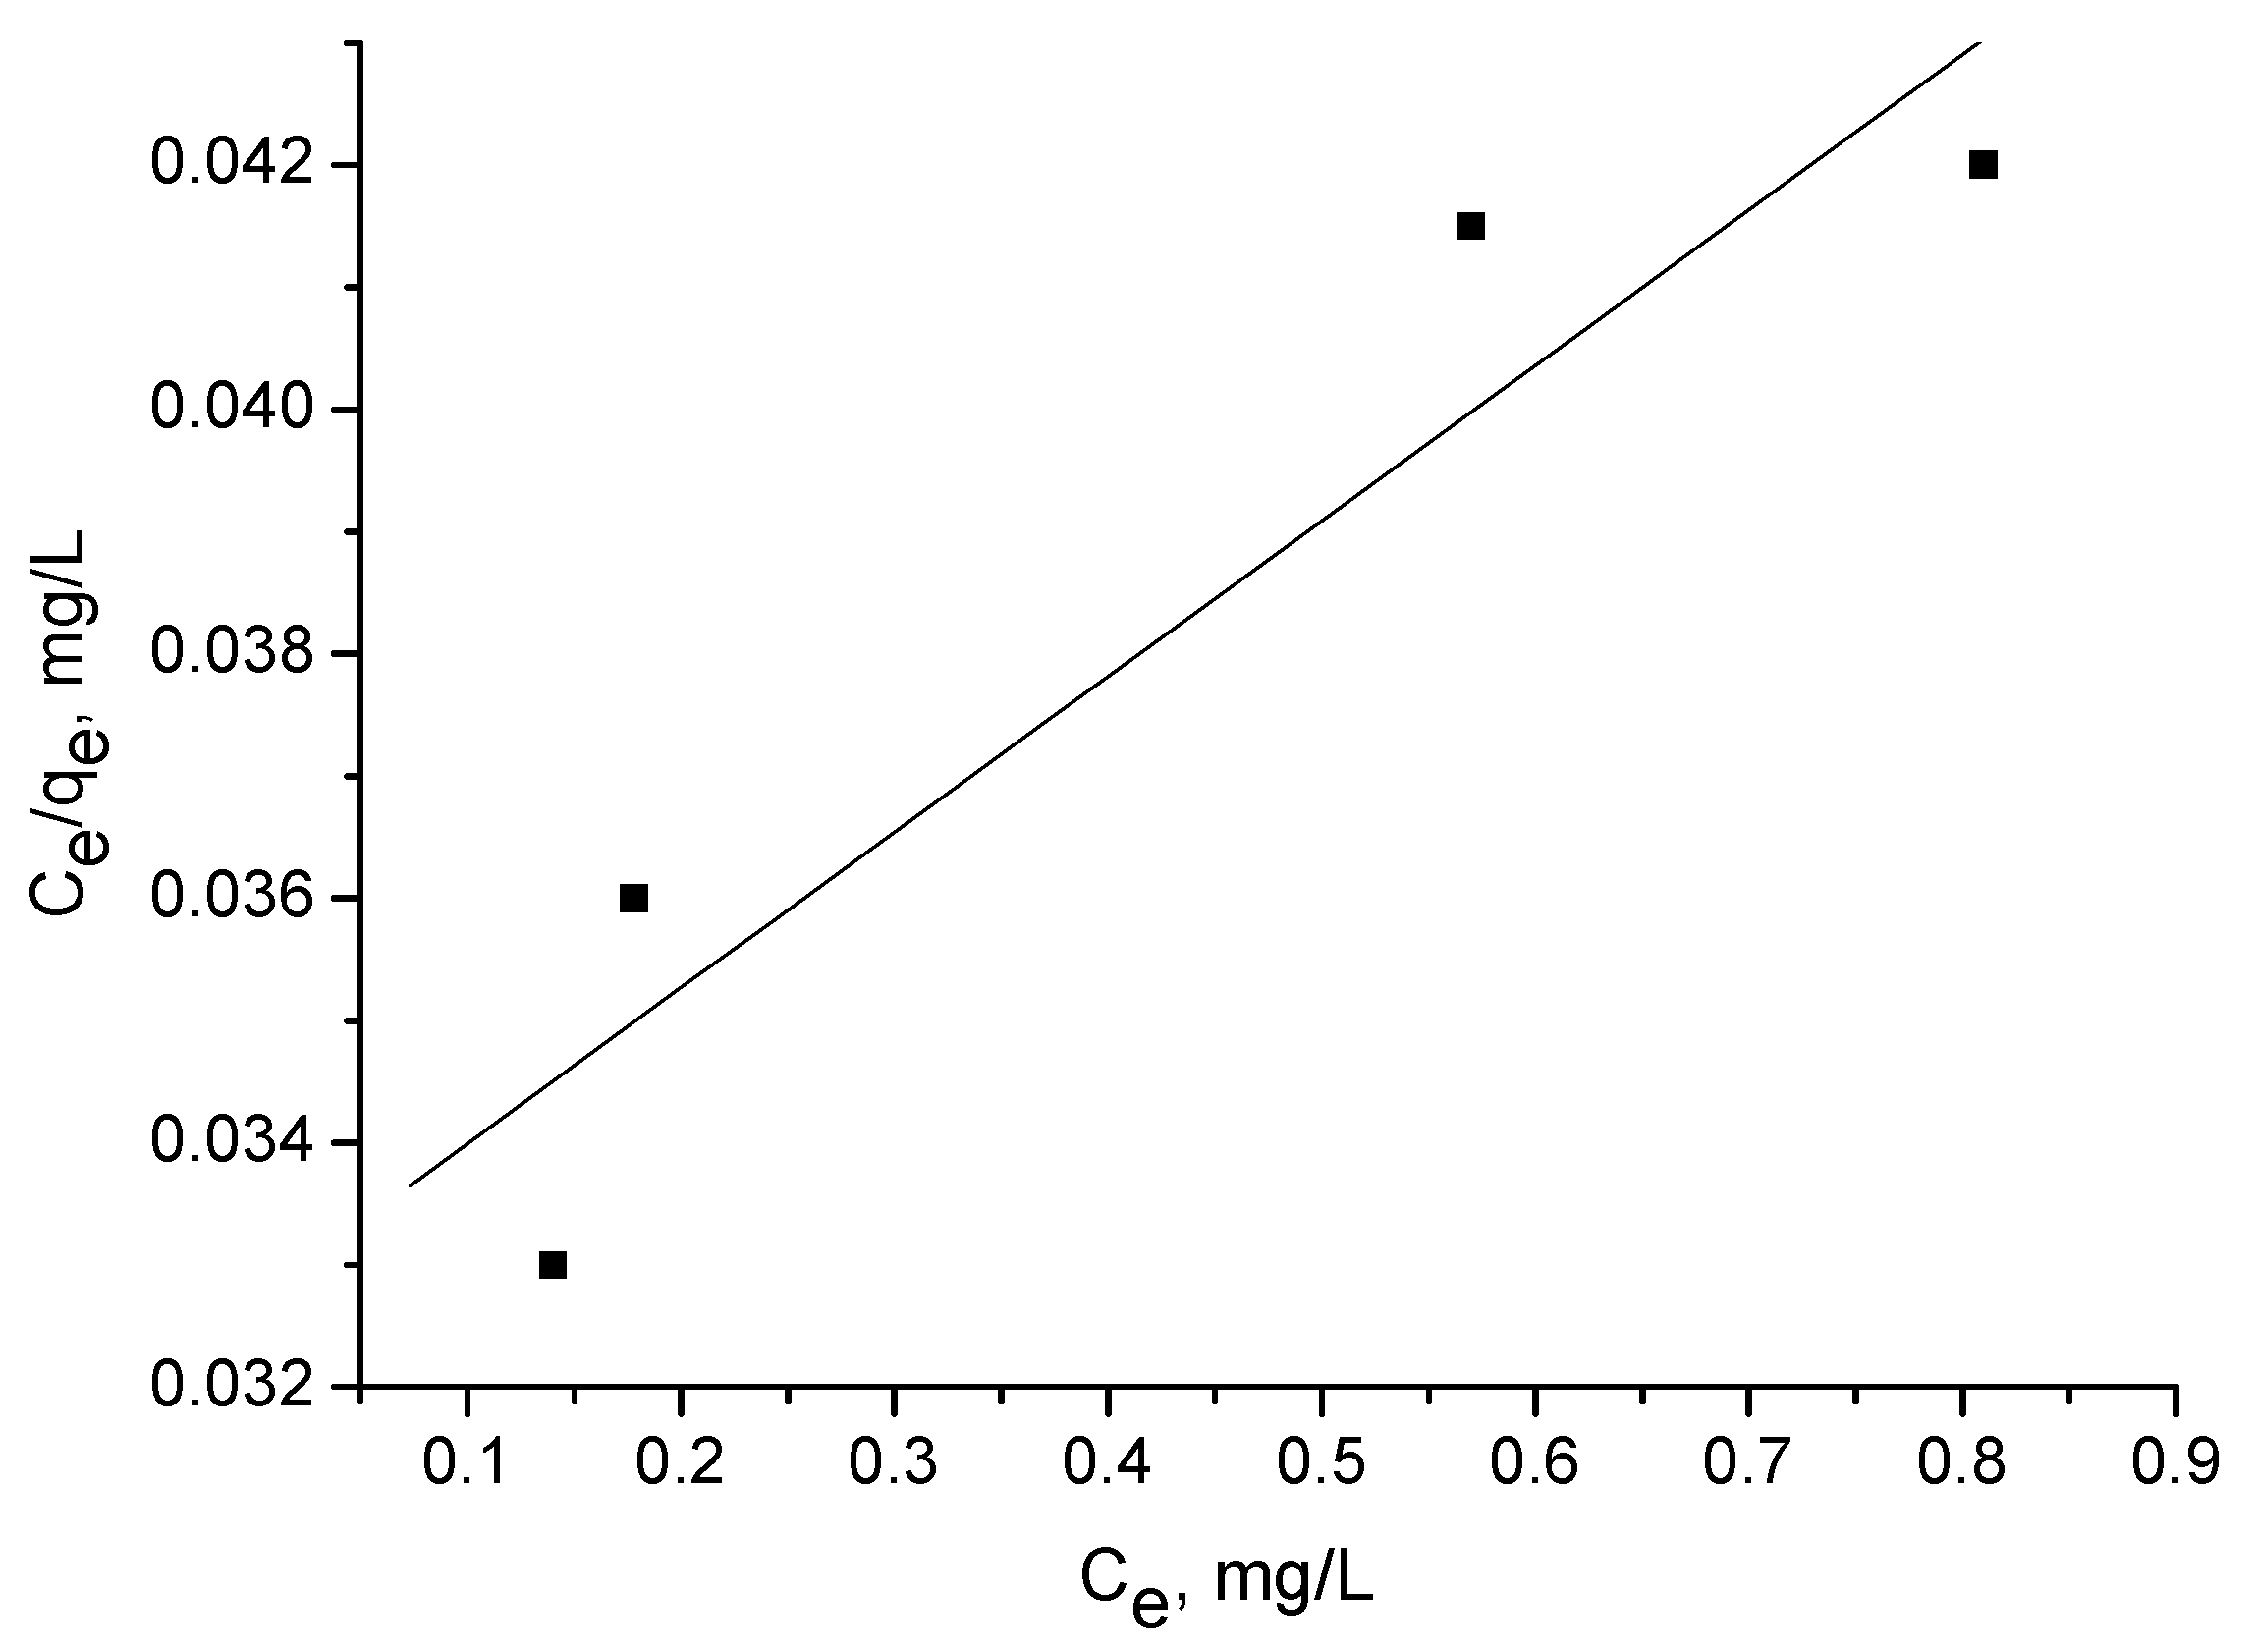
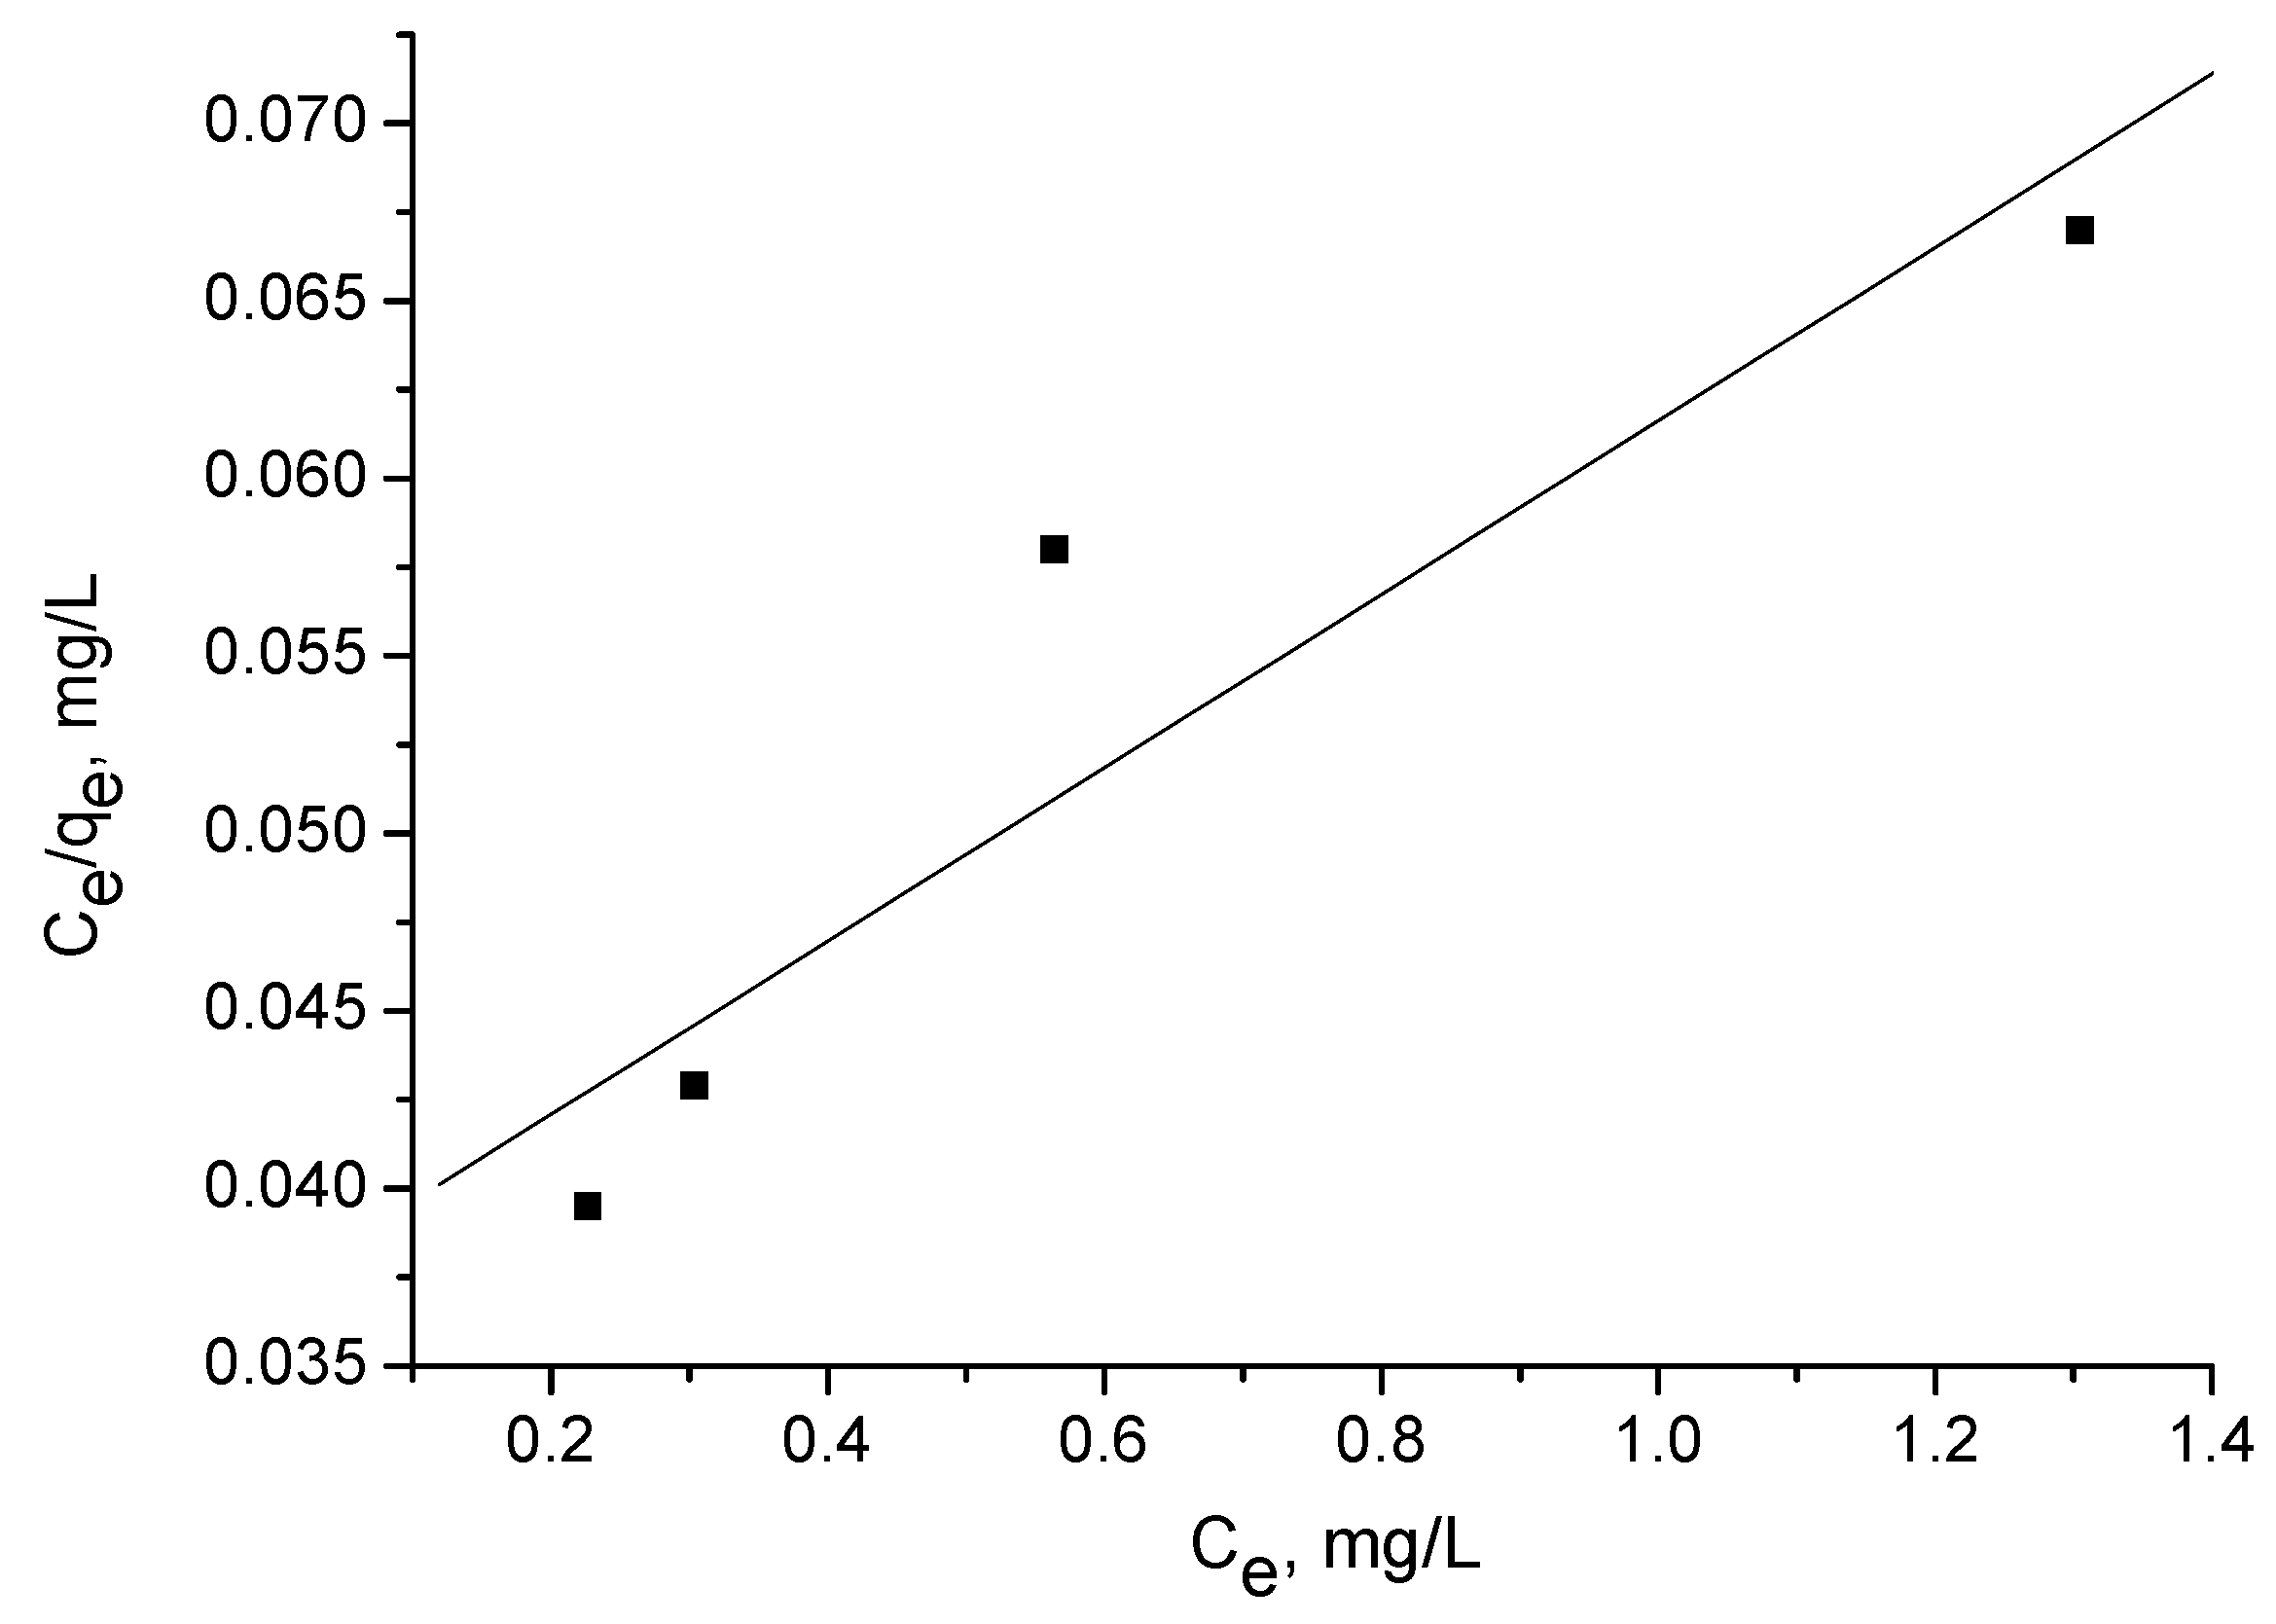
3.3. Langmuir Isotherm for Triclosan Adsorption by Activated Carbon
The Langmuir isotherm experiments were performed using several concentrations: 5, 10, 20, and 40 mg/l.
Figure 6,
Figure 7 and
Figure 8 illustrate adsorption of triclosan at equilibrium as a function of the equilibrium triclosan concentration, C
e. The isotherm of triclosan on the activated carbon corresponds to Type I [
21]. The adsorption mechanism is of L2 type, according to Giles et al. [
22].
The adsorption capacity Q
o (
Table 4) was calculated from the linearized Langmuir plot:
where C
e is the equilibrium concentration (mg/L); q
e is the amount of triclosan adsorbed at equilibrium (mg/g); and Q
o and b are the characteristic Langmuir parameters, related to the maximum adsorption capacity and affinity of adsorption, respectively.
The model is frequently used to interpret adsorption from diluted solutions. The value of Q
o represents the limit for pollutant adsorption from solution and b can be considered as a measure of the adsorption energy [
21].
The Langmuir isotherm (not shown) of oxidized carbon (adsorbent B) did not give a good result, most likely due to the large number of oxygen-containing groups on the surface of the adsorbent, which is a prerequisite for both physical and chemical adsorption. Triclosan dissolution in water is problematic, which also could cause poor results for adsorption in this case. This is a carbon adsorbent with more heterogeneous surface and it is known that, for such adsorbents, it is more appropriate to use the Freundlich isotherm.
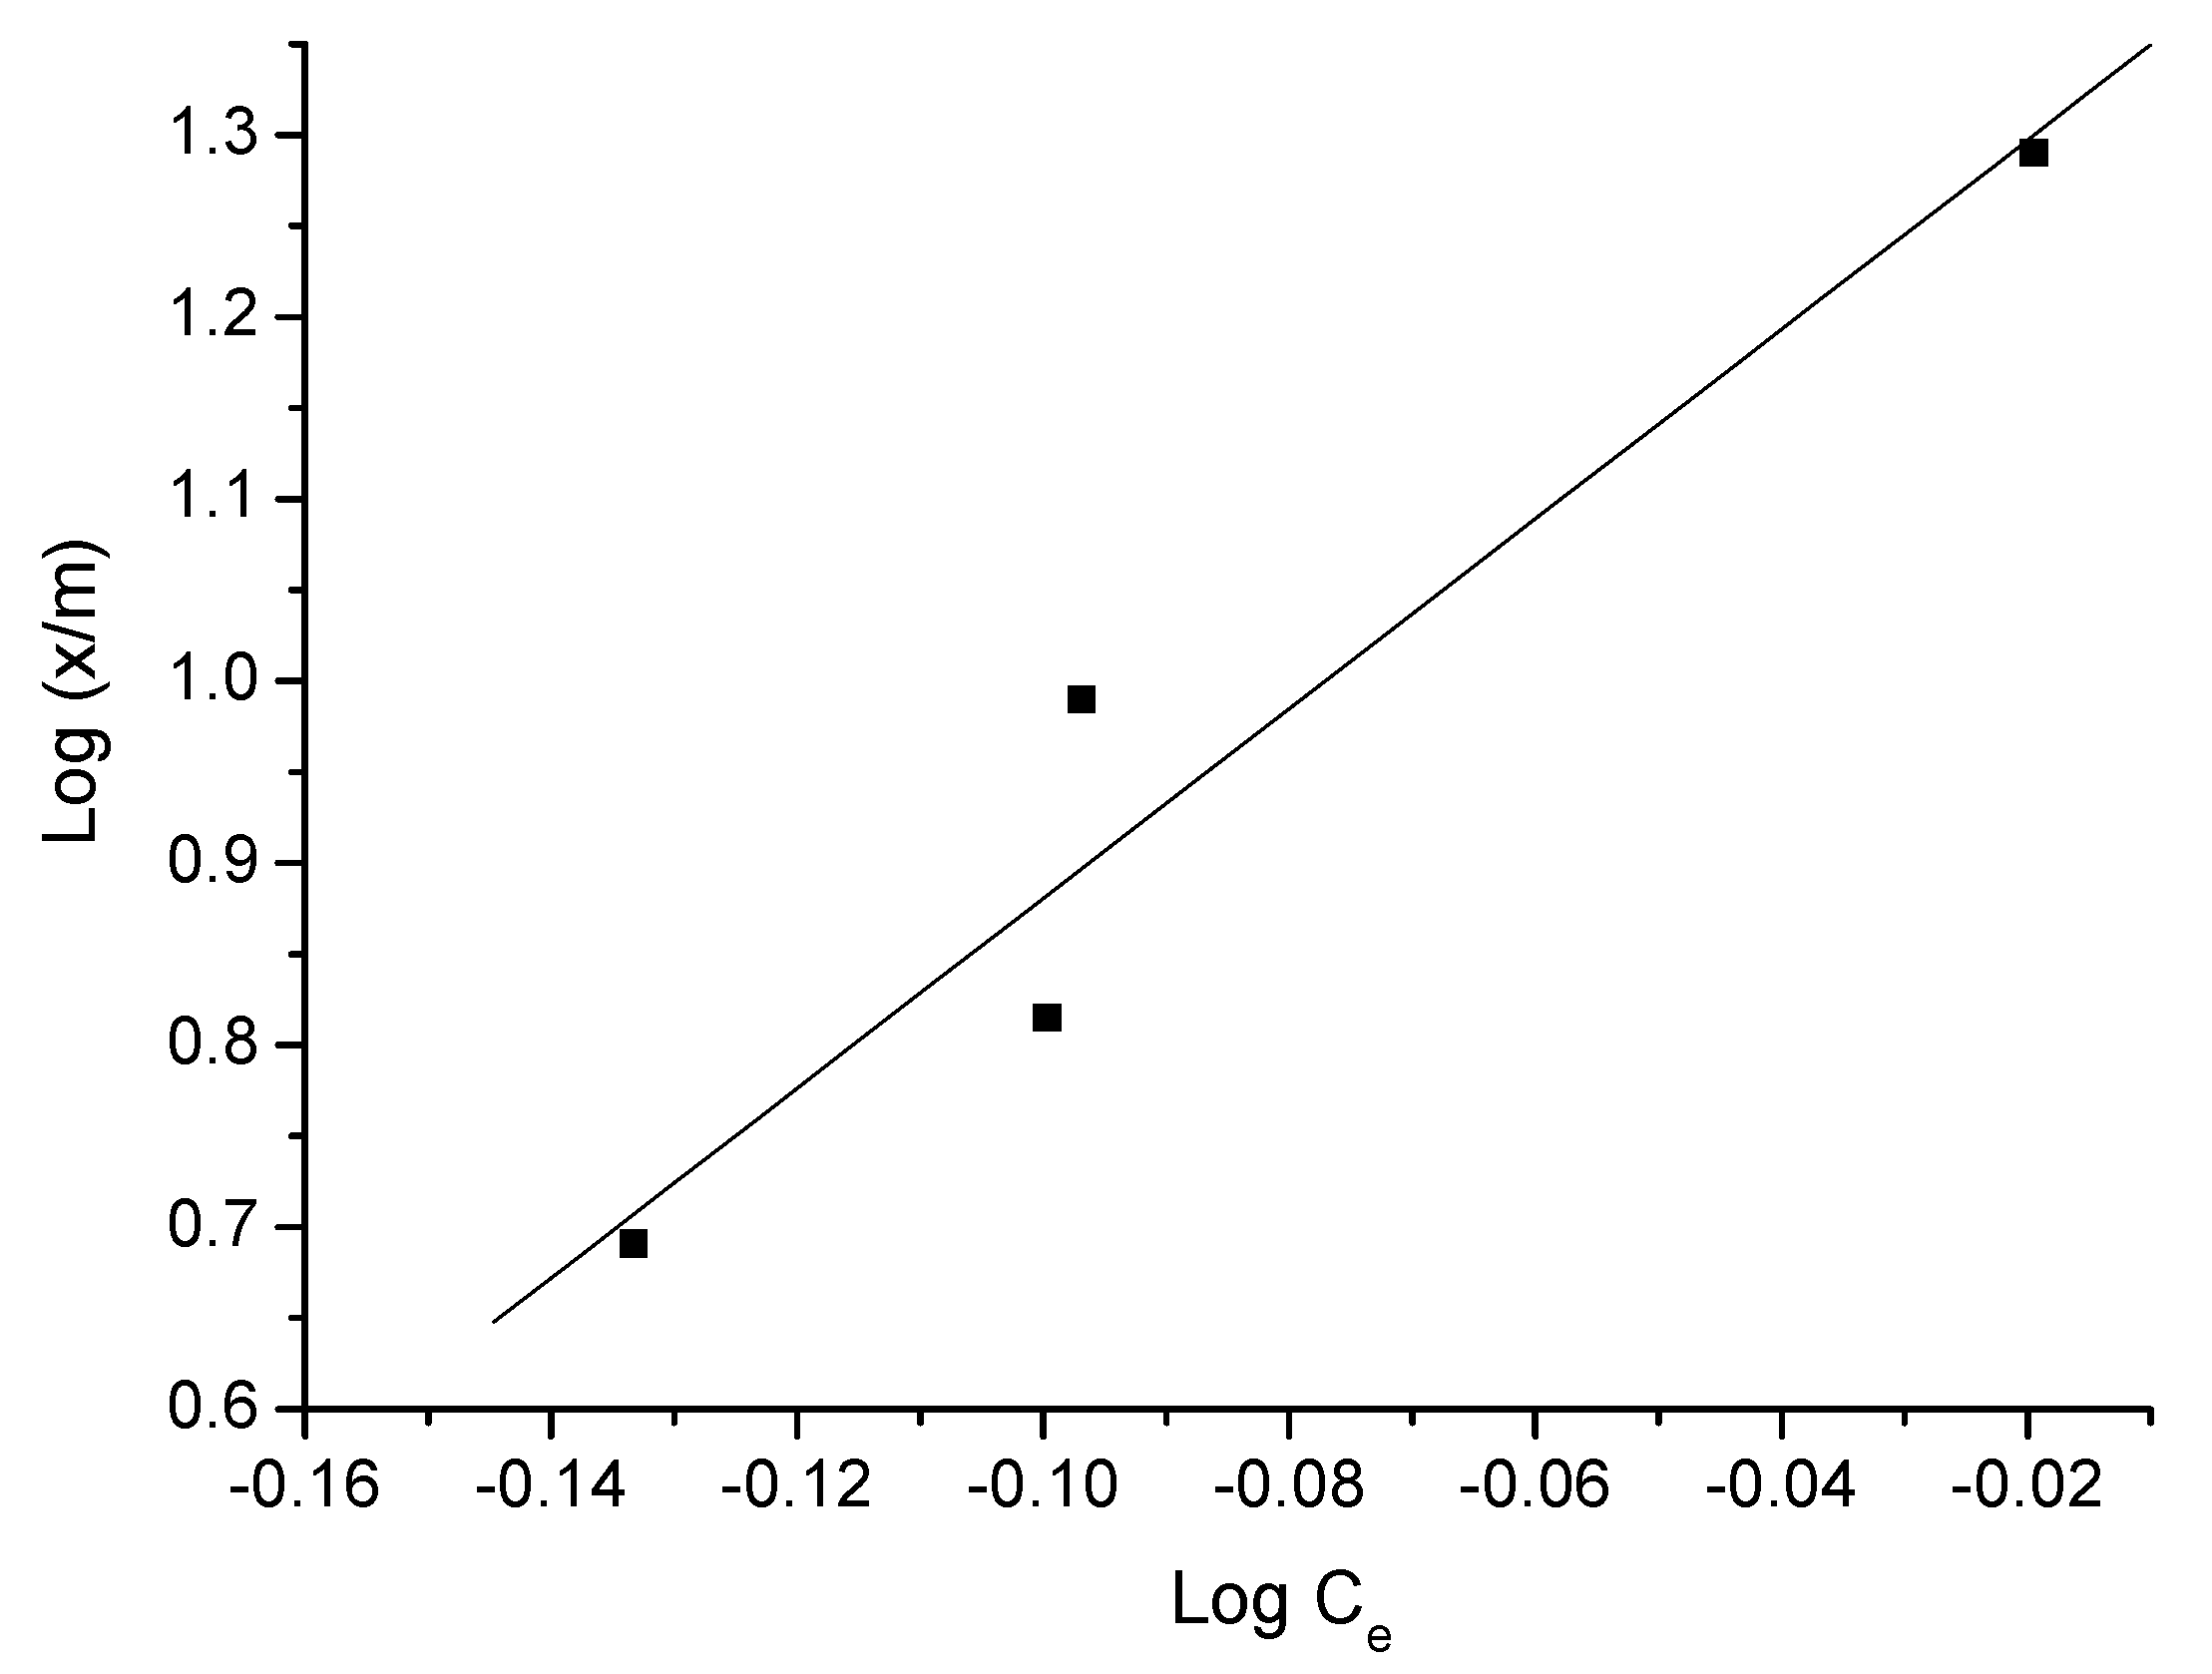
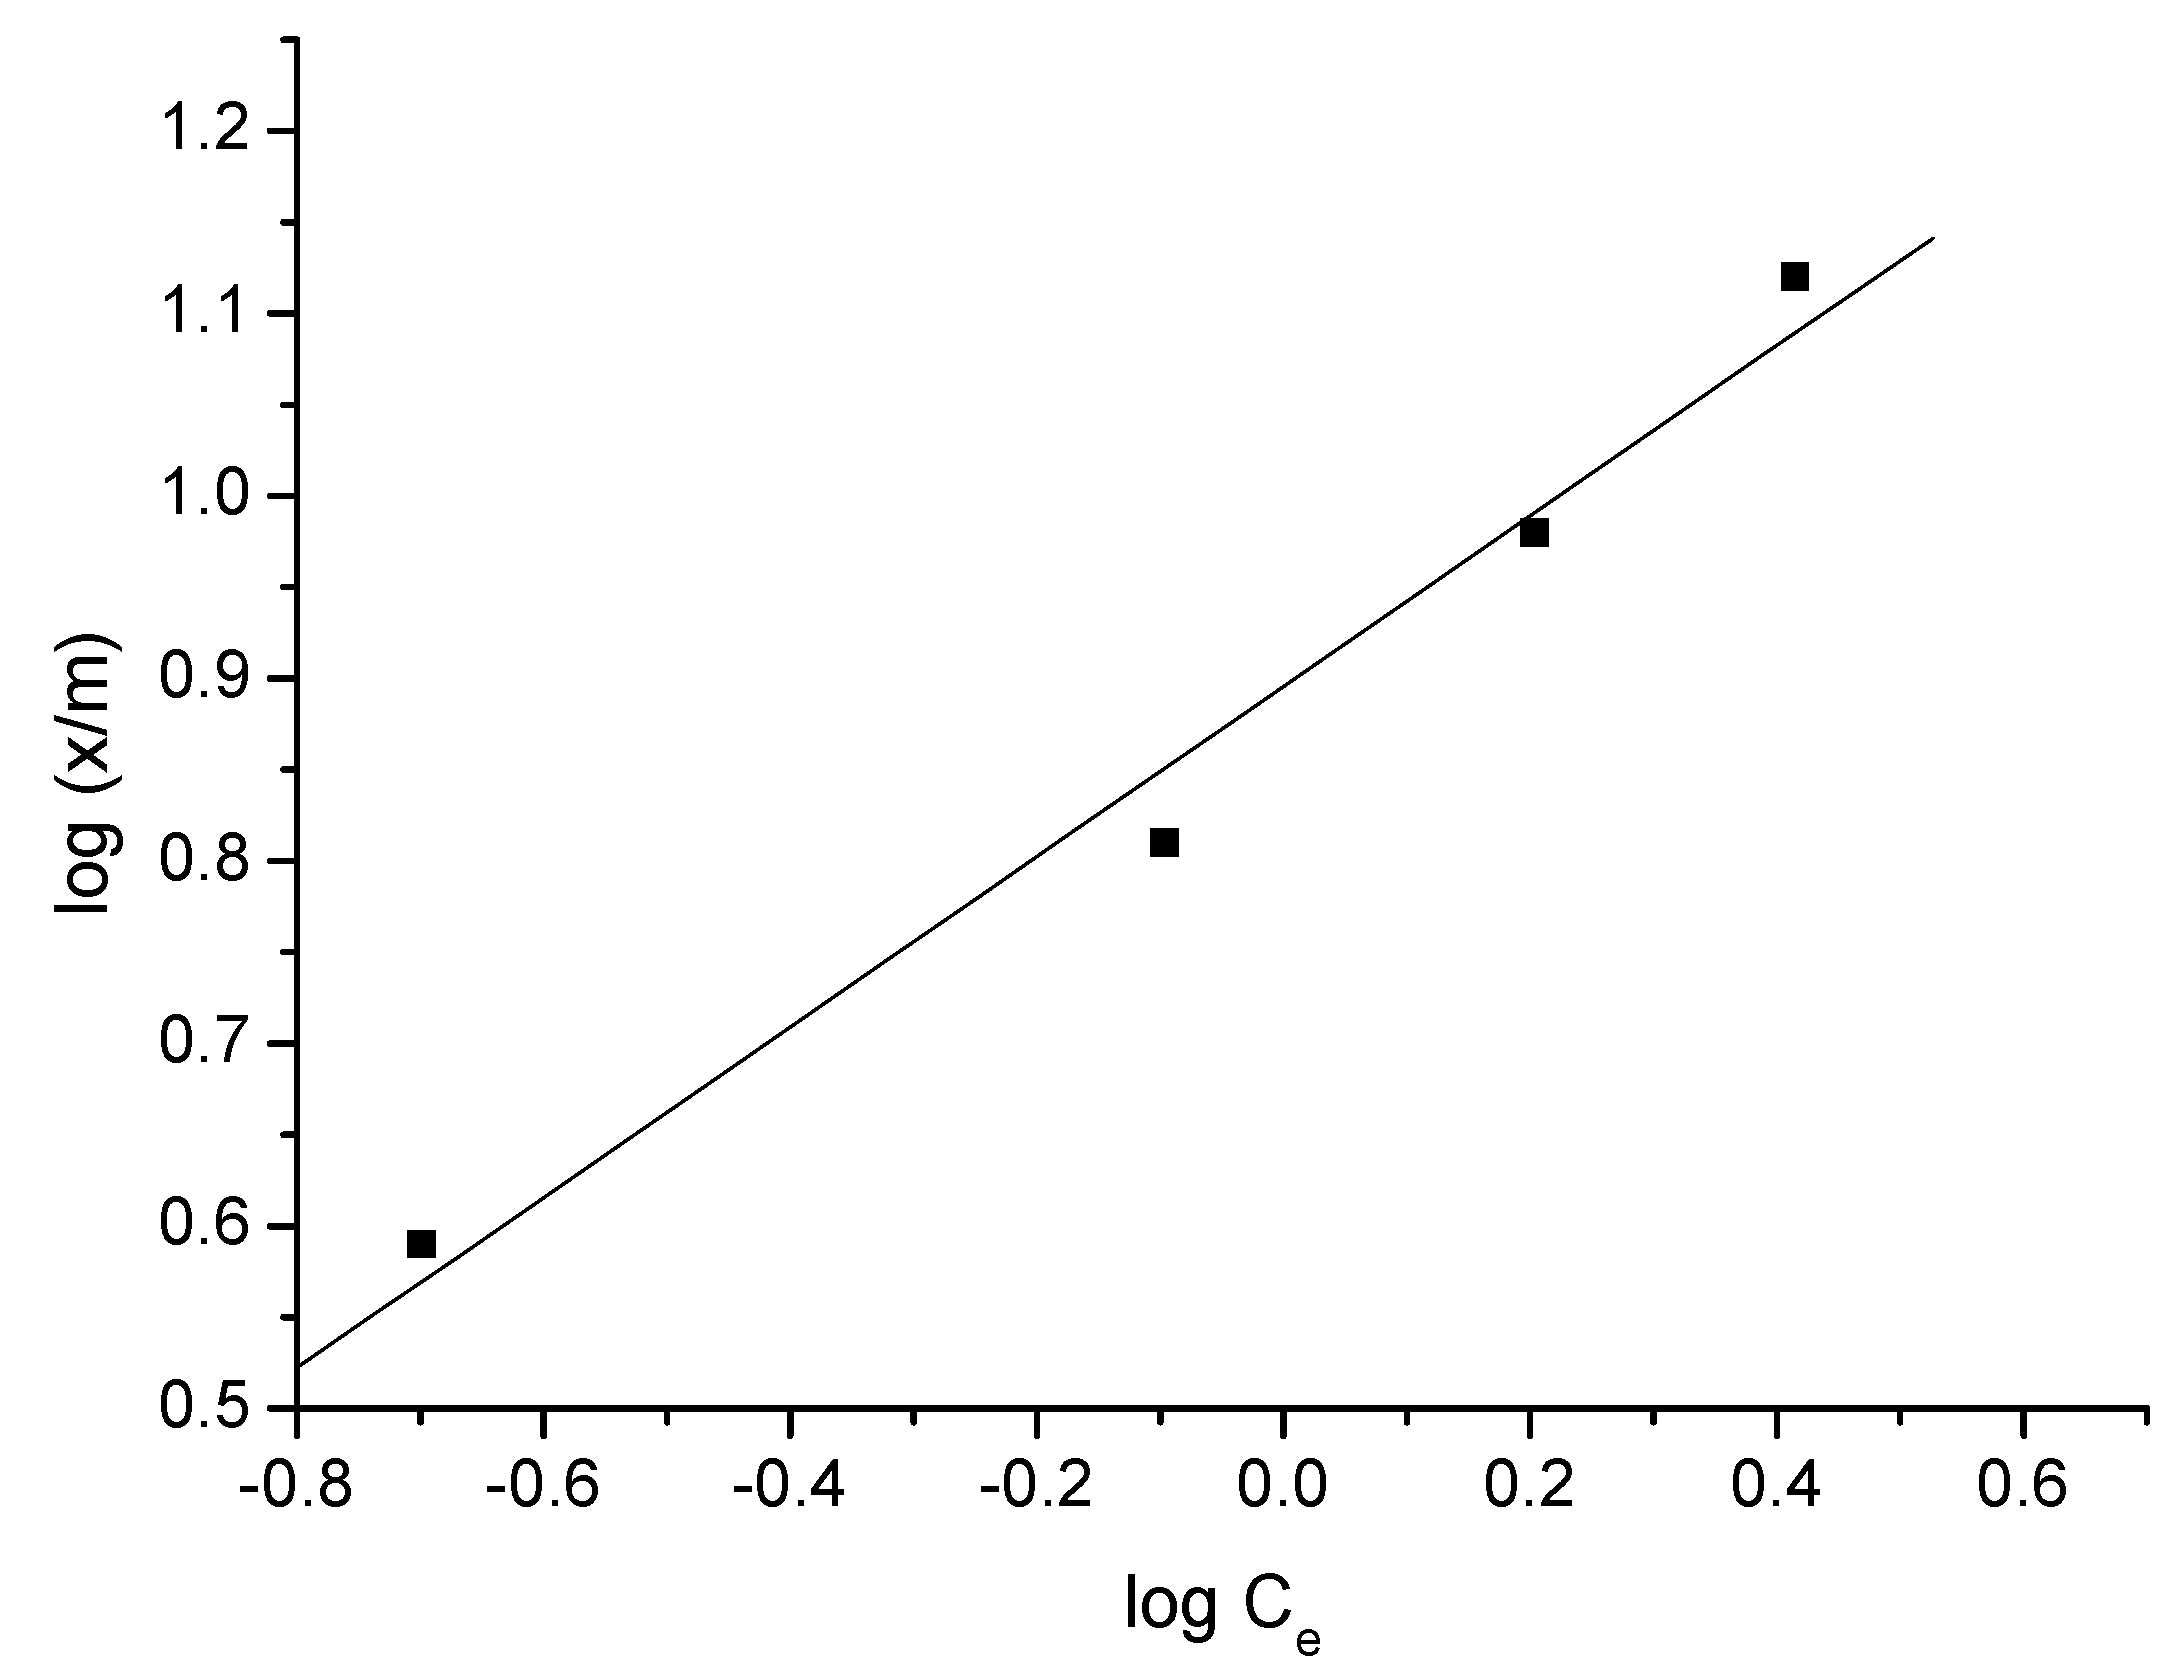
3.4. Freundlich Model of Triclosan Adsorption
The linear expression of Freundlich isotherm is the equation log(x/m) = logK
f + logC
e/n, and the corresponding calculated values, using experimental results, are presented in
Figure 9,
Figure 10,
Figure 11 and
Figure 12. x is the amount of the adsorbed solute (mg), m is the weight of the adsorbent (g), C
e is the equilibrium concentration (mg/L), n is the slope, showing the variation in adsorption with concentration, and K
f is the intercept, showing the adsorption capacity of the adsorbent. Triclosan adsorption was measured under the following terms: the amount of adsorbent is 0.05–0.5 g for 50 mL water solution, concentration 40 mg/L, and 120 min contact time. It was determined that Freundlich model provides a better fitting than the Langmuir model for all four adsorbents.
Figure 9,
Figure 10,
Figure 11 and
Figure 12 show Freundlich plot for triclosan adsorption on the adsorbents used.
The adsorption isotherm gives information for adsorbate molecules distributed between the liquid phase and the adsorbent surface when the adsorption reaches the equilibrium state [
23].
Adsorption capacity of the adsorbents towards triclosan was calculated from Freundlich plots. Data presented in
Table 5, show that activated carbon foam is distinguished by the greatest adsorption capacity value towards triclosan. This is due to the significantly higher surface area, compared to the other adsorbents used. Although, this adsorbent has dominantly microporous structure, according to the results of nitrogen physisorption, it should be taken in consideration that a large amount of macropores are formed during the synthesis of the carbon foam, which are easily accessible for triclosan molecules. A large part of the micropore surface is also accessible for triclosan. It seems that, at high triclosan concentrations, the adsorption process involves chemisorption [
24].
Adsorbent A shows a significantly lower adsorption capacity compared to other samples. In order to increase its adsorption capacity towards triclosan, adsorbent A was subjected to oxidation with 12% nitric acid and, thus, adsorbent B was obtained. Due to the oxidation treatment and the formation of a large amount of oxygen surface groups (
Table 2, adsorbent B), the adsorption affinity towards triclosan of adsorbent B increases significantly. The reason for this is most probably the chemical adsorption that occurs when hydroxyl groups from triclosan interact with the highly acidic surface groups (carboxylic and lactonic).
The adsorption capacity values found are similar, even in some cases higher, than those obtained by other researchers, despite the high ash content and moderate surface area (
Table 6).
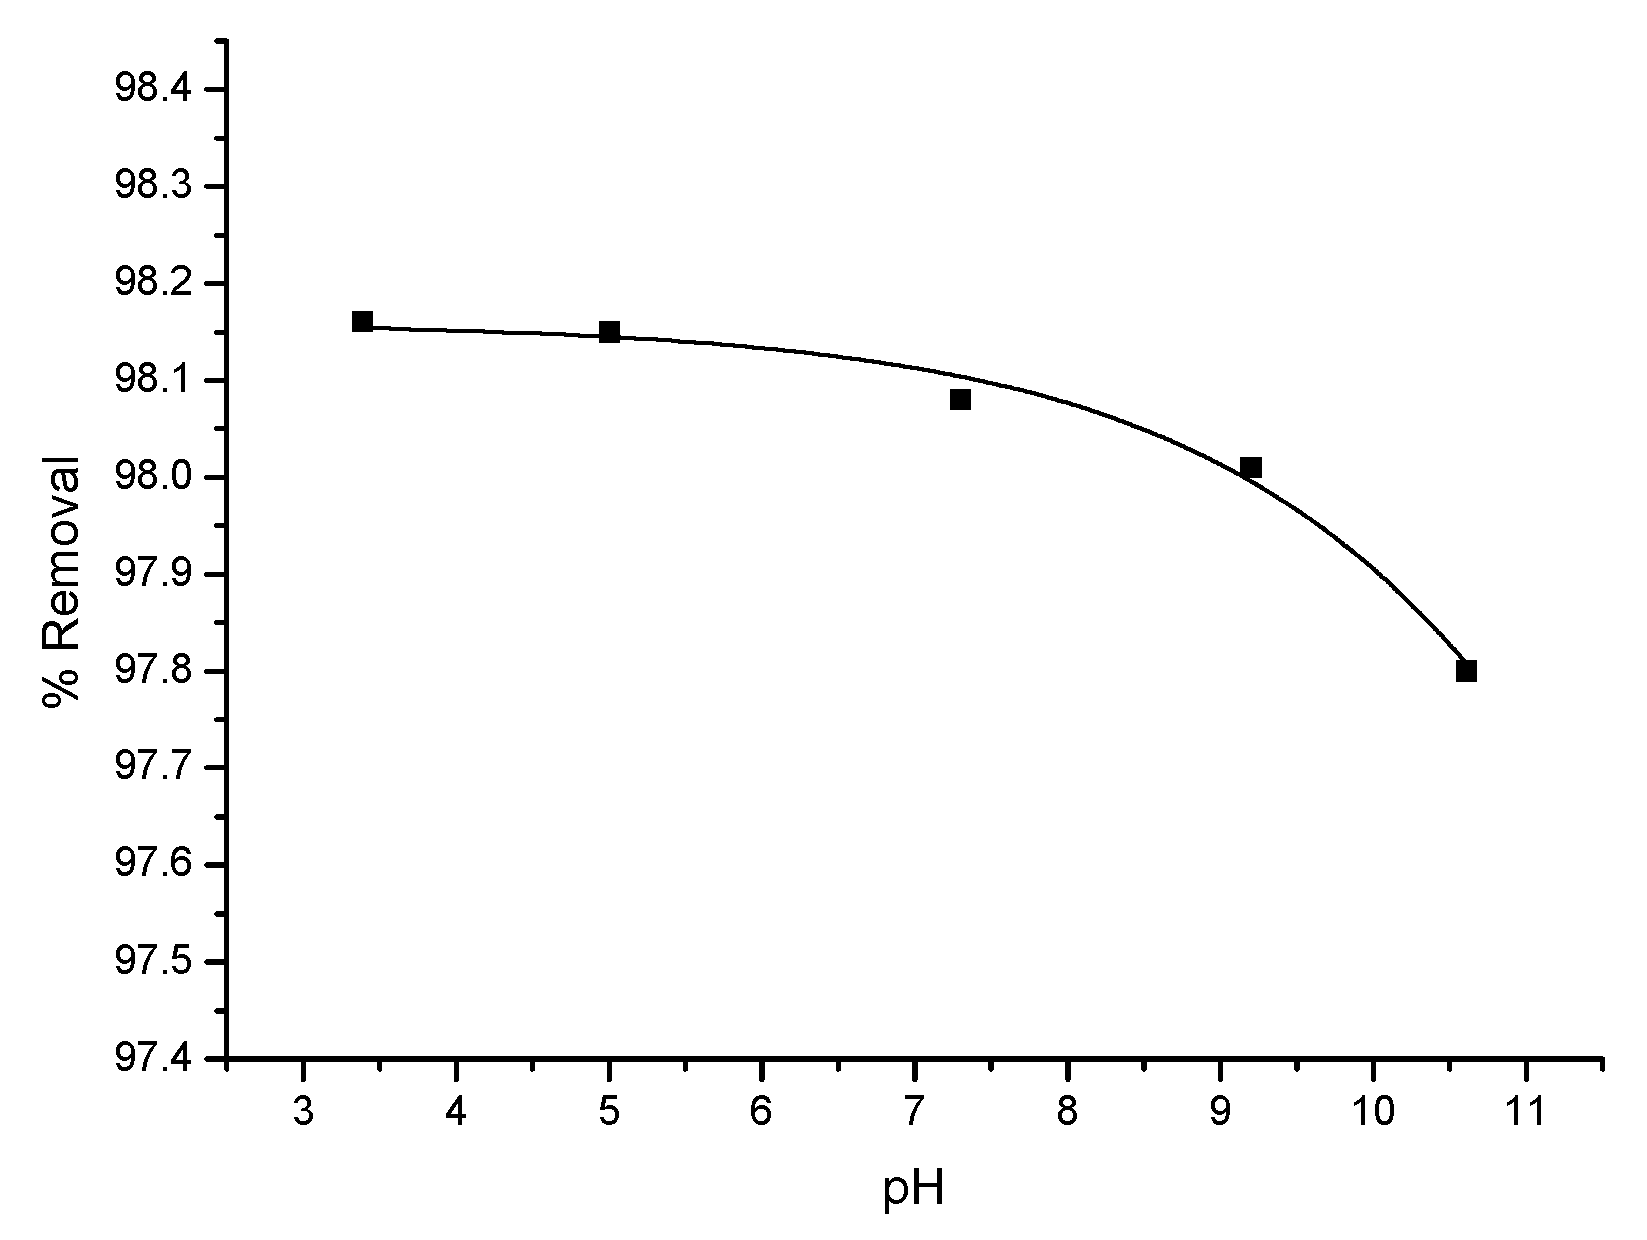
3.5. Influence of pH of Triclosan Solution on the Adsorption on Carbon Surface
Dependence of triclosan adsorption from pH follows the same trend for all the porous carbons used. Adsorbed quantity decreases with the transition from an acidic to an alkaline environment of the solution.
Figure 13 shows the dependence on pH of the degree of adsorption of triclosan on the surface of adsorbent B. The plot shows that, with rising pH of the solution, starting from 3 up to 11, adsorbed amount of triclosan on oxidized carbon decreases and the curve is steeper when pH > 7.5. This is most probably due to electrostatic repulsion forces, which occur between deprotonated triclosan molecules under these conditions, and the enhanced negative charge of carbon adsorbent surface, caused by increased alkalinity.
4. Conclusions
The analysis of the results obtained gives us reason to think that the major conditions influencing the adsorption of triclosan by carbon adsorbents used are the pore texture, the size of the accessible surface for the molecules of triclosan, as well as the chemical character of the carbon surface, which determines the possibility for chemical adsorption.
Adsorbent A shows lower adsorption capacity but the formation of significant amounts of oxygen-containing groups with an acidic character through the oxidation treatment with 12% nitric acid increases several times its ability to extract triclosan from aqueous solution. This is an indication of the essential role of the chemical nature of the surface of the adsorbents used on the adsorption of triclosan molecules on their surface. An important role in this case is played by the content of groups with a more acidic character, the carboxyl and lactone groups.
Data show that the Freundlich model provides a better fit than the Langmuir model for the four adsorbents. The greater influence of the amount of adsorbent compared to that of the solution concentration on the extent of adsorption is an indication that the triclosan molecules are not preferentially adsorbed as a monomolecular layer on the surface of the used adsorbents.
The mechanism of triclosan adsorption is established. Experimental data fit well with Freundlich, which implies some degree of chemisorption.
The study of the influence of the pH of the solution from acidic to alkaline on the degree of adsorption of triclosan on the surface of the carbon adsorbents used shows that the pH of the solution decreases slightly, more significantly at pH > 7.5.
The laboratory experimental results obtained for adsorption capacity of triclosan by carbon adsorbents allow the conclusion that they can be used successfully for a large-scale removal of triclosan from waters.
The adsorbents used have been derived from raw materials, collected from the waste treatment plant by maximally simplified methods with low-energy consumption. This shows that the developed method allows, without high costs, successful utilization of organic household and vegetable waste into useful products, one of which is carbon adsorbents, which can be successfully used to extract triclosan from aqueous solutions.
Author Contributions
Investigation, I.S., B.T., N.P., A.K., B.P. and P.D.; writing—original draft preparation, I.S., B.T., A.K., N.P., B.P. and P.D.; writing—review and editing, I.S., B.T., B.P., A.K., N.P. and P.D.; supervision, B.T., N.P. and P.D. All authors have read and agreed to the published version of the manuscript.
Funding
The authors are grateful to the Grant № BG05M2OP001-1.002-0019: “Clean Technologies for Sustainable Environment-Waters, Waste, Energy for a Circular Economy”, funded by the Science and Education for Smart Growth Operational Program (2014–2020) and co-financed by the EU through the ESIF. The authors also appreciate the funding by Project KP-06-N27/9 from 8 December 2018.
Institutional Review Board Statement
This investigation is performed according to The European Code of Conduct for Research Integrity and the Declaration of Helsinki and also under the terms of the Ethics Committee of Institute of Organic Chemistry with Centre of Phytochemistry, Bulgarian Academy of Sciences (Protocol No IOCCP-005 from 23 April 2019).
Informed Consent Statement
There is informed consent between all subjects involved in the study.
Data Availability Statement
The original data can be delivered on request from the authors.
Acknowledgments
The authors are grateful to the Sofia Waste Plant (municipal waste processing plant near Sofia, Bulgaria) for the assistance and providing the raw material samples.
Conflicts of Interest
The authors declare that there is no conflict of interest connected with this investigation.
References
- Tong, Y.; Mayer, B.K.; McNamara, P.J. Triclosan adsorption using wastewater biosolids-derived biochar. Environ. Sci. Water Res. Technol. 2016, 2, 761–768. [Google Scholar] [CrossRef]
- Schweizer, H.P. Triclosan: A widely used biocide and its link to antibiotics. FEMS Microbiol. Lett. 2001, 202, 1–7. [Google Scholar] [CrossRef]
- Adolfsson-Erici, M.; Pettersson, M.; Parkkonen, J.; Sturve, J. Triclosan, A commonly used bactericide found in human milk and in the aquatic environment in Sweden. Chemosphere 2002, 46, 1485–1489. [Google Scholar] [CrossRef] [PubMed]
- Latch, D.E.; Packer, J.L.; Arnold, W.A.; McNeill, K. Photochemical conversion of triclosan to 2,8-dichlorodibenzo-p-dioxin in aqueous solution. J. Photochem. Photobiol. A Chem. 2003, 158, 63–66. [Google Scholar] [CrossRef]
- Orvos, D.R.; Versteeg, D.J.; Inauen, J.; Capdevielle, M.; Rothenstein, A.; Cunningham, V. Aquatic toxicity of triclosan. Environ. Toxicol. Chem. 2002, 21, 1338–1349. [Google Scholar] [CrossRef]
- Dar, O.I.; Aslam, R.; Pan, D.; Sharma, S.; Andotra, M.; Kaur, A.; Jia, A.-Q.; Faggio, C. Source, bioaccumulation, degradability and toxicity of triclosan in aquatic environments: A review. Environ. Technol. Innov. 2022, 25, 102122. [Google Scholar] [CrossRef]
- Ingerslev, F.; Vaclavik, E.; Halling-Sorenson, B. Pharmaceuticals and personal care products: A source of endocrine disruption in the environment? Pure Appl. Chem. 2003, 75, 1881–1893. [Google Scholar] [CrossRef]
- Mohanty, K.; Das, D.; Biswas, M.N. Preparation and characterization of activated carbons from Sterculia alata nutshell by chemical activation with zinc chloride to remove phenol from wastewater. Adsorption 2006, 12, 119–132. [Google Scholar] [CrossRef]
- Li, L.; Quinlivan, P.A.; Knappe, D.R.U. Effects of activated carbon surface and pore structure on the adsorption of organic contaminants from aqueous solution. Carbon 2002, 40, 2085–2100. [Google Scholar] [CrossRef]
- Stoycheva, I.; Tsyntsarski, B.; Vasileva, M.; Petrova, B.; Georgiev, G.; Budinova, T.; Szeluga, U.; Pusz, S.; Kosateva, A.; Petrova, N. New method for synthesis of carbon foam on the base of mixture of coal tar pitch and furfural without using pressure and stabilization treatment. Diam. Relat. Mater. 2020, 109, 108066. [Google Scholar] [CrossRef]
- Carrott, P.J.M.; Roberts, R.A.; Sing, K.S.W. Standard adsorption data for nonporous carbons. Carbon 1987, 25, 769–770. [Google Scholar] [CrossRef]
- Fang, F.; Pendleton, P.; Badalyan, A. Effects of surface functional groups of activated carbon on adsorption of triclosan from aqueous solution. Int. J. Environ. Technol. Manag. 2009, 10, 36–45. [Google Scholar] [CrossRef]
- Nghiem, L.D.; Coleman, P.J. NF/RO filtration of the hydrophobic ionogenic compound triclosan: Transport mechanisms and the influence of membrane fouling. Sep. Purif. Technol. 2008, 62, 709–716. [Google Scholar] [CrossRef]
- Trenholm, R.A.; Vanderford, B.J.; Holady, J.C.; Rexing, D.J.; Snyder, S.A. Broad range analysis of endocrine disruptors and pharmaceuticals using gas chromatography and liquid chromatography tandem mass spectrometry. Chemosphere 2006, 65, 1990–1998. [Google Scholar] [CrossRef]
- Sandu, T.; Sarbu, A.; Caprarescu, S.; Stoica, E.B.; Iordache, T.-V.; Chiiac, A.-L. Polymer Membranes as Innovative Means of Quality Restoring for Wastewater Bearing Heavy Metals. Membranes 2022, 12, 1179. [Google Scholar] [CrossRef]
- Tsyntsarski, B.; Petrova, B.; Budinova, T.; Petrov, N.; Sarbu, A.; Sandu, T.; Ferhat Yardim, M.; Sirkecioglu, A. Removal of detergents by zeolites and membranes. Bulg. Chem. Commun. 2014, 46, 157–164. [Google Scholar]
- Boustila, H.; Boutillara, Y.; Velasco, L.-F.; Djellali, A.; Tazibet, S. Tailoring Activated Carbon Properties for Pb(II) and Cr(VI) Removal from Water in Continuous Mode. Chem. Eng. Technol. 2022, 45, 258–265. [Google Scholar] [CrossRef]
- Tzvetkov, G.; Mihaylova, S.; Stoitchkova, K.; Tzvetkov, P.; Spassov, T. Mechanochemical and chemical activation of lignocellulosic material to prepare powdered activated carbons for adsorption applications. Powder Technol. 2016, 299, 41–50. [Google Scholar] [CrossRef]
- Boehm, H.P. Chemical identification of surface groups. Adv. Catal. Relat. Subj. 1966, 16, 179–274. [Google Scholar] [CrossRef]
- Chen, Y.; Wang, F.; Duan, L.; Yang, H.; Gao, J. Tetracycline adsorption onto rice husk ash, an agricultural waste: Its kinetic and thermodynamic studies. J. Mol. Liq. 2016, 222, 487–494. [Google Scholar] [CrossRef]
- Bansal, R.C.; Goyal, M. Activated Carbon Adsorption, 1st ed.; Taylor & Francis: Abingdon, UK; CRC Press: Boca Raton, FL, USA, 2005. [Google Scholar] [CrossRef]
- Giles, C.H.; MacEwan, T.H.; Nakhwa, S.N.; Smith, D. Studies in adsorption. Part XI. A System of Classifcation of Solution Adsorption Isotherms, and its Use in Diagnosis of Adsorption Mechanisms and in Measurement of Specific Surface Areas of Solids. J. Chem. Soc. 1960, 786, 3973–3993. [Google Scholar] [CrossRef]
- Baccar, R.; Sarrà, M.; Bouzid, J.; Feki, M.; Blánquez, P. Removal of pharmaceutical compounds by activated carbon prepared from agricultural by-product. Chem. Eng. J. 2012, 2, 310–317. [Google Scholar] [CrossRef]
- Bulut, E.; Ozacar, M.; Sengil, I.A. Equilibrium and kinetic data and process design for adsorption of Congo Red onto bentonite. J. Hazard. Mater. 2008, 154, 613–622. [Google Scholar] [CrossRef]
- Wang, F.; Lu, X.; Peng, W.; Deng, Y.; Zhang, T.; Hu, Y.; Li, X.-Y. Sorption behavior of bisphenol A and triclosan by graphene: Comparison with activated carbon. ACS Omega 2017, 2, 5378–5384. [Google Scholar] [CrossRef]
- Behera, S.K.; Oh, S.-Y.; Park, H.-S. Sorption of triclosan onto activated carbon, kaolinite and montmorillonite: Effects of pH, ionic strength, and humic acid. J. Hazard. Mater. 2010, 179, 684–691. [Google Scholar] [CrossRef] [PubMed]
- Hu, X.; Zhao, N.; Wei, J. Adsorption of triclosan on carbon nanotubes. Chin. J. Environ. Eng. 2009, 8, 1462–1464. [Google Scholar] [CrossRef]
- Kaur, H.; Bansiwal, A.; Hippargi, G.; Pophali, G.R. Effect of hydrophobicity of pharmaceuticals and personal care products for adsorption on activated carbon: Adsorption isotherms, kinetics and mechanism. Environ. Sci. Pollut. Res. 2018, 25, 20473–20485. [Google Scholar] [CrossRef]
Figure 1.
Pore size distribution by DFT method of the samples obtained.
Figure 1.
Pore size distribution by DFT method of the samples obtained.
Figure 2.
Adsorption of triclosan from water solution (concentration 40 mg/L) by adsorbent A.
Figure 2.
Adsorption of triclosan from water solution (concentration 40 mg/L) by adsorbent A.
Figure 3.
Adsorption of triclosan from water solution (concentration 40 mg/L) by adsorbent D.
Figure 3.
Adsorption of triclosan from water solution (concentration 40 mg/L) by adsorbent D.
Figure 4.
Adsorption of triclosan from water solution (concentration 40 mg/L) by adsorbent C.
Figure 4.
Adsorption of triclosan from water solution (concentration 40 mg/L) by adsorbent C.
Figure 5.
Adsorption of triclosan from water solution (concentration 40 mg/L) by adsorbent B.
Figure 5.
Adsorption of triclosan from water solution (concentration 40 mg/L) by adsorbent B.
Figure 6.
Langmuir plot for adsorption of triclosan (5–40 mg/L) by adsorbent C.
Figure 6.
Langmuir plot for adsorption of triclosan (5–40 mg/L) by adsorbent C.
Figure 7.
Langmuir plot for adsorption of triclosan (5–40 mg/L) by adsorbent D.
Figure 7.
Langmuir plot for adsorption of triclosan (5–40 mg/L) by adsorbent D.
Figure 8.
Langmuir plot for adsorption of triclosan (5–40 mg/L) by adsorbent A.
Figure 8.
Langmuir plot for adsorption of triclosan (5–40 mg/L) by adsorbent A.
Figure 9.
Freundlich isotherm of triclosan adsorption—adsorbent D.
Figure 9.
Freundlich isotherm of triclosan adsorption—adsorbent D.
Figure 10.
Freundlich isotherm of triclosan adsorption—adsorbent C.
Figure 10.
Freundlich isotherm of triclosan adsorption—adsorbent C.
Figure 11.
Freundlich isotherm of triclosan adsorption—adsorbent B.
Figure 11.
Freundlich isotherm of triclosan adsorption—adsorbent B.
Figure 12.
Freundlich isotherm of triclosan adsorption—adsorbent A.
Figure 12.
Freundlich isotherm of triclosan adsorption—adsorbent A.
Figure 13.
Effect of pH value of triclosan water solution on adsorption equilibrium with adsorbent B. Conditions: τ, 60 min, carbon concentrations, and 40 mg/L.
Figure 13.
Effect of pH value of triclosan water solution on adsorption equilibrium with adsorbent B. Conditions: τ, 60 min, carbon concentrations, and 40 mg/L.
Table 1.
Chemical composition of the carbon adsorbents.
Table 1.
Chemical composition of the carbon adsorbents.
| Sample | Proximate
Analysis
(Mass %) | Elemental Analysis
(Mass %, maf 3) |
|---|
| | W 1 | Ash | Vol 2 | C | H | N | S | O |
| Adsorbent A | 1.8 | 31.1 | 2.4 | 72.55 | 2.04 | 1.78 | 0.24 | 23.39 |
| Adsorbent B | 1.6 | 23.2 | 2.3 | 64.79 | 2.05 | 4.54 | 0.88 | 27.74 |
| Adsorbent C | 2.1 | 15.5 | 4.7 | 70.91 | 2.08 | 1.11 | 0.47 | 25.43 |
| Adsorbent D | 1.7 | 4.1 | 2.1 | 87.54 | 1.93 | 2.81 | 1.82 | 5.90 |
Table 2.
Surface oxygen groups in carbon adsorbents.
Table 2.
Surface oxygen groups in carbon adsorbents.
| Sample | Acidic Surface Groups (mmol g−1) | | Total Basic Groups (mmol g−1) | pH |
|---|
| | Carboxylic | Lactonic | Phenolic | Carbonyl | | |
| Adsorbent A | BDL 1 | BDL 1 | 0.230 | 1.470 | 1.320 | 8.5 |
| Adsorbent B | 1.990 | 3.111 | 2.521 | 3.210 | 0.981 | 3.7 |
| Adsorbent C | BDL 1 | 0.132 | 0.532 | 1.789 | 1.011 | 8.1 |
| Adsorbent D | BDL 1 | 0.098 | 0.266 | 1.465 | 0.946 | 8.4 |
Table 3.
Main textural parameters of the carbon adsorbent used.
Table 3.
Main textural parameters of the carbon adsorbent used.
| Sample | SBET,
m2 g−1 | Vtotal,
cm3 g−1 | Vmicro,
cm3 g−1 | Vmeso,
cm3 g−1 | Iodine Number,
mg g−1 |
|---|
| Adsorbent A | 374 | 0.199 | 0.148 | 0.030 | 430 |
| Adsorbent B | 320 | 0.147 | 0.128 | 0.005 | 390 |
| Adsorbent C | 285 | 0.138 | 0.108 | 0.006 | 345 |
| Adsorbent D | 768 | 0.298 | 0.260 | 0.003 | 850 |
Table 4.
Data for triclosan adsorption obtained from Langmuir plot.
Table 4.
Data for triclosan adsorption obtained from Langmuir plot.
| Sample | Qo,
mg/g | R2
Regression Coefficient |
|---|
| Carbon A | 40.93 | 0.9304 |
| Carbon C | 37.17 | 0.9659 |
| Carbon D | 78.01 | 0.9398 |
Table 5.
Adsorption capacities for triclosan by various adsorbents, calculated from Freundlich plots.
Table 5.
Adsorption capacities for triclosan by various adsorbents, calculated from Freundlich plots.
| Sample | Q0
mg/g | R2
Regression Coefficient | ![Processes 11 02643 i001]() |
| Adsorbent A | 10.11 | 0.9900 |
| Adsorbent B | 31.44 | 0.9968 |
| Adsorbent C | 25.21 | 0.9961 |
| Adsorbent D | 107.01 | 0.9939 |
Table 6.
Comparison of maximum monolayer adsorption capacity (Qm) of various adsorbents for triclosan.
Table 6.
Comparison of maximum monolayer adsorption capacity (Qm) of various adsorbents for triclosan.
| Adsorbents | Qm, mg/g | Specific Surface Area
m2 g−1 | Reference |
|---|
| Commercial activated carbon | 3.5 | 212.56 | [25] |
| Kaolinite | 6.03 | 2.31 | [26] |
| Carbon nanotubes | 40.00 | n.a. a | [27] |
| Charcoal-based activated carbon | 67.11 | 738.8 | [26] |
| Commercial powdered activated carbon | 76.3 | 882.63 | [28] |
| Adsorbent A | 10.11 | 374 | This study |
| Adsorbent B | 31.44 | 320 | This study |
| Adsorbent C | 25.21 | 285 | This study |
| Adsorbent D | 107.01 | 768 | This study |
| Disclaimer/Publisher’s Note: The statements, opinions and data contained in all publications are solely those of the individual author(s) and contributor(s) and not of MDPI and/or the editor(s). MDPI and/or the editor(s) disclaim responsibility for any injury to people or property resulting from any ideas, methods, instructions or products referred to in the content. |
© 2023 by the authors. Licensee MDPI, Basel, Switzerland. This article is an open access article distributed under the terms and conditions of the Creative Commons Attribution (CC BY) license (https://creativecommons.org/licenses/by/4.0/).


