Abstract
Due to the complicated interference sources and low signal-to-noise ratio of seismic records, conventional seismic inversion methods are difficult to accurately identify shale gas reservoirs with a thickness of less than 10 m. This presents great challenges to shale gas exploration and development in China. Seismic phase-controlled nonlinear stochastic inversion (SPCNSI) is related to the heterogeneity of underground media. With the constraints of the stratigraphic sequence or seismic facies models, the minimum value between the seismic model and seismic record can be solved through iterative processes. Based on the solved acoustic velocity in formation, the constraints for SPCNSI can be formed with the matching relationship between target layers and different sequences in three-dimensional space. The prediction resolution of an unconventional reservoir can be effectively improved by combining logging, geological and seismic information. The method is suitable for predicting thin shale gas reservoirs in complex geological structures. In this study, SPCNSI was developed to predict the thin-layer marine shale gas reservoir in the southeast of Chongqing; the horizontal and vertical distribution characteristics were proven in the Longmaxi Formation and the Wufeng Formation; thin layers with a thickness of less than 7 m were also discovered. According to the results, three sets of potential development areas were determined by the inversion method, and the accuracy and reliability of the method were verified by logging and productivity testing.
1. Introduction
Shale gas is a kind of clean energy. The recoverable resources of shale gas in China amount to 21.8 × 10¹² m3, ranking first in the world. For increasing the supply of clean energy and reducing carbon emissions, annual natural gas production will exceed 2300 × 108 m3 by the end of 2025, according to the plan of “China’s 14th Five Year Plan for Modern Energy System”. With the orderly promotion of shale gas exploration and development, the Fuling shale gas field, the main battlefield of shale gas development in China, has cumulatively produced more than 532 × 108 m3 as of December 2022, which has effectively decreased China’s dependence on external sources of natural gas.
Seismic exploration is one of the key technologies for shale gas development. The seismic inversion of shale gas reservoirs is mainly divided into three ways: acoustic impedance inversion based on seismic data, model-based logging attribute inversion, and geostatistics-based stochastic simulation and stochastic inversion [1,2]. Acoustic impedance and velocity inversion is one of the most effective ways for identifying underground lithologies, and has become an important technology for reservoir inversion and the prediction of shale gas. In practical applications, acoustic impedance inversion based on seismic data mainly include recursive inversion [3,4,5], constrained sparse pulse inversion [6], reservoir characteristic attribute inversion [7,8,9] and frequency division inversion [10]. The commonly used constrained sparse pulse inversion is less affected by the initial model, and can accurately reflect the lateral changes of the reservoir; however, the resolution is low. Geostatistical inversion introduces the idea of stochastic simulation to seismic inversion, and uses stochastic simulation to derive the attribute data of bodies for reservoir prediction [11,12]. A wavelet-based multiple-point geostatistical simulation (WAVESIM) algorithm was proposed to reduce the uncertainty in predicting the spatial arrangements of litho-facies away from wells or control points, which integrates the physical properties of litho-facies, and geophysical data within a multiple-point geostatistical framework [13].
Random simulations based on geological statistics can better reflect the heterogeneity of a reservoir, and are less affected by the initial model of the seismic wave velocity. Zhang et al. [14] comprehensively utilized seismic, geological, logging data and geological knowledge to perform wave impedance random inversion and lithology simulations on the spatial distribution of reservoirs, and predicted the distribution patterns. Li et al. [15] proposed a block constrained generalized wave impedance inversion method based on the analytical solution of the acoustic equation, which extracts stable velocity and density parameters by partially stacking profiles to invert the generalized acoustic impedance that varies with the incident angle. Block constraints are introduced within the framework of Bayesian theory to obtain stable and well-defined inversion results. Based on seismic sedimentology, the method of grouping the optimal azimuth and offset stacking window to partially stack OVT gathers effectively identifies channel sand bodies and makes reservoir predictions that cannot be predicted using partial full stacks [16].
Many studies have reported the application of nonlinear inversion methods in solving wave equations. The geological structure-guided hybrid Markov Chain Monte Carlo (MCMC) and Bayesian linearized inversion (BLI) methodologies for seismic inversion are implemented to address the problem of 2D discontinuous seismic profiles, because the spatial coupling of model parameters is not considered [17]. Yang [18,19] proposed the nonlinear chaotic inversion for seismic traces by the phasing and quantitative description of state changes of successive linearization iterations. Combined with nonlinear optimization [20] and a random model, Huang et al. [21] proposed nonlinear random inversion controlled by the seismic phase, which had high vertical resolution and relatively accurate prediction results with the advantages of both broadband constrained inversion [22] and model inversion [23]. The method was also used to track biological reefs and shoals by establishing a recognition model with the seismic facies and seismic profiles [24]. Integrating sedimentary and seismic attributes, in addition to well logging, Zhao [25] established an initial model based on facies controlled stochastic optimization seismic inversion to achieve optimal matching between a forward model and observation results. The distribution characteristics of shale reservoirs, typically the Longmaxi Formation in China, was predicted by the seismic facies-controlled nonlinear random inversion with the post-stack seismic data [26].
In addition, phase-controlled inversion with seismic waveform is used to characterize the distribution characteristics of thin reservoirs in the Yin’e Basin, integrating clustering recognition and frequency domain curve reconstruction [27]. Zhang et al. [28] applied seismic phase-controlled nonlinear stochastic inversion to carry out carbonate reservoir prediction in the Amu Darya Basin by picking up the velocity, amplitude and frequency of 3D seismic waves with geological and logging information. Combining Bayesian classification with pre-stack simultaneous inversion, facies-based Bayesian simultaneous inversion was developed to divide different facies based on multi-elastic parameters, and increase the stability of the density inversion in the north section of the No.5 fault zone in Shunbei area, Tarim Basin, China [29]. Gao et al. [30] used the method for reservoir prediction of subsalt microbial carbonate reservoirs to improve the accuracy of seismic prediction. Wang et al. [31] studied the sand body boundary and quantitative reservoir prediction using waveform clustering seismic phase analysis, and described the depositional characteristics and thickness of the reservoir in the planar and vertical directions.
In this research, the problems of a low signal-to-noise ratio of seismic records and predicting thin shale gas reservoirs with a thickness less than 10 m in southeast Chongqing were addressed. A seismic phase-controlled nonlinear stochastic inversion was applied to the Southeast Qianjiang (S-Q) area in Chongqing, China. The horizontal and vertical distribution characteristics were proven in the Longmaxi Formation and the Wufeng Formation; thin layers with a thickness of less than 7 m were also discovered.
2. Overview of the Study Area
2.1. Geological Structure and Stratigraphic Distribution
The study area (S-Q) is located in the southeast of Chongqing in China (Figure 1). The area is a typical karst landscape with large topographic undulations and a steep formation dip angle, as shown in Figure 2. The topographic map in the S-Q area was derived using the Google Earth Engine (GEE). The highest elevation reaches 1900 m, the lowest elevation is 270 m. The structure belongs to the Qiyao Mountain convex fold belt and Qianjiang depression fold belt, located in the southeast of the Chongqing–Xiangxi isolated channel type alluvial fold belt. The anticlinorium and syncline are in parallel with each other, and the direction of the fold axis roughly extends in a northeast to southwest direction; the formation dip angle is about 35 degrees to 75 degrees, with a steep dip and basic symmetry on both flanks. The internal faults in the anticlinorium and syncline are relatively developed, and the dip angle in the core faults is steep (about 57 degrees to 75 degrees) with the characteristics of a high stratigraphic uplift, strong tectonic compression, and high and steep structural development.
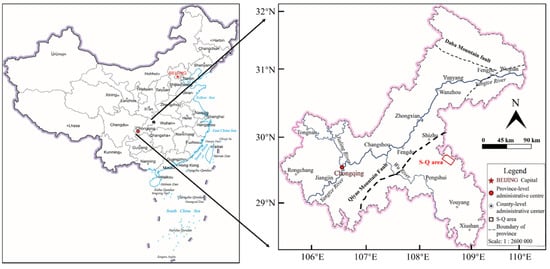
Figure 1.
Location and geological structure of S-Q well area. The S-Q area is located in the southeast of Chongqing in China, as shown in the red box.
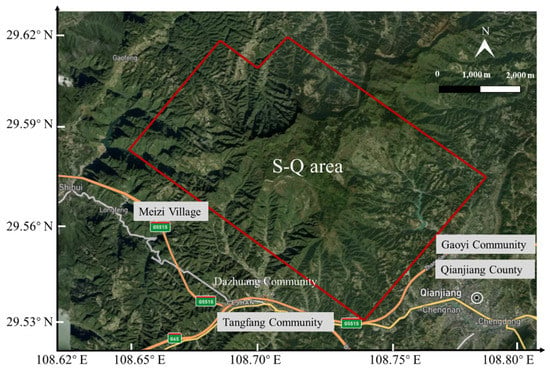
Figure 2.
Topographic map in S-Q area was derived using the Google Earth Engine (GEE). The area is a typical karst landscape with large topographic undulations and steep formation dip angle.
The Yanshan Movement was the main period of tectonic formation in this area, developing reverse faults along the structure, with faults exhibiting a back-thrust pattern. The sedimentary environment has deep water bodies, mainly developed as shelf deposits and shore deposits, which are favorable to the development of dark mud shale of the Upper Ordovician Wufeng Formation and Lower Silurian Longmaxi Formation [32]. It is the main reservoir with high shale gas production in China. The exposed stratigraphy is from the Triassic to Aurignacian; Silurian siltstone and siltstone shale are in a large area; the Lower Permian limestone is exposed in some areas. From new to old, the stratum exposes the lower Permian limestone, Silurian Luojiaoping formation siltstone and shale, Longmaxi Formation siltstone and silty shale.
The thickness of the Lower Silurian Longmaxi Formation ranges from 65–110 m in the area. The upper part is dark gray, gray-black calcareous, with sandy shale and gray sandy shale, and the lower part is dark sandy shale, with carbonaceous shale and carbonaceous mudstone, which form the main reservoir of shale gas. The overlying stratum is the Lower Silurian Xin Tan Formation; the lithology is a set of greenish-gray, yellowish-gray and blackish-gray mudstones with carbonaceous shales, and the bottom is a contact between the gray fine siltstone and calcareous shale of the Longmaxi Formation. The underlain stratum is the Wufeng Formation, with a set of grayish-black carbonaceous and siliceous shales, which are thinly laminated and topped by the Garidonian weathering surface. The thickness of high-quality shale of the Wufeng Group is less than 10 m; it is the main gas-producing layer of shale gas in the area.
2.2. Characteristics of the Sedimentary Phase
Integrating the data collected from test cores, well drilling and logging in the area, the sedimentary phases are carbonate shoals, terraces, occluded basins (lagoons), shallow marine shelves and foreshore slopes from the bottom to the top of the stratum, as shown in Figure 3. The phase shows the water body-changed process from the Ordovician to the Silurian. The water body took place by turning from shallow to deep. The typical characteristics of the sedimentary phases of each stratum are briefly described as follows:
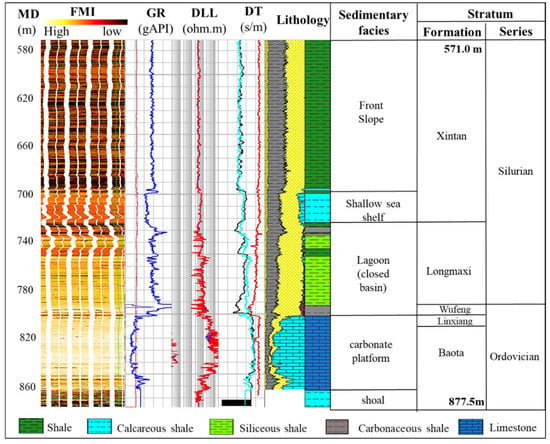
Figure 3.
Analysis of sedimentary phase and stratigraphic sequence with S-Q-2 well logging. MD, measure depth; FMI, formation micro-scanner image; GR, natural gamma-ray logging; DLL, dual lateral logging; DT, acoustic difference time logging.
- Sedimentation of Shallow shoal carbonate terrace (Baota Formation–Linxiang Formation)
The bottom of the Baota Group is a thin interbedded mudstone and tuff, and the upward transition is a laminated tuff containing a large amount of biogenic shells or bioclasts, with good rounding, reflecting a shallow terrace edge environment with strong hydrodynamic force. The middle and upper parts of the Baota Formation are dominated by verrucose tuffs and tortoise tuffs, which are products of shallow water and an arid climate, with stable low-angle horizontal laminations reflecting low water energy and a depositional environment of carbonate terraces.
The Ordovician is mainly composed of nodular limestone and turtle crack limestone in the study area. The bottom of the Baota Formation is a thin interlayer of mudstone and limestone, transitioning upwards into layered limestone, containing a large amount of biological crusts or debris; it is well-rounded, and reflects the shallow environment of the platform edge with strong hydrodynamic forces. The upper and middle parts of the Baota Formation are mainly composed of nodular limestone and turtle crack limestone, which are products of shallow water and an arid climate. The stable low-angle horizontal bedding reflects low water energy, and the sedimentary environment is a carbonate platform.
- Sedimentation of closed sea basins and lagoons (Wufeng Formation–Longmaxi Formation)
The upper Ordovician Wufeng Formation and lower Silurian Longmaxi Formation have well-developed foliation, containing slightly gray matter, and is relatively dense. The top of the Wufeng Formation and Longmaxi Formation generally contains carbon, which is mainly composed of carbon shale. Most layers of the Longmaxi Formation contain less sand, and the lithology is siliceous shale. Common graptolite fossils and pyrite patches or strips with horizontal bedding development reflect the retention reduction environment, with weak hydrodynamic strength and slow sedimentation speed, forming a lagoon or closed basin environment.
- Sedimentation of shallow shelf-frontal slope (Xintan Formation)
The bottom of the Xintan Formation is mainly composed of calcareous shale deposits; horizontal bedding and cross bedding at a certain angle are developed. No reduction minerals such as pyrite are found, reflecting shallow water carbonate a sedimentary environment of shallow water, medium hydrodynamic force and normal redox environment-shallow sea shelf deposits. The upper and middle parts of the Xintan Formation are thick shale deposits, with frequent interaction between sliding deformation structures caused by gravity flow and the horizontal bedding of still water deposits, reflecting the carbonate slope environment, i.e., the slope zone between shallow and deep sea.
2.3. Petrophysical Characteristics of the Reservoir
The petrophysical characteristics of the shale gas reservoir in the S-Q area, as the constrained condition for SPCNSI, were counted with logging data. This process is conducive to making the inversion results of seismic records closer to the true situation of the strata. The statistical results for the Longmaxi and Wufeng formations of the S-Q-2 well are shown in Figure 4, which include gas-bearing and non-gas reservoirs. The statistical parameters are Vp (longitudinal wave velocity), Vs (transverse wave velocity), DEN (rock density) and GR (natural gamma) at a vertical depth of 727–801.8 m.
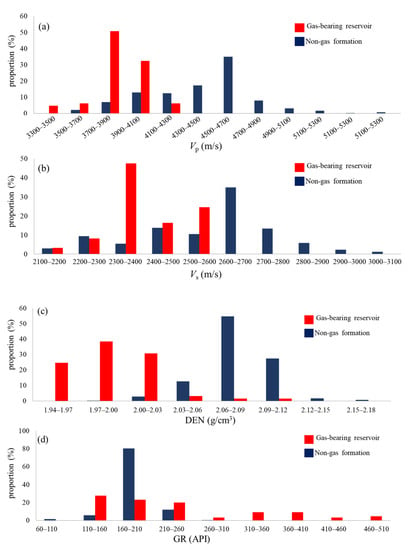
Figure 4.
Petrophysical characteristics and distribution of shale in S-Q well area. (a): P-wave velocity (m/s); (b): S-wave velocity (m/s); (c): rock density (g/cm3); (d): natural gamma (API).
It includes carbonaceous shale and sandy shale, which can be divided into three sections according to their gas-bearing properties. Among them, the vertical depths of 727 m to 778 m (thickness of 51 m) and 778 m to 792 m (thickness of 14 m) are low gas content, while the depth of 792 m to 802 m (thickness of 10 m) are enriched gas-bearing layers. Various parameters are influenced by the condition of the gas content. Gas-bearing reservoirs have the characteristics of high gamma, low density, and low acoustic wave velocity.
The P-wave velocity of the gas-bearing reservoir is from 3700 m/s to 4100 m/s, and the S-wave velocity is 2300 m/s to 2500 m/s. The rock density is between 1.94–2.03 g/cm3. On the contrary, the velocity of P-waves and S-waves on non-gas bearing reservoirs are both high, ranging from 4300–4900 m/s and 2500–2800 m/s, respectively. The rock density is between 2.04–2.15 g/cm3, and the natural gamma is greater than 160 API.
In summary, the gas saturation, petrophysical characteristics and marine sedimentary environment in the study area show that the shale reservoir has good economic value. However, the reservoir in the area is developed in thin interbedded layers, and the reservoir thickness changes greatly. As a result, exploration of the reservoir’s distribution characteristics requires an accurate seismic inversion method.
3. Methodology
A seismic phase is the reflection of the sedimentary phase in the seismic data, and any kind of seismic phase has specific seismic reflection characteristics that correspond to the appropriate sedimentary phase. Based on the geometry, interrelationship and internal structure of the seismic phase, the position in the regional structure and the phase interpreted by the well data, the corresponding sedimentary phase can be initially determined. The seismic phase-controlled nonlinear stochastic inversion performs a nonlinear optimization of the seismic records. Combining the individual problem into a joint inversion, the degrees of freedom of the inversion can be reduced under the control of the seismic phase model. The wave impedance inversion is transformed into an inversion of the formation velocity, and the minimum value of the least square solution between the seismic model and actual seismic records is obtained. The special process can be expressed as follows:
where V is the acoustic velocity in the formation, is the synthesized seismic record using the velocity model of the formation medium, is the actual seismic record and i is the sampling point number of the seismic record.
According to the theory of the generalized linear inversion [33], Equation (1) can be expanded at the initial model response with Taylor’s formula. To improve the inversion accuracy of the thin-layer seismic record, only the quadratic terms are retained; the Formula (1) is simplified as follows:
where is the synthetic seismic record corresponding to the initial velocity model, and is the parameter perturbation in the model. Making the first-order derivative of the perturbation term to zero, the Formula (2) may be written as follows:
Removing some high-order minima, Formula (3) is simplified as follows:
Equation (4) can be replaced with a simple form as follows:
The actual acoustic velocity V in the formation is obtained by iterating Equation (6) with the model parameter perturbation by Equation (7).
where m is the number of iterations.
The implementation of nonlinear stochastic inversion can be divided into two parts: stochastic simulation and nonlinear inversion. The transformation characteristics of reservoir parameters in space are represented with three features: the range, still, and the nugget constant. Synthetic seismic records are synthetized through Gaussian simulation and morphological modeling under the constraint of the sedimentary facies. SPCNSI is performed on each seismic channel, and this process is shown in Figure 5. The acoustic velocity and the rock density from logging data were used to establish an initial wave impedance model for the formation. The constraints for SPCNSI were from the relationship between the distribution of sedimentary facies in the target layer and post-stack seismic records. Within the time window range of different sedimentary facies, the initial wave impedance model obtained from logging data was extrapolated along the phase change direction. It was the control condition of the inversion of the next seismic record. After multiple iterations to minimize the perturbation term between the synthetic and actual seismic records, the acoustic velocity in the formation could be obtained [34].
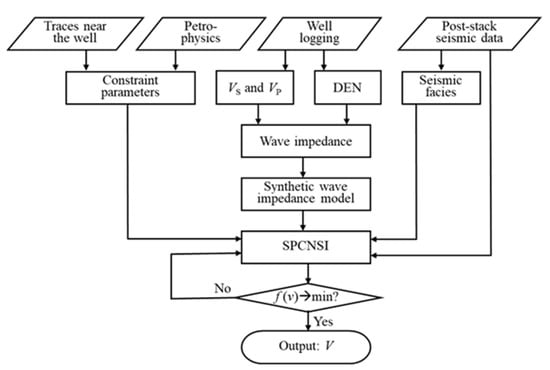
Figure 5.
The workflow for seismic phase-controlled nonlinear stochastic inversion (SPCNSI).
Based on the solved acoustic velocity with iteration processing, the sequence boundaries of the strata were interpreted on the seismic profile compared with the sequences divided by drilling, logging and other data. The constraints for seismic phase-controlled inversion can be formed with the matching relationship between target layers and different sequences in three-dimensional space.
In this research, the seismic acquisition instrument adopted Sercel’s 428 digital seismometer, with a seismic channel gain of 18 dB and a sampling rate of 1 ms; the recording length was 5 s. The main acquisition parameters are shown in Table 1.

Table 1.
The 3D seismic exploration acquisition parameters for S-Q area.
4. Results
4.1. 3D Seismic Exploration for Shale Gas Reservoirs
The seismic records were severely affected by the poor conditions for seismic excitation and reception, due to the large number of exposed limestones and elevation differences in the surface terrain of the area. The implementation of techniques such as selecting physical points, optimizing observation systems and optimizing excitation and reception parameters ensured the quality of the 3D seismic acquisition data.
From the survey line profile, it can be seen that the underground structure of the study area is relatively flat, with obvious reflection characteristics of the Silurian Longmaxi Formation and the Upper Ordovician Wufeng Formation, and obvious wave group relationships. The internal reflection structure of both formations is parallel, with good continuity of the same phase records, indicating that the formations were in a stable and low-energy environment during their sedimentary period, as shown in Figure 6. After the well-to-seismic calibration, it is believed that the continuously weak parallel seismic reflection corresponds to the sedimentation of a lagoon (closed basin). In comparing the synthetic records and seismic records next to the well, the high-quality shale is located between the trough and peak (the top boundary is trough reflection, and the bottom is strong reflection). The main characteristics of each layer are as follows:
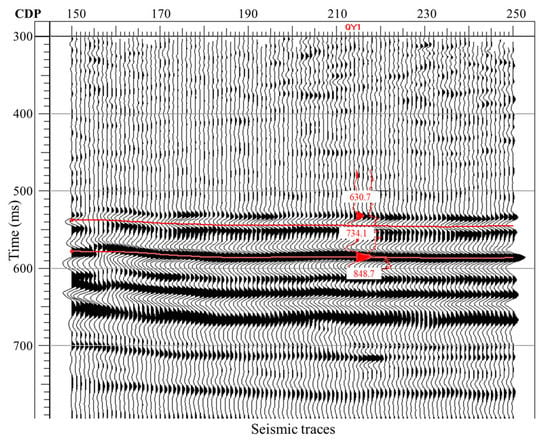
Figure 6.
Horizon calibration and sequence boundary tracking of shale gas reservoirs in S-Q area. CDP represents the different common depth points in the same survey line for 3D seismic exploration. The red lines represent the seismic records synthesized from logging data.
- (1)
- Lower Silurian Xiaoheba Formation (S1xh): thickness approximately 200 m; light yellow-grey and chartreuse silty hydromica shale and hydromica shale interbedded with different thicknesses, and local lenticular limestone and bands are occasionally found; the bottom is light gray medium-thick to thick-layered siltstone, and part of it is calcareous siltstone or calcareous fine-grained sandstone.
- (2)
- Lower Silurian Xintan Formation section 2 (S1x2): approximately 250 m thick; the grayish green and chartreuse silty hydromica shale is mainly mixed with hydromica shale, and the top and bottom are light gray medium-thick to thick bedded argillaceous siltstone.
- (3)
- The first section of the Lower Silurian Xintan Formation (S1x1): approximately 180 m thick; gray, green-gray hydromica shale, silty shale, mixed with gray medium-thick to thick bedded argillaceous siltstone. The local shale contains a small amount of carbon and integrates and contacts with the underlying strata.
- (4)
- Lower Silurian Longmaxi Formation (S1l): approximately 50 m thick; black carbonaceous silty hydromica shale, carbonaceous hydromica shale, with light yellow-gray thin to medium-thick bedded quartz siltstone in the middle and upper part. Contains a large number of graptolite fossils, and integrates and contacts with the underlying strata.
- (5)
- Upper Ordovician Wufeng Formation (O3w): approximately 10 m thick; black thin-layer carbonaceous siliceous shale, occasionally mixed with light gray thin-layered dolomitic limestone; integrates and contacts with the underlying strata.
- (6)
- Upper Ordovician Linxiang Formation (O3l): thickness of about 10 m; black medium-thick layered nodular argillaceous limestone; integrates and contacts with the underlying strata.
- (7)
- Middle Ordovician Baota Formation (O2b): gray to dark gray thin to medium-thick layered dry cracked limestone, occasionally mixed with mesoscale limestone.
4.2. Prediction of Shale Gas Reservoir Distribution with SPCNSI
SPCNSI was used to carry out special processing on the 3D seismic data collected in S-Q work area, in order to explore the horizontal and vertical distribution characteristics and reservoir thickness of shale gas reservoirs in the Longmaxi Formation and Wufeng Formation, and provided a basis for the deployment of shale gas horizontal wells and reservoir stimulation. The first division allows for an acceptable error between the seismic phase sequence boundaries and geological models due to the random inversion.
The distribution characteristics with SPCNSI of the shale gas reservoirs in this area are shown in Figure 7. The sequence interface corresponding to the 3D seismic profile is based on the comprehensive drilling, logging and logging data of the S-Q-2 well. Due to the fact that the S-Q area is a new exploration area, there are fewer wells data available for calibration, and the interval of the two wells is relatively short (only 200 m).
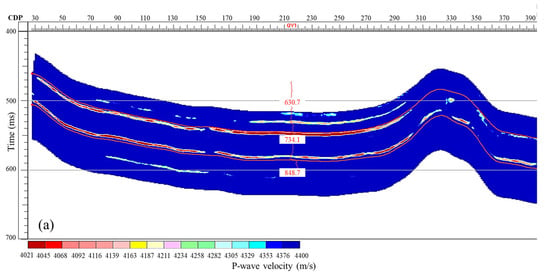
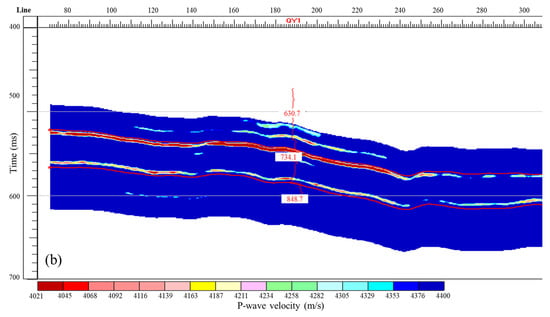
Figure 7.
Well logging constrained inversion of formation velocity profile. The “Line” represents the different survey line for 3D seismic exploration. Different color blocks represent different P–wave velocities and the red line is the GR logging data. (a), inversion results from the seismic “CDP” data; (b) inversion results from the seismic “Line” data.
In terms of the stratigraphic velocity profile, the boundaries of the shale gas reservoir less than 35 m can clearly be identified, and the reservoirs can be traced throughout the area (Figure 8); this reflects the spatial distribution characteristics of reservoirs in both the horizontal and vertical directions. The distribution range of shale reservoirs is wide, with the obvious low P-wave velocities (approximately 3500–4700 m/s). Combined with geological parameters such as the gas content, reservoir thickness and rock porosity in this area, the original oil in place of the shale gas in this area reached 210 × 108 m3.
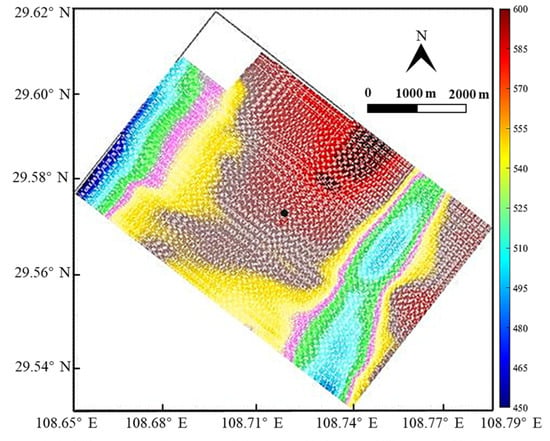
Figure 8.
Tracing of seismic sequence boundary on the top of the Longmaxi formation and at the bottom of the Wufeng formation. The black dot in the figure represents the location of the well S–Q–2.
The shale gas reservoir of the Longmaxi Formation is distributed stably in the whole area, with less thickness variation, as shown in Figure 9. The maximum thickness is about 18 m, and the minimum thickness is about 7 m. Reservoirs with a thickness greater than 15 m are mainly developed in the S-Q-2 well area and in the north of the area. Thicknesses of less than 9 m only appear locally. The reservoir of the Wufeng Formation is characterized by a stable distribution and wide range, with a maximum thickness of 12 m and an average thickness of about 7 m. Reservoirs with a thickness greater than 10 m are concentrated in the north of the study area, while thicknesses less than 4 m are mainly distributed near the faults. The inversion results are consistent with the logging interpretation of the shale gas reservoir on wells Q1 and Q2.
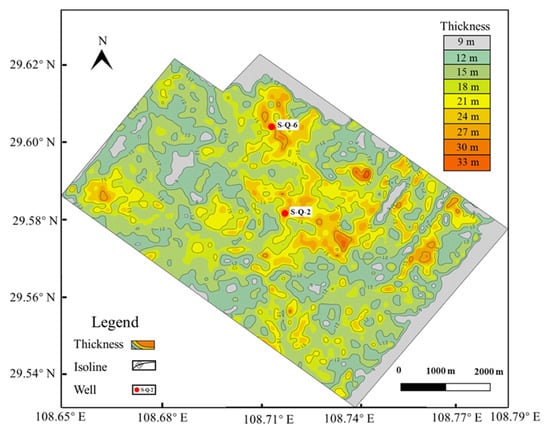
Figure 9.
Thickness prediction of high-quality shale gas reservoir in the Longmaxi Formation and Wufeng Formation.
In addition, the results of drilling, logging and gas content testing from the S-Q-6 well show that there are three shale gas reservoirs with a total thickness of 77.8 m in the Longmaxi Formation and Wufeng Formation in the north of the study area. The vertical depths are 730.4 m to 784 m, 786 m to 795 m and 801.3 m to 816.5 m. The shale gas reservoir with the best gas content is the Wufeng Formation (801.3–816.5 m), with a thickness of 15.2 m, an average total organic carbon (TOC) content of 3.8%, a porosity of about 4.1% and a gas content of 3.1 m3/t. After the reservoir stimulation, the daily gas production is 1.38 × 10⁴ m3 per day. The accuracy and reliability of this method w also verified in predictions of the marine thin shale gas reservoir.
5. Discussion
As for predicting the thin shale gas reservoir, the SPCNSI method solves for the minimum value between the seismic model and seismic record, with the constraints of stratigraphic sequence or seismic facies through iterative processes. It could effectively improve the vertical and longitudinal resolution. The method is suitable for the prediction of thin shale gas reservoirs in complex geological structures. However, the method needs a lot of data (i.e., logging, petrophysical and geology), as the inversion constraints condition differs from the acoustic impedance inversion and geostatistics-based stochastic inversion. It is limited for the new exploration area due to a lack of the necessary data. On the other hand, we only implemented SPCNSI programming with Microsoft Visual Studio C++ (version 2019, Microsoft Corporation, Redmond, WA, USA) [35], and the inversion results were imported into Landmark [36] software (version 2016, Halliburton Company, Odessa, TX, USA) for further reservoir analysis and interpretation. Unfortunately, we did not integrate these methods into a complete software package until now. However, we will address this problem in the next study.
In recent years, machine learning has become an effective method for understanding geophysics and geomorphic properties [37]. Due to its excellent ability to solve nonlinear problems, it has become a popular topic in seismic exploration. It has been widely developed to predict seismic attributes and formation structures [38,39,40,41]. Objectively, reservoir heterogeneity leads to multiple solutions and uncertainty in solving petroleum geological problems, and it is difficult to obtain “textbook” tag data for machine learning. Due to the strong specialty and particularity of oil E&D data, the general artificial intelligence (AI) algorithm cannot be used directly. However, AI technology will certainly provide new momentum for scientific breakthroughs in the whole industrial chain of oil and gas [42]. The multi-type unstructured data (i.e., logging, geology, seismology and petrophysics) could be applied to machine learning models for reservoir predictions of thin interbed shale gas.
6. Conclusions
Seismic phase-controlled nonlinear stochastic inversion (SPCNSI) can effectively improve the resolution of oil and gas reservoir predictions. In this research, we solved the difficulty of predicting thin layer shale gas reservoirs under marine sedimentation conditions. Three sets of reservoirs with a thickness of less than 20 m were identified, and can be traced throughout the study area. Two favorable areas for shale gas have been determined in the S-Q area, in terms of the inversion results. The horizontal and vertical distribution characteristics of the reservoir have been proven. The following understandings have been obtained:
- (1)
- The characteristics of low formation acoustic velocity in high-quality shale gas reservoirs is obviously in southeast Chongqing, in China.
- (2)
- The inversion results of SPCNSI can effectively improve the vertical resolution of seismic profiles, and can also identify thin reservoirs below 7 m in thickness.
- (3)
- The high-quality shale gas reservoirs (Longmaxi Formation and Wufeng Formation) are stably distributed in the study area, with little change in thickness. The average thickness of the Longmaxi Formation is about 12 m, and the reservoirs with a thickness greater than 10 m in the Wufeng Formation are concentrated in the north of the study area, with an average thickness of about 7 m.
- (4)
- Combined with drilling, logging and geology, the sequence and sedimentary phases from seismic profiles can be interactively calibrated, and the results of SPCNSI can accurately describe the sedimentary characteristics of thin interbeds of shale gas reservoirs.
Author Contributions
Conceptualization, Q.X.; methodology, Q.X. and X.H.; investigation, Q.X. and Y.W.; resources, X.G. and D.J.; data curation, X.H. and Q.H.; writing—original draft preparation, Q.X. and Q.H.; writing—review and editing, Q.X., Q.H. and X.H.; supervision, Q.X., Y.W. and B.W.; project administration, Q.X., Y.W. and Y.H. All authors have read and agreed to the published version of the manuscript.
Funding
We are grateful to be supported by the Key Project of Science and Technology Research program of Chongqing Education Commission of China (No. KJZD-K202203103), and the Chongqing Administration of Science and Technology (No. CSTB2022NSCQ-MSX1433).
Data Availability Statement
Unable to obtain data due to privacy restrictions.
Conflicts of Interest
The authors declare no conflict of interest.
References
- Li, Q.Z. On strategy of seismic restricted inversion. Oil Geophys. Prospect. 1998, 33, 423–438. [Google Scholar]
- Mou, Y.G.; Pei, Z.L. Seismic Numerical Simulation of 3D Complex Media; Petroleum Industry Press: Beijing, China, 2015. [Google Scholar]
- Pei, S.; Yin, X.Y.; Zong, Z.Y.; Li, K. High resolution fixed-point seismic inversion. Interpretation 2021, 9, 1–54. [Google Scholar] [CrossRef]
- Cheng, L.; Wang, S.X.; Wei, W.W.; Gao, H.Y.; Yu, Z.H.; Zhu, C.J.; Xiu, J.L. Structural geosteering constrained multi-trace sparse reflectivity inversion based on mixed norms. J. Appl. Geophys. 2020, 172, 103880. [Google Scholar] [CrossRef]
- Zheng, Y.; Liu, Y.S.; Xu, T.; Li, Z.Y. Elastic correlative least-squares reverse time migration based on wave mode decomposition. Processes 2022, 10, 288. [Google Scholar] [CrossRef]
- Dai, S.H.; Chen, Z.G.; Yu, J.B.; Xie, J.L.; Liu, Y.Q. Application of the fluid mobility attribute technique in the reservoir characterization of KG Oilfield, Algeria. Pet. Explor. Dev. 2010, 37, 573–578. [Google Scholar]
- Parra, J.O.; Hackert, C. Wave attenuation attributes as flow unit indicators. Lead. Edge 2002, 21, 564–572. [Google Scholar]
- Klimentos, T. Attenuation of P- and S-waves as a method of distinguishing gas and condensate from oil and water. Geophysics 1995, 60, 447–458. [Google Scholar] [CrossRef]
- Sui, S.L.; Tang, J.; Jiang, Y.B.; Jing, L.C. Technical characteristics and applicable conditions analysis on seismic inversion traditional methods. Pet. Geol. Recover. Effic. 2012, 19, 38–41. [Google Scholar]
- Trapp, M.; Nestorovic, T. Non-gradient full waveform inversion approaches for exploration during mechanized tunneling applied to surrogate laboratory measurements. Tunn. Undergr. Space Technol. 2022, 2, 120. [Google Scholar]
- Sun, S.M.; Peng, S.M. Inersion of geostatistics based on simulated annealing algorithm. Oil Geophys. Prospect. 2007, 42, 38–43. [Google Scholar]
- Dong, W.B.; Li, Y.G.; Gui, Z.X.; Zhou, L. Theory and application of geostatistical inversion: A facies-constrained MCMC algorithm. Processes 2023, 11, 1335. [Google Scholar] [CrossRef]
- Mohammed, M.A.; Snehamoy, C.; Roohollah, A. Stochastic inversion combining seismic data, facies properties, and advanced multiple-point geostatistics. J. Appl. Geophys. 2023, 213, 105026. [Google Scholar]
- Zhang, B. Application of probabilistic simulation technique for reservoir prediction in Taiyangdao-Kuihuadao area. Spec. Oil Gas Reserv. 2008, 15, 46–49. [Google Scholar]
- Li, Y.Q.; Huo, Z.Z.; Li, J.Y.; Chen, X.H.; Zhang, J.; Geng, W.H. Generalized impedance blocky inversion based on analytic solution to wave equation. Oil Geophys. Prospect. 2020, 55, 1073–1083. [Google Scholar]
- Li, H.X. A Seismic reservoir prediction based on OVT domain. Spec. Oil Gas Reserv. 2019, 26, 52–57. [Google Scholar]
- Zhang, J.; Li, J.G.; Chen, X.H.; Li, Y.Q. Geological structure-guided hybrid MCMC and Bayesian linearized inversion methodology. J. Pet. Sci. Eng. 2021, 199, 108296. [Google Scholar] [CrossRef]
- Yang, W.C. Nonlinear chaotic inversion of seismic traces: I. Theory and numerical experiments. ACTA Geophys. Sin. 1993, 36, 222–232. [Google Scholar]
- Yang, W.C. Nonlinear chaotic inversion of seismic traces: II. Lyapunov exponents and attractors. ACTA Geophys. Sin. 1993, 36, 376–387. [Google Scholar]
- Jiang, L.; Huang, H.D.; Wei, X.C.; He, Z.H. Non-linear constrained inversion of seismic data. Oil Geophys. Prospect. 2003, 38, 435–438. [Google Scholar]
- Huang, H.D.; Luo, Q.; Fu, Y.; Wang, B.H. Study and application of seismic phase-controlled non-linear random inversion. Oil Geophys. Prospect. 2007, 42, 694–698. [Google Scholar]
- Sambridge, M. Geophysical inversion with a neighbourhood algorithm—I. Searching a parameter space. Geophys. J. Int. 1999, 138, 479–494. [Google Scholar] [CrossRef]
- Sambridge, M. Geophysical inversion with a neighbourhood algorithm--II. Appraisng the ensemble. Geophys. J. Int. 1999, 138, 727–746. [Google Scholar] [CrossRef]
- Huang, H.D.; Cao, X.H.; Luo, Q. An application of seismic sedimentology in predicting organic reefs and banks: A case study on the Jiannan-Longjuba region of the eastern Sichuan fold belt. ACTA Pertrolei Sin. 2011, 32, 629–636. [Google Scholar]
- Zhao, W.P.; Fan, T.E.; Yang, L. Facies constrained stochastic optimization seismic inversion and application. Adv. Geosci. 2018, 8, 484–491. [Google Scholar]
- Fu, C. Application of seismic nonlinear random inversion to shale gas reservoir prediction in northwestern Hunan. Chin. J. Eng. Geophys. 2020, 17, 393–398. [Google Scholar]
- Guo, X.; Li, F.L.; Zhang, X.F.; Yin, X.B.; Wang, B. Application of seismic waveform facies-controlled inversion in the cretaceous thin reservoir prediction in Tiancao Sag. Spec. Oil Gas Reserv. 2019, 26, 38–43. [Google Scholar]
- Zhang, Z.W.; Wang, C.S.; Lin, Y.P.; Zhou, T.W.; Huang, H.D. Applications of facies-controlled nonlinear random inversion for carbonate reservoir prediction in Block A of Amu-darya Basin. Oil Geophys. Prospect. 2011, 46, 304–310. [Google Scholar]
- Cao, F.; Lu, Z.Q.; Liu, W.F. Facies-based Bayesian simultaneous inversion technology and its application: A case study of the north section of No.5 fault zone in Shunbei area, Tarim Basin, China. J. Nat. Gas Geosci. 2022, 7, 347–357. [Google Scholar]
- Gao, J.; Huang, H.D.; Ji, M.; Yuan, S.Q. Seismic phase-controlled nonlinear inversion of a carbonate reservoir. Geophys. Prospect. Pet. 2020, 59, 396–403. [Google Scholar]
- Wang, D.K.; Lu, Y.Y.; Li, L.H.; Lin, L.M.; Shi, H.; Du, J.; Xie, Y.G. Prediction of tight sandstone reservoirs in marine coal strata based on seismic facies controlled inversion. Sci. Technol. Eng. 2020, 20, 12349–12354. [Google Scholar]
- He, X.P.; He, G.S.; Gao, Y.Q.; Zhang, P.X.; Lu, S.F.; Wan, J.Y. Geological characteristics and enrichment laws of normal-pressure shale gas in the basin-margin transition zone of SE Chongqing. Nat. Gas Ind. 2018, 38, 333–346. [Google Scholar]
- Cooke, D.A.; Schneider, W.A. Generalized linear inversion of reflection seismic data. Geophysics 1983, 48, 665. [Google Scholar] [CrossRef]
- Li, S. Study on Seismic Inversion Method of Complex Reservoir-Taking Jiyang Depression as an Example. Ph. D. Thesis, China University of Petroleum, Beijing, China, 2020. [Google Scholar]
- Microsoft Corporation. Microsoft Visual Studio C++. Available online: https://learn.microsoft.com/zh-cn/cpp/overview/visual-cpp-in-visual-studio (accessed on 15 March 2020).
- American Halliburton Company. Landmark. Available online: https://www.halliburton.com/en/software (accessed on 18 July 2021).
- Jamali, A.A.; Zarekia, S.; Randhir, T.O. Risk assessment of sand dune disaster in relation to geomorphic properties and vulnerability in the Saduq-Yazd Erg. Appl. Ecol. Environ. Res. 2018, 16, 579–590. [Google Scholar] [CrossRef]
- Gao, Z.Q.; Yang, W.; Tian, Y.J.; Li, C.; Jiang, X.D.; Gao, J.H.; Xu, Z.B. Global optimization with deep-learning-based acceleration surrogate for large-scale seismic acoustic-impedance inversion. Geophysics 2022, 87, R35–R51. [Google Scholar] [CrossRef]
- Yan, X.S.; Zhang, M.Z.; Wu, Q.H. Big-data-driven pre-stack seismic intelligent inversion. Inf. Sci. 2021, 549, 34–52. [Google Scholar] [CrossRef]
- Wang, Z.T.; Shen, G.Q.; Wang, Y.M.; Meng, X.J. Model driven high-precision prestack seismic inversion. Geophys. Prospect. Pet. 2020, 59, 927–935. [Google Scholar]
- Ajah, N.J.; Dosunmu, A.; Akaolisa, C.Z.; Dagogo, T. Analysis of elastic geomechanical properties derived from well Log and seismic data, using artificial intelligence (ANN): A case study of “AJAH” field offshore Niger Delta. J. Appl. Geol. Geophys. 2020, 8, 19–27. [Google Scholar]
- Kuang, L.C.; Liu, H.; Ren, Y.L.; Luo, K.; Shi, M.Y.; Su, J.; Li, X. Application and development trend of artificial intelligence in petroleum exploration and development. Pet. Explor. Dev. 2021, 48, 1–14. [Google Scholar] [CrossRef]
Disclaimer/Publisher’s Note: The statements, opinions and data contained in all publications are solely those of the individual author(s) and contributor(s) and not of MDPI and/or the editor(s). MDPI and/or the editor(s) disclaim responsibility for any injury to people or property resulting from any ideas, methods, instructions or products referred to in the content. |
© 2023 by the authors. Licensee MDPI, Basel, Switzerland. This article is an open access article distributed under the terms and conditions of the Creative Commons Attribution (CC BY) license (https://creativecommons.org/licenses/by/4.0/).